
List of Documents Reference Document · v4g&bvm=bv.53899372,d.d2k PD RWE Planning and Energy Policy...
60
Reference Document Planning and Energy Policy Context (Chapter 4) Where a hard copy is not supplied please note the relevant web address File 1 of 10 PD RWE Planning and Energy Policy Context 001 DECC NPS for Energy EN-1, 2008 PD RWE Planning and Energy Policy Context 002 DECC NPS for Renewable Energy Infrastructure EN-3, 2011 PD RWE Planning and Energy Policy Context 003 and 004 have been removed PD RWE Planning and Energy Policy Context 005 WELSH GOVERNMENT.2012.Planning Policy Wales Edition 5 http://wales.gov.uk/docs/desh/publications/121107ppwedition5 en.pdf PD RWE Planning and Energy Policy Context 006 WELSH ASSEMBLY GOVERNMENT.2005.Technical Advice Note 8: Renewable Energy http://wales.gov.uk/docs/desh/publications/050701techical- advice-note-8-en.pdf PD RWE Planning and Energy Policy Context 007 WELSH ASSEMBLY GOVERNMENT.2009.Technical Advice 12: Design http://wales.gov.uk/docs/desh/publications/090807tan12en.pdf PD RWE Planning and Energy Policy Context 008 UNITED NATIONS.1992. United Nations Framework Convention on Climate Change http://unfccc.int/resource/docs/convkp/conveng.pdf PD RWE Planning and Energy Policy Context 009 UNITED NATIONS. 1998. Kyoto Protocol- United Nations Framework Convention on Climate Change http://unfccc.int/resource/docs/convkp/kpeng.pdf PD RWE Planning and Energy Policy Context 010 UNITED NATIONS. 2009. Copenhagen Accord -United Nations Framework Convention on Climate Change http://unfccc.int/files/meetings/cop 15/application/pdf/cop15 c ph auv.pdf PD RWE Planning and Energy Policy Context 011 UNITED NATIONS.2011. Durban United Nations Framework Convention on Climate Change PART 1 and PART 2 : http://unfccc.int/resource/docs/2011/cop17/eng/09.pdf http://unfccc.int/resource/docs/2011/cop17/eng/09a01.pdf PD RWE Planning and Energy Policy Context 012 UNITED NATIONS. 2012. Doha -United Nations Framework Convention on Climate Change PART 1 and PART 2: http://unfccc.int/resource/docs/2012/cop18/eng/08.pdf List of Documents
Transcript of List of Documents Reference Document · v4g&bvm=bv.53899372,d.d2k PD RWE Planning and Energy Policy...

Reference
Document
Planning and Energy Policy Context (Chapter 4) Where a hard copy is not supplied please note the relevant web address
File 1 of 10 PD RWE Planning and Energy Policy Context 001 DECC NPS for Energy EN-1, 2008 PD RWE Planning and Energy Policy Context 002 DECC NPS for Renewable Energy Infrastructure EN-3, 2011
PD RWE Planning and Energy Policy Context 003 and 004 have been removed
PD RWE Planning and Energy Policy Context 005
WELSH GOVERNMENT.2012.Planning Policy Wales Edition 5 http://wales.gov.uk/docs/desh/publications/121107ppwedition5en.pdf
PD RWE Planning and Energy Policy Context 006
WELSH ASSEMBLY GOVERNMENT.2005.Technical Advice Note 8: Renewable Energy http://wales.gov.uk/docs/desh/publications/050701techical-advice-note-8-en.pdf
PD RWE Planning and Energy Policy Context 007
WELSH ASSEMBLY GOVERNMENT.2009.Technical Advice 12: Design http://wales.gov.uk/docs/desh/publications/090807tan12en.pdf
PD RWE Planning and Energy Policy Context 008
UNITED NATIONS.1992. United Nations Framework Convention on Climate Change http://unfccc.int/resource/docs/convkp/conveng.pdf
PD RWE Planning and Energy Policy Context 009
UNITED NATIONS. 1998. Kyoto Protocol- United Nations Framework Convention on Climate Change http://unfccc.int/resource/docs/convkp/kpeng.pdf
PD RWE Planning and Energy Policy Context 010
UNITED NATIONS. 2009. Copenhagen Accord -United Nations Framework Convention on Climate Change http://unfccc.int/files/meetings/cop 15/application/pdf/cop15 cph auv.pdf
PD RWE Planning and Energy Policy Context 011
UNITED NATIONS.2011. Durban United Nations Framework Convention on Climate Change PART 1 and PART 2 : http://unfccc.int/resource/docs/2011/cop17/eng/09.pdf http://unfccc.int/resource/docs/2011/cop17/eng/09a01.pdf
PD RWE Planning and Energy Policy Context 012
UNITED NATIONS. 2012. Doha -United Nations Framework Convention on Climate Change PART 1 and PART 2: http://unfccc.int/resource/docs/2012/cop18/eng/08.pdf
List of Documents
http://unfccc.int/resource/docs/2012/cop18/eng/08a01.pdf
PD RWE Planning and Energy Policy Context 013
THE EUROPEAN PARLIAMENT AND THE COUNCIL.2003. Emissions Trading Scheme Directive http://eur-lex.europa.eu/LexUriServ/LexUriServ.do?uri=CONSLEG:2003L0087:20090625:EN:PDF
PD RWE Planning and Energy Policy Context 014
THE EUROPEAN PARLIAMENT AND THE COUNCIL.2009 .Directive 2009/28/EC on the promotion of the use of energy from renewable sources http://eur-lex.europa.eu/LexUriServ/LexUriServ.do?uri=Oj:L:2009:140:0016:0062:en:PDF
PD RWE Planning and Energy Policy Context 015
THE EUROPEAN PARLIAMENT AND THE COUNCIL.2009.Decision No 406/2009/EC of the European Parliament and of the Council on the effort of Member States to reduce their greenhouse gas emissions to meet the Community’s greenhouse gas emission reduction commitments up to 2020 http://eur-lex.europa.eu/LexUriServ/LexUriServ.do?uri=OJ:L:2009:140:0136:0148:EN:PDF
PD RWE Planning and Energy Policy Context 016
DECC. 2013.Renewables Obligation Order 2009 as amended by the Renewables Obligation (Amendment) Order 2013 https://www.gov.uk/government/uploads/system/uploads/attachment data/file/211262/ro amendment order 2013.pdf
PD RWE Planning and Energy Policy Context 017
HMSO. 2008. Climate Change Act 2008 http://www.legislation.gov.uk/ukpga/2008/27/pdfs/ukpga 20080027 en.pdf
PD RWE Planning and Energy Policy Context 018
HM GOVERNMENT.2009. The UK Renewable Energy Strategy 2009 http://www.official-documents.gov.uk/document/cm76/7686/7686.pdf
PD RWE Planning and Energy Policy Context 019
HM GOVERNEMNT.2009. The UK Low Carbon Transition Plan 2009 http://www.official-documents.gov.uk/document/other/9780108508394/9780108508394.pdf
PD RWE Planning and Energy Policy Context 020
EUROPEAN COMMISSION .2010. National Renewable Energy Action Plan for the United Kingdom Article 4 of the Renewable Energy Directive2009/28/EC http://ec.europa.eu/energy/renewables/action plan en.htm
PD RWE Planning and Energy Policy Context 021
HM GOVERNMENT .2011. The Carbon Plan: delivering our low carbon future, 2011 https://www.gov.uk/government/uploads/system/uploads/attachment data/file/47613/3702-the-carbon-plan-delivering-our-

low-carbon-future.pdf
PD RWE Planning and Energy Policy Context 022
HMSO. 2011. The Promotion of the Use of Energy from Renewable Sources Regulations, 2011 http://www.legislation.gov.uk/uksi/2011/243/pdfs/uksi_20110243 en.pdf
PD RWE Planning and Energy Policy Context 023
DECC.2011. UK Renewable Energy Roadmap 2011 https://www.gov.uk/government/uploads/system/uploads/attachment data/file/48128/2167-uk-renewable-energy-roadmap.pdf
PD RWE Planning and Energy Policy Context 024
DECC 2012. UK Renewable Energy Roadmap Update 2012 https://www.gov.uk/government/uploads/system/uploads/attachment data/file/80246/11-02-13 UK Renewable Energy Roadmap Update FINAL DRAFT.pdf
PD RWE Planning and Energy Policy Context 025
DECC.2013. Energy Bill 004 2013-2014 http://services.parliament.uk/bills/2013-14/energy/documents.html
PD RWE Planning and Energy Policy Context 026
WELSH GOVERNMENT. 2006. The Government of Wales Act 2006 http://www.legislation.gov.uk/ukpga/2006/32/pdfs/ukpga 20060032 en.pdf
PD RWE Planning and Energy Policy Context 027
WELSH ASSEMBLY GOVERNMENT. 2009. One Wales: One Planet The Sustainable Development Scheme of the Welsh Assembly Government http://wales.gov.uk/docs/desh/publications/090521susdev1wales1planeten.pdf
PD RWE Planning and Energy Policy Context 028
WELSH ASSEMBLY GOVERNMENT. 2008.The Renewable Energy Route Map for Wales 2008 http://www.caerphilly.gov.uk/pdf/Environment Planning/LDP-Examination-Documents/W55-Renewable-Energy-Route-Map-for-Wales.pdf
PD RWE Planning and Energy Policy Context 029
WELSH ASSEMBLY GOVERNMENT .2010. A Low Carbon Revolution: Energy Policy Statement 2010 http://www.google.co.uk/url?sa=t&rct=j&q=&esrc=s&frm=1&source=web&cd=2&ved=0CDUQFjAB&url=http%3A%2F%2Fwww.swea.co.uk%2Findex.php%3Foption%3Dcom k2%26Itemid%3D256%26id%3D40 fe4605b97e9ccdd26fe5f6b49b52f0b9%26lang%3Den%26task%3Ddownload%26view%3Ditem&ei=cWJdUuGUBIrM0AXehoCoBg&usg=AFQjCNGuhirQo619L1pYXPVfpTAjxiDv4g&bvm=bv.53899372,d.d2k
PD RWE Planning and Energy Policy Context 030
WELSH ASSEMBLY GOVERNMENT.2010. Economic Revival: a new direction 2010 http://wales.gov.uk/docs/det/report/100705anewdirectionen.pdf
PD RWE Planning and Energy Policy Context 031
WELSH ASSEMBLY GOVERNMENT.2010.Climate Change Strategy for Wales 2010 http://wales.gov.uk/docs/desh/publications/101006ccstratfinalen.pdf

PD RWE Planning and Energy Policy Context 032
WELSH GOVERNMENT.2012. Energy Wales: a low carbon transition 2012 http://wales.gov.uk/docs/desh/publications/120314energywalesen.pdf
PD RWE Planning and Energy Policy Context 033
DENBIGHSHIRE COUNTY COUNCIL.2013. Denbighshire Local Development Plan (Adopted June 2013) http://denbighddms.wisshost.net/webfiles/Adoption/Adopted%20LDP%20text%20english.pdf
PD RWE Planning and Energy Policy Context 034
CONWY COUNTY BOROUGH COUNCIL .2013. Conwy Deposit Local Development Plan 2007-2022 (Revised edition 2011) Composite LDP as amended by the Inspectors Binding Report October 2013 http://www.conwy.gov.uk/upload/public/attachments/570/Composite as amended by Inspectors Changes.pdf
PD RWE Planning and Energy Policy Context 035
Infrastructure Planning Commission Written evidence of the Infrastructure Planning Commission to the House of Commons Energy and Climate Change Committee, 2011
PD RWE Planning and Energy Policy Context 036 Gillespies, North Wales Wind Farm Connections, 2013 PD RWE Planning and Energy Policy Context 037
Centre for Sustainable Energy, Common Concerns about Wind Power 2011
PD RWE Planning and Energy Policy Context 038 Renewables Obligation annual report 2011-12 PD RWE Planning and Energy Policy Context 039
http://wales.gov.uk/about/foi/responses/dl2013/janmar/health1/6dlhlth211/?lang=en
PD RWE Planning and Energy Policy Context 040
https://restats.decc.gov.uk/cms/welcome-to-the-restats-web-site/
PD RWE Planning and Energy Policy Context 041
https://www.gov.uk/government/policies/increasing-the-use-of-low-carbon-technologies
PD RWE Planning and Energy Policy Context 042
Brechfa Forest West Wind Farm Examining Authority’s Report of Findings and Conclusions
PD RWE Planning and Energy Policy Context 043 Denbighshire County Council Unitary Development Plan (2002)* PD RWE Planning and Energy Policy Context 044 Clwyd Structure Plan Second Alteration (Conway version) 1999* PD RWE Planning and Energy Policy Context 045
Technical Advice Note (TAN) 8 Database – Review of Wind Farm Development
PD RWE Planning and Energy Policy Context 046
The Brechfa Forest West Wind Farm Development Consent Order 2013
PD RWE Planning and Energy Policy Context
“Wind Turbine Amplitude Modulation: Research to Improve

047 Understanding as to its Cause and Effect (December 2013)” PD RWE Planning and Energy Policy Context 048
“Template Planning Condition on Amplitude Modulation: Noise Guidance Notes (December 2013)”
PD RWE Planning and Energy Policy Context 049
“The Development of a Penalty Scheme for Amplitude Modulated Wind Farm Noise: Description and Justification (December 2013)”
PD RWE Planning and Energy Policy Context 050
“Investigation of the ‘Den Brook’ Amplitude Modulation Methodology for Wind Turbine Noise” (Version 2, 11 November 2011)
PD RWE Planning and Energy Policy Context 051
Countryside Council for Wales letter dated 22 January 2013 re: Clocaenog Windfarm – Further Comments on OHMP, Peat Report and HRA Assessment.
Landscape and Visual (Chapter 5) PD RWE Landscape and Visual 001 National Park Development Plan and Management Plan PD RWE Landscape and Visual 002 AONB Management Plan PD RWE Landscape and Visual 003 AONB Management Plan Interim Statement PD RWE Landscape and Visual 004 AONB Sustainable Tourism Strategy and Action Plan* PD RWE Landscape and Visual 005
Tranquil Area Mapping GLVIA 2 and 3 *
PD RWE Landscape and Visual 006
Land North of Burnthouse Farm, Appeal Decision APP/D0515/A/2123739. 6th July 2011
PD RWE Landscape and Visual 007
ASH Consulting Group (1995) Tranquil Areas – England Map, for Council for the Protection of Rural England, and the Countryside Commission
PD RWE Landscape and Visual 008
ASH Consulting Group (1997) Tranquil Areas Wales – A report to the Countryside Council for Wales.
PD RWE Landscape and Visual 009
MacFarlane, R., Haggett, C., Fuller, D (2005) Mapping Tranquillity – Defining and assessing a valuable resource, Report to CPRE, Centre for Environmental & Spatial Analysis, and Participatory Evaluation and Appraisal in Newcastle upon Tyne (PEANuT), both at Northumbria University and The Landscape Research Group, University of Newcastle.
PD RWE Landscape and Visual 010
Jackson, S., Fuller, D., Dunsford, H., Mowbray, R., Hext, S., MacFarlane R. and Haggett, C (2008) Tranquillity Mapping: developing a robust methodology for planning support, Report to the CPRE, Centre for Environmental & Spatial Analysis, Northumbria University, Bluespace environments and the University of Newcastle upon on Tyne.
PD RWE Landscape and Visual 011
Land Use Consultants (2007) Developing an Intrusion Map of England. Report prepared for Campaign to Protect Rural England.

PD RWE Landscape and Visual 012
Ove Arup (2005-2007) TAN 8: Annex D Local Refinement Studies (SSA A to G)
PD RWE Landscape and Visual 013
Ove Arup and Partners (2010) Research: Strategic Search Area (SSA) Reassessment and Validation. Report to Welsh Assembly Government.
File 1A of 10 Archaeology and Cultural Heritage (Chapter 6) PD RWE Archaeology and Cultural Heritage 001
A Standard and Guidance for historic environment desk-based assessment
PD RWE Archaeology and Cultural Heritage 002
DMRB section for cultural heritage assessments DMRB Vol. 11 Section 3 Part 2, Annexes 5 and 6.
PD RWE Archaeology and Cultural Heritage 003
ASIDOHL2 Guide to Best Practice
PD RWE Archaeology and Cultural Heritage 004 Colcutt (1999) The Setting of Cultural Heritage Features PD RWE Archaeology and Cultural Heritage 005 English Heritage, Wind Energy and The Historic Environment PD RWE Archaeology and Cultural Heritage 006 Forestry Commission Scotland, Identifying Heritage in forestry PD RWE Archaeology and Cultural Heritage 007 The Forestry Commission, Forests and Archaeology PD RWE Archaeology and Cultural Heritage 008 Forestry Commission, Forestry and Historic Environment PD RWE Archaeology and Cultural Heritage 009
Forestry Commission Managing the Historic Environment in Woodland
PD RWE Archaeology and Cultural Heritage 010 Welsh Office Circular 60/96 Planning and Historic Environment PD RWE Archaeology and Cultural Heritage 011
Welsh Office Circular 61/96 Planning and Historic Environment: Historic Buildings and Conservation Areas
PD RWE Archaeology and Cultural Heritage 012
UKWAS, 1998; Woodland Assurance Standard, Second Edition (Amended November 2008), Moriarti Design & Marketing Edinburgh
PD RWE Archaeology and Cultural Heritage 013
http://data.gov.uk/dataset/the-registered-landscapes-of-oustanding-historic-interest-in-wales-registered-landscapes-of-spe
File 2 of 10 Land Use Access and Forestry (Chapter 7) PD RWE Land Use Access and Forestry
Miller, K.F. (1985) Windthrow Hazard Classification, Forestry Commission Leaflet 85, HMSO, London. and Quine, C. Coutts, M.

001 Gardiner, B. & Pyatt, G. (1995). Forests and Wind: Management to Minimise Damage, Forestry Commission Bulletin 114, HMSO, London.*
PD RWE Land Use Access and Forestry 002
Welsh Government. (2009). Woodlands for Wales, The Welsh Assembly Governments Strategy for Woodlands & Trees, Forestry Commission Wales.
PD RWE Land Use Access and Forestry 003 ODPM, PPS 22 Companion Guide PD RWE Land Use Access and Forestry 004 BMG Research, Quality of Visitor Experience Survey: Cloclaenog PD RWE Land Use Access and Forestry 005
Welsh Office et al. Geometric Design for Major/Minor Priority Junctions
PD RWE Land Use Access and Forestry 006 The British Horse Society Advisory Note No. 20 PD RWE Land Use Access and Forestry 007 Whitelee Countryside Ranger Service, Riding in Lanarkshire PD RWE Land Use Access and Forestry 008
Forestry Commission, The Government's Approach to Sustainable Forestry, 2011
PD RWE Land Use Access and Forestry 009 Forestry Commission, Forests and Water, 2011 PD RWE Land Use Access and Forestry 010
Forestry Commission Wales policy position on development affecting woodlands, Version 1, 2010.
PD RWE Land Use Access and Forestry 011
Health & Safety Executive, (2003). Managing Health & Safety in Forestry, HSE Books, Suffolk
PD RWE Land Use Access and Forestry 012
UKWAS, 1998; Woodland Assurance Standard, Second Edition (Amended November 2008), Moriarti Design & Marketing, Edinburgh
PD RWE Land Use Access and Forestry 013
Jones, H. & Pritchard, J. (2010). Harvesting Resource Strategy for the Assembly Government’s Woodland Estate – Executive Summary. Forestry Commission Wales.
PD RWE Land Use Access and Forestry 014
Health & Safety Executive, (2003). Arboriculture & Forestry Advisory Group Safety Guides Nr 102 to 805, HSE Books, Suffolk.
PD RWE Land Use Access and Forestry 015
British Horse Society, Advice on Wind Farms, 2013
Hydrology and Geology (Chapter 8) Where a hard copy is not supplied please note the relevant web address
PD RWE Hydrology and Geology 001
Planning Policy Wales: Technical Advice Note 15 (TAN15)–Development and Flood Risk (Welsh Assembly Government 2004);
PD RWE Hydrology and Geology 002
EA Pollution Prevention Guidance Notes (PPG)

PD RWE Hydrology and Geology 003
C532 Control of water pollution from construction sites (2001)*
PD RWE Hydrology and Geology 004
C650 Environmental good practice on site (2005)*
PD RWE Hydrology and Geology 005
EA, Groundwater protection: policy and practice (GP3)(2008);
File 3 of 10 PD RWE Hydrology and Geology 006
Forest and Water. UK Forestry Standard Guidelines (Forestry Commission, 2011)
PD RWE Hydrology and Geology 007
DEFRA Good practice guide for handling soils (MAFF 2000); and
PD RWE Hydrology and Geology 008
DEFRA draft Code of Practice for the sustainable use of soils on construction sites.
PD RWE Hydrology and Geology 009
Directive 2006/11/EC on pollution caused by certain dangerous substances discharge into the aquatic environment of the Community (Codified version) http://eur-lex.europa.eu/LexUriServ/LexUriServ.do?uri=OJ:L:2006:064:0052:0059:EN:PDF
PD RWE Hydrology and Geology 010
Urban Waste Water Treatment Directive (91/271/EEC) http://eur-lex.europa.eu/LexUriServ/LexUriServ.do?uri=OJ:L:1991:135:0040:0052:EN:PDF Urban Waste Water Treatment Regulations, 1994 http://www.legislation.gov.uk/uksi/1994/2841/made
PD RWE Hydrology and Geology 011
The Environment Act 1995 http://www.legislation.gov.uk/ukpga/1995/25/contents Water Resources Act 1991 http://www.legislation.gov.uk/ukpga/1991/57/contents Land Drainage Act 1991 http://www.legislation.gov.uk/ukpga/1991/59/contents
PD RWE Hydrology and Geology 012
The Freshwater Fish Directive (78/659/EEC) http://eur-lex.europa.eu/LexUriServ/site/en/consleg/1978/L/01978L0659-20030605-en.pdf Surface Waters (Fishlife) (Classification) (Amendment) Regulations, 2003 http://www.legislation.gov.uk/uksi/2003/1053/made
PD RWE Hydrology and Geology 013
The Groundwater Directive (80/68/EEC) http://eur-lex.europa.eu/LexUriServ/LexUriServ.do?uri=CELEX:31980L0068:EN:HTML The Groundwater Regulations, 1998
http://www.legislation.gov.uk/uksi/1998/2746/contents/made
PD RWE Hydrology and Geology 014
The Floods Directive (2007/60EC) http://eur-lex.europa.eu/LexUriServ/LexUriServ.do?uri=OJ:L:2007:288:0027:0034:en:pdf
PD RWE Hydrology and Geology 015
The Civil Contingencies Act, 2004 http://www.legislation.gov.uk/ukpga/2004/36/contents Climate Change Act 2008 http://www.legislation.gov.uk/ukpga/2008/27/contents
PD RWE Hydrology and Geology 016
Denbighshire County Council Unitary Development Plan (2002) *
PD RWE Hydrology and Geology 017
http://conwy.leadpartners.co.uk/docs.asp?doc=clwyd&sec=clwyd
PD RWE Hydrology and Geology 018
The Water Framework Directive (WFD, 2000/60/EC) http://eur-lex.europa.eu/LexUriServ/LexUriServ.do?uri=OJ:L:2000:327:0001:0072:EN:PDF
PD RWE Hydrology and Geology 020
PPG01 General guide to the prevention of water pollution.
PD RWE Hydrology and Geology 021
PPG05: Works and maintenance in or near water.
PD RWE Hydrology and Geology 022
PPG06: Working at construction and demolition sites.
PD RWE Hydrology and Geology 023
PPG20: Dewatering underground ducts and chambers.
PD RWE Hydrology and Geology 024 PPG21: Pollution incident response planning
PD RWE Hydrology and Geology 025
EQS - Environmental Quality Standard, as laid down in relevant EU Directives and national legislation http://eur-lex.europa.eu/LexUriServ/LexUriServ.do?uri=OJ:L:2008:348:0084:0097:EN:PDF
PD RWE Hydrology and Geology 026
Environment Agency (2009). River Basin Management Plan: Western Wales River Basin District
PD RWE Hydrology and Geology 027
Environment Agency (2009). River Basin Management Plan: Dee River Basin District
PD RWE Hydrology and Geology 028
Welsh Water (2008). Water Resources Management Plan Strategic Environmental Assessment: Environmental Report. Conducted by Hyder Consulting, February 2008
File 4 of 10 PD RWE Hydrology and Geology 029
Welsh water (2008, updated January 2009). Draft Water Resources Management Plan: Main Report. March 2008
PD RWE Hydrology and Geology 030 Environment Agency (2005). Clwyd CAMS* PD RWE Hydrology and Maitland PS et al (1990). Focus on Nature Conservation

Geology 031 No.23: The impact of afforestation and forestry practice on freshwater habitats. Nature Conservancy Council and McCulloch J and Robinson M (1993). History of Forest Hydrology. Journal of Hydrology, Vol 150*
PD RWE Hydrology and Geology 032
UK Forestry Standard Guidelines – Forests and Climate Change
PD RWE Hydrology and Geology 033
Forestry Commission (2011). The UK Forestry Standard: The Government’s Approach to Sustainable Forestry
PD RWE Hydrology and Geology 034 Forestry Commission: Forests and Water Guidelines
PD RWE Hydrology and Geology 035
Caissie D, Jolicoeur S, Bouchard M and Poncet E (2002). Comparison of streamflow between pre and post timber harvesting in Catamaran Brook, Canada. Journal of Hydrology, Vol 258*
PD RWE Hydrology and Geology 036
Piling and Penetrative Ground Improvement Methods on Land Affected by contamination: Guidance on Pollution Prevention (EA, 2001)
PD RWE Hydrology and Geology 037
CCW Guidance Note, Assessing the impact of windfarm developments on peatlands in Wales, 2010
PD RWE Hydrology and Geology 038
Nayak et al. calculating Carbon Savings from wind farms on Scottish Peat lands, a new approach, 2008
PD RWE Hydrology and Geology 039
Nayak et al., Calculating Potential Carbon Losses & Savings from Wind Farms on Scottish Peatlands
PD RWE Hydrology and Geology 040
Smith et al., Carbon Implications of Wind Farms Located on Peatlands, 2011
PD RWE Hydrology and Geology 041
Brainard et al., Carbon Sequestration Benefits of Woodland, 2003
PD RWE Hydrology and Geology 042
Roderick et al., Carbon sequestration in the trees, products and soils of forest plantations: an analysis using UK examples, 1991
Non Avian Ecology (Chapter 9)
PD RWE Non Avian Ecology 001
IEEM (2006) Guidelines for Ecological Impact Assessment in the UK, produced by the Institute of Ecology and Environmental Management.
PD RWE Non Avian Ecology 002 Forestry Commission Forests and Water Guidelines (2011)
File 5 of 10 PD RWE Non Avian Ecology 003
The UK Forestry Standard: the governments approach to sustainable forestry management (2011)
PD RWE Non Avian Ecology 004
JNCC (2010) Handbook for Phase 1 Habitat Survey: a technique for environmental audit. Rodwell, J.S. (Ed) (1991 & 1992) British Plant Communities. Cambridge University Press *
PD RWE Non Avian Ecology 005
English Nature (2001) Great Crested Newt Mitigation Guidelines. Version: August 2001 English Nature, Peterborough
PD RWE Non Avian Ecology 006
Oldham et al (2000) Evaluating the Suitability of Habitat for the Great Crested Newt (Triturus cristatus), The Ecological Journal, Vol 10, pages 143-155
PD RWE Non Avian Ecology 007
Strachan R. and Moorhouse T. (2006). Water Vole Conservation Handbook: Second Edition. Wildlife Conservation Research Unit. Oxon.
PD RWE Non Avian Ecology 008 Walsh, J. (2001) Clocaenog Forest: water vole survey
PD RWE Non Avian Ecology 009
Chanin and Smith 2003. Monitoring the otter Lutra lutra. Conserving Natura 2000 Rivers Monitoring Series No 10. Peterborough, English Nature.
PD RWE Non Avian Ecology 010
Forestry Commission Wales (2010) Woodland Management in the presence of otter: Guidance for compliance with the Habitat Regulations
PD RWE Non Avian Ecology 011
Harris S., Cresswell P. and Jefferies D. (1991) Surveying for Badgers, Mammal Society Occasional Publication No 9
PD RWE Non Avian Ecology 012
Forestry Commission (1995) Forestry Practice Guide 9: Forest Operations and Badger Setts
PD RWE Non Avian Ecology 013
Bright et al (2006) The Dormouse Conservation Handbook, Second Edition, English Nature.
PD RWE Non Avian Ecology 014
Forestry Commission (2010) Woodland Management in the presence of the dormouse: Guidance for compliance with the Habitats Regulations.
PD RWE Non Avian Ecology 015
Forestry Commission Wales (2010) Application for a European Protected Species Licence: Dormouse. Method Statement – Forestry or Woodland Harvesting Operations (excluding coppice)
PD RWE Non Avian Ecology 016
Bat Conservation Trust, (2007) Bat Surveys - Good Practice Guidelines. Bat Conservation Trust, London.
PD RWE Non Avian Ecology 017
The Forestry Commission for England and Wales (2005) Woodland Management for Bats
PD RWE Non Avian Ecology 018
Natural England Technical Advice Note TIN051 Bats and onshore wind turbines Interim Guidance (Feb 2012)
PD RWE Non Avian Ecology 019
Forestry Commission Wales (2010) Woodland Management in the presence of bat species: Guidance for compliance with the Habitat Regulations
PD RWE Non Avian Ecology 020
Baerwald et al. 2008. Barotrauma is a significant cause of bat fatalities at wind turbines. Current Biology 18:695-696
PD RWE Non Avian Ecology 021
Cartmel, S. 2008. Understanding the distribution of red squirrels in Clocaenog Forest. CCW Contract Science Report No: 854, 11 pp, CCW.
PD RWE Non Avian Ecology 022
Gurnell, J., Rushton, S.P., Lurz, P. W. W., Cartmel, S. Shirley, M. D. F. 2002. Modelling the effects of forest composition and management on red squirrels in Clocaenog Forest North Wales. CCW Contract Science Report no. 853
PD RWE Non Avian Ecology 023
Forestry Commission for Wales and Countryside Council for Wales First Draft - Managing Clocaenog Forest for red squirrels, Research Contract Technical Specification RQ08B007, FC 73-01-614 (unpublished)
PD RWE Non Avian Ecology 024
Figure taken from Gurnell et al. (2002); however it should be noted that since this figure was derived (in 1998), the Forestry Development Plan has changed – pers comm. CCW (2011).
PD RWE Non Avian Ecology 025
Cartmel, S. (2009). Clocaenog Forest Red Squirrel Consultation Report. Forestry Commission Wales and Countryside Council for Wales Contract Research Report.
PD RWE Non Avian Ecology 026
Wales Squirrel Forum (2009) Conservation Plan for Red Squirrels in Wales
PD RWE Non Avian Ecology 027
Williams C and Hobson R (2009) The Status, Mobility and Habitat Requirement of the Small Pearl-bordered Fritillary (Boloria selene) in Clocaenog Forest and the Alwens. Butterfly Conservation Contract Report to the Forestry Commission Wales Report number S09-40
File 6 of 10

PD RWE Non Avian Ecology 028
Williams C (2012) The Status, Mobility and Habitat Requirement of the Small Pearl-bordered Fritillary (Boloria selene) in Clocaenog Forest and the Alwens. A summary of the 2010 and 2011 filed results. Butterfly Conservation Contract Report to Forestry Commission Wales. Report No S12-01
PD RWE Non Avian Ecology 029
Bruce- White, C & Shardlow, M. (2011) A review of the impact of artificial light on invertebrates. Buglife.
PD RWE Non Avian Ecology 030
Natural England Technical Advice Note: SIN001 Brown Hare, May 2007 Harris, S. & Yalden, D.W. (2008) Mammals of the British Isles: Handbook, 4th edn. The Mammal Society, Southampton*
PD RWE Non Avian Ecology 031
Arnett et al. 2008. Pattern of bat fatalities at wind energy facilities in North America. Journal of Wildlife Management 72: 61- 78
PD RWE Non Avian Ecology 032
Bat Conservation Trust, (2007) Bat Surveys - Good Practice Guidelines 2nd edition (2012)
PD RWE Non Avian Ecology 033 BaTML Publication Habitat Factsheet: Woodland PD RWE Non Avian Ecology 034
Eurobats Publication No. 3: Guidelines for consideration of bats in wind farm projects
PD RWE Non Avian Ecology 035
Walsh et al. 2012. Bats and wind turbines. Natural England, Scottish Natural Heritage and Countryside Council for Wales
PD RWE Non Avian Ecology 036
Bruce-White, C & Shardlow, M. 2011 A review of the impact of artificial light on invertebrates
PD RWE Non Avian Ecology 037
Campbell A. L., et al. 2002. Biological infrared imaging and sensing. Micron 33 pp 211-225
PD RWE Non Avian Ecology 038
Scottish Environmental Protection Agency Guidance Note 4: Planning Guidance on Windfarm Developments
PD RWE Non Avian Ecology 039
The Vincent Wildlife Trust and Waterford Institute of Technology Pine Marten Scat DNA Survey of England and Wales 2008-2009
PD RWE Non Avian Ecology 040
Horn et al. Behavioural Responses of Bats to Operating Wind Turbines (2008)
PD RWE Non Avian Ecology 041
The Supreme Court, Morge (FC) (Appellant) v Hampshire County Council (Respondent), 2011
PD RWE Non Avian Ecology 042
http://www.pnas.org/content/early/2010/10/12/1000493107.full.pdf+html
Avian Ecology (Chapter 10) PD RWE Avian Ecology 001
Institute of Ecology and Environmental Management (2006) Guidelines for Ecological Impact Assessment in the UK
PD RWE Avian Ecology 002
Pen y Cymoedd Wind Farm Wind Energy Project. Environmental Statement. Natural Power. November 2009 *
PD RWE Avian Ecology 003
Pen y Cymoedd Wind Farm Wind Energy Project. Supplementary Environmental Information. Natural Power. August 2010
PD RWE Avian Ecology 004
RPS (2007) Project Alaska Wind Farm Nightjar Activity Survey Report.
PD RWE Avian Ecology 005
Kenward R (1982) Goshawk Hunting Behaviour, and Range Size as a Function of Food and habitat Availability. J. Animal Ecology 51:69-80*
PD RWE Avian Ecology Ratcliffe D A (1993) The Peregrine Falcon. T.& A.D. Poyser,
006 Berkhamsted, UK.* PD RWE Avian Ecology 007
Stolte, A. (2009, 2010, 2011). Drumderg Wind Farm Black Grouse Lek Surveys 2009, 2010 and 2011.
PD RWE Avian Ecology 008
Unpublished Reports to Scottish and Southern Energy plc. Northern Ecological Services. Drage, J. (2004) Tir Mostyn and Foel Goch Wind Farm Habitat Enhancement Plan.
PD RWE Avian Ecology 009
Johnstone I & Lindley P (2003) The Proximate Causes of Black Grouse Breeding Failure in Wales. Unpublished RSPB report to Countryside Council for Wales, Contract Science Report Number: 600 *
PD RWE Avian Ecology 010
Moss R, Watson A & Charlton M (1998-2005) Vegetation and grouse monitoring at Beinn Ghlas. Unpublished annual reports to National Wind Power.*
PD RWE Avian Ecology 011
Drage, J. (2010) Tir Mostyn and Foel Goch Windfarm Development Habitat Monitoring Programme.
PD RWE Avian Ecology 012
Bruce White et al. A Review of the Impact of Artificial Light on Invertebrates, 2011
PD RWE Avian Ecology 013 Cloclaenog meeting file note Dec 11 PD RWE Avian Ecology 014
Countryside Council for Wales, Core Management Plan for River Dee and Bala Lake, 2008
PD RWE Avian Ecology 015 Maitland, Ecology of the River, Brook and Sea Lamprey, 2003 PD RWE Avian Ecology 016
Madders and whitfield, Upland raptors and the assessment of wind farm impacts, 2006
File 7 of 10 PD RWE Avian Ecology 017 Scottish Power Route Corridor Options PD RWE Avian Ecology 018
SNH Guidance, Assessing Connectivity with Special Protection Areas (SPAs), 2012
PD RWE Avian Ecology 019
SNH Guidance, Recommended bird survey methods to inform impact assessment of onshore wind farms, 2013
PD RWE Avian Ecology 020
Forestry Commission, The Government's Approach to Sustainabale Forestry, 2011
PD RWE Avian Ecology 021 Forestry Commission, Forests and Climate Change, 2011 PD RWE Avian Ecology 022 Forestry Commission, Forests and Water, 2011
PD RWE Avian Ecology 023
Planning Inspectorate, Brechfa Forest West Wind Farm, Examining Authority’s Report of Findings and Conclusions, 2008
PD RWE Avian Ecology 024
Guidance – Environmental Statements and Annexes of Environmentally Sensitive Bird Information. September 2009
Noise (Chapter 11) PD RWE Noise 001 IOA GPG, May 2014
PD RWE Noise 002
ETSU-R-97, the Assessment and Rating of Noise from Wind Farms, Final ETSU-R-97 Report for the Department of Trade & Industry, UK Noise Working Group, 1997
PD RWE Noise 003 BSI Code of Practice for Noise and Vibration Control Part 1 Noise 2008
File 8 of 10
PD RWE Noise 004 BSI Code of Practice for Noise and Vibration Control Part 2, Vibration 2008
PD RWE Noise 005 Dick Bowdler, Clocaenog Forest SSA, Wind Farms Cumulative

Impact Assessment v2.1, 20/12/2012 Traffic and Transport (Chapter 12) Where a hard copy is not supplied please note the relevant web address PD RWE Traffic and Transport 001
Welsh Assembly Government, Access Routes Study Clocaenog Forest Strategic Search Area A, November 2009
PD RWE Traffic and Transport 002
Welsh Assembly Government, Planning Policy Wales, 4th Edition, February 2011
PD RWE Traffic and Transport 003
Welsh Assembly Government, Planning Policy Wales Technical Advice Note 8: Renewable Energy, July 2005
PD RWE Traffic and Transport 004
HMSO, Road Vehicles (Authorisation of Special Types) (General) Order 2003
http://www.legislation.gov.uk/uksi/2003/1998/made?view=
plain
PD RWE Traffic and Transport 005
Welsh Assembly Government - Design Manual for Roads and Bridges, TD69/07, The Location and Layout of Lay-bys and Rest Areas. November 2007
PD RWE Traffic and Transport 006
Section 278 – Highways Act 1980 – Agreements as to Execution of Works
http://www.legislation.gov.uk/ukpga/1980/66/section/278
PD RWE Traffic and Transport 007
Various Authors. 1992. Guidelines for the Environmental Assessment of Road Traffic. Institute of Environmental Assessment.
Telecommunications Aviation Shadow Flicker and Other Effects (Chapter 13)
PD RWE Telecommunications Aviation Shadow Flicker and Other Effects 001
ODPM (2004). Planning for Renewable Energy: A Companion Guide to PPS 22.
PD RWE Telecommunications Aviation Shadow Flicker and Other Effects 002
Royal Institute of Chartered Surveyors (2007). What is the impact of wind farms on house prices?
PD RWE Telecommunications Aviation Shadow Flicker and Other Effects 003
CAA Policy and Guidelines on Wind Turbines
PD RWE Telecommunications Aviation Shadow Flicker and Other Effects 004
Infrastructure Planning Commission Written evidence of the Infrastructure Planning Commission to the House of Commons Energy and Climate Change Committee, 2011
PD RWE Telecommunications Aviation Shadow Flicker and Other Effects 005 Gillespies, North Wales Wind Farm Connections, 2013 PD RWE Telecommunications Aviation Shadow Flicker and Other Effects 006
DCLG, Planning practice guidance for renewable and low carbon energy, 2013

PD RWE Telecommunications Aviation Shadow Flicker and Other Effects 007
Tall Structures and their Impact on Broadcast and Other Wireless Services, Ofcom, August 2009
File 9 of 10 Socio Economic (Chapter 14) PD RWE Socio Economic 001
Royal Institute of Chartered Surveyors (2007). What is the impact of wind farms on house prices?
PD RWE Socio Economic 002
Centre for Sustainable Energy, Common Concerns about Wind Power 2011
PD RWE Socio Economic 003
REPP, The Effect of Wind Development on Local Property Values, 2003
PD RWE Socio Economic 004
Independent Expert Panel, Wind Turbine Health Impact Study, 2012
PD RWE Socio Economic 005
Renewable UK, Wind Energy and Public Safety
PD RWE Socio Economic 006 Hill Farm Appeal Decision PD RWE Socio Economic 007 Manor Farm Appeal Decision PD RWE Socio Economic 008
Planning Practice guidance and for Renewable and Low Carbon Energy
PD RWE Socio Economic 009 Renewables Obligation annual report 2011-12 PD RWE Socio Economic 010 Dept. of Energy and Climate Change Press Reference 12/083 PD RWE Socio Economic 011
Wales Tourism Alliance, Wales Tourism Definitive Value Report
PD RWE Socio Economic 012 English Partnerships Additionality Guide PD RWE Socio Economic 013
Conwy County Borough Council, Area Profile for the County Borough, 2010
PD RWE Socio Economic 014 Clocaenog Wind Farm Liaison Group PD RWE Socio Economic 015 National Assembly for Wales, Key Statistics for Conwy, 2008 PD RWE Socio Economic 016
National Assembly for Wales, Key Statistics for Denbighshire, 2008
PD RWE Socio Economic 017
Regeneris, Economic Opportunities for Wales from Future Onshore Wind Development, 2013
PD RWE Socio Economic 018 Nomis Official Online Labour Market Reports PD RWE Socio Economic 019 TNS, North Wales Visitor Survey 2003, 2004 PD RWE Socio Economic 020 DECC, Onshore Wind, Part of the UK's Energy Mix, 2013 PD RWE Socio Economic 021
Denbighshire County Council, Population of Denbighshire 2009, 2010
PD RWE Socio Economic 022 Renewable UK, Wind Power Omnibus Research, 2012 PD RWE Socio Economic 023 Rutland Gillies, Fishery Report 2012 PD RWE Socio Economic 024 E-ON, Scroby Sands, 2013

* All documents marked with an asterix are available in hard copy only. These documents can be provided to PINS upon request
File 10 of 10 PD RWE Socio Economic 025
Tourism Partnership North Wales, Tourism Strategy for North Wales 2010-2015
PD RWE Socio Economic 026 This is South Wales newspaper article PD RWE Socio Economic 027
NFO World Group, Investigation into the Potential Impact of Wind Farms on Tourism in South Wales, 2003
PD RWE Socio Economic 028 DEHLG (Rep of Ireland), Wind Farm Planning guidelines, PD RWE Socio Economic 029 Energie, Spatial Planning of Wind Turbines PD RWE Socio Economic 030 Renewable UK, Wind Energy Generation Costs, 2010 PD RWE Socio Economic 031 HM Treasury , The Green Book, 2011
PD RWE Socio Economic 032
The Interorganizational Committee on Principles and Guidelines for Social Impact Assessment, Principles and guidelines for social impact assessment in the USA, 2003
PD RWE Socio Economic 033
Renewable UK, Onshore Wind Direct and Wider Economic Impacts, 2012
PD RWE Socio Economic 034
Moffat Centre et al. The Economic Impact of Wind Farms on Scottish Tourism, 2008
PD RWE Socio Economic 035
Sustainable Development Commission, Wind Power in the UK, a guide to the Key Issues surrounding onshore wind power development in the UK
PD RWE Socio Economic 036
South West Research Company Ltd on behalf of Good Energy ‘The Impact of Renewable Energy Farms on Visitors to Cornwall’ (November 2013)
PD RWE Socio Economic 037
Town and Country Planning Act 1990, Section 78 by Wind Ventures Ltd at Farmlands East of the Village of Sutton St Edmund, South of Broad Drove West and West of Cross Drove. Application References F/YR11/0113/F and H19-0081-11
Grid Connection (Chapter 15) PD RWE Grid Connection 001
Janss, Avian Mortality from Power Lines: a morphologic approach of a species-specific mortality
PD RWE Grid Connection 002
DECC, Power Lines: Demonstrating compliance with EMF public exposure guidelines, 2012
PD RWE Grid Connection 003 National Grid EMF Electro Magnetic Fields Exposure in the UK Miscellaneous PD RWE Miscellaneous 001 Wind Farmer Validation Report January 2013

Wind Turbine Amplitude Modulation:Research to Improve Understanding as to its Cause and Effect 16 December 2013
BRief summary
Introduction
The wind energy industry today publishes detailed scientific research into the identification, occurrence and resolution of an acoustic characteristic known as Other Amplitude Modulation (OAM). This work, led by RenewableUK is the largest study of its kind to date. The findings represent a significant advancement in the scientific understanding of the acoustic characteristics associated with OAM, including its causes and mitigations.
Background
Wind turbines produce aerodynamic noise, which is the noise produced by the rotating wind turbine blades. This noise contains a periodically fluctuating, or amplitude modulated (AM), component. This form of AM, commonly referred to as “blade swish”, is an inherent feature of the operation of all wind turbines and is perfectly normal1. However, the wind industry recognised that some AM exhibited characteristics that fell outside those expected of Normal AM (NAM) and that these other AM characteristics (described in this research as OAM) were annoying to some people. The findings of this research, conducted in two phases between 20102 and 2013, identify solutions for resolving any existing issues on sites where it is found to occur.
The industry has also developed a new form of planning condition designed to provide confidence to communities and local councils.
This research
RenewableUK commissioned this research in 2010. This first phase of research concluded in 2012 and addressed the following areas:
1) Investigation into possible causes of amplitude modulation
This work was done in two parts and modelled levels of amplitude modulation in the near and far field of a wind turbine, identified key drivers and causes of OAM and gave initial thoughts on measures that could be taken to reduce or avoid these characteristics. The work found that partial blade stall was the most likely cause of OAM in specific conditions. if partial blade stall could be resolved, so too could OAM be resolved.
2) The development of an objective measurement method for OAM
Here, a number of methodologies for objectively quantifying the level of OAM in a sample of acoustic data were investigated. This resulted in the adoption of an objective assessment method necessary to enable acoustic specialists and environmental Health Officers to accurately identify and quantify OAM in the field.
3) The development of an objective method for measuring the annoyance caused by OAM
in this study, a clear relationship was established between the levels of OAM experienced and the levels of annoyance felt by people who hear it. This was developed through a highly-credible listening test in an audiometry chamber, with a sample of listeners from the general population. This information was then used in the creation of a planning condition.
4) Collation and analysis of existing acoustic recordings
in parallel to the above work streams, a review of available and published evidence of recorded samples of wind turbine noise containing OAM was conducted throughout the research programme as further information became available from the wind turbine acoustic community. The results of this analysis and a selection of the reviewed audio samples were used as an input to other work packages.
2 RenewableUK Brief Summary | December 2013
5) Measurement and analysis of new acoustic recordings
Based on the findings of the above research, a programme of further field measurements was developed to collect supplementary data. Accurate meteorological information and turbine operational information was gathered along with acoustic recordings to provide more detail on the likely cause of OAM. it was the experience of the project team that, even on wind farm sites where OAM has been reported or identified to occur, the occurrence of OAM can be infrequent.
following the conclusion of the above research, the key findings of these six reports were summarised, concluding this first phase of research in 2012.
6) Effects of different weather conditions on blade pitch and sound emissions
RenewableUK then commissioned a second phase of research in early 20133. This research further investigated the mechanisms and causes of OAM, focussing principally on the impact that changes in wind speed (wind shear), wind direction (wind veer), and inflow turbulence may have on the inflow conditions seen by the blades as they rotate. The research concluded with an assessment of how these variable inflow conditions relate to the pitch of the blades and the possible link of these interactions with partial blade stall and the potential for this to result in OAM. The research found that:
• significantwindshearandwindturbulencecancausechanges in the angle at which a wind turbine blade comes into contact with the wind (the angle of attack of turbine blades) as they rotate through each 360 degree cycle;
• inmoreextremecases,thesechangescanpushtheblades into partial stall over part of their rotation;
• insuchconditionsofpartialbladestall,OAMcanoccur;
• thisOAMwilllikelybeexperiencedinthefarfieldbutnot necessarily in the immediate vicinity of the turbine;
• practicalstrategiesexistincludingtheuseofindividualcyclical pitch control could remove the risk of stall, while minimising any loss in energy yield
Planning condition
RenewableUK has developed a planning condition with acoustics specialists which if required, can be applied to projects when they receive planning permission. This condition differs from previous conditions that have tried to address OAM as it relies on an objective and repeatable method for identifying and rating OAM. This method, unlike other methods, recognises that all amplitude modulation is, by definition, a periodic phenomenon directly related to the rotational speed of the wind turbine.
Next steps
The UK onshore wind industry is committed to ensuring that our relationships with local communities remain strong and that we continue to be good neighbours to the communities in which we operate. We therefore aim to resolve OAM on sites where it is scientifically proven to occur and to addressing its occurrence on new sites. following the publication of this research and planning condition, the industry will be working closely with Government, the institute of Acoustics, and local authorities to provide information and answer any questions that they or local communities may have about the work.
if anyone has a query regarding an existing or proposed wind farm close to them, please contact the wind farm owner or developer, or local council in the first instance. People can also contact RenewableUK directly, who will be happy to help.
1 Normal AM can be explained by well understood mechanisms and is
the result of the directivity characteristics of the noise created by the air
flowing over a turbine blade as it rotates. Because this type of AM is an
inherent feature of the operation of wind turbines, whose origin can be
explained and modelled, the present project adopts as its definition the
term “normal amplitude modulation” (NAM).
2 This first phase of research was conducted by the National Aerospace
Laboratory of the Netherlands (NLR) and a research consortium
comprising the University of Southampton, the University of Salford,
Robert Davis Associates and led by Hoare Lea Acoustics.
3 This second phase was conducted by the Wind Energy Department of
the Technical University of Denmark
RenewableUK Greencoat House, francis Street London SW1P 1DH, United Kingdom
Tel: +44 (0)20 7901 3000Fax: +44 (0)20 7901 3001
Web: www.RenewableUK.comEmail: [email protected]

Template Planning Condition on Amplitude ModulationNoise Guidance Notes
December 2013
www.RenewableUK.com

2
December 2013
This document contains guidance notes for the assessment and control of wind turbine amplitude modulation noise.
It is intended that the document is read in conjunction with the ‘Example Planning Condition’ contained in Annex B of the Institute of Acoustics ‘A Good Practice Guide to the Application of ETSU-R-97 for the Assessment and Rating of Wind Turbine Noise’, Issue 1, published in May 2013, subject to the following modifications:
• the first paragraph and specific items of the ‘Example Planning Condition’ are replaced as shown below
• ‘Guidance Notes for Noise Conditions’ is replaced as shown below
• Item (a) of ‘Guidance Note 1’ is replaced as shown below
• the new ‘Guidance Note 4’ (below) is intended to follow Guidance Notes 1 – 3 in the ‘Good Practice Guide’
• the original ‘Guidance Note 4’ is renumbered as ‘Guidance Note 5’ and replaced as shown below
• the new ‘Guidance Note 6’ (below) is intended to follow Guidance Notes 5.
Changes to the original text are highlighted in bold.
A complete version of the ‘Example Planning Conditions’, including the changes indicated above, is attached at the end of this document. Changes from the original text are highlighted in bold, as before.
The first paragraph shall be amended to read as follows:
The rating level of noise immissions from the combined effects of the wind turbines (including the application of any penalties for tonal and/or amplitude modulation components), when determined in accordance with the attached Guidance Notes (to this condition), shall not exceed the values for relevant integer wind speeds set out in, or derived from, the tables attached to these conditions at any dwelling which is lawfully existing or has planning permission at the date of this permission and:
Item c) shall be amended to read as follows:
Within 21 days from receipt of a written request from the Local Planning Authority following a complaint to it from an occupant of a dwelling alleging noise disturbance at that dwelling, the wind farm operator shall, at its expense, employ a consultant approved by the Local Planning Authority to assess the level of noise immissions from the wind farm at the complainants property in accordance with the procedures described in the attached Guidance Notes. The written request from the Local Planning Authority shall set out at least the date, time and location that the complaint relates to and any identified atmospheric conditions, including wind direction, and include a statement as to whether, in the opinion of the Local Planning Authority, the noise giving rise to the complaint contains, or is likely to contain, a tonal component or an amplitude modulation component which may attract a penalty under these conditions.
Item d) shall be amended to read as follows:
Template Planning Condition on Amplitude Modulation
Noise Guidance Notes
Introduction
Example Planning Condition
December 2013

3
The assessment of the rating level of noise immissions shall be undertaken in accordance with an assessment protocol that shall previously have been submitted to and approved in writing by the Local Planning Authority. The protocol shall include the proposed measurement location identified in accordance with the Guidance Notes where measurements for compliance checking purposes shall be undertaken, whether noise giving rise to the complaint contains or is likely to contain a tonal component or an amplitude modulation component, which may attract a penalty under these conditions, and also the range of meteorological and operational conditions (which shall include the range of wind speeds, wind directions, power generation and times of day) to determine the assessment of rating level of noise immissions. The proposed range of conditions shall be those which prevailed during times when the complainant alleges there was disturbance due to noise, having regard to the written request of the Local Planning Authority under paragraph (c), and such others as the independent consultant considers likely to result in a breach of the noise limits.
Item g) shall be amended to read as follows:
Where a further assessment of the rating level of noise immissions from the wind farm is required pursuant to Guidance Note 5(a), the wind farm operator shall submit a copy of the further assessment within 21 days of submission of the independent consultant’s assessment pursuant to paragraph (d) above unless the time limit has been extended in writing by the Local Planning Authority.
The text of this section shall be amended to read as follows:
These notes are to be read with and form part of the noise condition. They further explain the condition and specify the methods to be employed in the assessment of complaints about noise immissions from the wind farm. The rating level at each integer wind speed is the arithmetic sum of the wind farm noise level as determined from the best-fit curve described in Guidance Note 2 of these Guidance Notes and any tonal penalty applied in accordance with Guidance Note 3 and any amplitude modulation penalty applied in accordance with Guidance Note 4. Reference to ETSU-R-97 refers to the publication entitled “The Assessment and Rating of Noise from Wind Farms” (1997) published by the Energy Technology Support Unit (ETSU) for the Department of Trade and Industry (DTI).
Item (a) shall be amended to read as follows:
Values of the LA90,10 minute noise statistic should be measured at the complainant’s property, using a sound level meter of EN 60651/BS EN 60804 Type 1, or BS EN 61672 Class 1 quality (or the equivalent UK adopted standard in force at the time of the measurements) set to measure using the fast time weighted response as specified in BS EN 60651/BS EN 60804 or BS EN 61672-1 (or the equivalent UK adopted standard in force at the time of the measurements). This should be calibrated in accordance with the procedure specified in BS 4142: 1997 (or the equivalent UK adopted standard in force at the time of the measurements). Measurements shall be undertaken in such a manner to enable any required tonal penalty to be derived in accordance with Guidance Note 3 and to enable any required amplitude modulation penalty to be derived in accordance with Guidance Note 4 (with both tonal and amplitude modulation penalties to be applied in accordance with Guidance Note 5).
(a) Where, in accordance with the approved measurement protocol under paragraph (d) of the noise condition, noise immissions at the location or locations where compliance measurements are being
Guidance Notes for Noise Conditions
Guidance Note 1
Guidance Note 4 (New Section)
December 2013
4
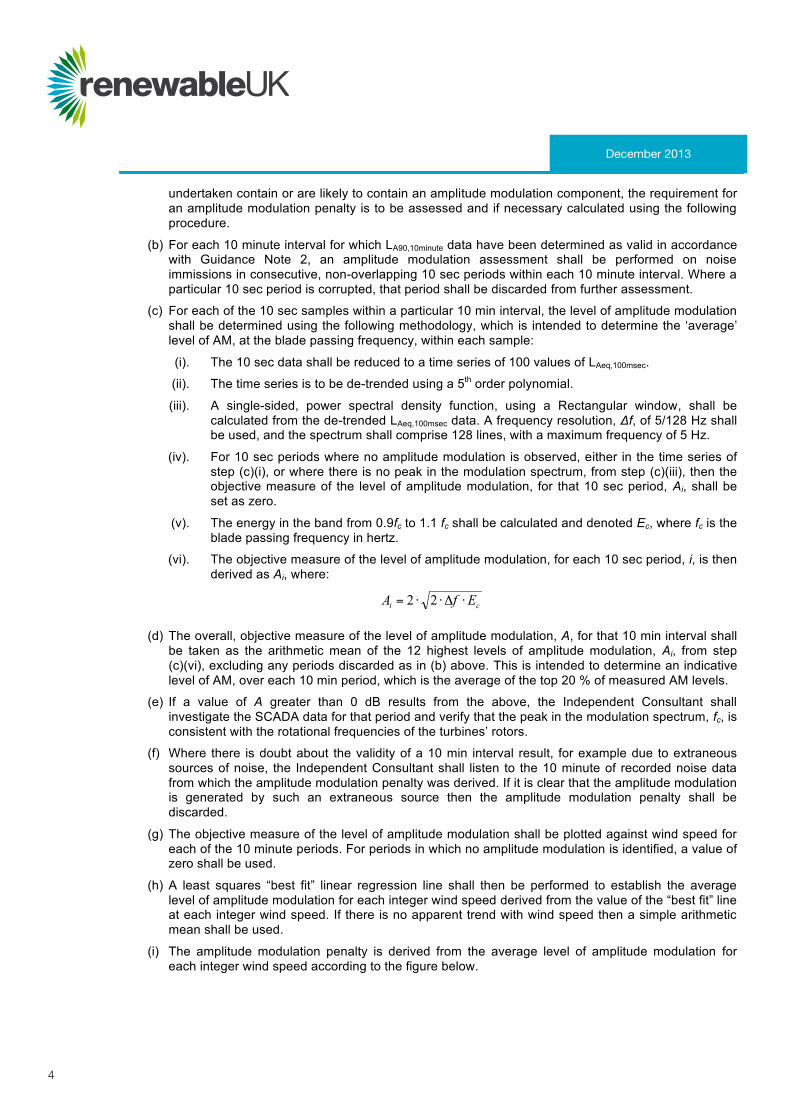
December 2013
undertaken contain or are likely to contain an amplitude modulation component, the requirement for an amplitude modulation penalty is to be assessed and if necessary calculated using the following procedure.
(b) For each 10 minute interval for which LA90,10minute data have been determined as valid in accordance with Guidance Note 2, an amplitude modulation assessment shall be performed on noise immissions in consecutive, non-overlapping 10 sec periods within each 10 minute interval. Where a particular 10 sec period is corrupted, that period shall be discarded from further assessment.
(c) For each of the 10 sec samples within a particular 10 min interval, the level of amplitude modulation shall be determined using the following methodology, which is intended to determine the ‘average’ level of AM, at the blade passing frequency, within each sample:
(i). The 10 sec data shall be reduced to a time series of 100 values of LAeq,100msec.
(ii). The time series is to be de-trended using a 5th order polynomial.
(iii). A single-sided, power spectral density function, using a Rectangular window, shall be calculated from the de-trended LAeq,100msec data. A frequency resolution, Δf, of 5/128 Hz shall be used, and the spectrum shall comprise 128 lines, with a maximum frequency of 5 Hz.
(iv). For 10 sec periods where no amplitude modulation is observed, either in the time series of step (c)(i), or where there is no peak in the modulation spectrum, from step (c)(iii), then the objective measure of the level of amplitude modulation, for that 10 sec period, Ai, shall be set as zero.
(v). The energy in the band from 0.9fc to 1.1 fc shall be calculated and denoted Ec, where fc is the blade passing frequency in hertz.
(vi). The objective measure of the level of amplitude modulation, for each 10 sec period, i, is then derived as Ai, where:
(d) The overall, objective measure of the level of amplitude modulation, A, for that 10 min interval shall be taken as the arithmetic mean of the 12 highest levels of amplitude modulation, Ai, from step (c)(vi), excluding any periods discarded as in (b) above. This is intended to determine an indicative level of AM, over each 10 min period, which is the average of the top 20 % of measured AM levels.
(e) If a value of A greater than 0 dB results from the above, the Independent Consultant shall investigate the SCADA data for that period and verify that the peak in the modulation spectrum, fc, is consistent with the rotational frequencies of the turbines’ rotors.
(f) Where there is doubt about the validity of a 10 min interval result, for example due to extraneous sources of noise, the Independent Consultant shall listen to the 10 minute of recorded noise data from which the amplitude modulation penalty was derived. If it is clear that the amplitude modulation is generated by such an extraneous source then the amplitude modulation penalty shall be discarded.
(g) The objective measure of the level of amplitude modulation shall be plotted against wind speed for each of the 10 minute periods. For periods in which no amplitude modulation is identified, a value of zero shall be used.
(h) A least squares “best fit” linear regression line shall then be performed to establish the average level of amplitude modulation for each integer wind speed derived from the value of the “best fit” line at each integer wind speed. If there is no apparent trend with wind speed then a simple arithmetic mean shall be used.
(i) The amplitude modulation penalty is derived from the average level of amplitude modulation for each integer wind speed according to the figure below.
December 2013

5
Item (a) shall be amended to read as follows:
If a tonal penalty and/or an amplitude modulation penalty is required in accordance with Guidance Notes 3 & 4 the rating level of the turbine noise at each wind speed is the arithmetic sum of the measured noise level as determined from the best fit curve described in Guidance Note 2 and the penalties for tonal and amplitude modulation noise as derived in accordance with Guidance Notes 3 & 4 at each integer wind speed within the range specified by the Local Planning Authority in its written protocol under paragraph (d) of the noise condition. Where penalties are indicated for both tonal noise and amplitude modulation noise, then the total penalty to be added to the measured noise level shall be the arithmetic sum of the individual penalties.
Item (b) shall be amended to read as follows:
If no tonal or amplitude modulation penalty is to be applied then the rating level of the turbine noise at each wind speed is equal to the measured noise level as determined from the best fit curve described in Guidance Note 2.
Item (d) shall be amended to read as follows:
The wind farm operator shall ensure that all the wind turbines in the development are turned off for such period as the independent consultant requires to undertake the further assessment provided in the previous paragraph. The further assessment shall be undertaken in accordance with the following steps:
Item (d)(ii) shall be amended to read as follows:
The wind farm noise (L1) at this speed shall then be calculated as follows where L2 is the measured level with turbines running but without the addition of any tonal or amplitude modulation penalties:
Guidance Note 5 (originally Guidance Note 4)
December 2013
6
December 2013
The rating level shall be re-calculated by adding arithmetically the tonal and amplitude modulation penalties (if any are applied in accordance with Notes 3 & 4) to the derived wind farm noise L1 at that integer wind speed.
Item (h) shall be deleted.
This section contains a glossary for Guidance Note 4, as follows:
Amplitude Modulation means the modulation of the level of broadband noise emitted by a wind turbine at blade passing frequency, fc, as represented by the peak to trough level
Amplitude Modulation Penalty the decibel penalty to be added to individual LA90,10min measurements as a result of amplitude modulation
Blade Passing Frequency means the frequency, in hertz (Hz), at which the blades pass any fixed point, for example the tower
LAeq,n means the equivalent continuous A-weighting sound pressure level over time period n
LAeq,100msec means the equivalent continuous A-weighting sound pressure level over 100 milliseconds
De-trending a function designed to remove an unwanted trend from a time series of data, resulting in a ‘stationary’ time series
Modulation Spectrum a single-sided, power spectral density function: calculated using a Rectangular window; having a frequency resolution of 5/128 H; comprising 128 lines and having a maximum frequency of 5 Hz
Power Spectral Density a function which describes how the variance (square of standard deviation) of a time series is distributed over the different frequencies
Rectangular Window a windowing function used in the spectral analysis of time series data used to ensure an equal weighting to every value within the time window
Frequency Resolution the size of the frequency bins used to define a frequency spectrum. The smaller the bins, the higher the resolution of the spectrum.
Guidance Note 6 (New Section)
December 2013
P
Item (d)(iii) shall be amended to read as follows:

7
December 2013
N.B. the following is an example condition, with attached guidance notes, the form of which has been the basis for the control of noise for several larger-scale UK wind farm developments, for example at recent planning appeals. More concise conditions may be acceptable, particularly for smaller-scale developments, and it is recommended that legal advice is sought.
The condition below assumes noise limits were referenced to standardised 10 metres height wind speed (derived from hub height). If considering noise limits referenced to measured 10 metres height, the condition should be modified appropriately: see in particular the Tables and Guidance Note 1 (d).
ANNEX B
Example Planning Condition

8
December 2013
Example Planning Condition
The rating level of noise immissions from the combined effects of the wind turbines (including the application of any penalties for tonal and/or amplitude modulation components), when determined in accordance with the attached Guidance Notes (to this condition), shall not exceed the values for the relevant integer wind speeds set out in, or derived from, the tables attached to these conditions at any dwelling which is lawfully existing or has planning permission at the date of this permission and:
a) The wind farm operator shall continuously log power production, wind speed and wind direction, all in accordance with Guidance Note 1(d). These data shall be retained for a period of not less than 24 months. The wind farm operator shall provide this information in the format set out in Guidance Note 1(e) to the Local Planning Authority on its request, within 14 days of receipt in writing of such a request.
b) No electricity shall be exported until the wind farm operator has submitted to the Local Planning Authority for written approval a list of proposed independent consultants who may undertake compliance measurements in accordance with this condition. Amendments to the list of approved consultants shall be made only with the prior written approval of the Local Planning Authority.
c) Within 21 days from receipt of a written request from the Local Planning Authority following a complaint to it from an occupant of a dwelling alleging noise disturbance at that dwelling, the wind farm operator shall, at its expense, employ a consultant approved by the Local Planning Authority to assess the level of noise immissions from the wind farm at the complainant’s property in accordance with the procedures described in the attached Guidance Notes. The written request from the Local Planning Authority shall set out at least the date, time and location that the complaint relates to and any identified atmospheric conditions, including wind direction, and include a statement as to whether, in the opinion of the Local Planning Authority, the noise giving rise to the complaint contains or is likely to contain a tonal component or an amplitude modulation component which may attract a penalty under these conditions.
d) The assessment of the rating level of noise immissions shall be undertaken in accordance with an assessment protocol that shall previously have been submitted to and approved in writing by the Local Planning Authority. The protocol shall include the proposed measurement location identified in accordance with the Guidance Notes where measurements for compliance checking purposes shall be undertaken, whether noise giving rise to the complaint contains or is likely to contain a tonal component or an amplitude modulation component, which may attract a penalty under these conditions, and also the range of meteorological and operational conditions (which shall include the range of wind speeds, wind directions, power generation and times of day) to determine the assessment of rating level of noise immissions. The proposed range of conditions shall be those which prevailed during times when the complainant alleges there was disturbance due to noise, having regard to the written request of the Local Planning Authority under paragraph (c), and such others as the independent consultant considers likely to result in a breach of the noise limits.
e) Where a dwelling to which a complaint is related is not listed in the tables attached to these conditions, the wind farm operator shall submit to the Local Planning Authority for written approval proposed noise limits selected from those listed in the Tables to be adopted at the complainant’s dwelling for compliance checking purposes. The proposed noise limits are to be those limits selected from the Tables specified for a listed location which the independent consultant considers as being likely to experience the most similar background noise environment to that experienced at the complainant’s dwelling. The rating level of noise immissions resulting from the combined effects of the wind turbines when determined in accordance with the attached Guidance Notes shall not exceed the noise limits approved in writing by the Local Planning Authority for the complainant’s dwelling.
f) The wind farm operator shall provide to the Local Planning Authority the independent consultant’s assessment of the rating level of noise immissions undertaken in accordance with the Guidance Notes within 2 months of the date of the written request of the Local Planning Authority for compliance measurements to be made under paragraph (c), unless the time limit is extended in writing by the Local Planning Authority. The assessment shall include all data collected for the purposes of undertaking the compliance measurements, such data to be provided in the format set out in Guidance Note 1(e) of the
December 2013

9
Standardised wind speed at 10 metre height (m/s) within the site averaged over 10-minute periods Location 1 2 3 4 5 6 7 8 9 10 11 12
Property Easting Northing
Guidance Notes. The instrumentation used to undertake the measurements shall be calibrated in accordance with Guidance Note 1(a) and certificates of calibration shall be submitted to the Local Planning Authority with the independent consultant’s assessment of the rating level of noise immissions.
g) Where a further assessment of the rating level of noise immissions from the wind farm is required pursuant to Guidance Note 5(a), the wind farm operator shall submit a copy of the further assessment within 21 days of submission of the independent consultant’s assessment pursuant to paragraph (d) above unless the time limit has been extended in writing by the Local Planning Authority.
Standardised wind speed at 10 metre height (m/s) within the site averaged over 10-minute periods Location 1 2 3 4 5 6 7 8 9 10 11 12
Sta ar is wi sp at 10 m tr h ight (m/s) withi th sit av rag 10 mi t p ri s ati
1 2 3 4 5 6 8 9 10 11 12
December 2013
TABLE 1 – BETWEEN 07:00 AND 23:00 – NOISE LIMITS EXPRESSED IN DB LA90,10 MINUTE AS AFUNCTION OF THE STANDARDISED WIND SPEED (M/S) AT 10 METRE HEIGHT AS DETERMINEDWITHIN THE SITE AVERAGED OVER 10 MINUTE PERIODS.
TABLE 2 – BETWEEN 23:00 AND 07:00 – NOISE LIMITS EXPRESSED IN DB LA90,10-MINUTE AS AFUNCTION OF THE STANDARDISED WIND SPEED (M/S) AT 10 METRE HEIGHT AS DETERMINEDWITHIN THE SITE AVERAGED OVER 10 MINUTE PERIODS.
TABLE 3: COORDINATE LOCATIONS OF THE PROPERTIES LISTED IN TABLES 1 AND 2.
Note to Table 3: The geographical coordinate references are provided for the purpose of identifying the general location of dwellings to which a given set of noise limits applies.
10
December 2013
Guidance Notes for Noise Conditions
These notes are to be read with and form part of the noise condition. They further explain the condition and specify the methods to be employed in the assessment of complaints about noise immissions from the wind farm. The rating level at each integer wind speed is the arithmetic sum of the wind farm noise level as determined from the best-fit curve described in Guidance Note 2 of these Guidance Notes and any tonal penalty applied in accordance with Guidance Note 3 and any amplitude modulation penalty applied in accordance with Guidance Note 4. Reference to ETSU-R-97 refers to the publication entitled “The Assessment and Rating of Noise from Wind Farms” (1997) published by the Energy Technology Support Unit (ETSU) for the Department of Trade and Industry (DTI).
Guidance Note 1
(a) Values of the LA90,10 minute noise statistic should be measured at the complainant’s property, using a sound level meter of EN 60651/BS EN 60804 Type 1, or BS EN 61672 Class 1 quality (or the equivalent UK adopted standard in force at the time of the measurements) set to measure using the fast time weighted response as specified in BS EN 60651/BS EN 60804 or BS EN 61672-1 (or the equivalent UK adopted standard in force at the time of the measurements). This should be calibrated in accordance with the procedure specified in BS 4142: 1997 (or the equivalent UK adopted standard in force at the time of the measurements). Measurements shall be undertaken in such a manner to enable any required tonal penalty to be derived in accordance with Guidance Note 3 and to enable any required amplitude modulation penalty to be derived in accordance with Guidance Note 4 (with both tonal and amplitude modulation penalties to be applied in accordance with Guidance Note 5).
(b) The microphone should be mounted at 1.2 – 1.5 metres above ground level, fitted with a two-layer windshield or suitable equivalent approved in writing by the Local Planning Authority, and placed outside the complainant’s dwelling. Measurements should be made in “free field” conditions. To achieve this, the microphone should be placed at least 3.5 metres away from the building facade or any reflecting surface except the ground at the approved measurement location. In the event that the consent of the complainant for access to his or her property to undertake compliance measurements is withheld, the wind farm operator shall submit for the written approval of the Local Planning Authority details of the proposed alternative representative measurement location prior to the commencement of measurements and the measurements shall be undertaken at the approved alternative representative measurement location.
(c) The LA90,10 minute measurements should be synchronised with measurements of the 10-minute arithmetic mean wind and operational data logged in accordance with Guidance Note 1(d), including the power generation data from the turbine control systems of the wind farm.
(d) To enable compliance with the conditions to be evaluated, the wind farm operator shall continuously log arithmetic mean wind speed in metres per second and wind direction in degrees from north at hub height for each turbine and arithmetic mean power generated by each turbine, all in successive 10-minute periods. Unless an alternative procedure is previously agreed in writing with the Planning Authority, this hub height wind speed, averaged across all operating wind turbines, shall be used as the basis for the analysis. All 10 minute arithmetic average mean wind speed data measured at hub height shall be ‘standardised’ to a reference height of 10 metres as described in ETSU-R-97 at page 120 using a reference roughness length of 0.05 metres . It is this standardised 10 metre height wind speed data, which is correlated with the noise measurements determined as valid in accordance with Guidance Note 2, such correlation to be undertaken in the manner described in Guidance Note 2. All 10-minute periods shall commence on the hour and in 10- minute increments thereafter.
(e) Data provided to the Local Planning Authority in accordance with the noise condition shall be provided in comma separated values in electronic format.
December 2013

11
(f) A data logging rain gauge shall be installed in the course of the assessment of the levels of noise immissions. The gauge shall record over successive 10-minute periods synchronised with the periods of data recorded in accordance with Note 1(d).
Guidance Note 2
(a) The noise measurements shall be made so as to provide not less than 20 valid data points as defined in Guidance Note 2 (b).
(b) Valid data points are those measured in the conditions specified in the agreed written protocol under paragraph (d) of the noise condition, but excluding any periods of rainfall measured in the vicinity of the sound level meter. Rainfall shall be assessed by use of a rain gauge that shall log the occurrence of rainfall in each 10 minute period concurrent with the measurement periods set out in Guidance Note 1. In specifying such conditions the Local Planning Authority shall have regard to those conditions which prevailed during times when the complainant alleges there was disturbance due to noise or which are considered likely to result in a breach of the limits.
(c) For those data points considered valid in accordance with Guidance Note 2(b), values of the LA90,10 minute noise measurements and corresponding values of the 10- minute wind speed, as derived from the standardised ten metre height wind speed averaged across all operating wind turbines using the procedure specified in Guidance Note 1(d), shall be plotted on an XY chart with noise level on the Y-axis and the standardised mean wind speed on the X-axis. A least squares, “best fit” curve of an order deemed appropriate by the independent consultant (but which may not be higher than a fourth order) should be fitted to the data points and define the wind farm noise level at each integer speed.
Guidance Note 3
(a) Where, in accordance with the approved assessment protocol under paragraph (d) of the noise condition, noise immissions at the location or locations where compliance measurements are being undertaken contain or are likely to contain a tonal component, a tonal penalty is to be calculated and applied using the following rating procedure.
(b) For each 10 minute interval for which LA90,10 minute data have been determined as valid in accordance with Guidance Note 2 a tonal assessment shall be performed on noise immissions during 2 minutes of each 10 minute period. The 2 minute periods should be spaced at 10 minute intervals provided that uninterrupted uncorrupted data are available (“the standard procedure”). Where uncorrupted data are not available, the first available uninterrupted clean 2 minute period out of the affected overall 10 minute period shall be selected. Any such deviations from the standard procedure, as described in Section 2.1 on pages 104-109 of ETSU-R-97, shall be reported.
(c) For each of the 2 minute samples the tone level above or below audibility shall be calculated by comparison with the audibility criterion given in Section 2.1 on pages 104-109 of ETSU-R-97.
(d) The tone level above audibility shall be plotted against wind speed for each of the 2 minute samples. Samples for which the tones were below the audibility criterion or no tone was identified, a value of zero audibility shall be used.
(e) A least squares “best fit” linear regression line shall then be performed to establish the average tone level above audibility for each integer wind speed derived from the value of the “best fit” line at each integer wind speed. If there is no apparent trend with wind speed then a simple arithmetic mean shall be used. This process shall be repeated for each integer wind speed for which there is an assessment of overall levels in Guidance Note 2.
December 2013

12
December 2013
(f) The tonal penalty is derived from the margin above audibility of the tone according to the figure below.
Guidance Note 4
(a) Where, in accordance with the approved measurement protocol under paragraph (d) of the noise condition, noise immissions at the location or locations where compliance measurements are being undertaken contain or are likely to contain an amplitude modulation component, the requirement for an amplitude modulation penalty is to be assessed and if necessary calculated using the following procedure.
(b) For each 10 minute interval for which LA90,10minute data have been determined as valid in accordance with Guidance Note 2, an amplitude modulation assessment shall be performed on noise immissions on consecutive, non-overlapping 10 sec periods within each 10 minute interval. Where a particular 10 sec period is corrupted, that period shall be discarded from further assessment.
(c) For each of the 10 sec samples within a particular 10 min interval, the level of amplitude modulation shall be determined using the following methodology, which is intended to determine the ‘average’ level of AM, at the blade passing frequency, within each sample:
(i) The 10 sec data shall be reduced to a time series of 100 values of LAeq,100msec.
(ii) The time series is to be de-trended using a 5th order polynomial.
(iii) A single-sided, power spectral density function, using a Rectangular window, shall be calculated from the de-trended LAeq,100msec data. A frequency resolution, Δf, of 5/128 Hz shall be used, and the spectrum shall comprise 128 lines, with a maximum frequency of 5 Hz.
(iv) For 10 sec periods where no amplitude modulation is observed, either in the time series of step (c)(i), or where there is no obvious peak in the modulation spectrum, from step (c)(iii), then the objective measure of the level of amplitude modulation, for that 10 sec period, Ai, shall be set as zero.
(v) The energy in the band from 0.9fc to 1.1fc shall be calculated and denoted Ec, where fc is the blade passing frequency in hertz.
(vi) The objective measure of the level of amplitude modulation, for each 10 sec period, i, is then derived as Ai, where:
December 2013
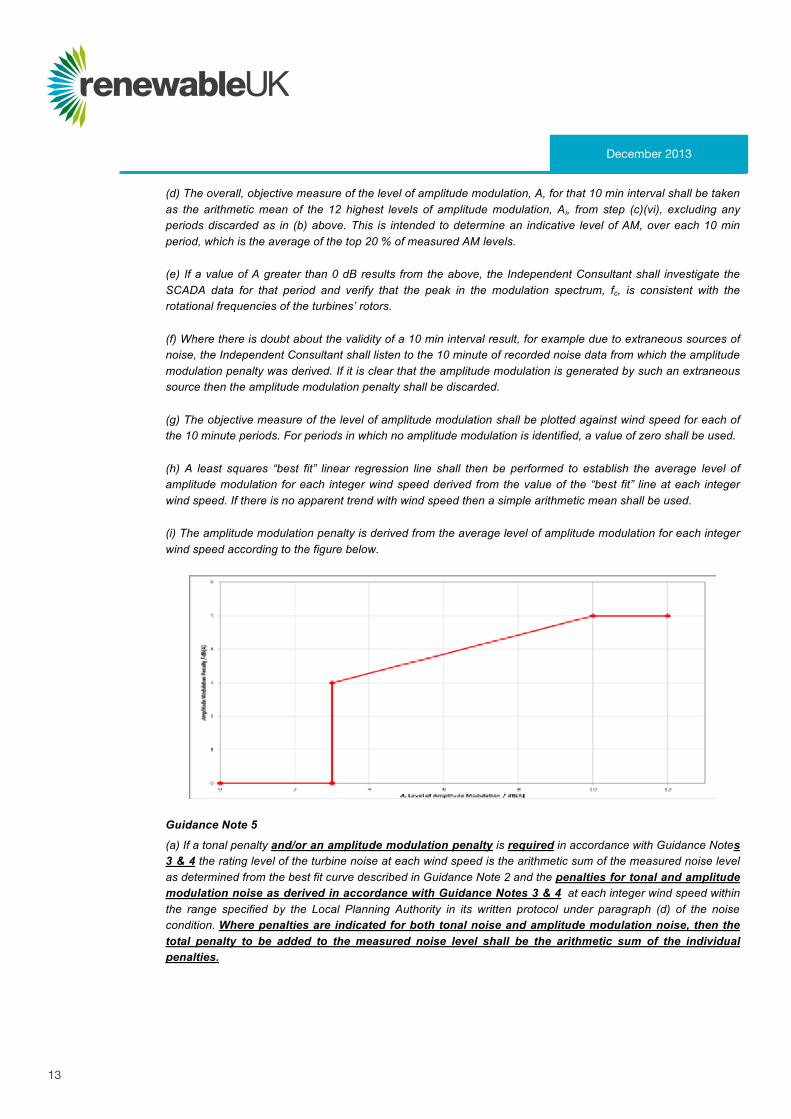
13
(d) The overall, objective measure of the level of amplitude modulation, A, for that 10 min interval shall be taken as the arithmetic mean of the 12 highest levels of amplitude modulation, Ai, from step (c)(vi), excluding any periods discarded as in (b) above. This is intended to determine an indicative level of AM, over each 10 min period, which is the average of the top 20 % of measured AM levels.
(e) If a value of A greater than 0 dB results from the above, the Independent Consultant shall investigate the SCADA data for that period and verify that the peak in the modulation spectrum, fc, is consistent with the rotational frequencies of the turbines’ rotors.
(f) Where there is doubt about the validity of a 10 min interval result, for example due to extraneous sources of noise, the Independent Consultant shall listen to the 10 minute of recorded noise data from which the amplitude modulation penalty was derived. If it is clear that the amplitude modulation is generated by such an extraneous source then the amplitude modulation penalty shall be discarded.
(g) The objective measure of the level of amplitude modulation shall be plotted against wind speed for each of the 10 minute periods. For periods in which no amplitude modulation is identified, a value of zero shall be used.
(h) A least squares “best fit” linear regression line shall then be performed to establish the average level of amplitude modulation for each integer wind speed derived from the value of the “best fit” line at each integer wind speed. If there is no apparent trend with wind speed then a simple arithmetic mean shall be used.
(i) The amplitude modulation penalty is derived from the average level of amplitude modulation for each integer wind speed according to the figure below.
Guidance Note 5
(a) If a tonal penalty and/or an amplitude modulation penalty is required in accordance with Guidance Notes 3 & 4 the rating level of the turbine noise at each wind speed is the arithmetic sum of the measured noise level as determined from the best fit curve described in Guidance Note 2 and the penalties for tonal and amplitude modulation noise as derived in accordance with Guidance Notes 3 & 4 at each integer wind speed within the range specified by the Local Planning Authority in its written protocol under paragraph (d) of the noise condition. Where penalties are indicated for both tonal noise and amplitude modulation noise, then the total penalty to be added to the measured noise level shall be the arithmetic sum of the individual penalties.
December 2013

14
December 2013
(b) If no tonal penalty or amplitude modulation penalty is to be applied then the rating level of the turbine noise at each wind speed is equal to the measured noise level as determined from the best fit curve described in Guidance Note 2.
(c) In the event that the rating level is above the limit(s) set out in the Tables attached to the noise conditions or the noise limits for a complainant’s dwelling approved in accordance with paragraph (e) of the noise condition, the independent consultant shall undertake a further assessment of the rating level to correct for background noise so that the rating level relates to wind turbine noise immission only.
(d) The wind farm operator shall ensure that all the wind turbines in the development are turned off for such period as the independent consultant requires to undertake the further assessment provided in the previous paragraph. The further assessment shall be undertaken in accordance with the following steps:
(i). Repeating the steps in Guidance Note 2, with the wind farm switched off, and determining the background noise (L3) at each integer wind speed within the range requested by the Local Planning Authority in its written request under paragraph (c) and the approved protocol under paragraph (d) of the noise condition.
(ii) The wind farm noise (L1) at this speed shall then be calculated as follows where L2 is the measured level with turbines running but without the addition of any tonal or amplitude modulation penalties:
(iii) The rating level shall be re-calculated by adding arithmetically the tonal and amplitude modulation penalties (if any are applied in accordance with Notes 3 & 4) to the derived wind farm noise L1 at that integer wind speed.
Guidance Note 6
This section contains a glossary for Guidance Note 4, as follows:
Amplitude Modulation means the modulation of the level of broadband noise emitted by a wind turbine at blade passing frequency, fc, as represented by the peak to trough level
Amplitude Modulation Penalty the decibel penalty to be added to individual LA90,10min measurements as a result of amplitude modulation
Blade Passing Frequency means the frequency, in hertz (Hz), at which the blades pass any fixed point, for example the tower
LAeq,n means the equivalent continuous A-weighting sound pressure level over time period n
LAeq,100msec means the equivalent continuous A-weighting sound pressure level over 100 milliseconds
December 2013

15
De-trending a function designed to remove an unwanted trend from a time series of data, resulting in a ‘stationary’ time series
Modulation Spectrum a single-sided, power spectral density function: calculated using a Rectangular window; having a frequency resolution of 5/128 H; comprising 128 lines and having a maximum frequency of 5 Hz
Power Spectral Density a function which describes how the variance (square of standard deviation) of a time series is distributed over the different frequencies
Rectangular Window a windowing function used in the spectral analysis of time series data used to ensure an equal weighting to every value within the time window
Frequency Resolution the size of the frequency bins used to define a frequency spectrum. The smaller the bins, the higher the resolution of the spectrum.
December 2013

RenewableUKGreencoat House, Francis StreetLondon SW1P 1DH, United Kingdom
Tel: +44 (0)20 7901 3000Fax: +44 (0)20 7901 3001Web: www.RenewableUK.com Email: [email protected]
Our vision is for renewable energy to play a leading role in powering the UK.
RenewableUK is the UK’s leading renewable energy trade association, specialising in onshore wind, offshore wind, and wave & tidal energy. Formed in 1978, we have a large established corporate membership, ranging from small independent companies to large international corporations and manufacturers. Acting as a central point of information and a united, representative voice for our membership, we conduct research, find solutions, organise events, facilitate business development, advocate and promote wind and marine renewables to government, industry, the media and the public.
The Development of a Penalty Scheme for Amplitude Modulated Wind Farm NoiseDescription and Justification
December 2013
www.RenewableUK.com
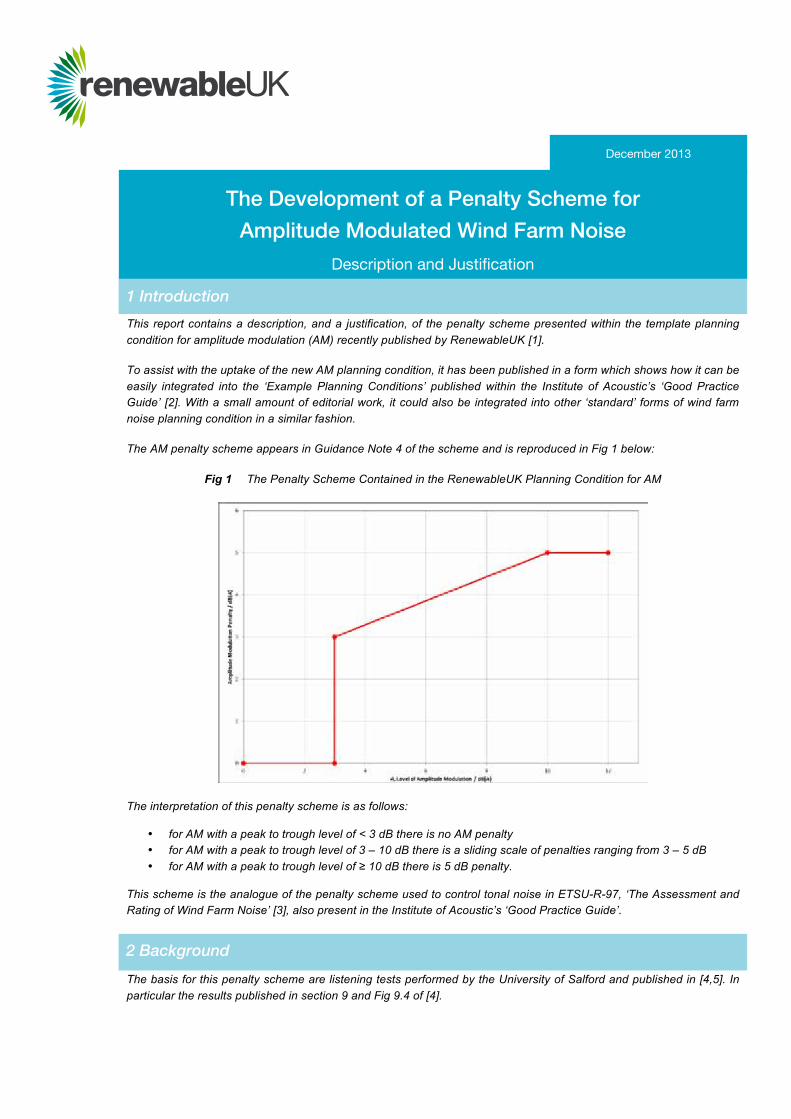
This report contains a description, and a justification, of the penalty scheme presented within the template planning condition for amplitude modulation (AM) recently published by RenewableUK [1].
To assist with the uptake of the new AM planning condition, it has been published in a form which shows how it can be easily integrated into the ‘Example Planning Conditions’ published within the Institute of Acoustic’s ‘Good Practice Guide’ [2]. With a small amount of editorial work, it could also be integrated into other ‘standard’ forms of wind farm noise planning condition in a similar fashion.
The AM penalty scheme appears in Guidance Note 4 of the scheme and is reproduced in Fig 1 below:
Fig 1 The Penalty Scheme Contained in the RenewableUK Planning Condition for AM
The interpretation of this penalty scheme is as follows:
• for AM with a peak to trough level of < 3 dB there is no AM penalty • for AM with a peak to trough level of 3 – 10 dB there is a sliding scale of penalties ranging from 3 – 5 dB • for AM with a peak to trough level of ≥ 10 dB there is 5 dB penalty.
This scheme is the analogue of the penalty scheme used to control tonal noise in ETSU-R-97, ‘The Assessment and Rating of Wind Farm Noise’ [3], also present in the Institute of Acoustic’s ‘Good Practice Guide’.
The basis for this penalty scheme are listening tests performed by the University of Salford and published in [4,5]. In particular the results published in section 9 and Fig 9.4 of [4].
The Development of a Penalty Scheme for
Amplitude Modulated Wind Farm Noise
Description and Justification
1 Introduction
2 Background
December 2013
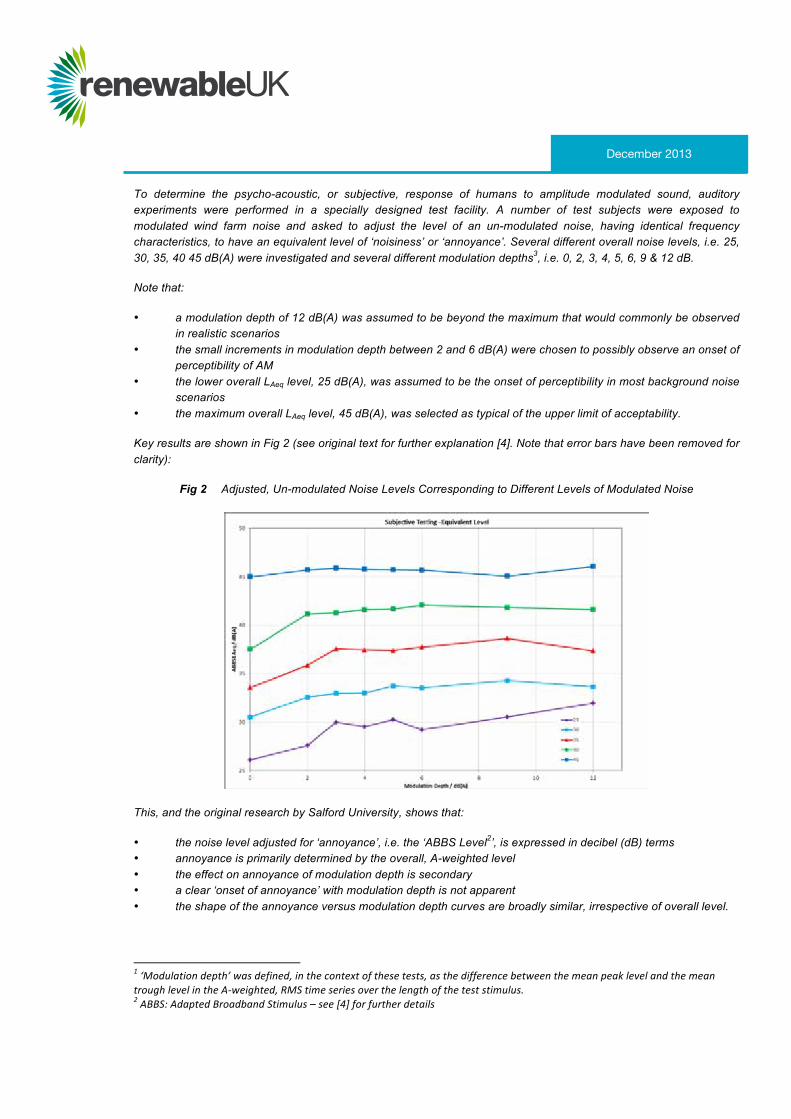
To determine the psycho-acoustic, or subjective, response of humans to amplitude modulated sound, auditory experiments were performed in a specially designed test facility. A number of test subjects were exposed to modulated wind farm noise and asked to adjust the level of an un-modulated noise, having identical frequency characteristics, to have an equivalent level of ‘noisiness’ or ‘annoyance’. Several different overall noise levels, i.e. 25, 30, 35, 40 45 dB(A) were investigated and several different modulation depths3, i.e. 0, 2, 3, 4, 5, 6, 9 & 12 dB.
Note that:
• a modulation depth of 12 dB(A) was assumed to be beyond the maximum that would commonly be observed in realistic scenarios
• the small increments in modulation depth between 2 and 6 dB(A) were chosen to possibly observe an onset of perceptibility of AM
• the lower overall LAeq level, 25 dB(A), was assumed to be the onset of perceptibility in most background noise scenarios
• the maximum overall LAeq level, 45 dB(A), was selected as typical of the upper limit of acceptability.
Key results are shown in Fig 2 (see original text for further explanation [4]. Note that error bars have been removed for clarity):
Fig 2 Adjusted, Un-modulated Noise Levels Corresponding to Different Levels of Modulated Noise
This, and the original research by Salford University, shows that:
• the noise level adjusted for ‘annoyance’, i.e. the ‘ABBS Level2’, is expressed in decibel (dB) terms • annoyance is primarily determined by the overall, A-weighted level • the effect on annoyance of modulation depth is secondary • a clear ‘onset of annoyance’ with modulation depth is not apparent • the shape of the annoyance versus modulation depth curves are broadly similar, irrespective of overall level.
1 ‘Modulation depth’ was defined, in the context of these tests, as the difference between the mean peak level and the meantrough level in the A-‐weighted, RMS time series over the length of the test stimulus.2 ABBS: Adapted Broadband Stimulus – see [4] for further details
December 2013

This last point suggests that it is possible to separate out the annoyance due to the overall level of noise from that due to modulation depth, and this may be achieved by ‘normalising’ (or differencing) the results for a particular overall level to the results corresponding to zero dB(A) modulation depth.
At zero dB(A) modulation depth the adjustments were expected to be ~ 0 dB(A) as the two stimuli were identical. This was, however, not the case. Quieter stimuli were adjusted to higher levels, for example ~ 2 dB(A) higher for the 25 dB(A) AM stimulus. For louder stimuli the level adjustment was ~ 2 dB(A) lower than the AM stimulus LAeq. This confirms a participant observation stating that levels were hard to judge. Also participants might have felt the need to always make adjustments in the belief that the AM stimuli must be different from the ABBS. To account for this effect we can normalise the average adjusted level for a certain modulation value by the average value determined without modulation: this process is explained in Fig 3:
Fig 3 Normalising the Adjusted Level Results
Consider the annoyance curve for test samples with a nominal overall level of 40 dB(A) – the green line. In this example, the annoyance for the sample with zero dB(A) modulation depth is 37.5 dB(A), slightly below the 40 dB(A) nominal level. For the sample with a 12 dB(A) modulation depth, the annoyance is 41.8 dB(A), suggesting that the marginal annoyance solely due to the 12 dB(A) of AM, compared to an un-modulated noise with the same spectrum and overall level, is 4.3 dB(A).
This process can be repeated for each one of data points on the 40 dB(A) nominal level curve, to determine the marginal annoyance for varying modulation depths. It can also be repeated for the 25, 30, 35 and 45 dB(A) nominal level curves, and the results of this are shown in Fig 4:
December 2013
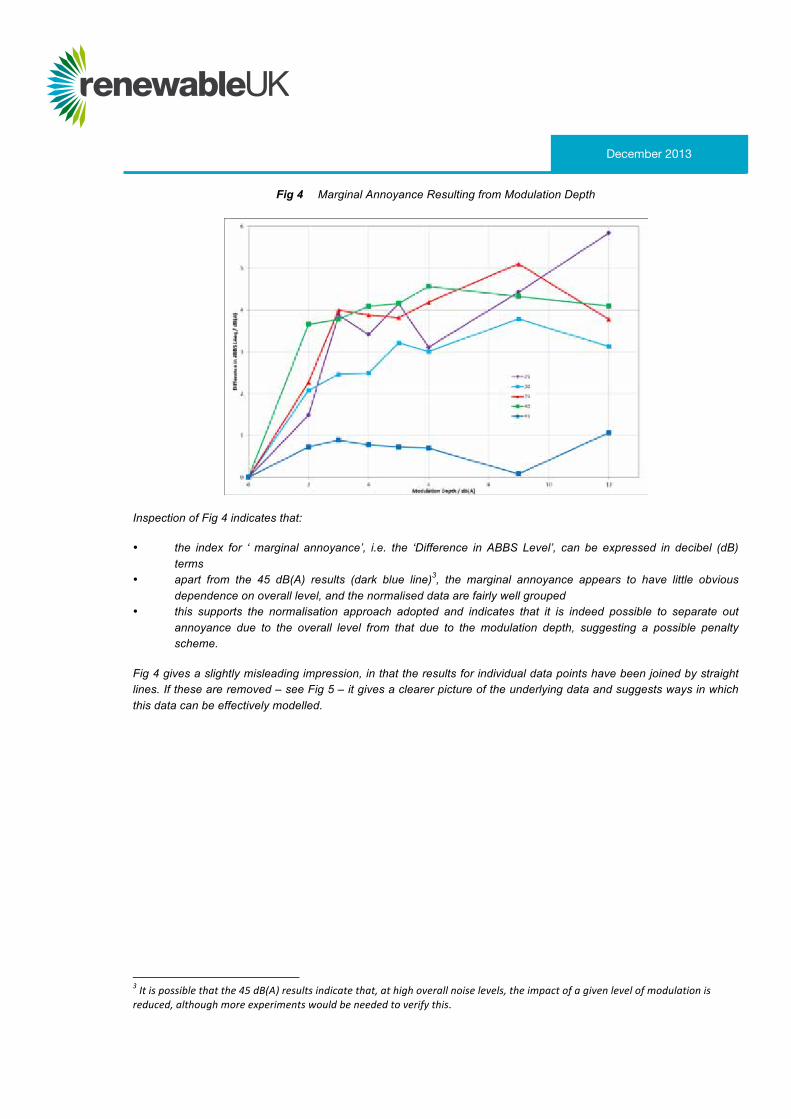
Fig 4 Marginal Annoyance Resulting from Modulation Depth
Inspection of Fig 4 indicates that:
• the index for ‘ marginal annoyance’, i.e. the ‘Difference in ABBS Level’, can be expressed in decibel (dB) terms
• apart from the 45 dB(A) results (dark blue line)3, the marginal annoyance appears to have little obvious dependence on overall level, and the normalised data are fairly well grouped
• this supports the normalisation approach adopted and indicates that it is indeed possible to separate out annoyance due to the overall level from that due to the modulation depth, suggesting a possible penalty scheme.
Fig 4 gives a slightly misleading impression, in that the results for individual data points have been joined by straight lines. If these are removed – see Fig 5 – it gives a clearer picture of the underlying data and suggests ways in which this data can be effectively modelled.
3 It is possible that the 45 dB(A) results indicate that, at high overall noise levels, the impact of a given level of modulation isreduced, although more experiments would be needed to verify this.
December 2013

Fig 5 Developing a Model for Marginal Annoyance
Ignoring the 45 dB(A) overall level results, a third order, ‘cubic’ polynomial has been fitted to the remaining data points – see purple line. A simple piece-wise, continuous linear model can be developed - Scheme A (green line) - which is broadly equivalent to this, defined as follows:
• a sloped line running from (0, 0) to (4, 4) • a flat line at 4 dB from (4, 4) to (12, 4).
This suggests a maximum level of penalty, for modulation depths of up to 12 dB peak to trough, of 4 dB.
However, in forming a penalty scheme, there are a number of practical considerations which should be considered:
• according to ETSU-R-97, ‘This modulation of blade noise may result in variation of the overall A-weighted noise level by as much as 3 dB(A) (peak to trough)… …The noise levels recommended in this report take into account the character of noise described in Chapter3 as blade swish. Given that all wind turbines exhibit blade swish to a certain extent we feel this is a more common-sense approach given the current level of knowledge’ [3]. This suggests that there should no AM penalty for modulation depths of less than 3 dB
• according to BS 4142:1997 ‘Certain acoustic features can increase the likelihood of complaint over that expected… …such features are taken into account by adding 5 dB to the specific noise level to obtain the rating level’ [6].This suggests that the maximum AM penalty for modulation should be 5 dB, not 4 dB.
• according to ETSU-R-97, the maximum penalty for tonal noise is 5 dB [3].
Given these constraints, an alternative penalty scheme can be conceived – Scheme B - as the red line shown on Fig 5.This is defined as follows:
• a flat line at 0 dB from (0, 0) to (3, 0) • a vertical line at 3 dB running from (3,0) to (3, 3) • a sloped line running from (3, 3) to (10, 5) • a flat line at 5 dB from (10, 5) to (12, 5).
It is this model which has been adopted as the penalty scheme in RenewableUK’s proposed template planning condition for AM.
December 2013

performed very similar experiments to those at the University of Salford [7,8].
As before, a number of test subjects were placed in a specially designed listening room and asked to adjust the level of a realistic, modulated wind farm noise to have the same level of ‘noisiness’ as an identical un-modulated sound.
Several different depths of peak to trough modulation were investigated, i.e. 0, 1, 2, 3, 4, 5, 6, 8 & 10 dB. Also two different overall noise levels were considered, i.e. 35 & 45 dB(A).
Keys results from this research are shown in Figs 6 & 7, where the ‘AM index ΔL [dB]’ is equivalent to the peak-to-trough modulation depth referred to earlier, and the ‘Adjusted level [dB]’ is equivalent to a ‘penalty’ for the degree of modulation4. Results for individual test subjects are shown, as well as the mean values (pink triangles) and error bars (± 1 standard deviation unit).
Fig 6 Results from Japanese Research at 35 dB with RenewableUK Penalty Scheme
Inspection of Fig 6 - 35 dB(A) - indicates that:
• AM with a peak to trough level of < 3 dB appears to have little impact on overall annoyance • above 3 dB, average annoyance increases gradually, with increasing AM depth, up to a maximum of ~ 2 dB,
for 10 dB of AM.
4 Note sign difference due to the design of the experiment.
2.1 Comparison with Results from Recent Japanese Research
December 2013

Fig 7 Results from Japanese Research at 45 dB with RenewableUK Penalty Scheme
Inspection of Fig 7 - 45 dB(A) - indicates that:
• results are broadly similar to those for 35 dB(A) • AM with a peak to trough level of < 2 dB appears to have little impact on overall annoyance • above 2 dB, average annoyance gradually increases, with increasing AM depth, up to a maximum of ~ 3 dB,
for 10 dB of AM.
Also shown on Figs 6 & 7 is the penalty scheme derived from the University of Salford data presented in Section 2 earlier. This is clearly considerably more conservative than an equivalent penalty scheme which might be derived solely from the Japanese results. Indeed, it is clear that the proposed penalty scheme provides an envelope which includes not only the average responses to the tests, but also the majority of the individual test results from test subjects.
Based on this, it can be concluded that the proposed penalty scheme is consistent with the latest Japanese results and, indeed, is conservative in this context.
Discussions during the development phase of this scheme threw up a number of questions relating to the AM planning condition and, because they are likely to be of interest to a wider readership, they are reproduced here:
Q1 Why place a 5 dB limit on the amplitude modulation penalty?
A1 This 5 dB limit derives from British Standard 4142 (1997), which relates to rating industrial noise in mixed residential and industrial areas [6]. This seems to be the most relevant guidance currently extant in the UK.
Q2 The procedure is (necessarily) complex and requires computationally intensive analysis. As it will be difficult for most individuals to implement, are there any plans to provide a freely-available software analysis tool? Such a tool would have the benefit of providing a level playing field for all parties.
A2 The proposed methodology is not especially cumbersome, particularly when compared to the tonal analysis process in ETSU-R-97. However, such software is currently being developed and will be made available in the near future.
December 2013
3 Questions and Answers
This brief document provides an explanation and a justification for the penalty scheme presented within the template planning condition for amplitude modulation (AM) recently published by RenewableUK [1].
To assist with uptake, the new AM condition has been published in a form which shows how it can be easily integrated into the ‘Example Planning Conditions’ published within the Institute of Acoustic’s ‘Good Practice Guide’ [2]
It is also shown that the penalty scheme proposed has been derived from fundamental research performed by the University of Salford and is entirely consistent with recent AM research performed in Japan.
1. RenewableUK (2013), RenewableUK Template Planning Condition on Amplitude Modulation, 16 December 2013
2. IOA (2013), A Good Practice Guide to the Application of ETSU-R-97 for the Assessment and Rating of Wind Turbine Noise, May 2013
3. ETSU (1996),’ The Assessment and Rating of Noise from Wind Farms’, Report ETSU-R-97, dated September 1996
4. von Hünerbein S, King A, Piper B & Cand M (2012) Wind Turbine Amplitude Modulation: Research to Improve Understanding as to its Cause & Effect. Work Package B2: Development of an AM Dose-Response Relationship, Final Report to RenewableUK
5. von Hünerbein S, Davies B, Moorhouse A, King A & Piper B (2013) ‘Dose-response relation of amplitude modulation (AM) and affective response’, Presentation at RenewableUK Conference, Birmingham, UK, 5 – 8 November 2013
6. BS (1997), Method for rating industrial noise affecting mixed residential and industrial areas, BS 4142:1997, ISBN 0 580 28300 3
7. Fukushima A, Yamamoto K, Uchida H, Sueoka S, Kobayashi T & Tachibana H (2013), Study on the amplitude modulation of wind turbine noise: Part 1 – Physical Investigation, Proceedings of the Internoise 2013 conference, Innsbruck, Austria, 15 – 18 September 2013
8. Yokoyama S, Sakamoto S & Tachibana H (2013), Study on the amplitude modulation of wind turbine noise: Part 2 – Auditory experiments, Proceedings of the Internoise 2013 conference, Innsbruck, Austria, 15 – 18 September 2013
9. Lee S, Kim K, Lee S Kim H & Lee S (2009), An estimation of the amplitude modulation in wind turbine noise for community response assessment, Proceedings of the Third International Meeting on Wind Turbine Noise (WTN2009), Aalborg, Denmark, 17 – 19 June 2009
December 2013
Note to Table 3: The geographical coordinate references are provided for the purpose of identifying the general location of dwellings to which a given set of noise limits applies.
4 Conclusion
5 References

RenewableUKGreencoat House, Francis StreetLondon SW1P 1DH, United Kingdom
Tel: +44 (0)20 7901 3000Fax: +44 (0)20 7901 3001Web: www.RenewableUK.com Email: [email protected]
Our vision is for renewable energy to play a leading role in powering the UK.
RenewableUK is the UK’s leading renewable energy trade association, specialising in onshore wind, offshore wind, and wave & tidal energy. Formed in 1978, we have a large established corporate membership, ranging from small independent companies to large international corporations and manufacturers. Acting as a central point of information and a united, representative voice for our membership, we conduct research, find solutions, organise events, facilitate business development, advocate and promote wind and marine renewables to government, industry, the media and the public.
Investigation of the ‘Den Brook’ Amplitude Modulation Methodology for Wind Turbine Noise(Version 2, 11 November 2011)
Dr Jeremy Bass, MInstP, MIOA
1 Introduction
An area of significant interest to those in the acoustic community is wind turbine noise and, more specifically, amplitude modulation (AM), which is modulation of the broadband, aerodynamic noise emitted by a wind turbine at the blade passing frequency, typically ~ 1 Hz. This modulation is also commonly referred to as ‘blade swish’ [1].
As it has been suggested that high levels of AM may lead to complaints from neighbours, it is relevant to consider methods for objectively quantifying amplitude modulation so that sites with low levels of AM can be distinguished from those with high levels. Quite what is meant by ‘high’ and ‘low’ in this context is uncertain and a comprehensive study is currently underway to correct this deficit in our knowledge [2,3].
This article focuses on a method which aims to distinguish between ‘high’ and ‘low’ levels of AM and which first appeared in the Planning Conditions for the proposed Den Brook Wind Farm [4]. This methodology is referred to here as the ‘AM Test Method’ and is tested using real, measured data to assess its performance.
2 Background
It has been suggested that the document defining the methodology for controlling the noise impact of UK wind farms, ‘The Assessment and Rating of Noise from Wind Farms, generally known as ETSU-R-97 [1], is out of date, partly because it has nothing to say about AM.
This is not the case, as the following three quotes from ETSU-R-97 demonstrate:
“The noise levels recommended in this report take into account the character of noise described as blade swish. Given that all turbines exhibit blade swish to a certain extent we feel this is a common-sense approach given the current level of knowledge.”
“This modulation of blade noise may result in a variation of the overall A-weighted noise level by as much as 3 dB(A) (peak to trough) when measured close to a wind turbine.”
“...it has been found that positions close to reflective surfaces may result in an increase in the modulation depth perceived at a receiver position remote from a site. If there are more than two hard, reflective surfaces, then the increase in modulation depth may be as much as 6 dB(A) (peak to trough).” [1]
So clearly this noise character, i.e. AM, is acknowledged by, and implicit in, the noise limits which ETSU-R-97 defines. An indicative value, in free-field conditions, of 3 dB(A) peak to peak is suggested, with higher levels in reverberant conditions, i.e. where there are reflections.
These comments were based on experience at the time, and there is nothing in the text to suggest that it was ever intended that this 3 dB(A) value should form the basis of a hard limit - however, it is precisely this limit which is at the core of the AM Test Method, as we shall see.
3 The AM Test Method
The stated aim of the AM Test Method is to determine whether the noise received at the property of someone living next to a wind farm contains “greater than expected” amplitude modulation (AM) which, as far as the methodology is concerned, is AM greater than 3 dB(A) peak to trough [4].
In outline, the method proceeds as follows:
Document Ref: TC01-019643 Issue: 02

1. obtain noise immission data from the wind farm, at the receptor location of interest, as a time series of LAeq,125 msec data
2. the time series is then scanned to identify 2 sec periods where there is an increase in the LAeq,125 msec level of > 3 dB(A), and a subsequent fall in level of > 3 dB(A) - see Fig 1
3. the time series is then re-scanned to identify 1 min periods where there are 5 or more occurrences of 2 sec periods containing the appropriate rise and fall in level as defined in step 2 – see Fig 2 (the red crosses denote 2 sec periods that fulfil the requirements of step 2, and the blue boxes 3 such 1 min periods which fulfil the requirements of this step)
4. a proviso is added to this last condition, such that this only applies if the LAeq,1 min level is greater than 28 dB(A)
5. the time series is re-scanned a final time to identify 1 hour periods where there are 6 or more such occurrences of 1 min periods meeting conditions 1 – 4 – see Fig 3
6. the location at which noise measurements should be made is specified as being 1.2 m above ground and between 3.5 and 35 m from the property in question.
Figure 1
Document Ref: TC01-019643 Issue: 02

Figure 2
Figure 3
Document Ref: TC01-019643 Issue: 02

3.1 Comments
Based on a straightforward reading of the method, there are a number of difficulties with the method:
the implication is that the method, defined by steps 1 – 6, is the process by which the stated aim of ensuring that ‘greater than expected’ AM does not occur, can be determined. It is precisely this question which this article addresses
the method contains a number of arbitrary numbers (i.e. constants), the psycho-acoustics relevance of which is unclear, although some justification exists [5]. For example:
o the indicative level of 3 dB(A) for AM, taken from ETSU-R-97, here appears as an absolute, hard limit – can this be justified psycho-acoustically?
o why 5 occurrences of 2 sec within a minute, when clearly 1 – 30 are possible?
o why 6 occurrences of 1 min within an hour, when clearly 1 – 60 are possible?
o why is a lower limit of 28 dB(A) imposed in step 4?
given the complexity of the methods presented in ETSU-R-97 for placing limits on noise immission levels and levels of tonality, the AM Test Method appears suspiciously simple, although this is not, in itself, necessarily a problem
there are no references to the testing of this method, by the author or by third parties, nor is the underlying basis of the method explained. Given the significance of the outcome of such tests for wind farm development, and the level of scrutiny such results would receive, this clearly needs to be done
the choice of the LAeq,125msec statistic to measure noise immission for AM testing purposes is surprising, given that the Leq is known to be sensitive to the occurrence of short term, high energy events during its measurement. For example, it is interesting to note that in Fig 2 the red crosses almost exclusively occur during such short-term events. It is for this, and other reasons, that ETSU-R-97 itself identifies the L90 statistic as a more robust measure for practical noise assessment
the ‘standard’ methodology for assessing noise immission and tonality from a UK wind farm is based on fixed time intervals which can readily be assessed using sound level meters, or computer based, automated methods. This enables large amounts of noise data to be analysed quickly, and maintains synchronism with external source of data, for example wind speed. The AM Test Method, however, departs from this approach and uses sliding time windows which may, or may not, align with external sources of data. Whilst this is not necessarily a problem in itself, it may make such external correlation difficult
it is not clear from the test whether the 5 or more 2 sec periods, as defined in step 3, are overlapping or non-overlapping? Similarly for the 6 or more 1 min periods. This makes a profound difference to the outcome of testing (note that, for the purposes of the testing presented here, non-overlapping periods have been assumed throughout)
given the sliding nature of the assessment, and the number of scans of the LAeq,125msec data required, the implementation of the method may prove difficult (as indeed the author found)
the intention of step 6 is presumably to ensure that measurements are made in free-field conditions, rather than in a reverberant space which may result in higher levels of AM, primarily due to reflections.
Document Ref: TC01-019643 Issue: 02

4 Performance with Measured Data
Irrespective of the comments above, it is instructive to see how the AM Test Method performs when applied to real, measured data. To do this, the method has been applied to a large body of acoustic data obtained from two rural sites where no wind turbines exist and therefore there is no possibility of wind turbine induced AM being present. This absence of AM has been verified by selective listening to audio data from both sites prior to analysis.
Acoustic data have been collected as follows:
Site Name Turncole RotseaLocation Nr. Burnham-on-Crouch, Essex Nr. Driffield, East Yorkshire
NGR TQ 991 983 TA 064 516Data Collection 19 – 27 August 2011 20 – 27 September 2011
Sound Level Meter Rion NA-28 Rion NL-52Hours of Data (HH:MM:SS) 184:12:17 166:45:57
Table 1
Photographs showing the locations of the SLMs at Turncole (Fig 4) and Rotsea (Fig 5) are shown below. In each case, the sound level meters have been set up between 3.5 and 35 m from the property, as required by the method.
Figure 4
Document Ref: TC01-019643 Issue: 02

Figure 5
Audio have been recorded in continuous 10 min blocks, providing a complete record from the start to the finish of monitoring. Overall, in excess of 184 hours of data have been analysed from the Turncole site and 166 hours from Rotsea, a total of 350 hours.
The AM Test Method itself has been implemented in both Microsoft Excel and Matlab. For the purposes of this assessment, the Matlab implementation is preferred because of its ability to process large volumes of data rapidly.
4.1 Key Results
The key result from the analysis of the data for Turncole is shown in Fig 6.
Figure 6
Document Ref: TC01-019643 Issue: 02
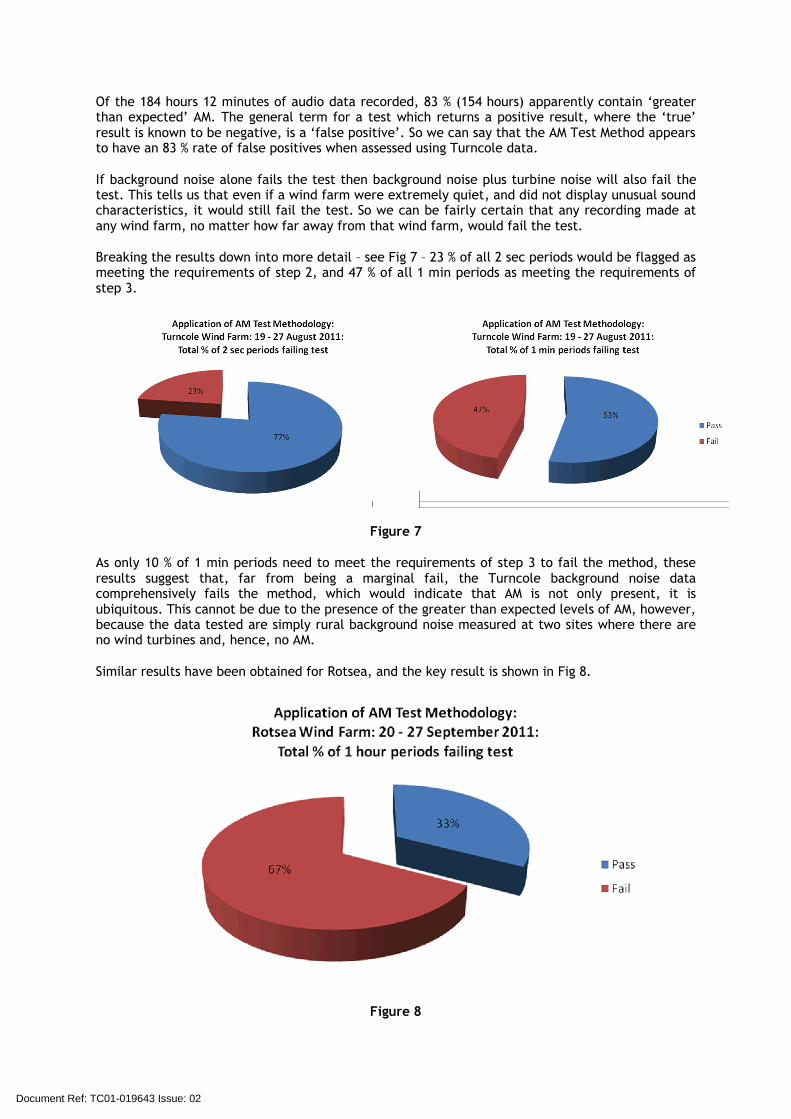
Of the 184 hours 12 minutes of audio data recorded, 83 % (154 hours) apparently contain ‘greater than expected’ AM. The general term for a test which returns a positive result, where the ‘true’ result is known to be negative, is a ‘false positive’. So we can say that the AM Test Method appears to have an 83 % rate of false positives when assessed using Turncole data.
If background noise alone fails the test then background noise plus turbine noise will also fail the test. This tells us that even if a wind farm were extremely quiet, and did not display unusual sound characteristics, it would still fail the test. So we can be fairly certain that any recording made at any wind farm, no matter how far away from that wind farm, would fail the test.
Breaking the results down into more detail – see Fig 7 – 23 % of all 2 sec periods would be flagged as meeting the requirements of step 2, and 47 % of all 1 min periods as meeting the requirements of step 3.
Figure 7
As only 10 % of 1 min periods need to meet the requirements of step 3 to fail the method, these results suggest that, far from being a marginal fail, the Turncole background noise data comprehensively fails the method, which would indicate that AM is not only present, it is ubiquitous. This cannot be due to the presence of the greater than expected levels of AM, however, because the data tested are simply rural background noise measured at two sites where there are no wind turbines and, hence, no AM.
Similar results have been obtained for Rotsea, and the key result is shown in Fig 8.
Figure 8
Document Ref: TC01-019643 Issue: 02
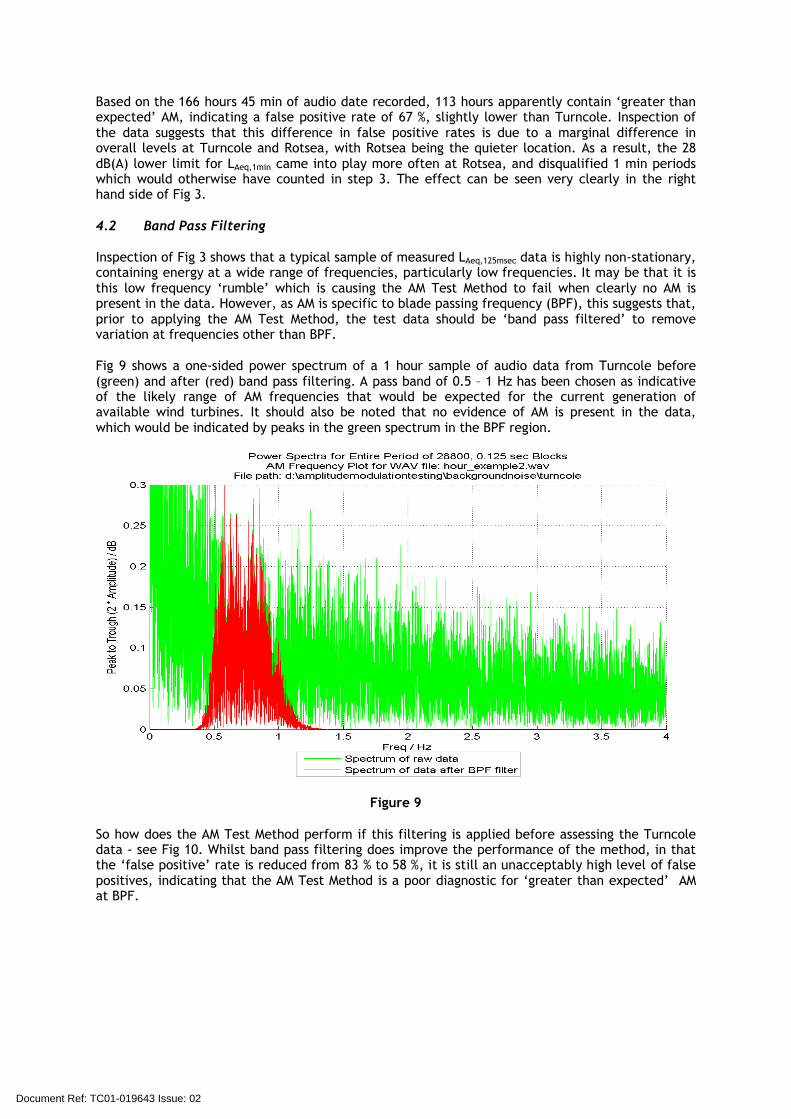
Based on the 166 hours 45 min of audio date recorded, 113 hours apparently contain ‘greater than expected’ AM, indicating a false positive rate of 67 %, slightly lower than Turncole. Inspection of the data suggests that this difference in false positive rates is due to a marginal difference in overall levels at Turncole and Rotsea, with Rotsea being the quieter location. As a result, the 28 dB(A) lower limit for LAeq,1min came into play more often at Rotsea, and disqualified 1 min periods which would otherwise have counted in step 3. The effect can be seen very clearly in the right hand side of Fig 3.
4.2 Band Pass Filtering
Inspection of Fig 3 shows that a typical sample of measured LAeq,125msec data is highly non-stationary, containing energy at a wide range of frequencies, particularly low frequencies. It may be that it is this low frequency ‘rumble’ which is causing the AM Test Method to fail when clearly no AM is present in the data. However, as AM is specific to blade passing frequency (BPF), this suggests that, prior to applying the AM Test Method, the test data should be ‘band pass filtered’ to remove variation at frequencies other than BPF.
Fig 9 shows a one-sided power spectrum of a 1 hour sample of audio data from Turncole before (green) and after (red) band pass filtering. A pass band of 0.5 – 1 Hz has been chosen as indicative of the likely range of AM frequencies that would be expected for the current generation of available wind turbines. It should also be noted that no evidence of AM is present in the data, which would be indicated by peaks in the green spectrum in the BPF region.
Figure 9
So how does the AM Test Method perform if this filtering is applied before assessing the Turncole data - see Fig 10. Whilst band pass filtering does improve the performance of the method, in that the ‘false positive’ rate is reduced from 83 % to 58 %, it is still an unacceptably high level of false positives, indicating that the AM Test Method is a poor diagnostic for ‘greater than expected’ AM at BPF.
Document Ref: TC01-019643 Issue: 02
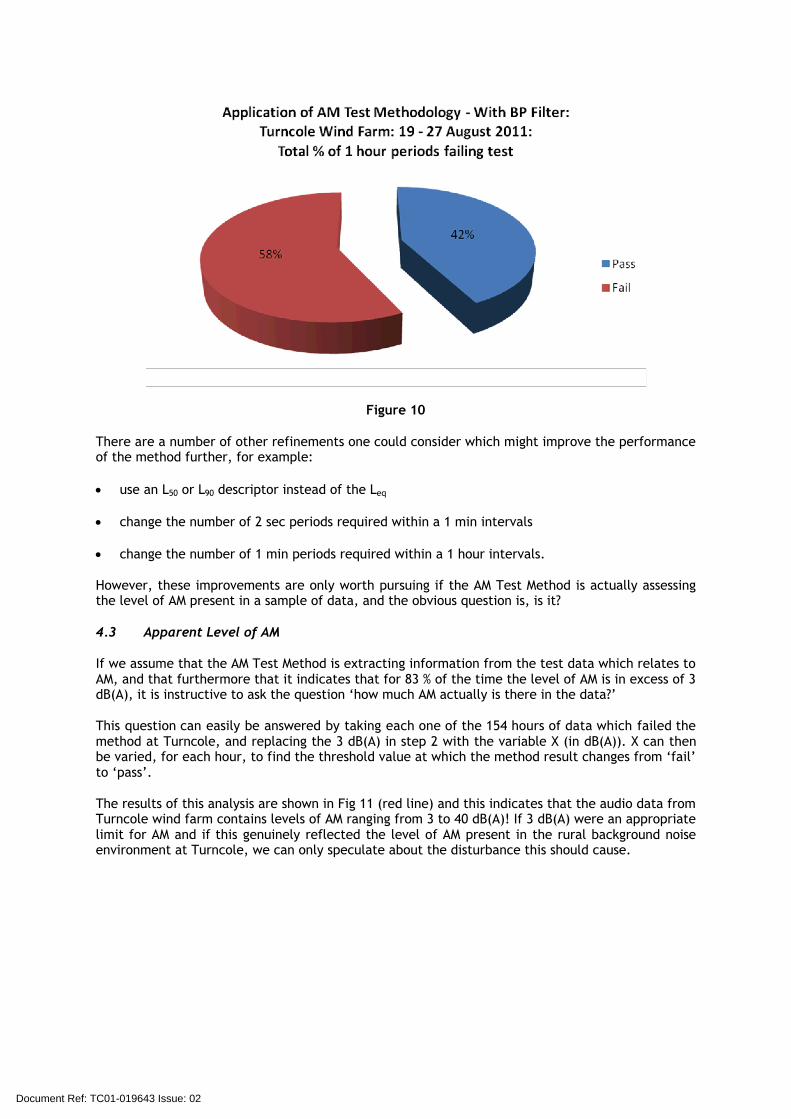
Figure 10
There are a number of other refinements one could consider which might improve the performance of the method further, for example:
use an L50 or L90 descriptor instead of the Leq
change the number of 2 sec periods required within a 1 min intervals
change the number of 1 min periods required within a 1 hour intervals.
However, these improvements are only worth pursuing if the AM Test Method is actually assessing the level of AM present in a sample of data, and the obvious question is, is it?
4.3 Apparent Level of AM
If we assume that the AM Test Method is extracting information from the test data which relates to AM, and that furthermore that it indicates that for 83 % of the time the level of AM is in excess of 3 dB(A), it is instructive to ask the question ‘how much AM actually is there in the data?’
This question can easily be answered by taking each one of the 154 hours of data which failed the method at Turncole, and replacing the 3 dB(A) in step 2 with the variable X (in dB(A)). X can then be varied, for each hour, to find the threshold value at which the method result changes from ‘fail’ to ‘pass’.
The results of this analysis are shown in Fig 11 (red line) and this indicates that the audio data from Turncole wind farm contains levels of AM ranging from 3 to 40 dB(A)! If 3 dB(A) were an appropriate limit for AM and if this genuinely reflected the level of AM present in the rural background noise environment at Turncole, we can only speculate about the disturbance this should cause.
Document Ref: TC01-019643 Issue: 02
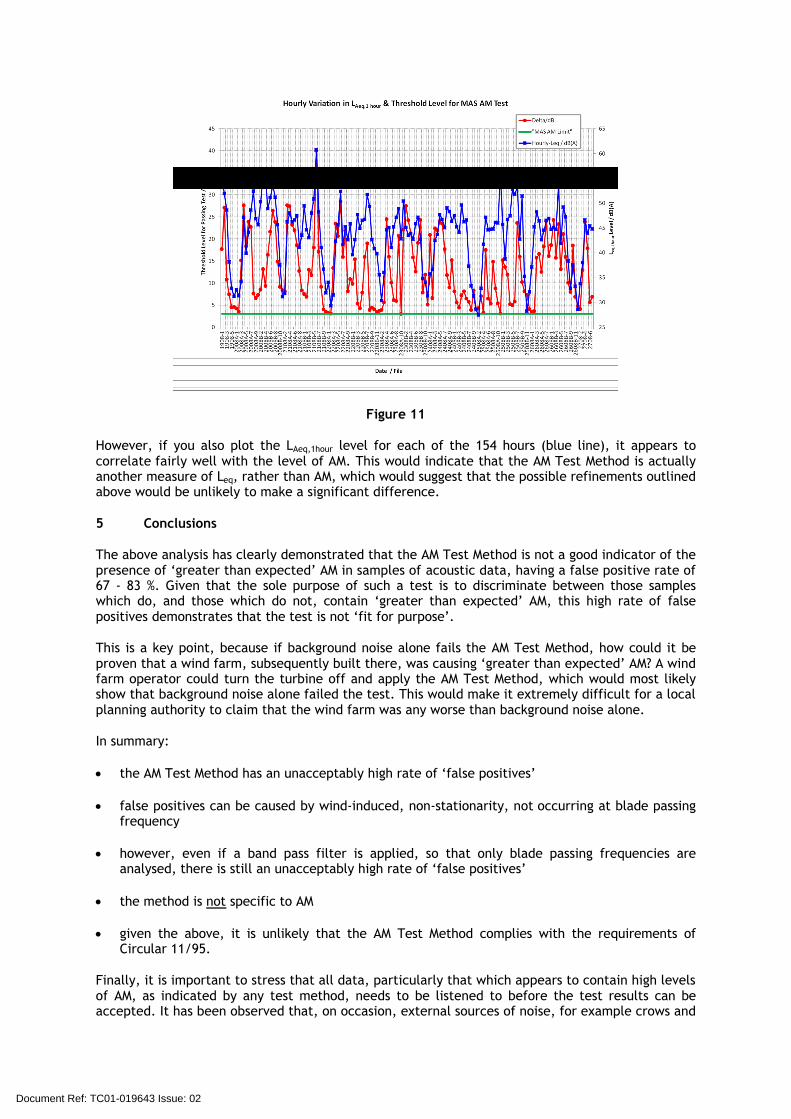
Figure 11
However, if you also plot the LAeq,1hour level for each of the 154 hours (blue line), it appears to correlate fairly well with the level of AM. This would indicate that the AM Test Method is actually another measure of Leq, rather than AM, which would suggest that the possible refinements outlined above would be unlikely to make a significant difference.
5 Conclusions
The above analysis has clearly demonstrated that the AM Test Method is not a good indicator of the presence of ‘greater than expected’ AM in samples of acoustic data, having a false positive rate of 67 - 83 %. Given that the sole purpose of such a test is to discriminate between those samples which do, and those which do not, contain ‘greater than expected’ AM, this high rate of false positives demonstrates that the test is not ‘fit for purpose’.
This is a key point, because if background noise alone fails the AM Test Method, how could it be proven that a wind farm, subsequently built there, was causing ‘greater than expected’ AM? A wind farm operator could turn the turbine off and apply the AM Test Method, which would most likely show that background noise alone failed the test. This would make it extremely difficult for a local planning authority to claim that the wind farm was any worse than background noise alone.
In summary:
the AM Test Method has an unacceptably high rate of ‘false positives’
false positives can be caused by wind-induced, non-stationarity, not occurring at blade passing frequency
however, even if a band pass filter is applied, so that only blade passing frequencies are analysed, there is still an unacceptably high rate of ‘false positives’
the method is not specific to AM
given the above, it is unlikely that the AM Test Method complies with the requirements of Circular 11/95.
Finally, it is important to stress that all data, particularly that which appears to contain high levels of AM, as indicated by any test method, needs to be listened to before the test results can be accepted. It has been observed that, on occasion, external sources of noise, for example crows and
Document Ref: TC01-019643 Issue: 02

bird scarers, may have a noise signature which ‘looks’ like AM, but which does not in fact derive from wind turbines. Unless this is done any method may throw up false positive and overstate the true frequency and severity of AM.
6 Afterword
The reason for writing this article is that the AM Test Method, which has been unequivocally shown not to be a suitable method for assessing wind turbine AM, is now being used at other wind farm sites and Planning Authorities are expressing an enthusiasm for its wider adoption.
But, if we reject the AM Test Method, what can we replace it with?
Given the results of a 2007 study which investigated the frequency and severity of AM related noise problems in the UK [6] it is entirely reasonable to suggest that no AM condition is required, especially given that the current state of knowledge makes its drafting difficult. Instead, given their rarity, AM problems could be addressed using a ‘Statutory Nuisance’ instrument.
However, it is anticipated that an alternative methodology, which is based on listening tests and is currently being developed under a RenewableUK funded research project, should be available in late 2011 [3,4].
7 References
1. ETSU, “The Assessment and Rating of Noise from Wind Farms”, The Working Group on Noise from Wind Turbines, ETSU Report for the DTI, ETSU-R-97, September 1996
2. Bass J, Bowdler D, McCaffery M & Grimes G (2011), Fundamental Research in Amplitude Modulation – a Project by RenewableUK, Fourth International Meeting on Wind Turbine Noise, Rome, 12 – 14 April 2011
3. Bullmore A, Jiggins M & Cand M (2011), Wind Turbine Amplitude Modulation: Research to Improve Understanding as to Cause & Effect, Fourth International Meeting on Wind Turbine Noise, Rome, 12 – 14 April 2011
4. Pykett, A, Appeal Decision: Land to the south east of North Tawton and the south west of Bow, Appeal Ref: APP/Q1153/A/06/2017162
5. Stigwood M (2011), Proof of Evidence On behalf of Spaldington Turbine Opposition Project ("STOP"), PINS Ref: APP/E2001/A/10/2137617/NWF & APP/E2001/A/10/2139965/NWF, May 2011
6. Moorhouse AT, Hayes M, von Hünerbein S, Piper BJ and Adams MD (2007), Research into aerodynamic modulation of wind turbine noise: final report, Technical Report URN 07/1235, Department for Business, Enterprise and Regulatory Reform, UK, July 2007.
Document Ref: TC01-019643 Issue: 02
CADEIRYDD/CHAIRMAN: MORGAN PARRY PRIF WEITHREDWR/CH IEF EXECUTIVE: ROGER THOMAS Anfonwch eich ateb at/Please reply to: Jonathan Gilpin Rhanbarth De a Dwyrain / South & East Region
Ffôn/Tel: 01686 613419 Tŷ Ladywell / Ladywell House Ffacs/Fax: 01686 629556 Stryd y Parc / Park Street Ebost/Email: [email protected] Y DRENEWYDD / NEWTOWN SY16 1RD
Mr Martin Cole Ein cyf/Our ref:DCT-13- 003008/Consultation 1792503 Unit 2, Technium Sustainable Technologies Central Avenue Baglan Energy Park Port Talbot SA12 7AX
Eich cyf/Your ref:
22th Jan 2013 Dear Martin Cole,
CLOCAENOG WINDFARM – FURTHER COMMENTS ON OHMP, PEAT REPORT AND HRA ASSESSMENT
Thank you for your further work in response to CCW previous comments dated 15th November 2012 and for this additional consultation on the above documents. CCWs comments on these documents are set out below.
Outline Habitat Management Plan (OHMP)
It is apparent that attention has been given to including many of CCWs previous comments into the revised versions of the above documents. A small number of points did not appear to get included in the revised versions and these are numbered here in correspondence with the numbering in CCWs previous response letter.
1.6.1 CCW were looking for a clear commitment to a structured programme of grey squirrel control and while a commitment has been made to augment an ongoing wider programme it does not provide confidence that funding will be made available as required to contribute towards a structured programme. Could RWE please provide further clarity on this issue.
1.7.2 CCW advised inclusion in paragraph 2.1.2 of further details relating to the Stakeholder Group. In particular a ‘terms of reference’ to include the remit of the Group and how management decision will be made would be welcomed. Could RWE please confirm its intentions in relation to this issue.
1.7.5 CCW would like to see a statement in the OHMP to say that suitably qualified persons will be employed to implement habitat and species management proposals.
1.7.6 CCW would like to see the inclusion in the OHMP of named signiatories to be involved in a Section 106 equivalent management obligation.

Peat Report
2.1.3 Could RWE confirm that maps will be included in the report to or the ES to demonstrate the peat probing depths and reduction in impacts on peat at the infrastructure locations.
2.2.1 and 2.2.3 CCW are curious as to how the average depth of 20cm of peat across the site has been derived for the impact calculation?
2.3.4 CCWs comments here conflict with our comments in 2nd para of 1.2.3. It is indeed to the west of T11 that CCW would see value to peatland restoration.
The table below taken from the Peat Depth Survey Report P103 (Annexe 8.2) shows a total peat loss off 209,373m cubed based on all peat loss due to infrastructure.
� Table 3-15 Comparison of Peat Loss Calculations
Turbines - Loss through excavation &
drainage
Tracks - Loss through excavation
& drainage
Re-use of peat - cable trench backfill Total peat loss
Area (ha) Vol (m3) Area
(ha) Vol (m3) Area (ha) Vol (m3) Area
(ha) Vol (m3)
Excluding top 0.35m
3.70 17,272 12.46 66,366 1.27 6,472 14.89 77,165
Including top 0.35m
23.59 49,790 64.39 174,640 5.61 15,057 82.38 209,373
The Carbon Calculator: m cubed
under 5a illustrates a volume of peat removed as 100,348
5c illustrates a volume affected by drainage of 61,488
Total 161,836
Could RWE please explain why the two documents appear to have conflicting figures for total peat loss and which is the correct figure to apply to the ES and the carbon calculator.
Habitats Regulations report (HRA)
The comments under this heading may form an incomplete response as the CCW Mold Office has also been consulted on this topic. If additional comments are provided from this Office we will of course forward them immediately.
CCW would agree with the assessment that only the River Dee and Bala Lake SAC are relevant to more detailed assessment. Unless the Grid line from Clocaenog to Legacy is to take place, in which case the Berwyn and Clywidian Hills SAC and Y Berwyn SPA should form part of the assessment.
The 3rd BP, Section 3.4.2 of P7 describes and additional track length of 8km of secondary access track that has not been mentioned in the totals track length figure given in the Carbon Calculator or Peat depth survey report. Could RWE please confirm if this is a length of tack requiring upgrading and if so apply one single figure for the length of track to be upgraded to the relevant documents to be submitted.
Table 2, P22 shows that brook lamprey, Altlantic salmon and bullhead are the most likely features of the River Dee and Bala Lake SAC to be effected by the proposal owing to their distribution and potential presence throughout the Alwen catchment. The main potential impacts on these species are

correctly identified as the release of sediment and pollution into the tributaries which feed the Alwen. CCW would assess there to be a high potential for impacts on these species in the absence of mitigation from felling and construction at Clocaenog.
6.2.2.9 states that turbine 32 may be within 50m of a tributary or drainage channel feeding the Alwen and that if it moves further towards the watercourse micro siting will be dictated by FCW Water Guidelines to buffer watercourses. CCW advise that FCW guidance in relation to felling by watercourses is not applicable to construction activities and CCW would expect a buffer of at least 20-30m from development impacts particularly storage of excavated soils. CCW also request that where FCW guidelines are referred to, that relevant specific guidance proposed as mitigation from such documents is quoted in the HRA Report e.g. in relation to impacts on watercourses and otter.
Cumulative assessment
In respect of Section 7, Table 3 and the details provided, CCW would agree that additional impacts likely to arise from the other proposed windfarm developments in the Alwen catchment are unlikely individually, to amount to a significant effect on the River Dee and Bala Lake SAC given adequate provision of avoidance and mitigation measures within their respective CEMPS. Confirmation of these measures are not provided in the Clocaenog HRA Report and CCW would like to see further detail in the report to confirm that suitable measures have been described in the CEMPs for these proposed developments.
In 7.1.22 it is concluded that as the construction felling will form part of the FDP felling programme in compliance with UK Forestry Standard, that there will not be a significant effect on the SAC. To be better informed of our position CCW would like more detail on the proposed management of run off from felling areas into trackside drainage which will eventually drain into the Alwen feeder streams. In addition, CCW understand that monitoring of water discolouration, sediment and pollution will be undertaken during felling operations as stated under 6.1.2.3. CCW would like the report to state who will undertake the monitoring, how often it will be undertaken. In addition what contingency remedial actions will be put in place and who will be responsible for these.
The Construction of Clocaenog; the other proposed windfarms in the Alwen catchment and the felling of 240ha of forestry in combination, mean that significant effects may be likely to occur particularly in the event of severe weather events which are now becoming and will continue to become a much more common phenomenon due to climate change. This potential occurrence needs to be taken account of in the assessment.
CCW advise that generally more specific details should be included in the HRA report on how run off from felling areas will be managed in combination with run off from construction areas and how felling and construction activities will be scheduled across the site to avoid potential impacts on the Dee SAC. CCW advise that this information will be necessary to inform the PINSs HRA assessment.
Yours sincerely,
Jonathan Gilpin Windfarm Casework Officer

Gofalu am natur Cymru - ar y tir ac yn y môr • Caring for our natural heritage - on land and in the sea
Prif Swyddfa/Headquarters MAES-Y-FFYNNON, PENRHOSGARNEDD, BANGOR LL57 2DW FFÔN/TEL: 01248 385500 FFACS/FAX: 01248 355782
http://www.ccw.gov.uk