LISBON - Massachusetts Institute of...
34
LISBON 5 . 2 . 2016 Simone Cenci Shreejay Tuladhar Sara Freitas Alpha Yacob Arsano
Transcript of LISBON - Massachusetts Institute of...

LISBON
5 . 2 . 2016Simone Cenci Shreejay Tuladhar Sara Freitas Alpha Yacob Arsano

NEIGHBORHOOD DESIGN GOAL
harmony with immediate context
connectivity with the surrounding neighborhood
accommodating social and economic interaction

PERFORMANCE DESIGN GOAL
Buildings live in average 50 – 100 years
Natural ventilation in current time and 2080
Solar electricity production
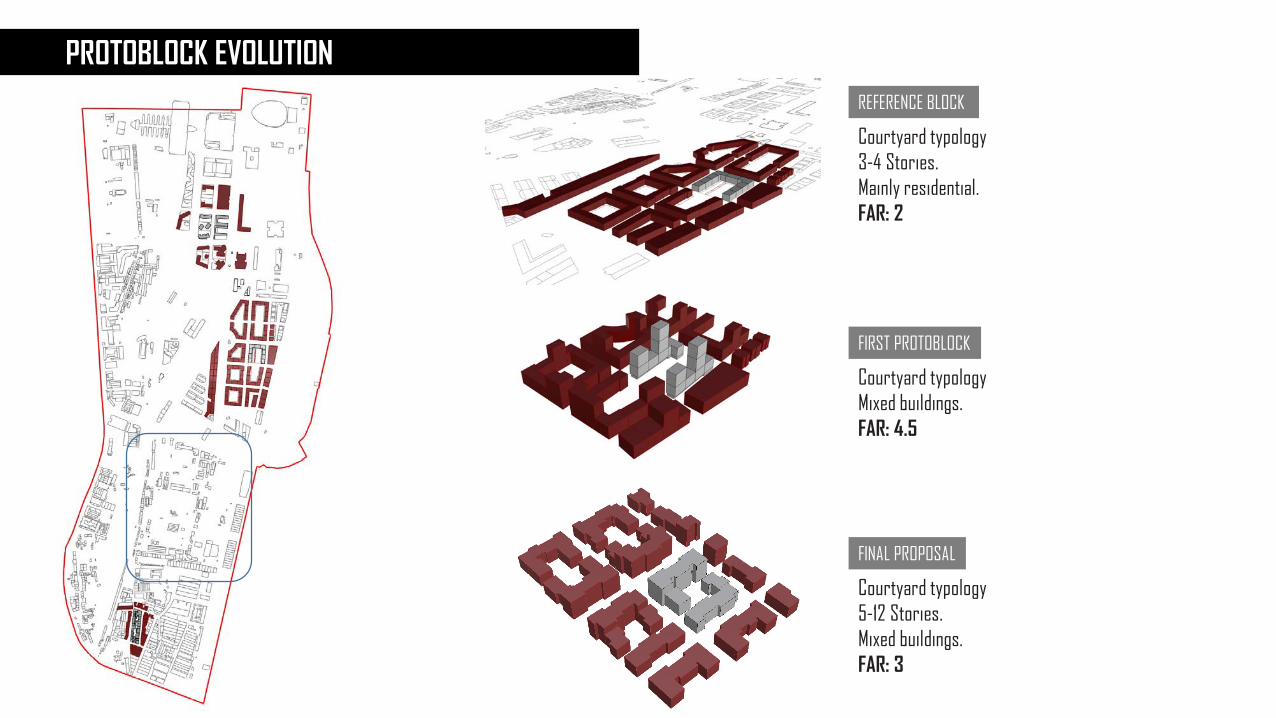
PROTOBLOCK EVOLUTION
Courtyard typology3-4 Stories.Mainly residential.FAR: 2
REFERENCE BLOCK
Courtyard typologyMixed buildings.FAR: 4.5
FIRST PROTOBLOCK
Courtyard typology5-12 Stories.Mixed buildings.FAR: 3
FINAL PROPOSAL

NEIGHBORHOOD DESIGN
BUS STATIONS
MAIN AND SECONDAYR STREETS
BIKES
GARDEN PATH
CENTRAL PARK
BAZAR / MARKET
WATER FRONT
RAILWAY AND HIGHWAY FACING BLOCKS

NATURAL VENTILATION
CURRENT CLIMATE
HOUR
OF
THE
DAY
Based on Adaptive Comfort Model92% of the year Natural Ventilation is Possible

NATURAL VENTILATION
CURRENT CLIMATE
HOUR
OF
THE
DAY
Based on Adaptive Comfort Model92% of the year Natural Ventilation is Possible
SOLAR IRRADIATION
Solar Irradiation Exposure [kWh/m2/year]
0 1800

NATURAL VENTILATION
A
C
B
N N
Windward
Leeward
Parralle to wind
Horizontal section of North-South facing building Horizontal section of East-West facing building

NATURAL VENTILATION
A
C
B
N N
Windward
Leeward
Parralle to wind
Air flowrate: 0.2m3/sOpening to Wall ratio: 1%
Wind Driven Buoyancy Driven Wind + Buoyancy Driven
Air flowrate: 0.4 m3/sOpening to Wall ratio: 7%

2m height
NATURAL VENTILATION
Wind Driven Natural Ventilation PotentialPressure Coefficient Distribution Map
Lower CP difference between opposite sidesLower potential for ventilation
Pressure Coefficient ( CP values)
-3 3

NATURAL VENTILATION
5th Floor
Wind Driven Natural Ventilation PotentialPressure Coefficient Distribution Map
Higher CP difference between opposite sidesHigher potential for ventilation
Pressure Coefficient ( CP values)
-2 2

NATURAL VENTILATION + PV
Façade PV (electricity production)
Minimum air gap between PV and facade-15 cm
Façade PV (air preheating and electricity production)
Minimum air gap between PV and facade-30 cm
Effective for NVCauses overheating Causes overheating
PV
Air Gap

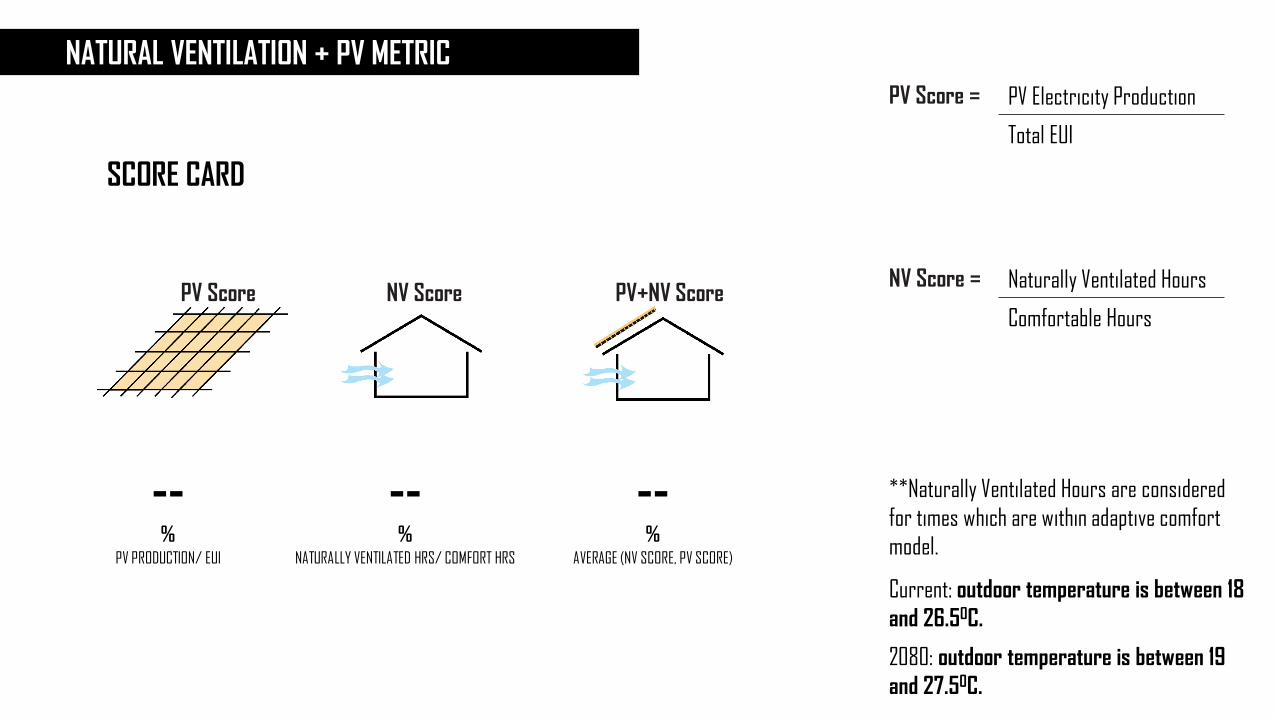
NATURAL VENTILATION + PV METRIC
Cold SeasonWarm Season
Façade PV (air preheating and electricity production)
PV PV
South and East Facade
Direct outdoor air for NV Preheated outdoor air for NV
21.5 0C 14.0 0C
23.0 0C
outsideinside
20.3 0CTemperature(°C)
42
34
26
18
10
50

PV
Crystalline Silicon PV (c-Si)
Amorphous Silicon PV (a-Si)
N
N
Roof Top PV (electricity production)
178 kWh/m2/year
130 kWh/m2/yearFaçade PV (air preheating and electricity production)
70 kWh/m2/year
Façade PV (electricity production)
15% efficiency0.45% loss per 0C
8% efficiency0.21% loss per 0C
Irradiation < 1000 kWh/m2/year
Irradiation < 1000 kWh/m2/year
75% of horizontal rooftop
1/3rd of South and East Facades
South and East Facades
NATURAL VENTILATION + PV METRIC
-- -- --% % %
PV PRODUCTION/ EUI NATURALLY VENTILATED HRS/ COMFORT HRS AVERAGE (NV SCORE, PV SCORE)
SCORE CARD
PV Electricity ProductionPV Score =
PV Score NV Score PV+NV Score
Total EUI
Naturally Ventilated HoursNV Score =
Comfortable Hours
**Naturally Ventilated Hours are considered for times which are within adaptive comfort model.
Current: outdoor temperature is between 18 and 26.50C.
2080: outdoor temperature is between 19 and 27.50C.

REGULATIONS: Natural Ventilation and PV
Prescriptive
No PV panels on first and second floors.
Crystalline Silicon PV (c-Si) used for preheating ventilation air Maximum coverage 30% of façade Minimum air gap 30cm from façade..
Crystalline Silicon PV (c-Si) used only for electricity Minimum air gap 15cm from façade.
Indoor temperature range 18oC - 27oC.
North and West facade is 1%.
Overheated hours should not exceed 20% of the year or 1750 hrs.
South and East facade is 5%.
FOR NATURALLY VENTILATED BUILDINGS FOR ALL BUILDINGS
Minimum opening to wall ratio:

REGULATIONS: Natural Ventilation and PV
Performative
Amorphous Silicon (a-Si) PV panels can be installed on the first and second floors if annual solar radiation is above 1000 kWh/m2/year.
FOR NATURALLY VENTILATED BUILDINGS FOR ALL BUILDINGS
North and West facade can be lower than 1% if:Airflow rate is 0.2 m3/sAir speed is lower than 0.8 m/s
Minimum opening to wall ratio:
South and East facade can be lower than 5% if:Airflow rate is 0.4 m3/sAir speed is lower than 0.8 m/s

CURRENT TIME 2080
HOUR
OF
THE
DAY
92% of the year Natural Ventilation is Possible 84% of the year Natural Ventilation is Possible
OverheatedNV (preheated outside air)NV (direct outside air)
ENERGY USE INTENSITY
NATURAL VENTILATION SCHEDULE BASED ON OUTDOOR TEMPRATURE

ENERGY USE INTENSITY
New schedule based on design for natural ventilation and solar energy use
Heating load reduced by using pre-heated air with building integrated PV panels
Cooling load reduced by using natural ventilation majority of the time.
Comfortable hours are improved.
OPERATION ENERGY (kWh/m2y))50 100

ENERGY USE INTENSITY
OVER HEATED HOURS
BASE CASE
CURRENT 2080
TOTAL EUI
COOLING LOAD
HEATING LOAD
OVER HEATED HOURSTOTAL EUI
COOLING LOAD
HEATING LOAD
PROPOSED USE PROFILE
2,800 hrs
69 kWh/m2
0 kWh/m2
1 kWh/m2
1,270 hrs
78 kWh/m2
10 kWh/m2
0 kWh/m2

ENERGY USE INTENSITY
OVER HEATED HOURS
BASE CASESCENARIO 1 (no cooling system) SCENARIO 2 (cooling system)
CURRENT 2080
TOTAL EUI
COOLING LOAD
HEATING LOAD
OVER HEATED HOURSTOTAL EUI
COOLING LOAD
HEATING LOAD
PROPOSED USE PROFILESCENARIO 3 (hybrid natural ventilation and cooling system)
2,800 hrs
69 kWh/m2
0 kWh/m2
1 kWh/m2
4,300 hrs
68 kWh/m2
0 kWh/m2
0 kWh/m2
0 hrs
99 kWh/m2
31 kWh/m2
0 kWh/m2
1,270 hrs
78 kWh/m2
10 kWh/m2
0 kWh/m2
650 hrs
90 kWh/m2
21 kWh/m2
0 kWh/m2

sDA- 36%
URBAN DAYLIGHT
DAYLIGHT AREA (% DA)
0 80
(200 lux)
Functional Distribution:Upper levels are prioritized for office spaces.

URBAN DAYLIGHT
Building Depth: 12m – 18mFunctional Distribution:Upper levels are prioritized for office spaces.

EMBODIED CO2
Neighborhood Embodied CO2102 kg CO2/m2
Embodied CO2 (kg CO2/m2)
80 180
Neighborhood Embodied Energy1152 kWh/m2

WALKABILITY
Existing Amenities around Project SiteWalkability Score: 8
Walkability (%)
0 100

WALKABILITY
Walkability (%)
0 100
With Proposed Amenities on Project Site
Overall Walkability Score: 58
Project Site Walkability Score: 85

FINANCIAL PERFORMANCE
OVER ALL FINANCIAL PERFORMANCE
Roof Top PV
Payback time: 11 years
*Verberne et al, 2014
Façade a-Si PV (electricity production)
Payback time: 28 years
Façade c-Si PV ( air preheating and electricity production)
Payback time: 15 years
PV INVESTMENT COST: $345/M2*
ROI (Return of Investment) Without daylight premium: 10%
With daylight premium: 14%

OUTDOOR COMFORT
Summer average hottest hour- August
Shoulder Season- April
Winter- December
Out doorTemp: 31°CGlobal Radiation: 850Wh/sq.m
Result: Strong Heat Stress
Out doorTemp: 20°CGlobal Radiation: 680Wh/sq.m
At 1300hrs
Result: No thermal Stress
Out doorTemp: 14°CGlobal Radiation: 450Wh/sq.m
Result: No thermal Stress
UTCI (°C)
25 35No thermal stress Strong heat stress
Summer- August
Buildings create shading for comfortable outdoor walkways.
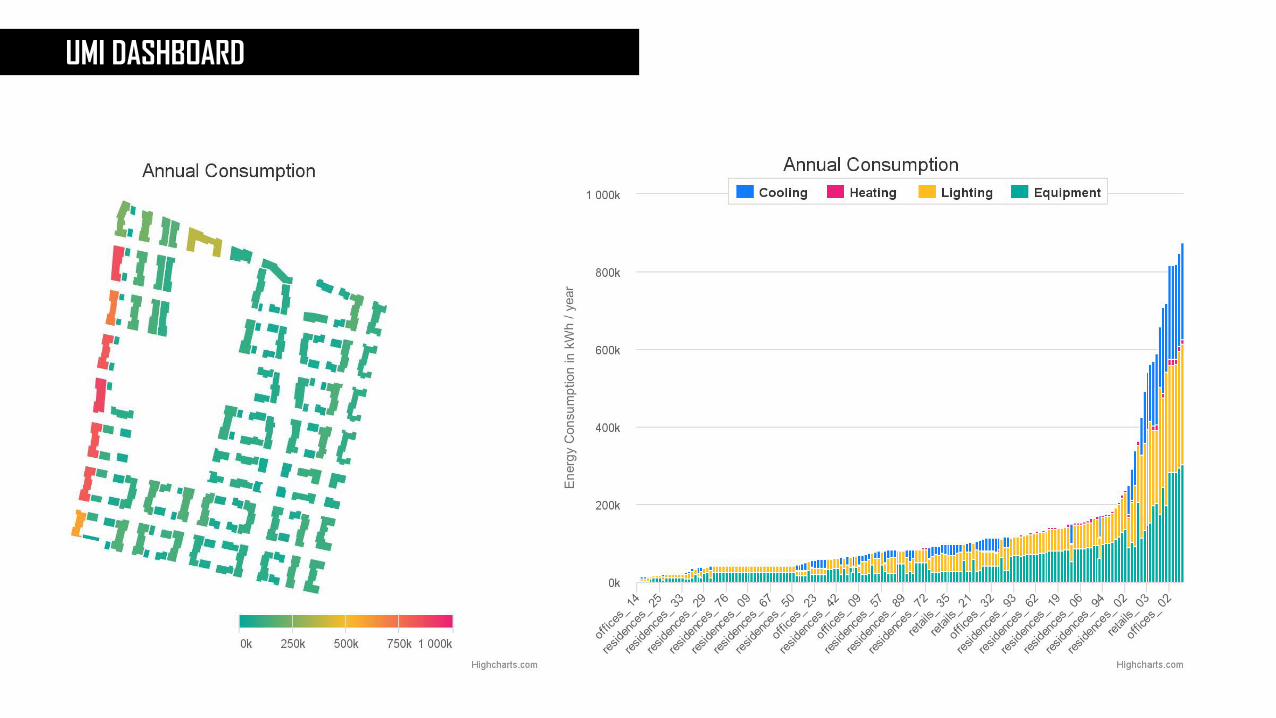
UMI DASHBOARD

NATURAL VENTILATION + PV METRIC
15 100 58% % %
PV PRODUCTION/ EUI NATURALLY VENTILATED HRS/ COMFORT HRS AVERAGE SCORE OF NATURAL VENTILATION AND PV PRODUCTION
CURRENT TIME
Similar importance weight is given for natural ventilation and PV electricity production.
IMPORTANCE WEIGHTPV Score NV Score PV+NV Score

NATURAL VENTILATION + PV METRIC
13 86 62% % %
PV PRODUCTION/ EUI NATURALLY VENTILATED HRS/ COMFORT HRS AVERAGE SCORE OF NATURAL VENTILATION AND PV PRODUCTION
2080Similar importance weight is given for natural ventilation and PV electricity production.
(importance weight - 1) (PV Score* PV Importance weight) +
(NV Score* NV Importance weight)total weight
Impo
rtanc
e weig
ht
NV-PV Score:
PV Score NV Score PV+NV Score
(importance weight - 2)

243,500390,000
0.0290.055
Land area (m2)Building area (m2)Residents (pp/m2 land)Workers (pp/m2 land)
82 1152 795 36 85 14kWh/m2y kWh/m2 kgCO2/m2 % DA % WS % ROI
OPERATION ENERGY EMBODIEDENERGY (50y)
BUILDING GHG EMISSIONS (50y) DAYLIGHTAREA
WALKABILITYSCORE
FINANCIALRETURN (1y)
PVENT LISBONV

CONCLUSIONS
Lisbon’s Mediterranean climate has good potential for natural ventilation.
Current Climate: 92% of the year (overheated hours 690 hrs)
2080: 80% of the year (overheated hours 1380 hrs)
Current buildings to consider increased cooling loads in changed climate
Current Cooling Load: 10kWh/m2
2080: 20kWh/m2
BIPV can be used to preheat air in Winter
Heating Load Reduced to 0kWh/m2 during sunshine hours

OBRIGADO!