Liquidity, Risk Appetite and Exchange Rate Movements ...
23
Working Paper 11/2009 29 June 2009 LIQUIDITY , RISK APPETITE AND EXCHANGE RATE MOVEMENTS DURING THE FINANCIAL CRISIS OF 2007-2009 Prepared by Cho-Hoi Hui, Hans Genberg and Tsz-Kin Chung* Research Department Abstract Given the deleveraging process in the banking sector, banks were reluctant to lend funds in the interbank market because of uncertainty about their own future need for funds during the financial crisis of 2007 - 2009. Aggregate liquidity then declined. This paper investigates the impact of the market-wide liquidity risk and carry-trade incentives on exchange rate movements. The results suggest that liquidity risk measured by the spread between LIBOR and the overnight index swap rate was a significant factor affecting the exchange-rate movements of the euro, British pound and Swiss franc, while carry trades were important for the Japanese yen, Australian dollar and New Zealand dollar. JEL classification: F31; F32; F33 Key words: Sub-prime crisis; carry trades; liquidity; leverage Author’s E-Mail Address: [email protected]; [email protected]; [email protected] * The authors gratefully acknowledge Charles Calomiris, Yin-Wong Cheung, Anella Munro, Shang-Jin Wei and the participants at the conferences on “The Global Financial Turmoil and the Evolving Financial Interdependence in Asia” organised by Columbia University, Lingnan University and the Hong Kong Institute for Monetary Research and “Exchange Rate Systems and Currency Markets in Asia” organised by Keio University, Financial Services Agency and the Asian Development Bank Institute for their helpful suggestions and comments on the note “The Link between FX Swaps and Currency Strength during the Credit Crisis of 2007-2008” of this paper. The views and analysis expressed in this paper are those of the authors, and do not necessarily represent the views of the Hong Kong Monetary Authority.
Transcript of Liquidity, Risk Appetite and Exchange Rate Movements ...

Working Paper 11/2009
29 June 2009
LIQUIDITY, RISK APPETITE AND EXCHANGE RATE MOVEMENTS
DURING THE FINANCIAL CRISIS OF 2007-2009
Prepared by Cho-Hoi Hui, Hans Genberg and Tsz-Kin Chung*
Research Department
Abstract
Given the deleveraging process in the banking sector, banks were reluctant to lend funds
in the interbank market because of uncertainty about their own future need for funds
during the financial crisis of 2007 - 2009. Aggregate liquidity then declined. This
paper investigates the impact of the market-wide liquidity risk and carry-trade incentives
on exchange rate movements. The results suggest that liquidity risk measured by the
spread between LIBOR and the overnight index swap rate was a significant factor
affecting the exchange-rate movements of the euro, British pound and Swiss franc, while
carry trades were important for the Japanese yen, Australian dollar and New Zealand
dollar.
JEL classification: F31; F32; F33
Key words: Sub-prime crisis; carry trades; liquidity; leverage
Author’s E-Mail Address:
[email protected]; [email protected]; [email protected]
* The authors gratefully acknowledge Charles Calomiris, Yin-Wong Cheung, Anella Munro, Shang-Jin Wei
and the participants at the conferences on “The Global Financial Turmoil and the Evolving Financial
Interdependence in Asia” organised by Columbia University, Lingnan University and the Hong Kong
Institute for Monetary Research and “Exchange Rate Systems and Currency Markets in Asia” organised
by Keio University, Financial Services Agency and the Asian Development Bank Institute for their
helpful suggestions and comments on the note “The Link between FX Swaps and Currency Strength
during the Credit Crisis of 2007-2008” of this paper.
The views and analysis expressed in this paper are those of the authors, and do not
necessarily represent the views of the Hong Kong Monetary Authority.

- 2 -
EXECUTIVE SUMMARY
• During the crisis started in August 2007, the US dollar has seen some remarkable
swings against major currencies. At the same time, banks reportedly faced severe
liquidity problems. US-dollar funding shortages put intense pressure on the balance
sheet capacity of the banking sector due to financial sector deleveraging. Banks were
reluctant to lend funds in the interbank market because of uncertainty about their own
future need for funds. Aggregate liquidity then declined.
• This paper investigates the impact of the market-wide liquidity risk and carry-trade
incentives on exchange-rate movements. The estimation results suggest that the
liquidity risk measured by the LIBOR-OIS spread was a significant factor affecting the
exchange-rate movements of the euro, British pound and Swiss franc against the US
dollar, while carry trades were important for the Japanese yen, Australian dollar and
New Zealand dollar. The economic significance of the market-wide liquidity problem
and carry trades surged after the Lehman default. This reflects that the exchange
rates were more sensitive to the liquidity problem and risk appetite when the crisis
deepened.
• The results show that the market-wide liquidity problem in the US dollar due to the
financial-sector deleveraging associated with the increase in the US-dollar
LIBOR-OIS spread put pressure on the US dollar to depreciate. Conversely, the
liquidity problem in other currencies tended to be linked with an appreciation of the
US dollar. This finding is consistent with the theory that contraction of US
intermediary balance sheets will be associated with a drop in risk appetite. This
drives up the market price of risk on risky assets in foreign currencies that increase
their expected returns, implying a future appreciation of risky currencies (i.e. a dollar
depreciation against such risky currencies).

- 3 -
I. INTRODUCTION
The sub-prime crisis emerged in the United States in mid-2007 and spilled
over to Europe and other economies. From mid-2007 to mid-2008, the spillovers were
relatively modest. The situation began to change in mid-2008. Then, following the
bankruptcy of Lehman Brothers in mid-September 2008, developments took a dramatic
turn leading to a global financial crisis. During the crisis, the US dollar has seen some
remarkable swings against major currencies. For example, from September 2007 to
March 2008, it depreciated about 16% against the euro and yen, while between March and
September 2008, it gained sharply (22%) against the euro. On the other hand, the dollar
depreciated against the yen about 21% from August to December 2008, in particular after
the Lehman’s default (see Figure 2 below). During this crisis, banks reportedly faced
severe liquidity problems. US dollar funding shortages put intense pressure on the
balance sheet capacity of the banking sector due to financial-sector deleveraging.
In response central banks around the world took unprecedented policy measures to supply
funds to the banks (see McGuire and von Peter, 2009).
The purpose of this paper is to investigate any link between the
market-wide liquidity risk caused by the deleveraging process and exchange-rate
movements during the crisis. Adrian and Shin (2008) document that aggregate liquidity
can be understood as the rate of growth of the aggregate financial-sector balance sheet.
When asset prices increase, financial intermediaries’ balance sheets generally become
stronger, and, without adjusting asset holdings, their leverage declines. The financial
intermediaries then hold surplus capital which they use to expand their balance sheets.
On the liability side, they take on more short-term debt. On the asset side, they search
for potential borrowers. Aggregate liquidity is intimately tied to how hard the financial
intermediaries search for borrowers, including through the interbank market. Conversely,
when asset prices decline during a financial crisis, the financial intermediaries’ balance
sheets contract and are thus reluctant to lend. Aggregate liquidity then declines.
Spreads of interbank interest rate over overnight index swap (OIS) in the
US as well as Europe, the UK and Japan widened substantially in August 2007, and then
persisted at high levels during the financial crisis in 2007 - 2009.1 The rise in spreads
could represent heightened perceived default risk or greater compensation demanded by
risk-averse investors against the risk of default. Alternatively, it could represent a risk
premium demanded by investors to induce them to hold comparatively illiquid assets.
Schwarz (2009) constructs new microstructure measures of credit and market liquidity and
find that liquidity effects explain more than two-thirds of the widening of one- and
three-month euro LIBOR-OIS spreads. Taylor and Williams (2009) find that while
counterparty risk is a key factor in the movements in the term-lending spreads including
1 The structure of OISs is discussed in the following section.

- 4 -
LIBOR-OIS spreads, they do not rule out that liquidity has been reduced by the increase in
counterparty risk since the crisis began. The argument is that banks are reluctant to lend
funds in the interbank market because of uncertainty about their own future need for funds,
perhaps because of concerns about risk in their own balance sheet.
According to the theory in Adrian and Shin (2008), when the asset prices
declined during the crisis, banks were reluctant to lend in the interbank market. This in
turn would reduce market liquidity and require a higher risk premium (i.e. higher
aggregate price of risk) for lending with longer maturity (which is more illiquid).
Their reluctance to lend to each other in money markets at longer maturity should also
contribute to the rise in spreads between the term and overnight interbank lending.
The LIBOR-OIS spread is therefore an appropriate measure of the market-wide liquidity
risk. Figure 1 shows the negative relationship between the leverage of US banks and the
spread of three-month US dollar LIBOR over OIS during 2007 - 2008.
The abrupt escalation of the crisis during 2008 marked an important turning
point for the exchange rates of many currencies. Traders, bankers, and economists often
attribute these exchange rate movements to a decline in risk appetite (i.e. an increase in
market-wide risk premium of holding risky assets), in particular due to the unwinding of
carry trades (i.e. decline in “carry-trade incentives”). As the market-wide liquidity
problem due to US-dollar funding shortages also occurred during this period, the risk
spreads of interbank interest rate over OIS should also explain these exchange-rate
movements, if the theory in Adrian and Shin (2008) is correct. Against this background,
this paper investigates the contribution of the market-wide liquidity risk on the one hand,
and “carry-trade incentives” on the other, to the value of the US dollar against several
currencies during the crisis.
A related paper by Hattori and Shin (2009) studies the conjunction of
deteriorating credit conditions in the US and the weakness of the dollar against the yen in
the early stages of the credit crisis of 2007 - 2008. They argue that the carry trade should
be viewed in the broader context of global credit conditions. Both can be thus seen as
consequences of financial sector deleveraging in the US. However, our paper makes a
distinction between exchange-rate movements that are caused by market-wide liquidity
risk (itself a consequence of the deleveraging process) and those that were due to carry
trades. We view the latter as being the result of changes in risk appetite of participants in
the foreign exchange market. We include the exchange rate movements of the euro,
British pound, Swiss Franc, Japanese yen, Australian dollar and New Zealand dollar
against the US dollar in the study.
The remainder of this paper is organised as follows. The next section
describes the measures of market-wide liquidity risk and carry-trade incentives. Section
III discusses the data used and the model specification. Section IV presents the
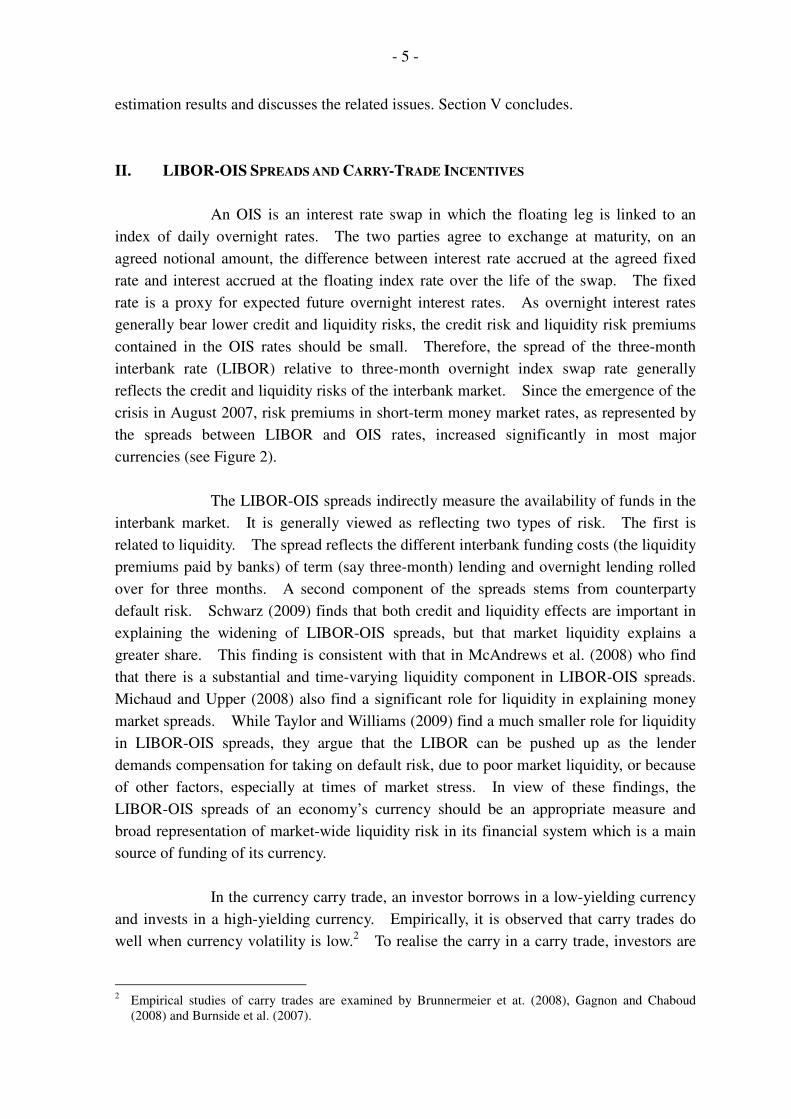
- 5 -
estimation results and discusses the related issues. Section V concludes.
II. LIBOR-OIS SPREADS AND CARRY-TRADE INCENTIVES
An OIS is an interest rate swap in which the floating leg is linked to an
index of daily overnight rates. The two parties agree to exchange at maturity, on an
agreed notional amount, the difference between interest rate accrued at the agreed fixed
rate and interest accrued at the floating index rate over the life of the swap. The fixed
rate is a proxy for expected future overnight interest rates. As overnight interest rates
generally bear lower credit and liquidity risks, the credit risk and liquidity risk premiums
contained in the OIS rates should be small. Therefore, the spread of the three-month
interbank rate (LIBOR) relative to three-month overnight index swap rate generally
reflects the credit and liquidity risks of the interbank market. Since the emergence of the
crisis in August 2007, risk premiums in short-term money market rates, as represented by
the spreads between LIBOR and OIS rates, increased significantly in most major
currencies (see Figure 2).
The LIBOR-OIS spreads indirectly measure the availability of funds in the
interbank market. It is generally viewed as reflecting two types of risk. The first is
related to liquidity. The spread reflects the different interbank funding costs (the liquidity
premiums paid by banks) of term (say three-month) lending and overnight lending rolled
over for three months. A second component of the spreads stems from counterparty
default risk. Schwarz (2009) finds that both credit and liquidity effects are important in
explaining the widening of LIBOR-OIS spreads, but that market liquidity explains a
greater share. This finding is consistent with that in McAndrews et al. (2008) who find
that there is a substantial and time-varying liquidity component in LIBOR-OIS spreads.
Michaud and Upper (2008) also find a significant role for liquidity in explaining money
market spreads. While Taylor and Williams (2009) find a much smaller role for liquidity
in LIBOR-OIS spreads, they argue that the LIBOR can be pushed up as the lender
demands compensation for taking on default risk, due to poor market liquidity, or because
of other factors, especially at times of market stress. In view of these findings, the
LIBOR-OIS spreads of an economy’s currency should be an appropriate measure and
broad representation of market-wide liquidity risk in its financial system which is a main
source of funding of its currency.
In the currency carry trade, an investor borrows in a low-yielding currency
and invests in a high-yielding currency. Empirically, it is observed that carry trades do
well when currency volatility is low.2 To realise the carry in a carry trade, investors are
2 Empirical studies of carry trades are examined by Brunnermeier et at. (2008), Gagnon and Chaboud
(2008) and Burnside et al. (2007).

- 6 -
required to hold the position for some time. If the foreign rate is FCr and the domestic
rate is r, then the return to the carry trade is proportional to ( )TrrFC − , where T is the
holding period. The risk to the carry trade is an adverse price movement in the level of
the exchange rate. Bhansali (2007) argues that carry trades are essentially short volatility
and documents that option based carry trades yield excess returns. The carry per unit of
volatility, also know as the carry-to-risk ratio, ( )[ ]impFC rr σ/− , where impσ is the
option-implied volatility, determines the relative attractiveness of entering into the carry
trade. When this ratio is large in absolute terms (i.e. the difference between fcr and r is
large or impσ is small), the carry trade is attractive (true option cost is low). Otherwise,
the carry trade is unattractive (true option cost is high). This ratio is used as a measure of
“carry-trade incentives” to estimate the link between carry trades and the swings in
exchange rates during the crisis.
Currency options are often used to implement strategies on the future
direction of foreign exchange rate movements. Risk reversal is a directional option
strategy that is the implied volatility of an out-of-the money call option minus the implied
volatility an equally out-of-the-money put. If the risk-neutral distribution of the
exchange rate is negatively (positively) skewed, the price of the risk-reversal is negative
(positive). Hence, the risk reversal measures the combined effects of expected skewness
and a skewness risk premium. The expectation of potential appreciation (depreciation) of
a currency against the US dollar generates negative (positive) skewness in the conditional
distribution of currency returns when the currency price is quoted as units of foreign
currency per US dollar.3 Brunnermeier et al. (2008) find a close relationship between the
physical skewness measure and the option-implied skewness. As the expectation of
depreciation or appreciation of currencies may affect the exchange-rate movements, this
paper uses the risk reversal as a control variable for the estimations.
III. DATA AND MODEL SPECIFICATION
We collect daily nominal exchange rates to the US dollar (USD) from
9 August 2007 to 31 March 2009 for six currencies: Australian dollar (AUD), British
pound (GBP), euro (EUR), Japanese yen (JPY), New Zealand dollar (NZD) and Swiss
franc (CHF).4 We denote the nominal exchange rate as units of foreign currency per US
dollar. The goal of the study is to identify whether the market-wide liquidity risk and the
3 Both options that form the risk reversal can be priced using the Garman and Kohlhagen (1983) formula,
which is a modified Black-Scholes formula taking into account that both currencies pay a continuous
yield given by their respective interest rates. Inputting the implied volatility and other parameters into the
Garman and Kohlhagen (1983) formula gives the option price in dollar terms, but the options are quoted
in terms of implied volatility. 4 We follow Taylor and Williams (2009) and choose 9 August 2007 to mark the inception of the turmoil,
when BNP Paribas frozen redemptions for three of its investment funds.

- 7 -
carry-trade incentives are important factors explaining exchange rate movements during
the crisis. The liquidity risk is measured by the three-month LIBOR-OIS spread.
The exchange rate and interest rate data are from Bloomberg.
The carry-to-risk ratio, defined as ( )[ ]impUSDFC rr σ/− , is used as a proxy
for carry trade incentives, where USDr is USD LIBOR, FCr is the foreign currency
LIBOR and impσ is the at-the-money foreign exchange option-implied volatility at the
three-month tenor.5 We use data on foreign-exchange options to measure the risk-neutral
skewness (risk reversal). Specifically, we obtain data on quotes of 25-delta three-month
risk reversals.6 The option data are from JPMorgan Chase. Descriptive statistics of these
variables are reported in Table 1.
To identify the roles of the market-wide liquidity and carry-trade incentives
for exchange rate movement during the financial crisis, we estimate the following multiple
regression:7
t
FC
t
USD
ttttt LSSLSSctrrrRR εβββββα +∆+∆+∆+∆++= − 543211 (1)
with the variance equation specified as:
( )2,0~ tt N σε
( ) ( )
−+++=
−
−
−
−− π
σ
εη
σ
εγσβασ /2lnln
1
1
1
12
1
2
t
t
t
t
tt , (2)
where tR is the daily log-return of the foreign exchange rate (as unit of foreign currency
per US dollar), trr is the risk-reversal prices, tctr is the carry-to-risk ratio, USD
tLSS and
FC
tLSS are the LIBOR-OIS spreads for USD and the foreign currency (FC) respectively.
The first lag of the daily return of the exchange rate is included in the estimation to
remove the serial correlation of the residuals, and the EGARCH(1,1) model proposed by
Nelson (1991) is employed to capture the clustering and asymmetry in volatility, which are
typical characteristics of financial time series during a turmoil period. The model is then
5 As in Brunnermeier et at. (2008), the carry-to-risk ratio here does not correspond to the typical carry-trade
position (say AUD-JPY pair) taken by market participants. However, this definition allows a more
systematic discussion in the context of multi-currency analysis. 6 Taking the derivative of the option price with respect to the spot exchange rate gives the option delta. An
at-the-money call with exercise price at the current forward exchange rate has a call delta of about a half,
that is, the option price reaction is only half of the change in the underlying exchange rate. The 25-delta
refers to how far out of the money the options are, namely the strike of the call is at a call delta of 0.25,
and the strike of the put is at a call delta of 0.75. 7 The Augmented Dickey-Fuller test suggests that most of the variables are non-stationary in level but
stationary in their first-differences form.

- 8 -
estimated by maximum likelihood estimation.
As a positive value of risk reversal (i.e. positive skewness) indicates an
expected depreciation of the foreign currency, the expected sign for 2β is therefore
positive. Regarding the carry-to-risk ratio, when ( ) 0<− USDFC rr so that the US dollar
is the investment currency, the increase in tctr implies a decline of carry-trade incentives
which leads to the depreciation of the US dollar. When ( ) 0>− USDFC rr so that the US
dollar is the funding currency, the increase in tctr implies an increase in carry-trade
incentives. This also leads to the depreciation of the US dollar. Therefore, the effect of
the carry-to-risk ratio is negative to the currency return tR , i.e. 3β is negative.8
Adrian et al. (2009) propose that growth of intermediary balance sheets will
be associated with innovations in risk appetite. When balance sheets expand, there is an
increase in risk appetite and risky asset prices are driven up. This drives down the
market price of risk on risky assets in foreign currencies that decrease their expected
returns, implying a future depreciation of such risky currencies (i.e. a dollar appreciation
against such risky currencies). If this theory is correct, one would expect to see the
reduced appetite for risk to be associated with deleveraging of US financial intermediary
balance sheets in the crisis during 2007 - 2009 followed by subsequent dollar
depreciations. In this context and assuming financial intermediaries in an economy are
the main source of funding of its currency, an increase in the USD LIBOR-OIS spread
reflects the reduced risk appetite of financial intermediaries in the US, which implies a
future appreciation of the foreign currency because of the increased equilibrium risk
premium on foreign assets. Therefore, the impact of the change in USD LIBOR-OIS
spread ( USD
tLSS ) is negative on the currency return (i.e. depreciation of USD and 4β is
negative), while that of the change in FC LIBOR-OIS spread ( FC
tLSS ) is expected to be
positive (i.e. appreciation of USD and 5β is positive).
IV. ESTIMATION RESULTS
The estimation results are reported in Tables 2a-f. Due to the increasing
volatility and the wide-range of unprecedented policy measures after the default of the
Lehman Brothers, we split the sample period into sub-periods with the first period from
9 August 2007 to 12 September 2008 (upper panel) and the second period from
15 September 2008 to 31 March 2009 (lower panel). The estimated coefficients (in bold)
8 Against the US dollar, the investment currency (e.g., AUD and NZD) which has a relatively high nominal
interest rate has a positive carry-to-risk ratio, while the currency (e.g. JPY and CHF) with a low nominal
interest rate exhibits a negative ratio.

- 9 -
for the mean equation and the corresponding p-values are reported underneath.9
To identify the relative importance of the market-wide liquidity measures (the LIBOR-OIS
spreads) and the carry-trade incentives (the carry-to-risk ratio), we explore different
restricted specifications of Equation (1).10
Using the log-likelihoods of these alternative
specifications, we can identify whether the inclusion of new variables significantly
improves the explanatory power of the model based upon the log-likelihood ratio (LR)
test.11
In particular, the LR-test statistics for the restricted specification which excludes
the liquidity measures (i.e. impose 043 == ββ ) over the unrestricted specification in
Equation (1) are reported.
Among the six currencies, the estimated coefficients for the risk reversal
are all significant with the expected positive sign, indicating market expectation is an
important determinant of exchange rate movements. This also verifies its role as an
appropriate control variable. The carry-to-risk ratio shows the expected impact on the
exchange-rate movements and is statistically significant under most circumstances.
As expected, the carry-trade incentive is an important factor related to the exchange rate
movements of JPY, AUD and NZD, which are commonly regarded as major carry-trade
currency pairs.12
However, the carry-trade incentive is not significant for EUR in the
second part of the sample.
Tables 2a - c show that the effect of the market-wide liquidity risk
measured by the LIBOR-OIS spreads on the three major European currencies (EUR, GBP
and CHF) is significant (except the CHF LIBOR-OIS spread in the period before the
Lehman default). The estimated coefficients for the USD LIBOR-OIS spread are
negative, while the coefficients for the FC LIBOR-OIS spreads are positive. The result is
consistent with the expected signs based on the theory proposed by Adrian et al. (2009) in
the previous section. For the first period, the inclusion of market-wide liquidity
9 The estimations results for the variance equations are available upon request. As reported in Table 2, the
Ljung-Box Q statistics for the autocorrelation of the standardized and squared standardised residuals are
found to be insignificant, suggesting that the residuals of the estimation are adequately fitted and potential
bias in the standard errors are removed. 10
These alternative specifications also allow us to detect the potential multi-collinearity of the explanatory
variables. 11
The LR test makes a decision between two hypotheses (H0 versus H1) based on the likelihood ratios of the
maximum probabilities under these two hypotheses. The LR-test statistic is denoted by:
LR = - 2 [log(LR) - log(LU)], where LR and LU are the likelihood for the restricted and unrestricted
specification. The LR statistic has an asymptotic chi-square distribution with degrees of freedom equal to
the number of restrictions (the number of added variables). The 5% confidence interval for the chi-square
distribution with degree of freedom 1 and 2 are 3.84 and 5.99 respectively. 12
Brunnermeier et al. (2008) argue that the risk reversals may contain information about carry-trade
activities as out-of-the-money currency options are often used to hedge the downside risk of the carry
trades. However, it is difficult to separate the contributions of pure market expectation from the effect
of carry-trade activity on traditional carry-trade currencies such as JPY, AUD and NZD. For these
currencies, the estimation results suggest potential collinearity between the risk reversal and carry-to-risk
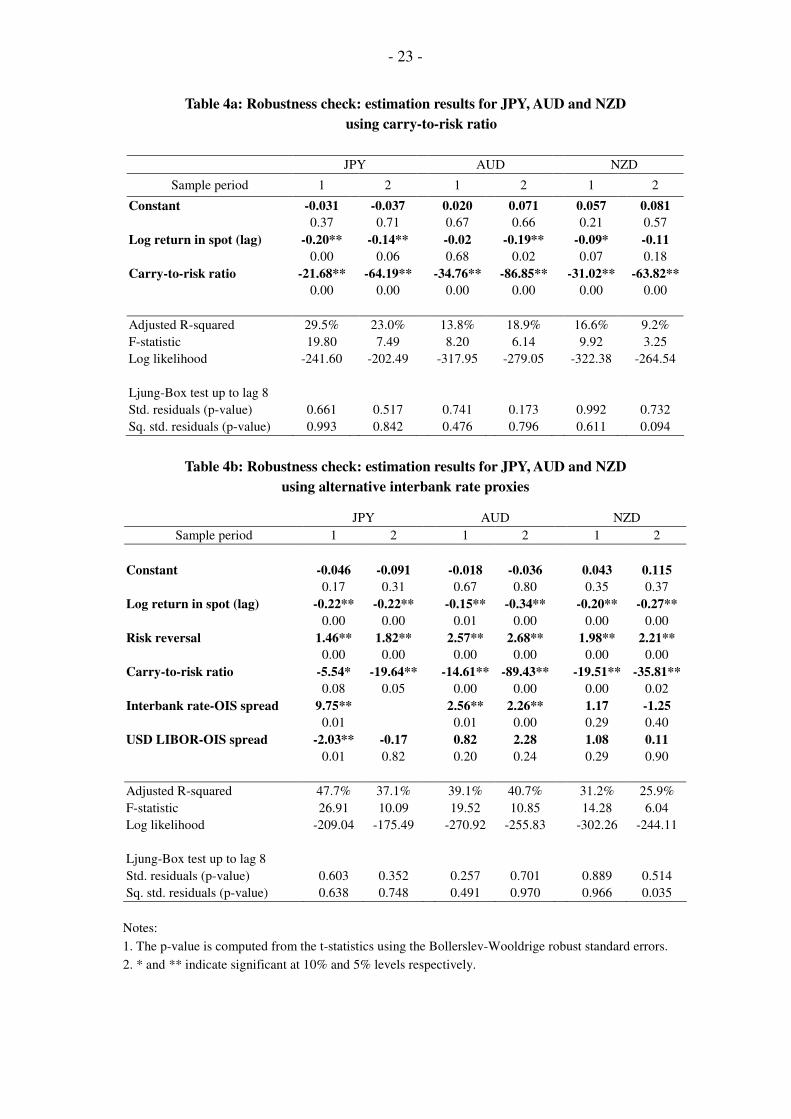
ratio. As a robustness check, we have dropped out risk reversal to study the direct impact of the carry
trade incentives. The results suggest that the carry-trade factor alone explains roughly 15% to 20% of
the currency returns. The estimation results are reported in Table 4a.

- 10 -
measures provides additional explanatory power of 2.0% for EUR, 4.7% for GBP and
5.4% for CHF. After the Lehman default, the additional explanatory power for EUR and
CHF has reduced slightly to 0.5% and 4.6% respectively, while that for GBP increased
marginally to 5.2. The reduced impact is possibly due to the unprecedented policy
measures introduced by central banks around the world to provide funding and enhance
market liquidity. Nevertheless, the LR test suggests that the LIBOR-OIS spreads are
statistically significant factors to explain the daily returns of the three currencies, both
before and after the Lehman default.
For JPY, AUD and NZD, the LIBOR-OIS spreads show mixed impacts on
the exchange rate movements in Tables 2d-f. The effect of the LIBOR-OIS spreads on
the exchange-rate movements of AUD and NZD is in general insignificant. After the
Lehman default, the impact of the liquidity became relatively more significant for AUD.
However, the effect is marginal in comparison with the carry-trade factor and the LR tests
suggest that these liquidity variables do not parsimoniously improve the explanatory
power. For JPY, the major determinant of the exchange-rate movement is the carry-trade
factor. Before the Lehman default, while the LR test suggests that the LIBOR-OIS
spreads has statistically significant contribution, the increase in the explanatory power is
only marginal (increased by 2.4% from 44.1% to 46.5%). After that, the contribution of
the market-wide liquidity virtually disappeared as the unwinding of carry trades dominated
the foreign exchange movements.
The estimation results suggest that the market-wide liquidity risk has a
significant impact on the exchange-rate movements of EUR, GBP and CHF during the
financial crisis. To better understand the relative economic importance of the
LIBOR-OIS spreads and the carry-trade incentives, we use the estimated coefficients in
Table 2 (the unrestricted specification (i)) to measure the exchange-rate movement in
response to a one standard-deviation change in the LIBOR-OIS spreads and the
carry-to-risk ratio respectively.13
As shown in Table 3, the economic significance of the
USD LIBOR-OIS spread is slightly higher than the carry-trade incentives for EUR and
CHF, while the impact of the FC LIBOR-OIS spread is the smallest among the three for
the three currencies. During this crisis period, banks reportedly faced severe liquidity
problems in particular the US-dollar funding shortages due to financial-sector
deleveraging. This explains why the USD LIBOR-OIS spread has a larger impact on the
swings of the exchange rates. It is noted that the economic significance of all the three
variables rose sharply after the Lehman default, suggesting that the exchange rates were
more sensitive to the liquidity problem and risk appetite when the crisis deepened.
As a robustness check, we use different proxies for the interbank rates,
13
It should be noted that this exercise has not taken into account the interaction between the explanatory
variables. Therefore, it only provides indicative information about the true economic significance of these
variables.

- 11 -
including the TIBOR for JPY and the bank-bill rates for AUD and NZD. The onshore
nature of these interbank rates suggests that these variables may contain more relevant
information on the country-specific liquidity conditions.14
The estimation results in
Table 4b show that the onshore interbank-rate proxies are better able to explain the
exchange-rate movements as reflected by the improvement in the significance of estimated
coefficients and explanatory powers (by 3.2% for AUD and 1.2% for JPY for the first
period). Nevertheless, the overall results are qualitatively the same as those reported in
Tables 2d-f. Estimations based on data at the one-month and six-month tenors for
LIBOR-OIS spreads, carry-to-risk ratios and risk reversals are conducted for the
robustness tests. The results are similar to those based on the data at the 3-month tenor.15
V. CONCLUSION
Given the deleveraging process in the banking sector, banks were reluctant
to lend funds in the interbank market because of uncertainty about their own future need
for funds during the financial crisis of 2007 - 2009. The aggregate liquidity then
declined. This paper investigates the impact of the market-wide liquidity risk and
carry-trade incentives on exchange-rate movements. The estimation results suggest that
the liquidity risk measured by the LIBOR-OIS spread was a significant factor affecting the
exchange-rate movements of the euro, British pound and Swiss franc, while carry trades
were important for the Japanese yen, Australian dollar and New Zealand dollar. The
economic significance of the market-wide liquidity and carry trades surged after the
Lehman default. This reflects that the exchange rates were more sensitive to the liquidity
problem and risk appetite when the crisis deepened.
The results show that the market-wide liquidity problem in the US dollar
due to the financial-sector deleveraging associated with the increase in the US-dollar
LIBOR-OIS spread put pressure on the US dollar to depreciate. Conversely, the liquidity
problem in other currencies will push the US dollar up against those currencies. This
finding is consistent with the theory proposed in Adrian et al. (2009) that contraction of
the US intermediary balance sheets will be associated with a drop in risk appetite.
This drives up the equilibrium risk premium on risky assets in foreign currencies,
implying a future appreciation of risky currencies (i.e. a dollar depreciation against such
risky currencies).
14
TIBOR is the Tokyo Interbank Offered Rate set at 11:00 am Tokyo time. The bank bill-rates for AUD
and NZD are the interest rate swap reference rates. 15
The results are available upon request.

- 12 -
REFERENCES
Adrian T., Shin H. S. 2008. Liquidity and leverage. Journal of Financial Intermediation,
doi:10.1016/j.jfi.2008.12.002.
Adrian T., Etula E., Shin H. S. 2009. Risk Appetite and Exchange Rates. Staff Reports,
Number 361, Reserve Bank of New York.
Bhansali V. 2007. Volatility and the Carry Trade," Journal of Fixed Income 17(3), 72-84.
Brunnermeier M. K., Nagel, S., Pedersen L. H. 2008. Carry Trades and Currency Crashes.
NBER Macroeconomics Annual 2008.
Burnside C., Eichenbaum M., Kleshchelski I., Rebelo S. 2007. The Returns to Currency
Speculation. NBER Working Paper No. 12489.
Gagnon J. E., Chaboud A. 2008. What Can the Data Tell Us About Carry Trades in
Japanese Yen? FRB International Finance Discussion Paper 899.
Garman, M. B., Kohlhagen S. W. 1983. Foreign Currency Option Values. Journal of
International Money and Finance 2, 231–237
Hattori M., Shin H. S. 2009. Yen Carry Trade and the Subprime Crisis. IMF Staff Papers.
McAndrews J., Sarkar A., Wang Z. 2008. The Effect of the Term Auction Facility on the
London Inter-Bank Offered Rate, Federal Reserve Bank of New York Staff Report
335.
McGuire P., von Peter G.. 2009. The US Dollar Shortage in Global Banking. BIS
Quarterly Review (March 2009), 47-63.
Michaud F. M., Upper C. 2008. What Drives Interbank Rates? Evidence from the LIBOR
Panel. BIS Quarterly Review (March 2008), 47-58.
Nelson B. 1991. Conditional Heteroskedasticity in Asset Returns: A New Approach.
Econometrica 59, 347-370.
Schwarz K. 2009. Mind the Gap: Disentangling Credit and Liquidity in Risk Spreads.
Working Paper, Columbia University Graduate School of Business.
Taylor J. B., Williams J. C. 2009. A Black Swan in the Money Market. American
Economic Journal: Macroeconomics 1(1), 58-83.

- 13 -
Figure 1: Relationship between the leverage of US banks and US dollar LIBOR-OIS spread
during 2007 Q2 - 2008 Q4
Fitted line, 3-month tenor
R2 = 0.2768
-20
-15
-10
-5
0
5
10
-0.5 0.0 0.5 1.0 1.5
Quarterly change in USD Libor-OIS spread (%)
Quart
erly g
row
th in
levera
ge (
%)
1-month USD Libor-OIS spread
3-month USD Libor-OIS spread
6-month USD Libor-OIS spread
2008 Q4
2008 Q1
2007 Q2
Notes:
1. The leverage is measured as the average asset-to-equity (book value) ratio of the following institutions:
Goldman Sachs, Morgan Stanley, Citigroup, Merrill Lynch, Bear Sterns (until 2008 Q1) and Lehman
Brothers (until 2008 Q2). The sample of institutions is the same as in Adrian and Shin (2008). The data
are from Bloomberg.
2. The LIBOR-OIS spread in the chart is the quarterly average figure.

- 14 -
Figure 2: LIBOR-OIS spreads and exchange rate (foreign currency/USD) index
EUR JPY
0.0
1.0
2.0
3.0
4.0
Jan-07 Apr-07 Jul-07 Oct-07 Jan-08 Apr-08 Jul-08 Oct-08 Jan-09 Apr-09
(% points)
0.6
0.8
1
1.2
9 Aug 07 = 1
USD Libor-OIS spread EUR Libor-OIS spread EUR spot - Index (rhs)
EUR/USD Index (rhs)
USD Libor-OIS spread (lhs)
EUR Libor-OIS spread (lhs)
Depreciation
against US dollar
9 Aug 2007 15 Sep 2008
0.0
1.0
2.0
3.0
4.0
Jan-07 Apr-07 Jul-07 Oct-07 Jan-08 Apr-08 Jul-08 Oct-08 Jan-09 Apr-09
(% points)
0.6
0.7
0.8
0.9
1
1.1
1.2
9 Aug 07 = 1
USD Libor-OIS spread JPY Libor-OIS spread JPY spot - Index (rhs)
JPY/USD Index (rhs)
USD Libor-OIS spread (lhs)
JPY Libor-OIS spread (lhs)
Depreciation
against US dollar
9 Aug 2007 15 Sep 2008
GBP AUD
0.0
1.0
2.0
3.0
4.0
Jan-07 Apr-07 Jul-07 Oct-07 Jan-08 Apr-08 Jul-08 Oct-08 Jan-09 Apr-09
(% points)
0.6
0.8
1
1.2
1.4
1.6
9 Aug 07 = 1
USD Libor-OIS spread GBP Libor-OIS spread GBP spot - Index (rhs)
GBP/USD Index (rhs)
USD Libor-OIS spread (lhs)
GBP Libor-OIS spread (lhs)
Depreciation
against US dollar
9 Aug 2007 15 Sep 2008
0.0
1.0
2.0
3.0
4.0
Jan-07 Apr-07 Jul-07 Oct-07 Jan-08 Apr-08 Jul-08 Oct-08 Jan-09 Apr-09
(% points)
0.4
0.6
0.8
1
1.2
1.4
1.6
9 Aug 07 = 1
USD Libor-OIS spread AUD Libor-OIS spread AUD spot - Index (rhs)
AUD/USD Index (rhs)
USD Libor-OIS spread (lhs)
AUD Libor-OIS spread (lhs)
Depreciation
against US dollar
9 Aug 2007 15 Sep 2008
CHF NZD
0.0
1.0
2.0
3.0
4.0
Jan-07 Apr-07 Jul-07 Oct-07 Jan-08 Apr-08 Jul-08 Oct-08 Jan-09 Apr-09
(% points)
0.6
0.7
0.8
0.9
1
1.1
1.2
9 Aug 07 = 1
USD Libor-OIS spread CHF Libor-OIS spread CHF spot - Index (rhs)
CHF/USD Index (rhs)
USD Libor-OIS spread (lhs)
CHF Libor-OIS spread (lhs)
Depreciation
against US dollar
9 Aug 2007 15 Sep 2008
0.0
1.0
2.0
3.0
4.0
Jan-07 Apr-07 Jul-07 Oct-07 Jan-08 Apr-08 Jul-08 Oct-08 Jan-09 Apr-09
(% points)
0.6
0.8
1
1.2
1.4
1.6
9 Aug 07 = 1
USD Libor-OIS spread NZD Libor-OIS spread NZD spot - Index (rhs)
NZD/USD Index (rhs)
USD Libor-OIS spread (lhs)
NZD Libor-OIS spread (lhs)
Depreciation
against US dollar
9 Aug 2007 15 Sep 2008
Note: The exchange rate (foreign currency/USD) index is the normalised exchange rate based on the spot rate on
9 August 2007.

- 15 -
Table 1: Selected summary statistics of variables in Equation (1)
Before the Lehman default After the Lehman default
Mean (level)
Standard
deviation
(daily change)
Mean (level)
Standard
deviation
(daily change)
EUR
Exchange rate 0.67 0.574 0.76 1.229
Risk reversal 0.36 0.083 0.49 0.206
Carry-to-risk ratio 0.09 0.007 0.06 0.006
FC LIBOR-OIS spread 0.63 0.026 1.23 0.067
GBP
Exchange rate 0.50 0.552 0.66 1.370
Risk reversal 0.80 0.068 2.32 0.226
Carry-to-risk ratio 0.26 0.009 0.08 0.008
FC LIBOR-OIS spread 0.71 0.041 1.70 0.125
CHF
Exchange rate 1.09 0.688 1.15 1.176
Risk reversal -0.62 0.089 -0.89 0.191
Carry-to-risk ratio -0.12 0.008 -0.05 0.007
FC LIBOR-OIS spread 0.52 0.030 0.72 0.090
JPY
Exchange rate 108.77 0.746 95.95 1.380
Risk reversal -3.45 0.278 -6.37 0.365
Carry-to-risk ratio -0.27 0.018 -0.07 0.011
FC LIBOR-OIS spread 0.42 0.013 0.59 0.016
AUD
Exchange rate 1.11 0.879 1.47 2.415
Risk reversal 1.38 0.189 4.19 0.416
Carry-to-risk ratio 0.31 0.010 0.13 0.010
FC LIBOR-OIS spread 0.50 0.040 1.33 0.101
NZD
Exchange rate 1.32 0.937 1.78 1.920
Risk reversal 1.80 0.193 4.25 0.413
Carry-to-risk ratio 0.37 0.012 0.17 0.011
FC LIBOR-OIS spread 0.67 0.053 1.49 0.137
USD
USD LIBOR-OIS spread 0.69 0.065 1.57 0.103
Note: The daily change of exchange rate is computed as log-return, while first-differencing is used for
other variables.

- 16 -
Table 2a: Estimation result for EUR
I. Sample period: 9 August 2007 to 12 September 2008 (i) (ii) (iii) (iv) (v)
Constant -0.009 -0.010 -0.017 -0.016 -0.030
0.76 0.74 0.59 0.60 0.33
Log return in spot (lag) -0.15** -0.16** -0.16** -0.16** -0.16**
0.02 0.01 0.02 0.02 0.02
Risk reversal 3.49** 3.60** 3.39** 3.44** 3.47**
0.00 0.00 0.00 0.00 0.00
Carry-to-risk ratio -15.69** -13.06** -8.60* -7.91*
0.00 0.01 0.08 0.10
FC LIBOR-OIS spread 2.27* 1.04
0.10 0.41
USD LIBOR-OIS spread -1.86** -1.55**
0.00 0.00
Adjusted R-squared 21.2% 20.4% 19.1% 19.2% 18.9%
F-statistic 9.03 9.61 8.92 10.11 11.48
Log likelihood -192.98 -194.67 -198.48 -198.83 -200.00
LR test 11.69**
Ljung-Box test up to lag 8
Std. residuals (p-value) 0.769 0.783 0.714 0.740 0.605
Sq. std. residuals (p-value) 0.841 0.879 0.816 0.848 0.819
II. Sample period: 15 September 2008 to 31 March 2009 (i) (ii) (iii) (iv) (v)
Constant 0.035 0.047 0.082 0.082 0.090
0.68 0.59 0.34 0.35 0.28
Log return in spot (lag) -0.21** -0.24** -0.23** -0.23** -0.23**
0.00 0.00 0.00 0.00 0.00
Risk reversal 3.54** 3.75** 3.82** 3.92** 3.97**
0.00 0.00 0.00 0.00 0.00
Carry-to-risk ratio -27.57 -31.73 2.76 -4.40
0.16 0.11 0.88 0.79
FC LIBOR-OIS spread 2.38** 1.73
0.04 0.15
USD LIBOR-OIS spread -2.70** -2.09*
0.02 0.05
Adjusted R-squared 34.4% 34.0% 33.7% 33.9% 34.4%
F-statistic 8.75 9.57 9.45 10.74 12.61
Log likelihood -182.32 -183.50 -184.44 -185.01 -185.07
LR test 5.37*
Ljung-Box test up to lag 8
Std. residuals (p-value) 0.886 0.764 0.754 0.677 0.663
Sq. std. residuals (p-value) 0.271 0.249 0.823 0.776 0.785
Notes:
1. The p-value is computed from the t-statistics using the Bollerslev-Wooldrige robust standard errors.
2. * and ** indicate significant at 10% and 5% levels respectively.

- 17 -
Table 2b: Estimation result for GBP
I. Sample period: 9 August 2007 to 12 September 2008 (i) (ii) (iii) (iv) (v)
Constant 0.057** 0.061** 0.050* 0.054* 0.006
0.05 0.04 0.10 0.07 0.84
Log return in spot (lag) -0.15** -0.17** -0.14** -0.16** -0.13
0.01 0.00 0.02 0.01 0.01
Risk reversal 2.62** 2.90** 2.59** 2.79** 2.74**
0.00 0.00 0.00 0.00 0.00
Carry-to-risk ratio -22.55** -19.10** -17.38** -15.89**
0.00 0.00 0.00 0.00
FC LIBOR-OIS spread 2.18** 1.18
0.01 0.14
USD LIBOR-OIS spread -2.11** -1.66**
0.00 0.00
Adjusted R-squared 22.7% 21.2% 18.0% 18.0% 12.1%
F-statistic 9.79 10.07 8.36 9.42 7.15
Log likelihood -181.12 -184.79 -189.49 -190.59 -196.53
LR test 18.95**
Ljung-Box test up to lag 8
Std. residuals (p-value) 0.597 0.749 0.453 0.599 0.873
Sq. std. residuals (p-value) 0.284 0.586 0.515 0.573 0.150
II. Sample period: 15 September 2008 to 31 March 2009 (i) (ii) (iii) (iv) (v)
Constant 0.016 0.120 0.127 0.142 0.185**
0.86 0.19 0.18 0.14 0.05
Log return in spot (lag) -0.13** -0.14** -0.12 -0.13* -0.13*
0.05 0.04 0.13 0.08 0.09
Risk reversal 3.07** 3.61** 3.59** 3.77** 3.99**
0.00 0.00 0.00 0.00 0.00
Carry-to-risk ratio -54.26** -40.16** -25.53** -21.43**
0.00 0.01 0.01 0.03
FC LIBOR-OIS spread 1.83** 1.12**
0.00 0.01
USD LIBOR-OIS spread -3.88** -2.94**
0.00 0.01
Adjusted R-squared 37.1% 35.3% 32.4% 31.9% 31.4%
F-statistic 9.72 10.09 8.96 9.92 11.16
Log likelihood -191.55 -197.87 -200.17 -201.27 -202.72
LR test 19.46**
Ljung-Box test up to lag 8
Std. residuals (p-value) 0.561 0.305 0.506 0.458 0.500
Sq. std. residuals (p-value) 0.562 0.184 0.425 0.544 0.613
Notes:
1. The p-value is computed from the t-statistics using the Bollerslev-Wooldrige robust standard errors.
2. * and ** indicate significant at 10% and 5% levels respectively.

- 18 -
Table 2c: Estimation result for CHF
I. Sample period: 9 August 2007 to 12 September 2008 (i) (ii) (iii) (iv) (v)
Constant -0.033 -0.033 -0.038 -0.034 -0.054
0.34 0.33 0.27 0.33 0.12
Log return in spot (lag) -0.19** -0.19** -0.18** -0.19** -0.18**
0.00 0.00 0.00 0.00 0.00
Risk reversal 3.10** 3.15** 2.78** 2.80** 2.72**
0.00 0.00 0.00 0.00 0.00
Carry-to-risk ratio -10.03** -10.02** -7.12* -7.09*
0.03 0.02 0.07 0.08
FC LIBOR-OIS spread 1.23 -0.31
0.38 0.80
USD LIBOR-OIS spread -1.94** -1.87**
0.00 0.00
Adjusted R-squared 20.3% 20.0% 14.4% 14.9% 13.6%
F-statistic 8.62 9.40 6.67 7.75 8.07
Log likelihood -236.19 -234.54 -242.91 -242.40 -245.16
LR test 12.43**
Ljung-Box test up to lag 8
Std. residuals (p-value) 0.601 0.722 0.644 0.633 0.449
Sq. std. residuals (p-value) 0.664 0.568 0.894 0.899 0.927
II. Sample period: 15 September 2008 to 31 March 2009 (i) (ii) (iii) (iv) (v)
Constant 0.034 -0.021 0.014 0.067 0.050
0.62 0.72 0.86 0.29 0.46
Log return in spot (lag) -0.15** -0.12** -0.13** -0.13** -0.14**
0.00 0.00 0.01 0.00 0.00
Risk reversal 3.10** 3.13** 3.06** 3.06** 3.32**
0.00 0.00 0.00 0.00 0.00
Carry-to-risk ratio -24.84** 0.15 3.80 11.05**
0.04 0.99 0.70 0.03
FC LIBOR-OIS spread 2.06** 0.33
0.00 0.58
USD LIBOR-OIS spread -2.02** -1.03**
0.00 0.01
Adjusted R-squared 24.0% 20.9% 19.9% 19.4% 21.0%
F-statistic 5.66 5.40 5.14 5.56 6.89
Log likelihood -175.21 -175.03 -178.94 -178.04 -175.50
LR test 5.66*
Ljung-Box test up to lag 8
Std. residuals (p-value) 0.786 0.804 0.856 0.812 0.862
Sq. std. residuals (p-value) 0.838 0.757 0.866 0.868 0.610
Notes:
1. The p-value is computed from the t-statistics using the Bollerslev-Wooldrige robust standard errors.
2. * and ** indicate significant at 10% and 5% levels respectively.

- 19 -
Table 2d: Estimation result for JPY
I. Sample period: 9 August 2007 to 12 September 2008 (i) (ii) (iii) (iv) (v)
Constant -0.040 -0.035 -0.044 -0.039 -0.043
0.21 0.28 0.17 0.22 0.18
Log return in spot (lag) -0.26** -0.28** -0.32** -0.32** -0.33**
0.00 0.00 0.00 0.00 0.00
Risk reversal 1.44** 1.44** 1.59** 1.57** 1.82**
0.00 0.00 0.00 0.00 0.00
Carry-to-risk ratio -5.72* -5.09 -4.47 -4.44
0.05 0.10 0.17 0.17
FC LIBOR-OIS spread 4.63* 1.36
0.07 0.59
USD LIBOR-OIS spread -2.05** -1.74**
0.00 0.00
Adjusted R-squared 46.5% 46.6% 43.8% 44.1% 43.9%
F-statistic 26.97 30.35 27.21 31.34 36.08
Log likelihood -209.32 -210.92 -216.29 -216.35 -217.74
LR test 14.06**
Ljung-Box test up to lag 8
Std. residuals (p-value) 0.574 0.642 0.702 0.712 0.579
Sq. std. residuals (p-value) 0.519 0.183 0.514 0.434 0.660
II. Sample period: 15 September 2008 to 31 March 2009 (i) (ii) (iii) (iv) (v)
Constant -0.105 -0.095 -0.112 -0.083 -0.113
0.20 0.26 0.18 0.32 0.22
Log return in spot (lag) -0.24** -0.25** -0.24** -0.24** -0.29**
0.00 0.00 0.00 0.00 0.00
Risk reversal 1.76** 1.81** 1.81** 1.97** 2.42**
0.00 0.00 0.00 0.00 0.00
Carry-to-risk ratio -25.63** -26.03** -24.36** -22.76**
0.01 0.01 0.01 0.02
FC LIBOR-OIS spread -5.04 -6.29
0.37 0.25
USD LIBOR-OIS spread -0.37 -0.56
0.62 0.45
Adjusted R-squared 37.8% 38.1% 38.1% 38.4% 36.5%
F-statistic 9.76 11.02 10.99 12.57 13.45
Log likelihood -185.03 -185.30 -185.11 -185.58 -189.40
LR test 1.11
Ljung-Box test up to lag 8
Std. residuals (p-value) 0.979 0.960 0.978 0.922 0.996
Sq. std. residuals (p-value) 0.651 0.640 0.588 0.493 0.886
Notes:
1. The p-value is computed from the t-statistics using the Bollerslev-Wooldrige robust standard errors.
2. * and ** indicate significant at 10% and 5% levels respectively.

- 20 -
Table 2e: Estimation result for AUD
I. Sample period: 9 August 2007 to 12 September 2008 (i) (ii) (iii) (iv) (v)
Constant -0.019 -0.021 -0.016 -0.021 -0.035
0.63 0.59 0.68 0.58 0.37
Log return in spot (lag) -0.19** -0.19** -0.19** -0.19** -0.21**
0.00 0.00 0.00 0.00 0.00
Risk reversal 2.80** 2.74** 2.78** 2.75** 3.03**
0.00 0.00 0.00 0.00 0.00
Carry-to-risk ratio -10.21** -11.09** -10.66** -11.25**
0.02 0.01 0.01 0.01
FC LIBOR-OIS spread -1.07 -0.69
0.33 0.49
USD LIBOR-OIS spread 0.56 0.35
0.38 0.56
Adjusted R-squared 35.9% 36.1% 35.8% 36.1% 33.6%
F-statistic 17.72 19.96 19.76 22.67 23.68
Log likelihood -277.15 -277.51 -277.50 -277.71 -281.82
LR test 1.11
Ljung-Box test up to lag 8
Std. residuals (p-value) 0.149 0.156 0.138 0.148 0.056
Sq. std. residuals (p-value) 0.505 0.450 0.513 0.465 0.594
II. Sample period: 15 September 2008 to 31 March 2009 (i) (ii) (iii) (iv) (v)
Constant 0.246** 0.314** 0.408** 0.078 0.273*
0.04 0.00 0.00 0.59 0.07
Log return in spot (lag) -0.51** -0.41** -0.49** -0.38** -0.25**
0.00 0.00 0.00 0.00 0.00
Risk reversal 2.44** 2.63** 2.36** 2.62** 2.52**
0.00 0.00 0.00 0.00 0.00
Carry-to-risk ratio -82.97** -50.19** -70.40** -76.02**
0.00 0.00 0.00 0.00
FC LIBOR-OIS spread 4.97** 3.83**
0.00 0.00
USD LIBOR-OIS spread -0.99 1.63
0.37 0.04
Adjusted R-squared 38.8% 37.4% 38.1% 39.6% 28.3%
F-statistic 10.31 10.88 11.14 13.35 9.69
Log likelihood -260.02 -260.96 -256.03 -264.01 -270.49
LR test 7.99**
Ljung-Box test up to lag 8
Std. residuals (p-value) 0.057 0.542 0.114 0.469 0.474
Sq. std. residuals (p-value) 0.172 0.397 0.323 0.870 0.450
Notes:
1. The p-value is computed from the t-statistics using the Bollerslev-Wooldrige robust standard errors.
2. * and ** indicate significant at 10% and 5% levels respectively.

- 21 -
Table 2f: Estimation result for NZD
I. Sample period: 9 August 2007 to 12 September 2008 (i) (ii) (iii) (iv) (v)
Constant 0.056 0.051 0.065 0.062 0.053
0.19 0.23 0.13 0.14 0.23
Log return in spot (lag) -0.17** -0.16** -0.17** -0.17** -0.16**
0.00 0.00 0.00 0.00 0.00
Risk reversal 2.43** 2.42** 2.43** 2.48** 3.03**
0.00 0.00 0.00 0.00 0.00
Carry-to-risk ratio -15.08** -14.70** -16.25** -15.71**
0.00 0.00 0.00 0.00
FC LIBOR-OIS spread 0.03 0.27
0.98 0.79
USD LIBOR-OIS spread 0.95 0.98
0.22 0.22
Adjusted R-squared 31.1% 31.4% 30.7% 30.7% 26.8%
F-statistic 14.52 16.41 15.87 17.99 17.39
Log likelihood -298.56 -298.80 -298.52 -298.69 -306.43
LR test 0.26
Ljung-Box test up to lag 8
Std. residuals (p-value) 0.997 0.994 0.992 0.994 0.984
Sq. std. residuals (p-value) 0.114 0.284 0.250 0.209 0.464
II. Sample period: 15 September 2008 to 31 March 2009 (i) (ii) (iii) (iv) (v)
Constant 0.073 0.075 0.082 0.078 0.139
0.57 0.56 0.52 0.54 0.31
Log return in spot (lag) -0.21** -0.21** -0.21** -0.21** -0.17**
0.01 0.01 0.01 0.01 0.03
Risk reversal 2.24** 2.15** 2.22** 2.16** 2.59**
0.00 0.00 0.00 0.00 0.00
Carry-to-risk ratio -36.56** -36.91** -37.88** -37.59**
0.00 0.00 0.00 0.00
FC LIBOR-OIS spread -0.85 -0.59
0.33 0.47
USD LIBOR-OIS spread 0.64 0.29
0.48 0.74
Adjusted R-squared 24.8% 26.0% 25.6% 26.6% 23.3%
F-statistic 5.88 6.84 6.72 7.87 7.73
Log likelihood -249.99 -250.23 -250.12 -250.26 -254.57
LR test 0.54
Ljung-Box test up to lag 8
Std. residuals (p-value) 0.821 0.782 0.812 0.780 0.600
Sq. std. residuals (p-value) 0.045 0.035 0.049 0.038 0.649
Notes:
1. The p-value is computed from the t-statistics using the Bollerslev-Wooldrige robust standard errors.
2. * and ** indicate significant at 10% and 5% levels respectively.

- 22 -
Table 3: Impact (in terms of magnitude) of a unit standard deviation shock
on daily currency return (%)
Before the Lehman default After the Lehman default
EUR
Carry-to-risk ratio 0.11 0.16
FC LIBOR-OIS spread 0.06 0.16
USD LIBOR-OIS spread 0.12 0.28
GBP
Carry-to-risk ratio 0.20 0.46
FC LIBOR-OIS spread 0.09 0.23
USD LIBOR-OIS spread 0.14 0.40
CHF
Carry-to-risk ratio 0.08 0.17
FC LIBOR-OIS spread 0.04 0.19
USD LIBOR-OIS spread 0.13 0.21
- 23 -
Table 4a: Robustness check: estimation results for JPY, AUD and NZD
using carry-to-risk ratio
JPY AUD NZD
Sample period 1 2 1 2 1 2
Constant -0.031 -0.037 0.020 0.071 0.057 0.081
0.37 0.71 0.67 0.66 0.21 0.57
Log return in spot (lag) -0.20** -0.14** -0.02 -0.19** -0.09* -0.11
0.00 0.06 0.68 0.02 0.07 0.18
Carry-to-risk ratio -21.68** -64.19** -34.76** -86.85** -31.02** -63.82**
0.00 0.00 0.00 0.00 0.00 0.00
Adjusted R-squared 29.5% 23.0% 13.8% 18.9% 16.6% 9.2%
F-statistic 19.80 7.49 8.20 6.14 9.92 3.25
Log likelihood -241.60 -202.49 -317.95 -279.05 -322.38 -264.54
Ljung-Box test up to lag 8
Std. residuals (p-value) 0.661 0.517 0.741 0.173 0.992 0.732
Sq. std. residuals (p-value) 0.993 0.842 0.476 0.796 0.611 0.094
Table 4b: Robustness check: estimation results for JPY, AUD and NZD
using alternative interbank rate proxies JPY AUD NZD
Sample period 1 2 1 2 1 2
Constant -0.046 -0.091 -0.018 -0.036 0.043 0.115
0.17 0.31 0.67 0.80 0.35 0.37
Log return in spot (lag) -0.22** -0.22** -0.15** -0.34** -0.20** -0.27**
0.00 0.00 0.01 0.00 0.00 0.00
Risk reversal 1.46** 1.82** 2.57** 2.68** 1.98** 2.21**
0.00 0.00 0.00 0.00 0.00 0.00
Carry-to-risk ratio -5.54* -19.64** -14.61** -89.43** -19.51** -35.81**
0.08 0.05 0.00 0.00 0.00 0.02
Interbank rate-OIS spread 9.75** 2.56** 2.26** 1.17 -1.25
0.01 0.01 0.00 0.29 0.40
USD LIBOR-OIS spread -2.03** -0.17 0.82 2.28 1.08 0.11
0.01 0.82 0.20 0.24 0.29 0.90
Adjusted R-squared 47.7% 37.1% 39.1% 40.7% 31.2% 25.9%
F-statistic 26.91 10.09 19.52 10.85 14.28 6.04
Log likelihood -209.04 -175.49 -270.92 -255.83 -302.26 -244.11
Ljung-Box test up to lag 8
Std. residuals (p-value) 0.603 0.352 0.257 0.701 0.889 0.514
Sq. std. residuals (p-value) 0.638 0.748 0.491 0.970 0.966 0.035
Notes:
1. The p-value is computed from the t-statistics using the Bollerslev-Wooldrige robust standard errors.
2. * and ** indicate significant at 10% and 5% levels respectively.