Liquid Temperature Measurements Using Two Different ...
13
sensors Article Liquid Temperature Measurements Using Two Different Tunable Hollow Prisms Sergio Calixto 1, *, Martha Rosete-Aguilar 2 and Ismael Torres-Gomez 1 1 Centro de Investigaciones en Optica, Loma del Bosque 115, Leon 37150, Mexico; [email protected] 2 Centro de Ciencias Aplicadas y Desarrollo Tecnológico (CCADET), Universidad Nacional Autónoma de México (UNAM), Av. Universidad 3000, Coyoacán, Distrito Federal 04510, Mexico; [email protected] * Correspondence: [email protected]; Tel.: +52-477-441-4200 Academic Editors: Cheng-Chi Wang and Ming-Tsang Lee Received: 25 August 2016; Accepted: 27 October 2016; Published: 29 January 2017 Abstract: This paper describes the design, fabrication, and testing of two hollow prisms. One is a prism with a grating glued to its hypotenuse. This ensemble, prism + grating, is called a grism. It can be applied as an on-axis tunable spectrometer. The other hollow prism is a constant deviation one called a Pellin-Broca. It can be used as a tunable dispersive element in a spectrometer with no moving parts. The application of prisms as temperature sensors is shown. Keywords: temperature sensors; grism; constant deviation prism; Pellin-Broca 1. Introduction A grism [1] is an optical structure that has a prism and a grating arranged to keep light, with a given wavelength, undeviated as it passes through the grism. The grating is placed in the hypotenuse of the prism. This grating can be ruled directly into the hypotenuse or it can be replicated with the help of a resin and glued to the prism. Grisms are used in direct vision spectroscopes and are usually inserted into a collimated beam. Grisms are used in astronomy to create a dispersed spectrum centered on the location of the object in the camera field of view. With this method cameras are converted to spectrographs. Grisms are also used as pulse shapers and for pulse compression [2] and dispersion compensation of femtosecond pulses. In astronomy it is common to use several grisms to cover different parts of the spectrum. For example the Near Infrared Camera and Multiobject Spectrometer (NICMOS) [3], in the Hubble Space Telescope, uses three grisms (G096, G141, and G206) to cover a spectral range between 0.8 μm to 2.4 μm. Another use of grisms was made in the First Light Test Experiment Camera (FLITECAM) [4] that is in the NASA’s SOFIA aircraft. There are three grisms made of KRS-5 and each has a direct-ruling grating. With these grisms it is possible to make observations in nine spectral bands covering a spectral range from about 1 μm to 5.5 μm. Regarding the ultraviolet region of the spectrum, grisms have been fabricated for NASA’s ultraviolet optical telescope (UVOT) [5]. Two grisms cover the spectral bands from about 200 nm to 300 nm and from 300 nm to about 400 nm. An example of a grism working with visible light is the one used at the Nordic Optical Telescope (NOT) [6]. The grism works in the band 345–515 nm, at first order. As we can see from the description in the above paragraph several grisms are needed if a wide spectral band is to be covered. Here we suggest the use of only one hollow grism that could cover a spectral band in the visible region. This grism is hollow and different liquids are poured in it to tune the spectral region. The very first results of this research with the grism were presented in a conference paper [7]. Sensors 2017, 17, 266; doi:10.3390/s17020266 www.mdpi.com/journal/sensors
Transcript of Liquid Temperature Measurements Using Two Different ...

sensors
Article
Liquid Temperature Measurements UsingTwo Different Tunable Hollow Prisms
Sergio Calixto 1,*, Martha Rosete-Aguilar 2 and Ismael Torres-Gomez 1
1 Centro de Investigaciones en Optica, Loma del Bosque 115, Leon 37150, Mexico; [email protected] Centro de Ciencias Aplicadas y Desarrollo Tecnológico (CCADET), Universidad Nacional Autónoma
de México (UNAM), Av. Universidad 3000, Coyoacán, Distrito Federal 04510, Mexico;[email protected]
* Correspondence: [email protected]; Tel.: +52-477-441-4200
Academic Editors: Cheng-Chi Wang and Ming-Tsang LeeReceived: 25 August 2016; Accepted: 27 October 2016; Published: 29 January 2017
Abstract: This paper describes the design, fabrication, and testing of two hollow prisms. One is aprism with a grating glued to its hypotenuse. This ensemble, prism + grating, is called a grism. It canbe applied as an on-axis tunable spectrometer. The other hollow prism is a constant deviation onecalled a Pellin-Broca. It can be used as a tunable dispersive element in a spectrometer with no movingparts. The application of prisms as temperature sensors is shown.
Keywords: temperature sensors; grism; constant deviation prism; Pellin-Broca
1. Introduction
A grism [1] is an optical structure that has a prism and a grating arranged to keep light, with agiven wavelength, undeviated as it passes through the grism. The grating is placed in the hypotenuseof the prism. This grating can be ruled directly into the hypotenuse or it can be replicated with thehelp of a resin and glued to the prism. Grisms are used in direct vision spectroscopes and are usuallyinserted into a collimated beam. Grisms are used in astronomy to create a dispersed spectrum centeredon the location of the object in the camera field of view. With this method cameras are converted tospectrographs. Grisms are also used as pulse shapers and for pulse compression [2] and dispersioncompensation of femtosecond pulses.
In astronomy it is common to use several grisms to cover different parts of the spectrum.For example the Near Infrared Camera and Multiobject Spectrometer (NICMOS) [3], in the HubbleSpace Telescope, uses three grisms (G096, G141, and G206) to cover a spectral range between 0.8 µm to2.4 µm. Another use of grisms was made in the First Light Test Experiment Camera (FLITECAM) [4]that is in the NASA’s SOFIA aircraft. There are three grisms made of KRS-5 and each has a direct-rulinggrating. With these grisms it is possible to make observations in nine spectral bands covering a spectralrange from about 1 µm to 5.5 µm. Regarding the ultraviolet region of the spectrum, grisms have beenfabricated for NASA’s ultraviolet optical telescope (UVOT) [5]. Two grisms cover the spectral bandsfrom about 200 nm to 300 nm and from 300 nm to about 400 nm. An example of a grism working withvisible light is the one used at the Nordic Optical Telescope (NOT) [6]. The grism works in the band345–515 nm, at first order.
As we can see from the description in the above paragraph several grisms are needed if a widespectral band is to be covered. Here we suggest the use of only one hollow grism that could cover aspectral band in the visible region. This grism is hollow and different liquids are poured in it to tunethe spectral region. The very first results of this research with the grism were presented in a conferencepaper [7].
Sensors 2017, 17, 266; doi:10.3390/s17020266 www.mdpi.com/journal/sensors

Sensors 2017, 17, 266 2 of 13
In addition to the grism, we present a hollow constant deviation tunable prism (Pellin-Broca).When an equilateral prism (60◦) is used in a spectrometer the incoming collimated light passes throughthe prism and then through a telescope that collects the light. The prism should be rotated to use it atminimum deviation. Then the telescope rotates to find the desired wavelength. On the other hand, ina constant deviation spectroscope [8], the collimator and the telescope are fixed at right angles and theprism is rotated to select a wavelength. Here we suggest and show that a hollow constant deviationprism, Pellin-Broca, can be used in the spectrometer. With this hollow prism it is not necessary torotate it to select the spectral line, just that the liquid in the hollow prism should be changed.
Nowadays there are electronic thermometers [9] like those based on platinum, cooper-nickel,rhodium-iron, and germanium, to mention but a few. Additionally, there are those based onsemiconducting ceramic, like the thermistor, with a sensitivity of 50 mV/◦C. This sensitivity is100 times that of platinum and 1000 times that of thermocouples. However, thermistors showdisadvantages, like extreme non-linearity of resistance with temperature and instability with time andcycling. Additionally, electronic thermometers are affected by electromagnetic fields, and at the sametime, influence them.
Optical thermometers [10] are immune to electric and magnetic fields; thus, they can be employedin the temperature measurement in induction, dielectric, and microwave heating because they are madeof isolating materials and may contact live metallic elements. They present immunity to chemical andmechanical influences. Some optical detectors, based on fiber optics [11], can present high resolution(6 × 10⁻⁴ ◦C), fast response time (0.5 ms), and sensitivity of 84 pm/◦C.
After showing the characterization of a grism and a Pellin-Broca we present their use as opticalthermometers. This is based on the liquid density change, due to temperature, that will give a changeto the refractive index.
In Section 2 we describe the principle of the grism method. Section 3 exposes the grism fabricationmethod. Section 4 shows the simulation or modeling of the grism with an optical design program.Section 5 describes the testing of the grism. Section 6 shows the physical principle of the Pellin-Brocaprism and the fabrication method. Section 7 describes the testing of the Pellin-Broca. Section 8 showsthe application of hollow prisms to the measurement of temperature.
It should be mentioned that the elements like the prisms, grating pitch, fibers, light sources, andother optical elements in the optical configurations were used because of their availability. However, theoptical configurations are versatile and the selection of optical components with different characteristicscan be used in order to improve their application.
2. Physical Principle of the Method
A solid grism consists of a prism and a grating. Figure 1 shows the structure [1]. Parametersthat should be considered are the prism angle (A), the grating pitch (d), the prism refractive index(n), the resin refractive index (nr), the grating facet angle (θ), the angle that makes the light with thegrating normal (α), and the angle that makes the diffracted beam (β). The grating equation applied toa grism is the following: mλ = (nsinα + n′sinβ). Supposing the grism is immersed in air, then n’ = 1and α = −β = A, and the equation becomes:
mλ = d·(n − 1)·sinA (1)
Thus, light with a wavelength λ will pass through the prism undeviated. If we require light witha different wavelength with which the grism was designed to pass undeviated we could change theprism angle A, or the grating pitch (d), or the prism refractive index (n). We have chosen to make ahollow prism and fill it with liquids having different refractive indices; that is, n is variable.

Sensors 2017, 17, 266 3 of 13
Sensors 2017, 17, 266 2 of 13
In addition to the grism, we present a hollow constant deviation tunable prism (Pellin-Broca).
When an equilateral prism (60°) is used in a spectrometer the incoming collimated light passes
through the prism and then through a telescope that collects the light. The prism should be rotated
to use it at minimum deviation. Then the telescope rotates to find the desired wavelength. On the
other hand, in a constant deviation spectroscope [8], the collimator and the telescope are fixed at
right angles and the prism is rotated to select a wavelength. Here we suggest and show that a
hollow constant deviation prism, Pellin-Broca, can be used in the spectrometer. With this hollow
prism it is not necessary to rotate it to select the spectral line, just that the liquid in the hollow prism
should be changed.
Nowadays there are electronic thermometers [9] like those based on platinum, cooper-nickel,
rhodium-iron, and germanium, to mention but a few. Additionally, there are those based on
semiconducting ceramic, like the thermistor, with a sensitivity of 50 mV/°C. This sensitivity is 100
times that of platinum and 1000 times that of thermocouples. However, thermistors show
disadvantages, like extreme non-linearity of resistance with temperature and instability with time
and cycling. Additionally, electronic thermometers are affected by electromagnetic fields, and at the
same time, influence them.
Optical thermometers [10] are immune to electric and magnetic fields; thus, they can be
employed in the temperature measurement in induction, dielectric, and microwave heating because
they are made of isolating materials and may contact live metallic elements. They present immunity
to chemical and mechanical influences. Some optical detectors, based on fiber optics [11], can present
high resolution (6 × 10⁻⁴ °C), fast response time (0.5 ms), and sensitivity of 84 pm/°C.
After showing the characterization of a grism and a Pellin-Broca we present their use as optical
thermometers. This is based on the liquid density change, due to temperature, that will give a
change to the refractive index.
In Section 2 we describe the principle of the grism method. Section 3 exposes the grism
fabrication method. Section 4 shows the simulation or modeling of the grism with an optical design
program. Section 5 describes the testing of the grism. Section 6 shows the physical principle of the
Pellin-Broca prism and the fabrication method. Section 7 describes the testing of the Pellin-Broca.
Section 8 shows the application of hollow prisms to the measurement of temperature.
It should be mentioned that the elements like the prisms, grating pitch, fibers, light sources,
and other optical elements in the optical configurations were used because of their availability.
However, the optical configurations are versatile and the selection of optical components with
different characteristics can be used in order to improve their application.
2. Physical Principle of the Method
A solid grism consists of a prism and a grating. Figure 1 shows the structure [1]. Parameters that
should be considered are the prism angle (A), the grating pitch (d), the prism refractive index (n), the
resin refractive index (nr), the grating facet angle (θ), the angle that makes the light with the grating
normal (α), and the angle that makes the diffracted beam (β). The grating equation applied to a grism
is the following: mλ = (nsinα + n′sinβ). Supposing the grism is immersed in air, then n’ = 1 and α = −β = A,
and the equation becomes:
mλ = d·(n − 1)·sinA (1)
Figure 1. Description of a solid grism. Figure 1. Description of a solid grism.
3. Tunable Grism Fabrication Method
To make a tunable grism we need two optical structures: a hollow prism and a blazed grating.Due to the grating characteristics the angle A was calculated to be 46◦. More on these details will beexposed below.
The grating fabrication method is as follows: A blazed master grating having a pitch of d = 1.69 µmand a groove angle of 8◦ was chosen. Liquid silicone was poured over its surface and, afterpolymerization, the thin film was detached from the master grating surface. This silicone grating wasglued to the grism hypotenuse. Figure 2a shows the master grating surface and Figure 2b shows thesilicone grating surface when they were studied with an atomic force microscope (AFM). Figure 3shows the fabricated tunable hollow grism. Figure 4 shows the spectrum given by the grism.
Sensors 2017, 17, 266 3 of 13
Thus, light with a wavelength λ will pass through the prism undeviated. If we require light
with a different wavelength with which the grism was designed to pass undeviated we could change
the prism angle A, or the grating pitch (d), or the prism refractive index (n). We have chosen to make
a hollow prism and fill it with liquids having different refractive indices; that is, n is variable.
3. Tunable Grism Fabrication Method
To make a tunable grism we need two optical structures: a hollow prism and a blazed grating.
Due to the grating characteristics the angle A was calculated to be 46°. More on these details will be
exposed below.
The grating fabrication method is as follows: A blazed master grating having a pitch of d = 1.69 µm
and a groove angle of 8° was chosen. Liquid silicone was poured over its surface and, after
polymerization, the thin film was detached from the master grating surface. This silicone grating was
glued to the grism hypotenuse. Figure 2a shows the master grating surface and Figure 2b shows the
silicone grating surface when they were studied with an atomic force microscope (AFM). Figure 3
shows the fabricated tunable hollow grism. Figure 4 shows the spectrum given by the grism.
(a)
(b)
Figure 2. Surfaces of the master grating (a) and a copy of it in a silicone material (b). Images given by
AFM. Figure 2. Surfaces of the master grating (a) and a copy of it in a silicone material (b). Images givenby AFM.

Sensors 2017, 17, 266 4 of 13Sensors 2017, 17, 266 4 of 13
Figure 3. A photograph showing one of the fabricated grisms. On the first plane it is possible to see a
red and a green beam, superposed, entering the grism face. Then follows the liquid in the cell. At the
hypotenuse of the grism the glued grating can be seen. In the background two spots of light
illuminate a white screen: the red spot on the left side and the green on the right side. They are
shifted to the left because the grism was designed to let light with a wavelength of 400 nm pass
through directly.
Figure 4. The spectrum given by the grism on ground glass. Its longer size is about 1 cm.
4. Grism Simulation
The behavior of the tunable hollow grism structure was simulated with an optical design
program. Parameters that were considered are: the refractive index of the glass plates, 1.5; glass plate
thickness, 1 mm; light that illuminated the grism has a wavelength of 400 nm;, grating pitch, 1.69 µm;
and the liquid inside the grism had a refractive index of 1.33 (water) at the beginning and, later, the
following refractive indices were considered: 1.34, 1.35, 1.36, and 1.37. Results can be seen in Table 1.
The first column shows the liquid refractive index, the second column shows the deviation angle for
the first diffracted order. For the first liquid with a refractive index of 1.33 it is seen that light was
slightly deviated from the optical axis. However, when the refractive index changed, the deviation
angle increased. These data were plotted and shown in Figure 5.
Table 1. Results given by an optical design program.
Refractive Index n Deviation Angle for 1st Diffractive
Order (Degrees). λ = 400 nm
1.33 0.081
1.34 0.653
1.35 1.258
1.36 1.869
1.37 2.487
Figure 3. A photograph showing one of the fabricated grisms. On the first plane it is possible to see ared and a green beam, superposed, entering the grism face. Then follows the liquid in the cell. At thehypotenuse of the grism the glued grating can be seen. In the background two spots of light illuminatea white screen: the red spot on the left side and the green on the right side. They are shifted to the leftbecause the grism was designed to let light with a wavelength of 400 nm pass through directly.
Sensors 2017, 17, 266 4 of 13
Figure 3. A photograph showing one of the fabricated grisms. On the first plane it is possible to see a
red and a green beam, superposed, entering the grism face. Then follows the liquid in the cell. At the
hypotenuse of the grism the glued grating can be seen. In the background two spots of light
illuminate a white screen: the red spot on the left side and the green on the right side. They are
shifted to the left because the grism was designed to let light with a wavelength of 400 nm pass
through directly.
Figure 4. The spectrum given by the grism on ground glass. Its longer size is about 1 cm.
4. Grism Simulation
The behavior of the tunable hollow grism structure was simulated with an optical design
program. Parameters that were considered are: the refractive index of the glass plates, 1.5; glass plate
thickness, 1 mm; light that illuminated the grism has a wavelength of 400 nm;, grating pitch, 1.69 µm;
and the liquid inside the grism had a refractive index of 1.33 (water) at the beginning and, later, the
following refractive indices were considered: 1.34, 1.35, 1.36, and 1.37. Results can be seen in Table 1.
The first column shows the liquid refractive index, the second column shows the deviation angle for
the first diffracted order. For the first liquid with a refractive index of 1.33 it is seen that light was
slightly deviated from the optical axis. However, when the refractive index changed, the deviation
angle increased. These data were plotted and shown in Figure 5.
Table 1. Results given by an optical design program.
Refractive Index n Deviation Angle for 1st Diffractive
Order (Degrees). λ = 400 nm
1.33 0.081
1.34 0.653
1.35 1.258
1.36 1.869
1.37 2.487
Figure 4. The spectrum given by the grism on ground glass. Its longer size is about 1 cm.
4. Grism Simulation
The behavior of the tunable hollow grism structure was simulated with an optical design program.Parameters that were considered are: the refractive index of the glass plates, 1.5; glass plate thickness,1 mm; light that illuminated the grism has a wavelength of 400 nm;, grating pitch, 1.69 µm; and theliquid inside the grism had a refractive index of 1.33 (water) at the beginning and, later, the followingrefractive indices were considered: 1.34, 1.35, 1.36, and 1.37. Results can be seen in Table 1. The firstcolumn shows the liquid refractive index, the second column shows the deviation angle for the firstdiffracted order. For the first liquid with a refractive index of 1.33 it is seen that light was slightlydeviated from the optical axis. However, when the refractive index changed, the deviation angleincreased. These data were plotted and shown in Figure 5.
Table 1. Results given by an optical design program.
Refractive Index n Deviation Angle for 1st Diffractive Order (Degrees). λ = 400 nm
1.33 0.0811.34 0.6531.35 1.2581.36 1.8691.37 2.487

Sensors 2017, 17, 266 5 of 13Sensors 2017, 17, 266 5 of 13
Figure 5. Calculated deviation angle as a function of the refractive index when a grism was used.
5. Experimentally Verifying the Grism Tuning
To verify the beam deviation when the liquids with different refractive index are poured in the
hollow grism, the optical configuration shown in Figure 6 was used. A white light source illuminates
the setup. With the help of a fiber optic bundle a slit was illuminated. Then a lens collimated the
white light beam. The beam traversed the grism and then a lens focused it. At the focal distance a
white light spectrum was seen. An optical fiber was fixed and sampled part of the spectrum. Then,
the signal was sent to an optical spectrum analyzer (OSA, AQ-6315 AB, ANDO Electric CO.,
Kanagawa Kawasaki, Japan,) to capture part of the spectrum. The fiber had a 105 µm core. A fiber
with this size let us capture enough light to be sensed by the detector.
Figure 6. Optical configuration used to characterize the spectrum deviation when the liquid in the
hollow Grism was changed.
The spectrum was recorded every time a liquid with a different refractive index was poured in
the hollow grism. Figure 7 shows the spectra. We notice that when a liquid with a refractive index of
1.33 was used, the spectrum showed a peak at 402 nm. Table 2 shows the relation between the
refractive index that filled the hollow grism and the wavelength peak of the spectra (second column).
Additional, Table 2 shows the wavelength for the beam that passes undeviated (third column). It
was calculated with Equation (1). The last column shows the peak wavelength calculated with an
optical design program. The agreement in columns three and four shows that the experimental
grism can be described with Equation (1). In other words, the possible error introduced by the
thickness of the glass plate is negligible. We can say that theoretical values agree with the
experimental ones. Thus, we can say that it is possible to tune the wavelength that passes undeviated
through the grism.
Figure 5. Calculated deviation angle as a function of the refractive index when a grism was used.
5. Experimentally Verifying the Grism Tuning
To verify the beam deviation when the liquids with different refractive index are poured in thehollow grism, the optical configuration shown in Figure 6 was used. A white light source illuminatesthe setup. With the help of a fiber optic bundle a slit was illuminated. Then a lens collimated the whitelight beam. The beam traversed the grism and then a lens focused it. At the focal distance a whitelight spectrum was seen. An optical fiber was fixed and sampled part of the spectrum. Then, thesignal was sent to an optical spectrum analyzer (OSA, AQ-6315 AB, ANDO Electric CO., KanagawaKawasaki, Japan,) to capture part of the spectrum. The fiber had a 105 µm core. A fiber with this sizelet us capture enough light to be sensed by the detector.
Sensors 2017, 17, 266 5 of 13
Figure 5. Calculated deviation angle as a function of the refractive index when a grism was used.
5. Experimentally Verifying the Grism Tuning
To verify the beam deviation when the liquids with different refractive index are poured in the
hollow grism, the optical configuration shown in Figure 6 was used. A white light source illuminates
the setup. With the help of a fiber optic bundle a slit was illuminated. Then a lens collimated the
white light beam. The beam traversed the grism and then a lens focused it. At the focal distance a
white light spectrum was seen. An optical fiber was fixed and sampled part of the spectrum. Then,
the signal was sent to an optical spectrum analyzer (OSA, AQ-6315 AB, ANDO Electric CO.,
Kanagawa Kawasaki, Japan,) to capture part of the spectrum. The fiber had a 105 µm core. A fiber
with this size let us capture enough light to be sensed by the detector.
Figure 6. Optical configuration used to characterize the spectrum deviation when the liquid in the
hollow Grism was changed.
The spectrum was recorded every time a liquid with a different refractive index was poured in
the hollow grism. Figure 7 shows the spectra. We notice that when a liquid with a refractive index of
1.33 was used, the spectrum showed a peak at 402 nm. Table 2 shows the relation between the
refractive index that filled the hollow grism and the wavelength peak of the spectra (second column).
Additional, Table 2 shows the wavelength for the beam that passes undeviated (third column). It
was calculated with Equation (1). The last column shows the peak wavelength calculated with an
optical design program. The agreement in columns three and four shows that the experimental
grism can be described with Equation (1). In other words, the possible error introduced by the
thickness of the glass plate is negligible. We can say that theoretical values agree with the
experimental ones. Thus, we can say that it is possible to tune the wavelength that passes undeviated
through the grism.
Figure 6. Optical configuration used to characterize the spectrum deviation when the liquid in thehollow Grism was changed.
The spectrum was recorded every time a liquid with a different refractive index was poured inthe hollow grism. Figure 7 shows the spectra. We notice that when a liquid with a refractive indexof 1.33 was used, the spectrum showed a peak at 402 nm. Table 2 shows the relation between therefractive index that filled the hollow grism and the wavelength peak of the spectra (second column).Additional, Table 2 shows the wavelength for the beam that passes undeviated (third column). It wascalculated with Equation (1). The last column shows the peak wavelength calculated with an opticaldesign program. The agreement in columns three and four shows that the experimental grism can bedescribed with Equation (1). In other words, the possible error introduced by the thickness of the glassplate is negligible. We can say that theoretical values agree with the experimental ones. Thus, we cansay that it is possible to tune the wavelength that passes undeviated through the grism.
Sensors 2017, 17, 266 6 of 13
Sensors 2017, 17, 266 6 of 13
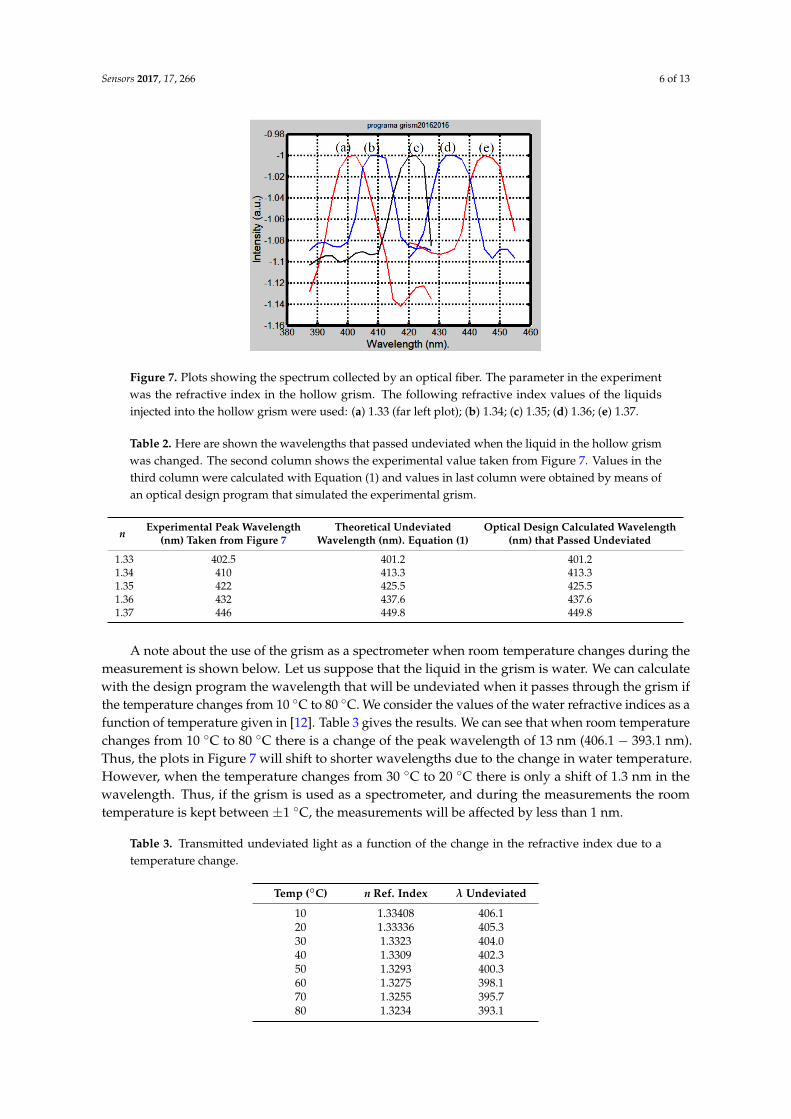
Figure 7. Plots showing the spectrum collected by an optical fiber. The parameter in the experiment
was the refractive index in the hollow grism. The following refractive index values of the liquids
injected into the hollow grism were used: (a) 1.33 (far left plot); (b) 1.34; (c) 1.35; (d) 1.36; (e) 1.37.
Table 2. Here are shown the wavelengths that passed undeviated when the liquid in the hollow
grism was changed. The second column shows the experimental value taken from Figure 7. Values in
the third column were calculated with Equation (1) and values in last column were obtained by
means of an optical design program that simulated the experimental grism.
n Experimental Peak Wavelength
(nm) Taken from Figure 7
Theoretical Undeviated
Wavelength (nm). Equation (1)
Optical Design Calculated Wavelength
(nm) that Passed Undeviated
1.33 402.5 401.2 401.2
1.34 410 413.3 413.3
1.35 422 425.5 425.5
1.36 432 437.6 437.6
1.37 446 449.8 449.8
A note about the use of the grism as a spectrometer when room temperature changes during the
measurement is shown below. Let us suppose that the liquid in the grism is water. We can calculate
with the design program the wavelength that will be undeviated when it passes through the grism if
the temperature changes from 10 °C to 80 °C. We consider the values of the water refractive indices
as a function of temperature given in [12]. Table 3 gives the results. We can see that when room
temperature changes from 10 °C to 80 °C there is a change of the peak wavelength of 13 nm
(406.1 − 393.1 nm). Thus, the plots in Figure 7 will shift to shorter wavelengths due to the change in
water temperature. However, when the temperature changes from 30 °C to 20 °C there is only a shift
of 1.3 nm in the wavelength. Thus, if the grism is used as a spectrometer, and during the
measurements the room temperature is kept between ±1 °C, the measurements will be affected by
less than 1 nm.
Table 3. Transmitted undeviated light as a function of the change in the refractive index due to a
temperature change.
Temp (°C) n Ref. Index λ Undeviated
10 1.33408 406.1
20 1.33336 405.3
30 1.3323 404.0
40 1.3309 402.3
50 1.3293 400.3
60 1.3275 398.1
70 1.3255 395.7
80 1.3234 393.1
Figure 7. Plots showing the spectrum collected by an optical fiber. The parameter in the experimentwas the refractive index in the hollow grism. The following refractive index values of the liquidsinjected into the hollow grism were used: (a) 1.33 (far left plot); (b) 1.34; (c) 1.35; (d) 1.36; (e) 1.37.
Table 2. Here are shown the wavelengths that passed undeviated when the liquid in the hollow grismwas changed. The second column shows the experimental value taken from Figure 7. Values in thethird column were calculated with Equation (1) and values in last column were obtained by means ofan optical design program that simulated the experimental grism.
n Experimental Peak Wavelength(nm) Taken from Figure 7
Theoretical UndeviatedWavelength (nm). Equation (1)
Optical Design Calculated Wavelength(nm) that Passed Undeviated
1.33 402.5 401.2 401.21.34 410 413.3 413.31.35 422 425.5 425.51.36 432 437.6 437.61.37 446 449.8 449.8
A note about the use of the grism as a spectrometer when room temperature changes during themeasurement is shown below. Let us suppose that the liquid in the grism is water. We can calculatewith the design program the wavelength that will be undeviated when it passes through the grism ifthe temperature changes from 10 ◦C to 80 ◦C. We consider the values of the water refractive indices as afunction of temperature given in [12]. Table 3 gives the results. We can see that when room temperaturechanges from 10 ◦C to 80 ◦C there is a change of the peak wavelength of 13 nm (406.1 − 393.1 nm).Thus, the plots in Figure 7 will shift to shorter wavelengths due to the change in water temperature.However, when the temperature changes from 30 ◦C to 20 ◦C there is only a shift of 1.3 nm in thewavelength. Thus, if the grism is used as a spectrometer, and during the measurements the roomtemperature is kept between ±1 ◦C, the measurements will be affected by less than 1 nm.
Table 3. Transmitted undeviated light as a function of the change in the refractive index due to atemperature change.
Temp (◦C) n Ref. Index λ Undeviated
10 1.33408 406.120 1.33336 405.330 1.3323 404.040 1.3309 402.350 1.3293 400.360 1.3275 398.170 1.3255 395.780 1.3234 393.1

Sensors 2017, 17, 266 7 of 13
6. Principle and Fabrication of the Pellin-Broca Tunable Prism
Figure 8a shows the solid Pellin-Broca optical structure along with the path that a beam of lightwith a certain wavelength follows [8]. The action of the prism is equivalent to that of a 60◦ prismat minimum deviation. If one desired wavelength is needed at the telescope reticle the prism tableshould be rotated. This table is calibrated to enable the wavelength to be read directly. Our proposalis to replace the solid Pellin-Broca prism by a hollow one. Instead of turning the prism to selecta wavelength it is possible to change the liquid refractive index.
The hollow Pellin-Broca prism was made by cutting several pieces of plane-parallel glass platesand glued them to a base which was a flat glass. One of the fabricated prisms is shown in Figure 8b.
Sensors 2017, 17, 266 7 of 13
6. Principle and Fabrication of the Pellin-Broca Tunable Prism
Figure 8a shows the solid Pellin-Broca optical structure along with the path that a beam of light
with a certain wavelength follows [8]. The action of the prism is equivalent to that of a 60° prism at
minimum deviation. If one desired wavelength is needed at the telescope reticle the prism table
should be rotated. This table is calibrated to enable the wavelength to be read directly. Our proposal
is to replace the solid Pellin-Broca prism by a hollow one. Instead of turning the prism to select a
wavelength it is possible to change the liquid refractive index.
The hollow Pellin-Broca prism was made by cutting several pieces of plane-parallel glass plates
and glued them to a base which was a flat glass. One of the fabricated prisms is shown in Figure 8b.
(a) (b)
Figure 8. (a) Solid Pellin-Broca prism. Light comes from a collimator and ends in a telescope objective;
and (b) a photograph showing one of the fabricated Pellin-Broca prims. Light trajectory inside the
Pellin-Broca can be seen. Light enters from the right side, passes through the Pellin-Broca, and exits
from the lower left side. On the left side a point of light can be seen; this is the outgoing light from the
prism that illuminates a piece of black cardboard.
7. Testing the Pellin-Broca Prism
Once the hollow prism was fabricated it was tested with the optical configuration shown in
Figure 9. White light from a source was used to illuminate a slit, which was at the focal distance of a
collimating lens. Then light passed through the prism and the light was collected by a second lens
(telescope lens). At its focal length a spectrum was seen. If a second slit is placed at the focus of the
telescope lens, a narrow section of the spectrum can be isolated. Emerging light will be almost
monochromatic and the spectroscope could behave as a monochromator. To experimentally test the
lateral displacement of the spectrum several liquids with the following refractive indices were used:
1.3325, 1.3335, 1.3345, 1.3355, 1.3365, 1.3375, and 1.3385. The result of the experiment can be seen in
Figure 10. Each photograph shows a spectrum. Its position relative to the zero, “0”, digit shown in
the USAF test target, changes as the refractive index of the liquid changes. Thus, we have probed
that it is possible to select the output wavelength.
Figure 8. (a) Solid Pellin-Broca prism. Light comes from a collimator and ends in a telescope objective;and (b) a photograph showing one of the fabricated Pellin-Broca prims. Light trajectory inside thePellin-Broca can be seen. Light enters from the right side, passes through the Pellin-Broca, and exitsfrom the lower left side. On the left side a point of light can be seen; this is the outgoing light from theprism that illuminates a piece of black cardboard.
7. Testing the Pellin-Broca Prism
Once the hollow prism was fabricated it was tested with the optical configuration shown inFigure 9. White light from a source was used to illuminate a slit, which was at the focal distanceof a collimating lens. Then light passed through the prism and the light was collected by a secondlens (telescope lens). At its focal length a spectrum was seen. If a second slit is placed at the focus ofthe telescope lens, a narrow section of the spectrum can be isolated. Emerging light will be almostmonochromatic and the spectroscope could behave as a monochromator. To experimentally test thelateral displacement of the spectrum several liquids with the following refractive indices were used:1.3325, 1.3335, 1.3345, 1.3355, 1.3365, 1.3375, and 1.3385. The result of the experiment can be seen inFigure 10. Each photograph shows a spectrum. Its position relative to the zero, “0”, digit shown in theUSAF test target, changes as the refractive index of the liquid changes. Thus, we have probed that it ispossible to select the output wavelength.

Sensors 2017, 17, 266 8 of 13Sensors 2017, 17, 266 8 of 13
Figure 9. Optical configuration used to characterize the spectrum when the liquid in the hollow
Pellin-Broca prisms was changed.
Figure 10. Two photographs that show the spectrum spatial position with reference to the test target
when liquids with different refractive index were poured in the hollow Pellin-Broca prism. Notice
that the spectrum has shifted with reference to the “0” in the chart. The refractive indices of the
liquids were: 1.3325, and 1.3385.
To quantify the spectrum angular movement as a function of the liquid refractive index in the
hollow prism an optical spectrum analyzer (OSA) was used. The tip of an optical fiber, with a 200 µm
core diameter, was placed at the telescope slit. The other end was connected to the OSA. Two
refractive indices were used, one with a refractive index of 1.3325 and the other with a refractive
index of 1.3365. The plots showing the intensity as a function of the wavelength can be seen in Figure 11.
A shift of the plot to the right is noticed when the refractive index increased.
Figure 11. Plot showing the shift of the spectrum when different refractive indices were used in the
prism.
400 500 600 700 800
0
5
10
15
20
Inte
nsity [d
B]
Wavelength [nm]
1.3325
1.3365
Figure 9. Optical configuration used to characterize the spectrum when the liquid in the hollowPellin-Broca prisms was changed.
Sensors 2017, 17, 266 8 of 13
Figure 9. Optical configuration used to characterize the spectrum when the liquid in the hollow
Pellin-Broca prisms was changed.
Figure 10. Two photographs that show the spectrum spatial position with reference to the test target
when liquids with different refractive index were poured in the hollow Pellin-Broca prism. Notice
that the spectrum has shifted with reference to the “0” in the chart. The refractive indices of the
liquids were: 1.3325, and 1.3385.
To quantify the spectrum angular movement as a function of the liquid refractive index in the
hollow prism an optical spectrum analyzer (OSA) was used. The tip of an optical fiber, with a 200 µm
core diameter, was placed at the telescope slit. The other end was connected to the OSA. Two
refractive indices were used, one with a refractive index of 1.3325 and the other with a refractive
index of 1.3365. The plots showing the intensity as a function of the wavelength can be seen in Figure 11.
A shift of the plot to the right is noticed when the refractive index increased.
Figure 11. Plot showing the shift of the spectrum when different refractive indices were used in the
prism.
400 500 600 700 800
0
5
10
15
20
Inte
nsity [d
B]
Wavelength [nm]
1.3325
1.3365
Figure 10. Two photographs that show the spectrum spatial position with reference to the test targetwhen liquids with different refractive index were poured in the hollow Pellin-Broca prism. Notice thatthe spectrum has shifted with reference to the “0” in the chart. The refractive indices of the liquidswere: 1.3325, and 1.3385.
To quantify the spectrum angular movement as a function of the liquid refractive index in thehollow prism an optical spectrum analyzer (OSA) was used. The tip of an optical fiber, with a 200 µmcore diameter, was placed at the telescope slit. The other end was connected to the OSA. Two refractiveindices were used, one with a refractive index of 1.3325 and the other with a refractive index of 1.3365.The plots showing the intensity as a function of the wavelength can be seen in Figure 11. A shift of theplot to the right is noticed when the refractive index increased.
Sensors 2017, 17, 266 8 of 13
Figure 9. Optical configuration used to characterize the spectrum when the liquid in the hollow
Pellin-Broca prisms was changed.
Figure 10. Two photographs that show the spectrum spatial position with reference to the test target
when liquids with different refractive index were poured in the hollow Pellin-Broca prism. Notice
that the spectrum has shifted with reference to the “0” in the chart. The refractive indices of the
liquids were: 1.3325, and 1.3385.
To quantify the spectrum angular movement as a function of the liquid refractive index in the
hollow prism an optical spectrum analyzer (OSA) was used. The tip of an optical fiber, with a 200 µm
core diameter, was placed at the telescope slit. The other end was connected to the OSA. Two
refractive indices were used, one with a refractive index of 1.3325 and the other with a refractive
index of 1.3365. The plots showing the intensity as a function of the wavelength can be seen in Figure 11.
A shift of the plot to the right is noticed when the refractive index increased.
Figure 11. Plot showing the shift of the spectrum when different refractive indices were used in the
prism.
400 500 600 700 800
0
5
10
15
20
Inte
nsity [d
B]
Wavelength [nm]
1.3325
1.3365
Figure 11. Plot showing the shift of the spectrum when different refractive indices were used in the prism.
Sensors 2017, 17, 266 9 of 13
8. Hollow Prisms Applied to the Measurement of Temperature
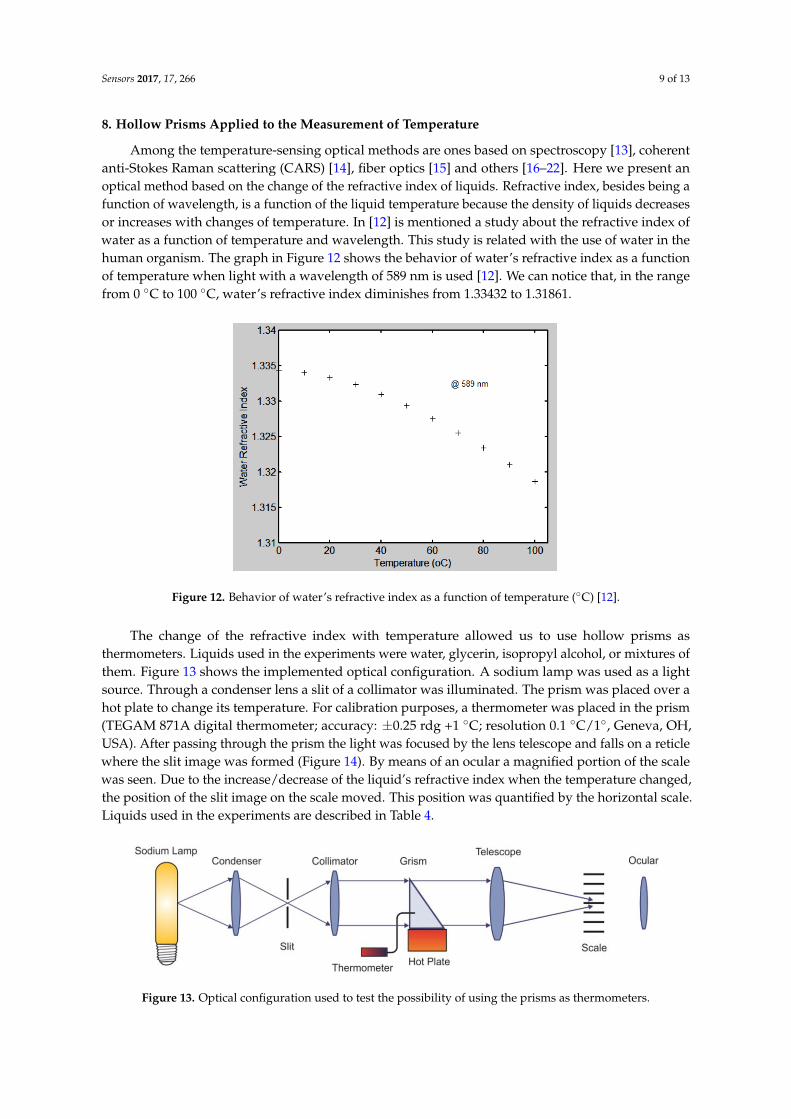
Among the temperature-sensing optical methods are ones based on spectroscopy [13], coherentanti-Stokes Raman scattering (CARS) [14], fiber optics [15] and others [16–22]. Here we present anoptical method based on the change of the refractive index of liquids. Refractive index, besides being afunction of wavelength, is a function of the liquid temperature because the density of liquids decreasesor increases with changes of temperature. In [12] is mentioned a study about the refractive index ofwater as a function of temperature and wavelength. This study is related with the use of water in thehuman organism. The graph in Figure 12 shows the behavior of water’s refractive index as a functionof temperature when light with a wavelength of 589 nm is used [12]. We can notice that, in the rangefrom 0 ◦C to 100 ◦C, water’s refractive index diminishes from 1.33432 to 1.31861.
Sensors 2017, 17, 266 9 of 13
8. Hollow Prisms Applied to the Measurement of Temperature
Among the temperature-sensing optical methods are ones based on spectroscopy [13], coherent
anti-Stokes Raman scattering (CARS) [14], fiber optics [15] and others [16–22]. Here we present an
optical method based on the change of the refractive index of liquids. Refractive index, besides being a
function of wavelength, is a function of the liquid temperature because the density of liquids decreases
or increases with changes of temperature. In [12] is mentioned a study about the refractive index of
water as a function of temperature and wavelength. This study is related with the use of water in the
human organism. The graph in Figure 12 shows the behavior of water’s refractive index as a function
of temperature when light with a wavelength of 589 nm is used [12]. We can notice that, in the range
from 0 °C to 100 °C, water’s refractive index diminishes from 1.33432 to 1.31861.
Figure 12. Behavior of water’s refractive index as a function of temperature (°C) [12].
The change of the refractive index with temperature allowed us to use hollow prisms as
thermometers. Liquids used in the experiments were water, glycerin, isopropyl alcohol, or mixtures
of them. Figure 13 shows the implemented optical configuration. A sodium lamp was used as a light
source. Through a condenser lens a slit of a collimator was illuminated. The prism was placed over a
hot plate to change its temperature. For calibration purposes, a thermometer was placed in the prism
(TEGAM 871A digital thermometer; accuracy: ±0.25 rdg +1 °C; resolution 0.1 °C/1°, Geneva, OH,
USA). After passing through the prism the light was focused by the lens telescope and falls on a
reticle where the slit image was formed (Figure 14). By means of an ocular a magnified portion of the
scale was seen. Due to the increase/decrease of the liquid’s refractive index when the temperature
changed, the position of the slit image on the scale moved. This position was quantified by the
horizontal scale. Liquids used in the experiments are described in Table 4.
Figure 13. Optical configuration used to test the possibility of using the prisms as thermometers.
Figure 12. Behavior of water’s refractive index as a function of temperature (◦C) [12].
The change of the refractive index with temperature allowed us to use hollow prisms asthermometers. Liquids used in the experiments were water, glycerin, isopropyl alcohol, or mixtures ofthem. Figure 13 shows the implemented optical configuration. A sodium lamp was used as a lightsource. Through a condenser lens a slit of a collimator was illuminated. The prism was placed over ahot plate to change its temperature. For calibration purposes, a thermometer was placed in the prism(TEGAM 871A digital thermometer; accuracy: ±0.25 rdg +1 ◦C; resolution 0.1 ◦C/1◦, Geneva, OH,USA). After passing through the prism the light was focused by the lens telescope and falls on a reticlewhere the slit image was formed (Figure 14). By means of an ocular a magnified portion of the scalewas seen. Due to the increase/decrease of the liquid’s refractive index when the temperature changed,the position of the slit image on the scale moved. This position was quantified by the horizontal scale.Liquids used in the experiments are described in Table 4.
Sensors 2017, 17, 266 9 of 13
8. Hollow Prisms Applied to the Measurement of Temperature
Among the temperature-sensing optical methods are ones based on spectroscopy [13], coherent
anti-Stokes Raman scattering (CARS) [14], fiber optics [15] and others [16–22]. Here we present an
optical method based on the change of the refractive index of liquids. Refractive index, besides being a
function of wavelength, is a function of the liquid temperature because the density of liquids decreases
or increases with changes of temperature. In [12] is mentioned a study about the refractive index of
water as a function of temperature and wavelength. This study is related with the use of water in the
human organism. The graph in Figure 12 shows the behavior of water’s refractive index as a function
of temperature when light with a wavelength of 589 nm is used [12]. We can notice that, in the range
from 0 °C to 100 °C, water’s refractive index diminishes from 1.33432 to 1.31861.
Figure 12. Behavior of water’s refractive index as a function of temperature (°C) [12].
The change of the refractive index with temperature allowed us to use hollow prisms as
thermometers. Liquids used in the experiments were water, glycerin, isopropyl alcohol, or mixtures
of them. Figure 13 shows the implemented optical configuration. A sodium lamp was used as a light
source. Through a condenser lens a slit of a collimator was illuminated. The prism was placed over a
hot plate to change its temperature. For calibration purposes, a thermometer was placed in the prism
(TEGAM 871A digital thermometer; accuracy: ±0.25 rdg +1 °C; resolution 0.1 °C/1°, Geneva, OH,
USA). After passing through the prism the light was focused by the lens telescope and falls on a
reticle where the slit image was formed (Figure 14). By means of an ocular a magnified portion of the
scale was seen. Due to the increase/decrease of the liquid’s refractive index when the temperature
changed, the position of the slit image on the scale moved. This position was quantified by the
horizontal scale. Liquids used in the experiments are described in Table 4.
Figure 13. Optical configuration used to test the possibility of using the prisms as thermometers. Figure 13. Optical configuration used to test the possibility of using the prisms as thermometers.

Sensors 2017, 17, 266 10 of 13Sensors 2017, 17, 266 10 of 13
Figure 14. Photograph of the slit image given by the telescope lens. In the slit image plane a reticle
composed of circles and a horizontal scale was placed. The minimum distance between divisions in
the horizontal scale was 50 µm.
Table 4. Liquids used in the experiments and some characteristics of them [23].
Liquid Density g/mL @ 25 °C Refractive Index @ 589 nm
Water 1 1.33336
Glycerin 1.259 1.472
Isopropyl Alcohol 0.785 1.375
The first experiment was done with the grism. A calibration graph was obtained relating the slit
image position (in mm) as a function of temperature (°C). The graph in Figure 15 shows the
experimental results. The liquids used were water, 25% glycerin/75% H2O, and 50% glycerin/50% H2O.
The density of each mixture is different. By looking at the graphs we can see that when liquids with
high density are used the sensitivity of the configuration is better. The graphs reach a maximum and
then stabilize. Additionally, they show a linear section. By taking two points in this section we can
calculate its slope, which will be its sensitivity. For water, the sensitivity is 0.013 mm/°C, for the
25% glycerin/75% H2O mixture it is 0.018 mm/°C, and for 50% glycerin/50% water it is 0.021 mm/°C.
Figure 15. Experimental data of the slit image position as a function of temperature (°C) when a
grism was used. Several liquids were used.
The sensitivity of the grism hollow prism in the measurement of temperature can be increased
or decreased. By increasing (decreasing) the lateral displacement of the image slit, the sensitivity
increases (decreases). The lateral displacement can be increased by increasing the focal length of the
lens that forms the image of the slit. We have conducted some calculations with a design program
Figure 14. Photograph of the slit image given by the telescope lens. In the slit image plane a reticlecomposed of circles and a horizontal scale was placed. The minimum distance between divisions inthe horizontal scale was 50 µm.
Table 4. Liquids used in the experiments and some characteristics of them [23].
Liquid Density g/mL @ 25 ◦C Refractive Index @ 589 nm
Water 1 1.33336Glycerin 1.259 1.472
Isopropyl Alcohol 0.785 1.375
The first experiment was done with the grism. A calibration graph was obtained relating theslit image position (in mm) as a function of temperature (◦C). The graph in Figure 15 shows theexperimental results. The liquids used were water, 25% glycerin/75% H2O, and 50% glycerin/50%H2O. The density of each mixture is different. By looking at the graphs we can see that when liquidswith high density are used the sensitivity of the configuration is better. The graphs reach a maximumand then stabilize. Additionally, they show a linear section. By taking two points in this section we cancalculate its slope, which will be its sensitivity. For water, the sensitivity is 0.013 mm/◦C, for the 25%glycerin/75% H2O mixture it is 0.018 mm/◦C, and for 50% glycerin/50% water it is 0.021 mm/◦C.
Sensors 2017, 17, 266 10 of 13
Figure 14. Photograph of the slit image given by the telescope lens. In the slit image plane a reticle
composed of circles and a horizontal scale was placed. The minimum distance between divisions in
the horizontal scale was 50 µm.
Table 4. Liquids used in the experiments and some characteristics of them [23].
Liquid Density g/mL @ 25 °C Refractive Index @ 589 nm
Water 1 1.33336
Glycerin 1.259 1.472
Isopropyl Alcohol 0.785 1.375
The first experiment was done with the grism. A calibration graph was obtained relating the slit
image position (in mm) as a function of temperature (°C). The graph in Figure 15 shows the
experimental results. The liquids used were water, 25% glycerin/75% H2O, and 50% glycerin/50% H2O.
The density of each mixture is different. By looking at the graphs we can see that when liquids with
high density are used the sensitivity of the configuration is better. The graphs reach a maximum and
then stabilize. Additionally, they show a linear section. By taking two points in this section we can
calculate its slope, which will be its sensitivity. For water, the sensitivity is 0.013 mm/°C, for the
25% glycerin/75% H2O mixture it is 0.018 mm/°C, and for 50% glycerin/50% water it is 0.021 mm/°C.
Figure 15. Experimental data of the slit image position as a function of temperature (°C) when a
grism was used. Several liquids were used.
The sensitivity of the grism hollow prism in the measurement of temperature can be increased
or decreased. By increasing (decreasing) the lateral displacement of the image slit, the sensitivity
increases (decreases). The lateral displacement can be increased by increasing the focal length of the
lens that forms the image of the slit. We have conducted some calculations with a design program
Figure 15. Experimental data of the slit image position as a function of temperature (◦C) when a grismwas used. Several liquids were used.
The sensitivity of the grism hollow prism in the measurement of temperature can be increasedor decreased. By increasing (decreasing) the lateral displacement of the image slit, the sensitivity

Sensors 2017, 17, 266 11 of 13
increases (decreases). The lateral displacement can be increased by increasing the focal length of thelens that forms the image of the slit. We have conducted some calculations with a design programconsidering two focal lengths, f = 15 cm and f = 30 cm, for the grism configuration that was used.Results can be seen in Table 5. We can see that the lateral displacement of the slit image increases whenthe focal length increases for a given refractive index (or, equivalently, a given temperature).
Table 5. Lateral displacement of the slit image when two focal distances were considered.
Water Refractive Index @ 401.2 nmn
Displacement (mm)F = 15 cm
Displacement (mm)F = 30 cm
1.3343 −0.67 −1.341.33336 −0.52 −1.041.3323 −0.36 −0.72
1.33 0 01.3275 0.39 0.781.3210 1.39 2.78
Regarding the use of a constant-deviation Pellin-Broca prism for temperature measurement, theoptical configuration used was, again, the one shown in Figure 13. Instead of the grism, the Pellin-Brocawas used. Thus, the trajectory was bent by 90◦. Here, besides water and glycerin, or mixtures ofthem, isopropyl alcohol was also used. The results can be seen in Figure 16. In the case of isopropylalcohol, the graph shows a tortuous behavior. We think this is due to the fast evaporation of thealcohol. This evaporation would cause the temperature to change unevenly. The hollow prism hada glass cover but a small space of about 2 mm × 6 mm was left to insert the thermocouple used inthe calibration process. Through that space alcohol evaporated. Again, by looking the graphs wenotice that when more glycerin is present in the mixture the sensitivity increases. By considering thelinear section in each curve and taking two points from them we can calculate the slope, which isthe sensitivity. For the water we have 0.086 mm/◦C; for 25% glycerin/75% H2O, 0.16 mm/◦C; andfor glycerin, 0.4 mm/◦C. The graph for glycerin in this linear portion also shows us that a minimumchange in temperature of 1 ◦C can be detected.
Sensors 2017, 17, 266 11 of 13
considering two focal lengths, f = 15 cm and f = 30 cm, for the grism configuration that was used.
Results can be seen in Table 5. We can see that the lateral displacement of the slit image increases
when the focal length increases for a given refractive index (or, equivalently, a given temperature).
Table 5. Lateral displacement of the slit image when two focal distances were considered.
Water Refractive Index @ 401.2 nm
n
Displacement (mm)
F = 15 cm
Displacement (mm)
F = 30 cm
1.3343 −0.67 −1.34
1.33336 −0.52 −1.04
1.3323 −0.36 −0.72
1.33 0 0
1.3275 0.39 0.78
1.3210 1.39 2.78
Regarding the use of a constant-deviation Pellin-Broca prism for temperature measurement, the
optical configuration used was, again, the one shown in Figure 13. Instead of the grism, the
Pellin-Broca was used. Thus, the trajectory was bent by 90°. Here, besides water and glycerin, or
mixtures of them, isopropyl alcohol was also used. The results can be seen in Figure 16. In the case of
isopropyl alcohol, the graph shows a tortuous behavior. We think this is due to the fast evaporation
of the alcohol. This evaporation would cause the temperature to change unevenly. The hollow prism
had a glass cover but a small space of about 2 mm × 6 mm was left to insert the thermocouple used in
the calibration process. Through that space alcohol evaporated. Again, by looking the graphs we
notice that when more glycerin is present in the mixture the sensitivity increases. By considering the
linear section in each curve and taking two points from them we can calculate the slope, which is the
sensitivity. For the water we have 0.086 mm/°C; for 25% glycerin/75% H2O, 0.16 mm/°C; and for
glycerin, 0.4 mm/°C. The graph for glycerin in this linear portion also shows us that a minimum
change in temperature of 1 °C can be detected.
Figure 16. Experimental data of the slit image position as a function of temperature (°C) when a
Pellin-Broca prism was used. Several liquids filled the hollow prism.
The image slit position could be difficult to read when large temperatures, above 50 °C, and
liquids with high densities are present. Results are not consistent. There are convection currents in
the liquids that degrade the slit image due to the passage of light through these currents. To avoid
these convection currents the use of a method that circulates the liquid in the cell is suggested.
Regarding the hysteresis behavior of the prisms, here we describe an example with the
Pellin-Broca prism. In the experiment, the starting temperature was about room temperature. Then it
Figure 16. Experimental data of the slit image position as a function of temperature (◦C) whena Pellin-Broca prism was used. Several liquids filled the hollow prism.
The image slit position could be difficult to read when large temperatures, above 50 ◦C, andliquids with high densities are present. Results are not consistent. There are convection currents in theliquids that degrade the slit image due to the passage of light through these currents. To avoid theseconvection currents the use of a method that circulates the liquid in the cell is suggested.

Sensors 2017, 17, 266 12 of 13
Regarding the hysteresis behavior of the prisms, here we describe an example with the Pellin-Brocaprism. In the experiment, the starting temperature was about room temperature. Then it increaseduntil it reached about 40 ◦C. At that stage the hot plate was left to cool. The slit position behavior canbe seen in Figure 17.
Sensors 2017, 17, 266 12 of 13
increased until it reached about 40 °C. At that stage the hot plate was left to cool. The slit position
behavior can be seen in Figure 17.
Figure 17. Experimental data showing the behavior of the slit position as a function of temperature
when it increased and decreased. A Pellin-Broca prism was used.
9. Conclusions and Comments
We have shown that it is possible to fabricate hollow grisms that cover a spectral band in the
visible region. Central or undeviated wavelengths can be selected by changing the liquid in the
grism. Thus it is not necessary to fabricate several grisms to select the central wavelength. Regarding
the spectral range it can be selected by using liquids with different refractive indices.
Additionally, we have shown that a hollow Pellin-Broca prism can be used to disperse light.
When used in a constant deviation spectroscope it is possible to select the central output wavelength
by changing the liquid in the prism. That is, it is not necessary to rotate the prism, as is commonly
done.
The use of hollow prisms as thermometers was also shown. A calibration graph was obtained
relating the position of the slit image as the liquid temperature changed. Slit image position was
found visually with the help of an ocular. To perform this reading automatically we suggest using a
CCD or CMOS linear or matrix sensor. Some CCDs have pixels of about 5 µm × 5 µm with a distance
between pixels of a few microns. Thus, the edge of the slit could fall on a CCD sensor and its position
could be quantified.
The temperature measurement methods with the two hollow prisms present different
characteristics. The main results are shown in the graph of Figure 15 for the grism and graphed in
Figure 16 for the Pellin-Broca. The best sensitivity for the grism was 0.021 mm/°C and for the
Pellin-Broca 0.4 mm/°C. Thus, if one needs good sensitivity in a range between 27 °C to 32 °C the
second prism filled with glycerin should be selected. However, if the required sensitivity is low, but
the range is between 26 °C and 40 °C, it is useful to use the Pellin-Broca filled with water. Optical
configurations of both hollow prisms are versatile because it is possible to change parameters like
the density and refractive index of the liquid, and/or the focal length of the lens in the telescope.
With these parameters we can adapt the optical setup to our needs.
Regarding the time to reach stability when a measurement is conducted depends on the size of
the prism and the liquid used. Considering that the prisms have dimensions of several centimeters and
that the liquids used were water, isopropyl alcohol, and glycerin, the time for a thermal stability
condition was about 1.5 min when temperatures changed by a few degrees. However, in the setups
presented, the response time was about 30 s. These lapses of time could be shortened if the prisms are
smaller or the liquids and the materials with which the prisms are made have a smaller thermal inertia.
Figure 17. Experimental data showing the behavior of the slit position as a function of temperaturewhen it increased and decreased. A Pellin-Broca prism was used.
9. Conclusions and Comments
We have shown that it is possible to fabricate hollow grisms that cover a spectral band in thevisible region. Central or undeviated wavelengths can be selected by changing the liquid in the grism.Thus it is not necessary to fabricate several grisms to select the central wavelength. Regarding thespectral range it can be selected by using liquids with different refractive indices.
Additionally, we have shown that a hollow Pellin-Broca prism can be used to disperse light. Whenused in a constant deviation spectroscope it is possible to select the central output wavelength bychanging the liquid in the prism. That is, it is not necessary to rotate the prism, as is commonly done.
The use of hollow prisms as thermometers was also shown. A calibration graph was obtainedrelating the position of the slit image as the liquid temperature changed. Slit image position was foundvisually with the help of an ocular. To perform this reading automatically we suggest using a CCD orCMOS linear or matrix sensor. Some CCDs have pixels of about 5 µm × 5 µm with a distance betweenpixels of a few microns. Thus, the edge of the slit could fall on a CCD sensor and its position couldbe quantified.
The temperature measurement methods with the two hollow prisms present differentcharacteristics. The main results are shown in the graph of Figure 15 for the grism and graphedin Figure 16 for the Pellin-Broca. The best sensitivity for the grism was 0.021 mm/◦C and for thePellin-Broca 0.4 mm/◦C. Thus, if one needs good sensitivity in a range between 27 ◦C to 32 ◦C thesecond prism filled with glycerin should be selected. However, if the required sensitivity is low, butthe range is between 26 ◦C and 40 ◦C, it is useful to use the Pellin-Broca filled with water. Opticalconfigurations of both hollow prisms are versatile because it is possible to change parameters likethe density and refractive index of the liquid, and/or the focal length of the lens in the telescope.With these parameters we can adapt the optical setup to our needs.
Regarding the time to reach stability when a measurement is conducted depends on the size ofthe prism and the liquid used. Considering that the prisms have dimensions of several centimetersand that the liquids used were water, isopropyl alcohol, and glycerin, the time for a thermal stabilitycondition was about 1.5 min when temperatures changed by a few degrees. However, in the setups

Sensors 2017, 17, 266 13 of 13
presented, the response time was about 30 s. These lapses of time could be shortened if the prisms aresmaller or the liquids and the materials with which the prisms are made have a smaller thermal inertia.
Acknowledgments: We thank Raymundo Mendoza for some drawings.
Author Contributions: S.C. conceived and designed the experiments; S.C. and I.T.G. performed the experiments;M.R.A. analyzed the data; S.C. wrote the paper.
Conflicts of Interest: The authors declare no conflict of interest.
References
1. Palmer, C. Diffraction Grating Handbook; Milton Roy Company: Warminster, PA, USA, 1994.2. Gibson, E.A.; Gaudosi, D.M.; Kapteyn, H.C.; Jimenez, R. Efficient reflection grisms for pulse compression
and dispersion compensation of femtosecond pulses. Opt. Lett. 2006, 31, 3363–3365. [CrossRef] [PubMed]3. Near Infrared Camera and Multi-Object Spectrometer (NICMOS). Available online: http://www.stsci.edy/
nicmos (accessed on 28 October 2016).4. Smith, E.C.; McLean, I.S. Grism spectroscopy with FLITECAM. Proc. SPIE 2006, 6269. [CrossRef]5. Swift UVOT (Ultra-Violet Optical Telescope). Available online: http://www.mssl.ucl.ac.uk/general/
projects/swift/uvot.htm (accessed on 28 October 2016).6. Northern Optical Telescope. Available online: http://not.iac.es (accessed on 26 October 2016).7. Calixto, S.; Rosete-Aguilar, M.; Garnica, G.; Torres, I. An optofluidic grism. In Proceedings of the SPIE 18th
Conference on Novel Optical systems Design and Optimization, San Diego, CA, USA, 10–12 August 2015.8. Longhurst, R.S. Geometrical and Physical Optics; Longman: London, UK, 1967.9. Nicholas, J.V.; White, D.R. Traceable Temperatures; Wiley: Chichester, UK, 2004.10. Michalski, L.; Eckersdurf, K.; Kucharski, J.; McGee, J. Temperature Measurements; John Wiley: Chichester, UK, 2000.11. Liu, G.; Han, M.; Hou, W. High-resolution and fast-response fiber-optic temperature sensor using silicon
Fabry-Perot cavity. Opt. Express 2015, 23, 7237–7247. [CrossRef] [PubMed]12. Bashkatov, A.N.; Genina, E.A. Water refractive index in dependence on temperature and wavelength:
A simple approximation. Proc. SPIE 2003, 5068, 393–395.13. Drake, M.C.; Lapp, M.; Penney, C.M. Use of the vibrational Raman effect for gas temperature measurements.
Temp. Meas. Control Sci. Ind. 1982, 5, 631–638.14. Rahn, L.A.; Johnston, S.C.; Farow, R.L.; Matten, P.L. CARS thermometry in an internal combustion engine.
Temp. Meas. Control Sci. Ind. 1982, 5, 609–613.15. Schena, E.; Tosi, D.; Saccomandi, P.; Lews, E.; Taesung, K. Fiber optic sensors for temperature monitoring
during Thermal Treatments: An overview. Sensors 2016, 16, 1144. [CrossRef] [PubMed]16. Khalid, A.H.; Kontis, K. Thermographic phospors for high temperature measurements: Principles, current
state of the art and recent applications. Sensors 2008, 8, 5673–5744. [CrossRef] [PubMed]17. Mcgee, T.D. Principles and Methods of Temperature Measurement; Wiley Interscience: New York, NY, USA, 1988.18. Goldstein, R.J. Optical Techniques for temperature measurements. In Measurements in Heat Transfer; Eckert, E.R.G.,
Goldstein, R.J., Eds.; Hemisphere Publishing Corporation: Washington, DC, USA, 1976; pp. 241–293.19. Reddy, B.R.; Kamma, I.; Kommidi, P. Optical sensing techniques for measurement temperature. Appl. Opt.
2013, 52, B33–B39. [CrossRef] [PubMed]20. Ahadi, A.; Saghir, M.Z. Determination of the glass wall effect in optical measurement of temperature in
liquid using Mach-Zehnder interferometer. Appl. Opt. 2015, 54, D74–D81. [CrossRef]21. Lu, P.; Men, L.; Sooley, K.; Chen, Q. Tapered fiber Mach-Zehnder interferometer for simultaneous
measurement of refractive index and temperature. Appl. Phys. Lett. 2009, 94, 131110. [CrossRef]22. Schiebener, P.; Straub, J.; Levelt Sengers, J.M.H.; Galagher, J.S. Refractive index of water as a function of
wavelength, temperature and density. J. Phys. Chem. Ref. Data 1990, 19, 677–717. [CrossRef]23. The Merck Index. Merck and Co. Inc. Available online: http://www.rsc.org/Merck-Index/ (accessed on
31 October 2016).
© 2017 by the authors; licensee MDPI, Basel, Switzerland. This article is an open accessarticle distributed under the terms and conditions of the Creative Commons Attribution(CC BY) license (http://creativecommons.org/licenses/by/4.0/).