
Liquid Rocket Propellants: Ethanol as Fuelgjar.org/publishpaper/vol2issue1/d86r80.pdf · Liquid...
11
Vol-2, Issue-1 PP. 109-119 ISSN: 2394-5788 109 | Page 30 January 2015 www.gjar.org Liquid Rocket Propellants: Ethanol as Fuel Gottmann, C. A. Divisão de Propulsão Espacial, Instituto de Aeronáutica e Espaço Pça. Mal. Eduardo Gomes, 50, Vila das Acácias, São José dos Campos, SP, Brazil Alves, W. F. Divisão de Propulsão Espacial, Instituto de Aeronáutica e Espaço Pça. Mal. Eduardo Gomes, 50, Vila das Acácias, São José dos Campos, SP, Brazil Rocco, J. A. F. F. Departamento de Química, Instituto Tecnológico de Aeronáutica Pça. Mal. Eduardo Gomes, 50, Vila das Acácias, São José dos Campos/SP - Brazil Iha, K. Departamento de Química, Instituto Tecnológico de Aeronáutica Pça. Mal. Eduardo Gomes, 50, Vila das Acácias, São José dos Campos - SP - Brazil Gonçalves, R. F. B. Laboratório de Engenharia Mecânica, Universidade Federal do Pará Av. Augusto Corrêa 1, Belém – PA - Brazil ABSTRACT Simulations of propulsive parameters of ethanol/water formulations (99.5 %, 85%, 75% and 70%) are presented, using real combustor parameters. The simulations were performed using the CEA - Computer program for calculation of complex chemical equilibrium compositions and Chemkin, which considers kinetic and thermodynamic parameters (plug flow reactor). According to CEA results, the optimum oxidizer/fuel ratio is 1.6 for the present system. Using this ratio, the simulation showed a specific impulse Is = 226 s and in the experimental test, the specific impulse was obtained Is = 224s (~Δ=0.9%). The characteristic velocity simulated was 1732 m/s, and the one obtained in the test was 1967 m/s (~Δ=11%). The method is then a feasible method for predicting real engine systems. General Terms Experimental evaluation of propellant with theoretical validation. Keywords Ethanol, Combustion, Rocket Engine 1. INTRODUCTION In rocket propulsion, especially where liquid propellant is used, it is observed that there is a revisionist tendency due to the toxicity, high corrosivity and pollution generation[1],[2]. Currently has been more attractive to use those with low toxicity, called "green propellants". These "green propellants" could replace, for example, mixtures of oxygen and kerosene, hydrazines and dinitrogen tetroxide, and others are in use. The fact is that these aggressive propellants cause environmental damage such as soil contamination and water tables (if an explosion occurs in the soil); there are interactions of gases with the atmosphere during the upward flight (or if an explosion occurs), apart from the impacts associated with toxicology and corrosiveness thereof. Among some of the list of green propellants, liquid category, there are hydrogen peroxide, methane, nitrous oxide, oxygen, hydrogen and ethanol. The pair ethanol and liquid oxygen is well known[3], and it is considered as one of the viable alternatives in these migrations, due to its low toxicity and availability. The use of ethanol associated with liquid oxygen as a propellant for rockets is not new. One can cite, for example, the V- 2 rocket used by the Germans in the Second World War[4]. Another study that should be mentioned is that of A.B.P. Beeton, “The calculated performance of ethyl alcohol -water mixtures the rocket fuels with liquid oxygen” published in the Aeronautical Research Council, England, in 1948.
Transcript of Liquid Rocket Propellants: Ethanol as Fuelgjar.org/publishpaper/vol2issue1/d86r80.pdf · Liquid...

Vol-2, Issue-1 PP. 109-119 ISSN: 2394-5788
109 | P a g e 3 0 J a n u a r y 2 0 1 5 w w w . g j a r . o r g
Liquid Rocket Propellants: Ethanol as Fuel
Gottmann, C. A. Divisão de Propulsão Espacial,
Instituto de Aeronáutica e Espaço
Pça. Mal. Eduardo Gomes, 50,
Vila das Acácias, São José dos
Campos, SP, Brazil
Alves, W. F. Divisão de Propulsão Espacial,
Instituto de Aeronáutica e Espaço
Pça. Mal. Eduardo Gomes, 50,
Vila das Acácias, São José dos
Campos, SP, Brazil
Rocco, J. A. F. F. Departamento de Química,
Instituto Tecnológico de
Aeronáutica
Pça. Mal. Eduardo Gomes, 50,
Vila das Acácias, São José dos
Campos/SP - Brazil
Iha, K. Departamento de Química, Instituto Tecnológico de
Aeronáutica
Pça. Mal. Eduardo Gomes, 50, Vila das Acácias, São
José dos Campos - SP - Brazil
Gonçalves, R. F. B. Laboratório de Engenharia Mecânica, Universidade
Federal do Pará
Av. Augusto Corrêa 1, Belém – PA - Brazil
ABSTRACT
Simulations of propulsive parameters of ethanol/water formulations (99.5 %, 85%, 75% and 70%) are presented, using
real combustor parameters. The simulations were performed using the CEA - Computer program for calculation of
complex chemical equilibrium compositions and Chemkin, which considers kinetic and thermodynamic parameters (plug
flow reactor). According to CEA results, the optimum oxidizer/fuel ratio is 1.6 for the present system. Using this ratio,
the simulation showed a specific impulse Is = 226 s and in the experimental test, the specific impulse was obtained Is =
224s (~Δ=0.9%). The characteristic velocity simulated was 1732 m/s, and the one obtained in the test was 1967 m/s
(~Δ=11%). The method is then a feasible method for predicting real engine systems.
General Terms
Experimental evaluation of propellant with theoretical validation.
Keywords
Ethanol, Combustion, Rocket Engine
1. INTRODUCTION In rocket propulsion, especially where liquid propellant is used, it is observed that there is a revisionist tendency due to
the toxicity, high corrosivity and pollution generation[1],[2]. Currently has been more attractive to use those with low
toxicity, called "green propellants". These "green propellants" could replace, for example, mixtures of oxygen and
kerosene, hydrazines and dinitrogen tetroxide, and others are in use.
The fact is that these aggressive propellants cause environmental damage such as soil contamination and water tables (if
an explosion occurs in the soil); there are interactions of gases with the atmosphere during the upward flight (or if an
explosion occurs), apart from the impacts associated with toxicology and corrosiveness thereof.
Among some of the list of green propellants, liquid category, there are hydrogen peroxide, methane, nitrous oxide,
oxygen, hydrogen and ethanol. The pair ethanol and liquid oxygen is well known[3], and it is considered as one of the
viable alternatives in these migrations, due to its low toxicity and availability.
The use of ethanol associated with liquid oxygen as a propellant for rockets is not new. One can cite, for example, the V-
2 rocket used by the Germans in the Second World War[4]. Another study that should be mentioned is that of A.B.P.
Beeton, “The calculated performance of ethyl alcohol-water mixtures the rocket fuels with liquid oxygen” published in
the Aeronautical Research Council, England, in 1948.

Vol-2, Issue-1 PP. 109-119 ISSN: 2394-5788
110 | P a g e 3 0 J a n u a r y 2 0 1 5 w w w . g j a r . o r g
The purpose of this work is to present simulations of propulsive parameters of ethanol, with variations in concentration
with water, as well as combustion simulations, considering kinetic and thermodynamic parameters. These results are
useful in the pre-design engines for rockets.
2. METHODOLOGY In order to compare propellant parameters, ethanol/water and oxygen formulations with concentrations of 99.5
%, 85%, 75% and 70% were considered. The simulations were performed using the CEA - Computer program for
calculation of complex chemical equilibrium compositions[5]. Simulations in a plug flow reactor (PFR reactor - Chemkin
4.1) were also developed for comparison purposes, using the same combustion chamber dimensions and physical
characteristics. The PFR model is used to predict the behavior of chemical reactors of such design, so that key reactor
variables, such as the dimensions of the reactor, can be estimated. Fluid going through a PFR may be modeled as flowing
through the reactor as a series of infinitely thin coherent "plugs", each with a uniform composition, traveling in the axial
direction of the reactor, with each plug having a different composition from the ones before and after it. The key
assumption is that as a plug flows through a PFR, the fluid is perfectly mixed in the radial direction but not in the axial
direction (forwards or backwards). Each plug of differential volume is considered as a separate entity, effectively an
infinitesimally small continuous stirred tank reactor, limiting to zero volume. This model was used to verify the influence
of water molecules in the overall behavior of a liquid propellant rocket motor.
The dimensions and physical data for each reactor are presented below. These data were part of the input set
used in Chemkin software:
- Diameter: 0.04 m
- Length: 103.17 cm
- Temperature prior to combustion: 700 K
- Pressure: 15.0 bar
The mechanism used in this work for ethanol combustion was assembled by Marinov[6] and consists of 369
different elementary reactions.
Experimental trials were conducted in the lab of liquid propulsion, at the Institute of Aeronautics and Space,
which developed a thrust chamber with a review of 0.0066 m2 to test thrusters of 1 kN. This camera can perform tests
with liquid fuel (in this case, liquid ethanol and gaseous oxygen as oxidizer).
3. RESULTS AND DISCUSSION
3.1 Simulations In the developed simulations were emphasized both the combustion temperature parameter and characteristic burning
rate in terms of fuel/oxidizer (F/O) ratios.
Figures 1 and 2 show the formulations mixtures of water with ethanol (99.5%, 85% and 70%) with regard to combustion
temperature and characteristic velocity of ejection.
Figure 1. Hydrated ethanol 99.5%, 85% and 70% in function of the F/O ratios.

Vol-2, Issue-1 PP. 109-119 ISSN: 2394-5788
111 | P a g e 3 0 J a n u a r y 2 0 1 5 w w w . g j a r . o r g
Figure 2. Hydrous ethanol to 99.5%, 85% and 70% in function of the characteristic velocity of ejection.
The complete combustion reaction of ethanol is described below:
C2H5OH + 3 O2 2 CO2 + 3 H2O
According to the reaction above, the stoichiometric molar ratio of ethanol and oxygen is 1:3. Therefore, when
the concentration of oxygen in the mixture is lower than the one determined by this ratio, the combustion is flawed. This
deficiency in oxidizer species is seen in the beginning of the curves (Figs. 1 and 2). From 0.6 to 1.1 (O/F ratio), the
temperature in the chamber achieves low values, when compared to the one reached with minimum or small excess of
oxygen. However, high content of oxidizer species also reduce the combustion efficiency; the optimum amount, based on
the curves, is 1.6.
For comparison purposes, simulations in a plug flow reactor (PFR) were done. Figure 3 below present analysis of the
exhaust gas temperature, velocity and unburned hydrocarbons according to the equivalence ratio (ethanol 100%). The
curve shape is similar to the obtained above, showing the consistency of the model used. The differences between both
analyses are the temperature level and optimum equivalence ratio (lower in PFR simulation). This happens because the
first simulation considers gaseous oxygen as oxidizer specie, while the latter one considers presents the effects using air
(nitrogen addition to the system).

Vol-2, Issue-1 PP. 109-119 ISSN: 2394-5788
112 | P a g e 3 0 J a n u a r y 2 0 1 5 w w w . g j a r . o r g
Figure 3: PFR simulation of pure ethanol combustion, presenting the temperature variation, velocity and
unburned hydrocarbons according to the equivalence ratio
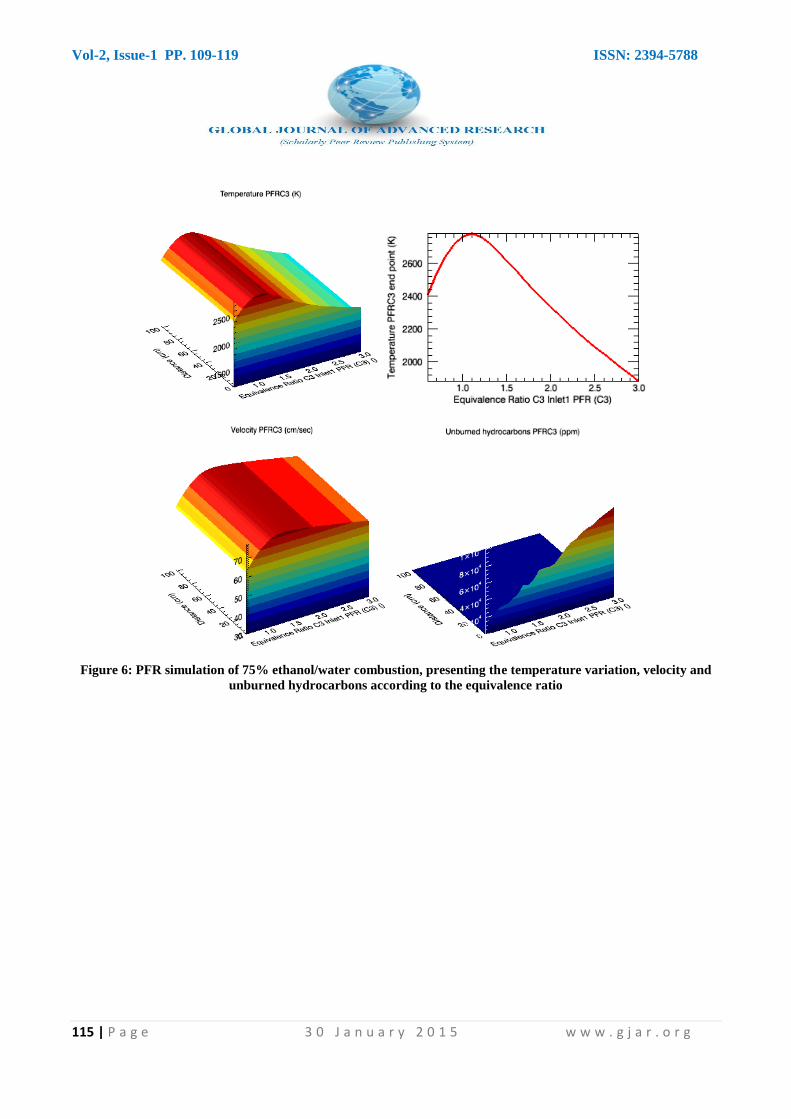
Figures 4 to 7 present the results obtained for ethanol/water simulations (99.5%, 85%, 75% and 70% respectively). The
shapes of each surface are similar (except for the unburned hydrocarbons), with slight decrease in accord to the
increasing water concentration.

Vol-2, Issue-1 PP. 109-119 ISSN: 2394-5788
113 | P a g e 3 0 J a n u a r y 2 0 1 5 w w w . g j a r . o r g
Figure 4: PFR simulation of 99,5% ethanol/water combustion, presenting the temperature variation, velocity and
unburned hydrocarbons according to the equivalence ratio

Vol-2, Issue-1 PP. 109-119 ISSN: 2394-5788
114 | P a g e 3 0 J a n u a r y 2 0 1 5 w w w . g j a r . o r g
Figure 5: PFR simulation of 85% ethanol/water combustion, presenting the temperature variation, velocity and
unburned hydrocarbons according to the equivalence ratio
Vol-2, Issue-1 PP. 109-119 ISSN: 2394-5788
115 | P a g e 3 0 J a n u a r y 2 0 1 5 w w w . g j a r . o r g
Figure 6: PFR simulation of 75% ethanol/water combustion, presenting the temperature variation, velocity and
unburned hydrocarbons according to the equivalence ratio

Vol-2, Issue-1 PP. 109-119 ISSN: 2394-5788
116 | P a g e 3 0 J a n u a r y 2 0 1 5 w w w . g j a r . o r g
Figure 7: PFR simulation of 70% ethanol/water combustion, presenting the temperature variation, velocity and
unburned hydrocarbons according to the equivalence ratio
CEA calculations were also developed varying both the ethanol/water ratio and the equivalence ratio of the combustion.
The effects may be observed in terms of specific impulse and are shown in Figure 8 below. As previously stated, the
performance of the system decreases with the increasing water content, but the shape of each curve remains similar,
demonstrating the effect of temperature absorption of the water molecules in the flame. It is interesting to observe,
though, that the specific impulse observed with 99.5% ethanol is lower than the one for 85% of ethanol. This
phenomenon must be happening due to the water participation on the combustion mechanism for 85%; with only 0.5%,
the effect must be only negative to the combustion, lowering the flame temperature.

Vol-2, Issue-1 PP. 109-119 ISSN: 2394-5788
117 | P a g e 3 0 J a n u a r y 2 0 1 5 w w w . g j a r . o r g
Figure 8 – Specific impulse developed for ethanol/water mixtures of 100%, 99.5%, 85%, 75% and 70% (ethanol),
respectively.
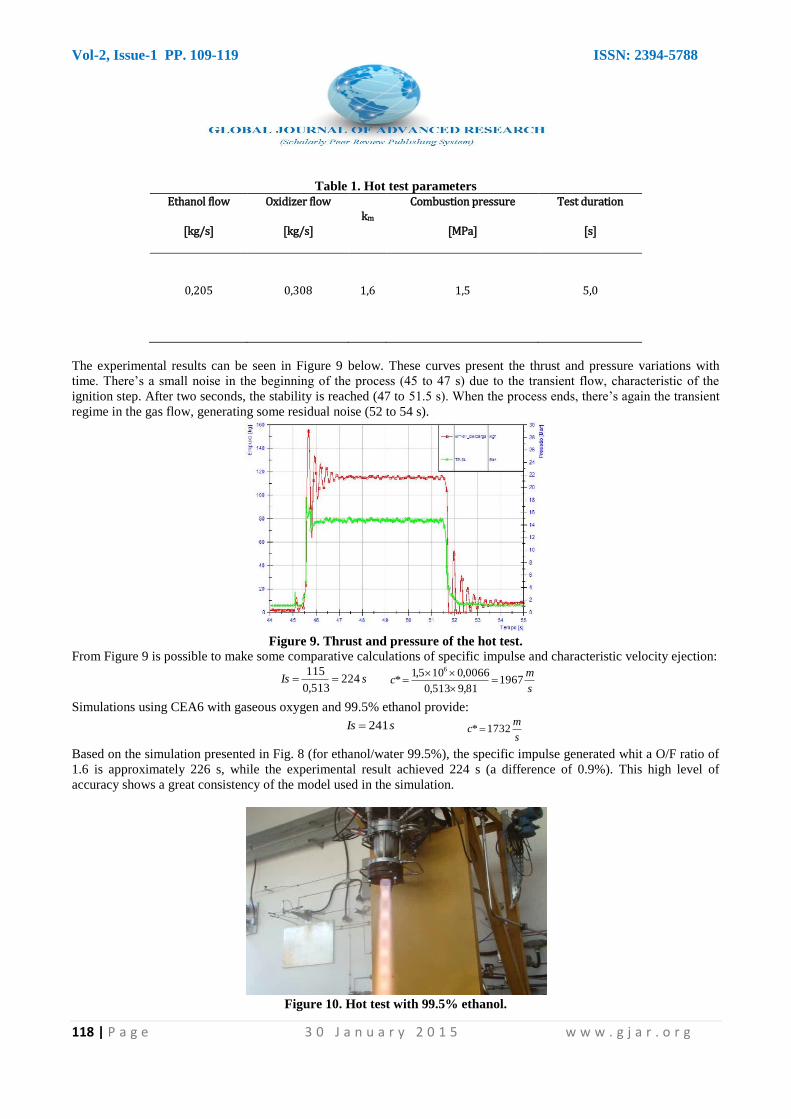
3.2 Experimental trials The simulation results can be compared to experimental trials, using the same combustion chamber characteristics and
conditions. For ethanol/water, the formulation considered for the trial was 99.5% ethanol and gaseous oxygen, as it
demonstrated the higher specific impulse in the curves, among all other ethanol/water formulations. The test parameters
used are listed in Table 1 below:
Vol-2, Issue-1 PP. 109-119 ISSN: 2394-5788
118 | P a g e 3 0 J a n u a r y 2 0 1 5 w w w . g j a r . o r g
Table 1. Hot test parameters
Ethanol flow
[kg/s]
Oxidizer flow
[kg/s] km
Combustion pressure
[MPa]
Test duration
[s]
0,205
0,308
1,6
1,5
5,0
The experimental results can be seen in Figure 9 below. These curves present the thrust and pressure variations with
time. There’s a small noise in the beginning of the process (45 to 47 s) due to the transient flow, characteristic of the
ignition step. After two seconds, the stability is reached (47 to 51.5 s). When the process ends, there’s again the transient
regime in the gas flow, generating some residual noise (52 to 54 s).
Figure 9. Thrust and pressure of the hot test.
From Figure 9 is possible to make some comparative calculations of specific impulse and characteristic velocity ejection:
sIs 224513,0
115
s
mc 1967
81,9513,0
0066,0105,1*
6
Simulations using CEA6 with gaseous oxygen and 99.5% ethanol provide:
sIs 241 s
mc 1732*
Based on the simulation presented in Fig. 8 (for ethanol/water 99.5%), the specific impulse generated whit a O/F ratio of
1.6 is approximately 226 s, while the experimental result achieved 224 s (a difference of 0.9%). This high level of
accuracy shows a great consistency of the model used in the simulation.
Figure 10. Hot test with 99.5% ethanol.

Vol-2, Issue-1 PP. 109-119 ISSN: 2394-5788
119 | P a g e 3 0 J a n u a r y 2 0 1 5 w w w . g j a r . o r g
4. CONCLUSION In the case of ethanol, Figure 1 shows that for a mixture ratio Km>1,5 combustion temperatures are
higher for lower concentrations of water. For a mixture ratio of Km <1.3 the reverse occurs, i.e. the
combustion temperatures are higher for higher water concentrations. In the range 1.35 to 1.4 the
differences are not significant between the concentrations and the temperature is almost the same.
Regarding the verification test, the simulation showed a specific impulse Is = 226 s and in the
experimental test, the specific impulse was obtained Is = 224s (~Δ=0.9%). The characteristic velocity
simulated was 1732 m/s, and the one obtained in the test was 1967 m/s (~Δ=11%). According to Sutton
and Biblarz[7] is necessary to consider the inevitable losses and inefficiencies that occur in the process.
Such a small deviation shows that the model can be useful on modeling engines and rockets with enough
accuracy.
The use of anhydrous or hydrated ethanol is therefore a fully feasible alternative, only dependent
on the required task.
5. REFERENCES [1] Haeseler, D., Götz, A., Fröhlich, A., 2000 “Non-Toxic propellants for future advanced launcher
propulsion systems”, 36th AIAA/ASME/SAE/ASEE Joint Propulsion Conference and Exhibit, A00-
36840
[2] Miller, T.F, Herr, J.D., 2004 “Green Rocket Propulsion by Reaction of Al and Mg Powders and
Water”, 40th AIAA/ASME/SAE/ASEE Joint Propulsion Conference and Exhibit, AIAA 2004-4037
[3] McCleskey, C.M., Christensen, D.L., 2001 “Dr. Kurt H. Debus: Launching a Vision”, 52nd
International Astronautical Congress, IAA-01-IAA-2.1.08
[4] Petersen, M.B., 2005 PhD Thesis, Faculty of the Graduate School of the University of Maryland,
“Engineering consent: Peenemuende, National Socialism, and The V-2 missile” 1924-1945, USA
[5] Gordon,S., McBride,B.J., 1971 “Computer program for calculation of complex chemical equilibrium
compositions, Rocket performance, incident and reflect shocks, and Chapman-Jouguet detonations”,
NASA, SP-273
[6] Marinov, N. M, 1999 "A Detailed Chemical Kinetic Model for High Temperature Ethanol
Oxidation," Int. J. Chem. Kinet. 31:183-220; Lawrence Livermore National Laboratory, Livermore,
CA, UCRL-JC-131657.
[7] Sutton, G. P., Biblarz, O., 2010 “Rocket Propulsion Elements”, 8th ed., John Wiley & Sons, Inc.
New York


