Liquid-Crystal Microdroplets as Optical Microresonators and Lasers
135
LIQUID-CRYSTAL MICRODROPLETS AS OPTICAL MICRORESONATORS AND LASERS Matjaˇ z Humar
Transcript of Liquid-Crystal Microdroplets as Optical Microresonators and Lasers

LIQUID-CRYSTAL MICRODROPLETS ASOPTICAL MICRORESONATORS AND
LASERS
Matjaz Humar

Doctoral DissertationJozef Stefan International Postgraduate SchoolLjubljana, Slovenia, February 2012
Evaluation Board:
Prof. Bostjan Zalar, Chairman, Jozef Stefan Institute, Ljubljana, Slovenia
Asst. Prof. Miha Skarabot, Member, Jozef Stefan Institute, Ljubljana, Slovenia
Prof. Slobodan Zumer, Member, University of Ljubljana, Ljubljana, Slovenia
Matjaz Humar
LIQUID-CRYSTAL MICRODROPLETSAS OPTICAL MICRORESONATORSAND LASERS
Doctoral Dissertation
TEKOCEKRISTALNE MIKROKAPLJICEKOT OPTICNI MIKRORESONATORJI INLASERJI
Doktorska disertacija
Supervisor : Prof. Igor Musevic
Ljubljana, Slovenia, February 2012


Poets say science takes away from the beauty of the stars - mere globs of gas atoms. I, too, cansee the stars on a desert night, and feel them. But do I see less or more?
Richard P. Feynman


VII
Index
Abstract XI
Povzetek XII
Abbreviations XIII
1 Introduction 1
1.1 Whispering-gallery modes . . . . . . . . . . . . . . . . . . . . . . . . . . . . . 1
1.1.1 Tunable WGMs . . . . . . . . . . . . . . . . . . . . . . . . . . . . . . . 2
1.1.2 WGM microcavities for biosensing . . . . . . . . . . . . . . . . . . . . 3
1.1.3 WGM microcavities for filters and optical communications . . . . . . . 4
1.1.4 WGM ultralow-threshold microlasers . . . . . . . . . . . . . . . . . . . 4
1.1.5 Coupled WGM cavities . . . . . . . . . . . . . . . . . . . . . . . . . . 4
1.2 Circular and spherical Bragg microcavities . . . . . . . . . . . . . . . . . . . . 5
1.3 Liquid crystals . . . . . . . . . . . . . . . . . . . . . . . . . . . . . . . . . . . 6
1.3.1 Polymer dispersed liquid crystals . . . . . . . . . . . . . . . . . . . . . 6
1.3.2 Lasing in cholesteric liquid crystals . . . . . . . . . . . . . . . . . . . . 7
1.3.3 Liquid crystal biosensors . . . . . . . . . . . . . . . . . . . . . . . . . . 8
1.4 Goal of the thesis . . . . . . . . . . . . . . . . . . . . . . . . . . . . . . . . . . 10
2 Theoretical background 13
2.1 Optical microcavities . . . . . . . . . . . . . . . . . . . . . . . . . . . . . . . . 13
2.1.1 Quality factor . . . . . . . . . . . . . . . . . . . . . . . . . . . . . . . . 13
2.1.2 Purcell effect . . . . . . . . . . . . . . . . . . . . . . . . . . . . . . . . 14
2.2 Theory of WGMs . . . . . . . . . . . . . . . . . . . . . . . . . . . . . . . . . . 15
2.2.1 WGM frequencies in an isotropic sphere . . . . . . . . . . . . . . . . . 15
2.2.2 Approximate solutions . . . . . . . . . . . . . . . . . . . . . . . . . . . 18
2.2.3 Non-spherical whispering-gallery cavity . . . . . . . . . . . . . . . . . 19
2.2.4 WGM frequencies in an anisotropic sphere . . . . . . . . . . . . . . . . 20
2.2.5 Excitation of WGMs . . . . . . . . . . . . . . . . . . . . . . . . . . . . 21
2.2.5.1 Evanescent field coupling . . . . . . . . . . . . . . . . . . . . 21
2.2.5.2 Fluorescence . . . . . . . . . . . . . . . . . . . . . . . . . . . 21
2.3 Theory of lasing . . . . . . . . . . . . . . . . . . . . . . . . . . . . . . . . . . 21
2.4 Bragg microcavities . . . . . . . . . . . . . . . . . . . . . . . . . . . . . . . . . 23
2.5 Liquid crystals . . . . . . . . . . . . . . . . . . . . . . . . . . . . . . . . . . . 25
2.5.1 Introduction to liquid crystals . . . . . . . . . . . . . . . . . . . . . . . 25
2.5.1.1 Nematic liquid crystals . . . . . . . . . . . . . . . . . . . . . 25
2.5.1.2 Order parameter . . . . . . . . . . . . . . . . . . . . . . . . . 26
2.5.1.3 Elastic properties of liquid crystals . . . . . . . . . . . . . . . 26
2.5.1.4 Electric field effect in liquid crystals . . . . . . . . . . . . . . 26
2.5.1.5 Change of the refractive indices of liquid crystals by temper-ature . . . . . . . . . . . . . . . . . . . . . . . . . . . . . . . 27

VIII INDEX
2.5.2 Surface anchoring of liquid crystals . . . . . . . . . . . . . . . . . . . . 282.5.2.1 Anchoring on a anisotropic surface . . . . . . . . . . . . . . . 282.5.2.2 Anchoring on an isotropic surface . . . . . . . . . . . . . . . 29
2.5.3 Cholesteric liquid crystals . . . . . . . . . . . . . . . . . . . . . . . . . 292.5.3.1 Position and width of the photonic bandgap . . . . . . . . . 30
3 Materials and methods 313.1 Liquid crystals . . . . . . . . . . . . . . . . . . . . . . . . . . . . . . . . . . . 313.2 Dyes . . . . . . . . . . . . . . . . . . . . . . . . . . . . . . . . . . . . . . . . . 313.3 Carrying medium . . . . . . . . . . . . . . . . . . . . . . . . . . . . . . . . . . 323.4 Making dispersion of LC droplets . . . . . . . . . . . . . . . . . . . . . . . . . 333.5 Optical setup . . . . . . . . . . . . . . . . . . . . . . . . . . . . . . . . . . . . 343.6 Microfluidic setup for chemical sensing . . . . . . . . . . . . . . . . . . . . . . 373.7 Setup for angular measurements of the 3D laser emission . . . . . . . . . . . . 383.8 Setup for 3D laser polarization measurements . . . . . . . . . . . . . . . . . . 393.9 Sample preparation and setup for strain tuning . . . . . . . . . . . . . . . . . 403.10 Sample preparation for electric field tuning . . . . . . . . . . . . . . . . . . . 413.11 Preparation of cholesteric 3D lasers . . . . . . . . . . . . . . . . . . . . . . . . 41
4 Experimental results and discussion 434.1 Dispersion of liquid-crystal droplets . . . . . . . . . . . . . . . . . . . . . . . . 434.2 Whispering-gallery modes in nematic liquid-crystal droplets . . . . . . . . . . 46
4.2.1 Polarization properties . . . . . . . . . . . . . . . . . . . . . . . . . . . 484.2.2 Fitting the WGMs . . . . . . . . . . . . . . . . . . . . . . . . . . . . . 514.2.3 Q-factor . . . . . . . . . . . . . . . . . . . . . . . . . . . . . . . . . . . 51
4.3 Electric field tuning of WGMs in nematic droplets . . . . . . . . . . . . . . . 534.3.1 Director distortion under electric field . . . . . . . . . . . . . . . . . . 534.3.2 WGMs under electric field . . . . . . . . . . . . . . . . . . . . . . . . . 534.3.3 Tuning of multiple droplets . . . . . . . . . . . . . . . . . . . . . . . . 574.3.4 In-plane electric field . . . . . . . . . . . . . . . . . . . . . . . . . . . . 574.3.5 Electric field with droplets containing particles . . . . . . . . . . . . . 58
4.4 Temperature tuning . . . . . . . . . . . . . . . . . . . . . . . . . . . . . . . . 614.5 Optical tuning . . . . . . . . . . . . . . . . . . . . . . . . . . . . . . . . . . . 654.6 Strain tuning . . . . . . . . . . . . . . . . . . . . . . . . . . . . . . . . . . . . 694.7 Chemical sensors based on WGMs in LC droplets . . . . . . . . . . . . . . . . 71
4.7.1 LC droplets at different surfactant concentrations . . . . . . . . . . . . 714.7.2 Lasing in LC droplets . . . . . . . . . . . . . . . . . . . . . . . . . . . 724.7.3 Sensing characteristics . . . . . . . . . . . . . . . . . . . . . . . . . . . 744.7.4 Sensing in non-lasing regime . . . . . . . . . . . . . . . . . . . . . . . 76
4.8 3D laser . . . . . . . . . . . . . . . . . . . . . . . . . . . . . . . . . . . . . . . 774.8.1 Cholesteric liquid-crystal droplets . . . . . . . . . . . . . . . . . . . . . 774.8.2 Simulation of the CLC droplet configuration . . . . . . . . . . . . . . 784.8.3 Lasing characterization . . . . . . . . . . . . . . . . . . . . . . . . . . 814.8.4 Polarization . . . . . . . . . . . . . . . . . . . . . . . . . . . . . . . . . 854.8.5 Angle dependance . . . . . . . . . . . . . . . . . . . . . . . . . . . . . 864.8.6 Tunability . . . . . . . . . . . . . . . . . . . . . . . . . . . . . . . . . . 864.8.7 Lasing of higher Bragg modes . . . . . . . . . . . . . . . . . . . . . . . 874.8.8 Polymerizable 3D laser . . . . . . . . . . . . . . . . . . . . . . . . . . . 904.8.9 Particles incorporated into a CLC droplet . . . . . . . . . . . . . . . . 93
5 Conclusions 95
6 Acknowledgements 99

INDEX IX
7 Zahvala 101
8 References 103
Index of Figures 111
Index of Tables 113
Appendix A: Further observations 115Lasing and switching in ferroelectric LCs . . . . . . . . . . . . . . . . . . . . . 115Photonic molecules . . . . . . . . . . . . . . . . . . . . . . . . . . . . . . . . . 117Measuring spectral width of WGMs using a Fabriy-Perot interferometer . . . 117Pulse length of the 3D laser . . . . . . . . . . . . . . . . . . . . . . . . . . . . 118
Appendix B: Bibliography 121

X INDEX

XI
Abstract
This thesis investigates the use of single liquid-crystal droplets as optical microresonators andlasers. We have shown that liquid-crystal droplets can support a number of different opticalmodes that can be excited by introducing a fluorescent dye in the liquid crystal material andusing an external excitation source of light. These optical modes are in general different fromthe ones in isotropic materials, because of birefringence of the liquid crystals and specificconfigurations of the director field within the droplet. The droplets were prepared just bymechanical mixing of a liquid crystal material and another non-miscible fluid. The directorstructure in the droplets self assembles to minimize the elastic energy. To measure theoptical properties of the microresonators an optical setup was built that includes a pulsedlaser for excitation and a spectrophotometer for spectral analysis. Regarding the type ofliquid crystalline material used for the droplets and the type of optical modes supported inthe droplets, the thesis is basically divided into two parts.
In the first part, nematic liquid crystal is used to make the droplets. It has been shownthat the nematic droplets confine light by total internal reflection and therefore supportwhispering-gallery modes. At higher peak intensities of the pump laser, low threshold mul-timode lasing has been achieved. The optical modes were tuned by electric field, temperatureand mechanical deformation. In the case of applying electric field, the nematic director ori-entation changes locally, so that the circulating light sees a change in the refractive index.On the other hand, by changing the temperature only the order parameter is altered, whichresults in the change of both ordinary and extraordinary refractive indices. In the case ofmechanical deformation, only geometrical path length is changed with the applied strain,like it would happen also in an isotropic droplet. It has been shown that the response toelectric field and temperature is much larger than reported before in the literature for othermaterials. By applying just an electric field of few V/µm or changing the temperature byfew C, the modes shift by more than 10 nm in visible light. By using a nematic dropletfloating in water, also a chemical sensor was demonstrated. The surfactant molecules, whichconcentration we want to measure, adsorp to the surface of the liquid-crystal droplet andchange the anchoring and therefore also the director configuration in the droplet. This re-sults in a change of the optical properties of the droplet and therefore the frequencies of theoptical modes. The spectrum of light captured from such a droplet serves as an indicator ofthe presence of the surfactant in the surrounding water.
In the second part of the thesis, cholesteric liquid crystals with selective reflection invisible light were used to make the droplets. The cholesteric liquid crystal in the dropletself assembles so that the helical axis is pointing from the center in all the directions to thesurface of the droplet. The structure is acting as a spherical Bragg onion microcavity withperiodic modulation of the refractive index that confines the light into the center of thedroplet. By having a fluorescent dye in the LC and illuminating the droplet by an externalpulsed laser, the droplet starts to emit laser light in all the directions. In this way we havemade a 3D laser, a coherent isotropic point source of light. The spherical cholesteric laseris one of the first lasers emitting in all the directions and also one of the easiest lasers tomake in general. The laser is also highly tunable by changing the temperature.
XII
Povzetek
Doktorsko delo obravnava uporabo posameznih tekocekristalnih kapljic za opticne mikrore-sonatorje in laserje. Pokazali smo, da so v tekocekristalnih kapljicah mozni stevilni opticninihajni nacini, ki jih vzbudimo s pomocjo zunanjega vira svetlobe in fluorescentnega barvilarazporejenega v tekocem kristalu. Opticni nihajni nacini v kapljicah tekocega kristala sov splosnem drugacni od tistih v izotropnih snoveh. Razlog je dvolomnost tekocih kristalovin posebne ureditve tekocekrstalnega direktorja znotraj kapljice. Kapljice smo pripravili zenostavnim mehanskim mesanjem tekocega kristala in druge tekocine v kateri tekoci kristalni topen. Struktura direktorja se v posameznih kapljicah uredi tako, da minimizira elasticnoenergijo. Za namene proucevanja opticnih lastnosti kapljic, smo sestavili opticni sistem, kivkljucuje pulzni laser za vzbujanje kapljic in spektrofotometer za spektralno analizo. Gledena uporabljeno vrsto tekocega kristala in na tip opticnih nacinov v kapljicah, je doktorskadisertacija razdeljena na dva dela.
V prvem delu smo kot material za pripravo kapljic uporabili nematski tekoci kristal.Pokazali smo, da zaradi totalnega notranjega odboja, nematske kapljice zadrzujejo v svojinotranjosti svetlobo in zato v njih obstajajo tako imenovani whispering gallery nihajni na-cini. Pokazali smo tudi, da ob vzbujanju z visjo intenziteto, ze pri zelo nizkem pragu,kapljice pricnejo oddajati vecrodovno lasersko svetlobo. Opticne nihajne nacine lahko ugla-sujemo s pomocjo elektricnega polja, temperature ali mehanske deformacije. Ko na kapljicoprikljucimo elektricno napetost, v njeni notranjosti lokalno spremenimo smer nematskegadirektorja, kar vpliva na lomni kolicnik, ki ga vidi svetloba na poti po robu kapljice. Sspremembo temperature, pa se po drugi strani spremeni samo nematski red, kar vpliva naspremembo rednega in izrednega lomnega kolicnika. Pri mehanski deformaciji kapljice, pase spremeni geometrijska dolzina poti po kateri potuje svetloba, pri cemer je ucinek enak kotv izotropni kapljici. Pokazali smo, da je vpliv elektricnega polja in temperature precej vecjikot pri doslej v literaturi objavljenih rezultatih za drugacne materiale. Z elektricnem poljemle nekaj V/µm, ali spremembo temperature za samo nekaj C, se opticni nihanji nacini vvidni svetlobi premaknejo za vec kot deset nanometrov. Nematske kapljice dispergirane vvodi smo uporabili tudi kot kemicne senzorje. Molekule surfaktanta, ki ga hocemo zaznati,se adsorbirajo na povrsino kapljice in s tem spremenijo sidranje tekocega kristala ter po-sledicno smer nematskega direktorja v kapljici. To pomeni, da se spremenijo tudi opticnelastnosti kapljice in zato tudi opticni nihajni nacini vzbujeni v kapljici. Z meritvijo spektrasvetlobe, ki ga oddaja kapljica, lahko dolocimo prisotnost surfaktanta v vodi.
V drugem delu doktorske disertacije smo za pripravo kapljic uporabili holestericni tekocikristal, ki ima selektivno refleksijo v vidni svetlobi. Tekoci kristal se v kapljici samoureditako, da je vijacnica usmerjena iz centra v vse smeri proti povrsini kapljice. Tako tvoricebulasto Braggovo strukturo s periodicno modulacijo lomnega kolicnika, ki zadrzuje sve-tlobo v kapljici. Ce imamo v tekocem kristalu se fluorescentno barvilo in barvilo vzbujamoz zunanjim pulznim laserjem, kapljica pricne oddajati lasersko svetlobo v vse smeri v pro-storu. Tako smo naredili 3D laser, ki je koherentno isotropicno tockasto svetilo. Sfericniholestericni laser je en izmed prvih laserjev, ki oddaja svetlobo v vse smeri. Je tudi en izmedlaserjev, ki ga je v splosnem najlazje narediti. S spreminjanjem temperature lahko laser tudiuglasujemo v velikem obmocju.

XIII
Abbreviations
5CB = 4’-pentyl-4-biphenylcarbonitrilea.u. = arbitrary unitsAOD = acousto-optic deflectorsCLC = cholesteric liquid crystalCROW = coupled resonator optical waveguideCW = continuous waveDAC = digital-to-analog converterDCM = 4-(dicyanomethylene)-2-methyl-6-(4-dimethylaminostyryl)-4H-pyranFCPM = fluorescence confocal polarizing microscopyFSR = free spectral rangeFWHM = full-width at half-maximumIR = infraredLC = liquid crystalMDR = morphology-dependent resonanceMF = melamine formaldehydeND = no dataNd:YAG = neodymium-doped yttrium aluminium garnetNIR = near infraredNLC = nematic liquid crystalPBG = photonic bandgapPDLC = polymer dispersed liquid crystalPDMS = polydimethylsiloxanePVA = polyvinyl alcoholSDS = sodium dodecyl sulfateSPP-106 = rhodamine B tetradecyl ester chlorideUV = ultravioletWGM = whispering-gallery mode

XIV Abbreviations
1
1 Introduction
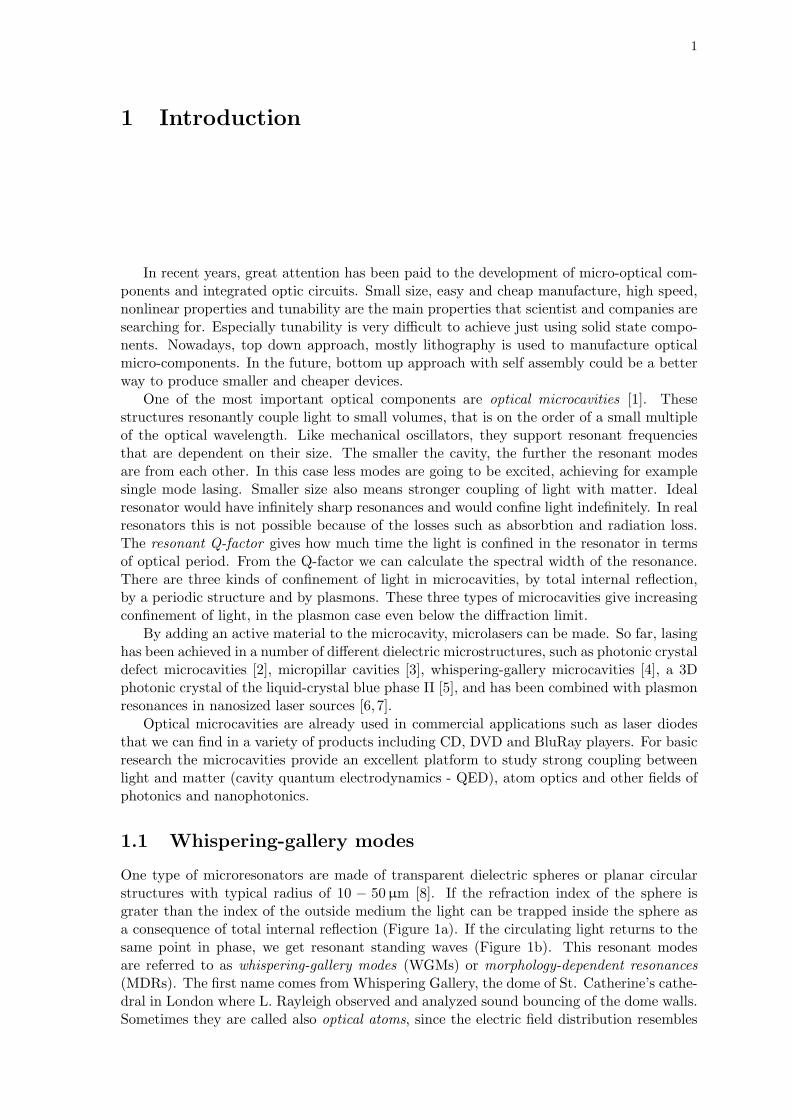
In recent years, great attention has been paid to the development of micro-optical com-ponents and integrated optic circuits. Small size, easy and cheap manufacture, high speed,nonlinear properties and tunability are the main properties that scientist and companies aresearching for. Especially tunability is very difficult to achieve just using solid state compo-nents. Nowadays, top down approach, mostly lithography is used to manufacture opticalmicro-components. In the future, bottom up approach with self assembly could be a betterway to produce smaller and cheaper devices.
One of the most important optical components are optical microcavities [1]. Thesestructures resonantly couple light to small volumes, that is on the order of a small multipleof the optical wavelength. Like mechanical oscillators, they support resonant frequenciesthat are dependent on their size. The smaller the cavity, the further the resonant modesare from each other. In this case less modes are going to be excited, achieving for examplesingle mode lasing. Smaller size also means stronger coupling of light with matter. Idealresonator would have infinitely sharp resonances and would confine light indefinitely. In realresonators this is not possible because of the losses such as absorbtion and radiation loss.The resonant Q-factor gives how much time the light is confined in the resonator in termsof optical period. From the Q-factor we can calculate the spectral width of the resonance.There are three kinds of confinement of light in microcavities, by total internal reflection,by a periodic structure and by plasmons. These three types of microcavities give increasingconfinement of light, in the plasmon case even below the diffraction limit.
By adding an active material to the microcavity, microlasers can be made. So far, lasinghas been achieved in a number of different dielectric microstructures, such as photonic crystaldefect microcavities [2], micropillar cavities [3], whispering-gallery microcavities [4], a 3Dphotonic crystal of the liquid-crystal blue phase II [5], and has been combined with plasmonresonances in nanosized laser sources [6, 7].
Optical microcavities are already used in commercial applications such as laser diodesthat we can find in a variety of products including CD, DVD and BluRay players. For basicresearch the microcavities provide an excellent platform to study strong coupling betweenlight and matter (cavity quantum electrodynamics - QED), atom optics and other fields ofphotonics and nanophotonics.
1.1 Whispering-gallery modes
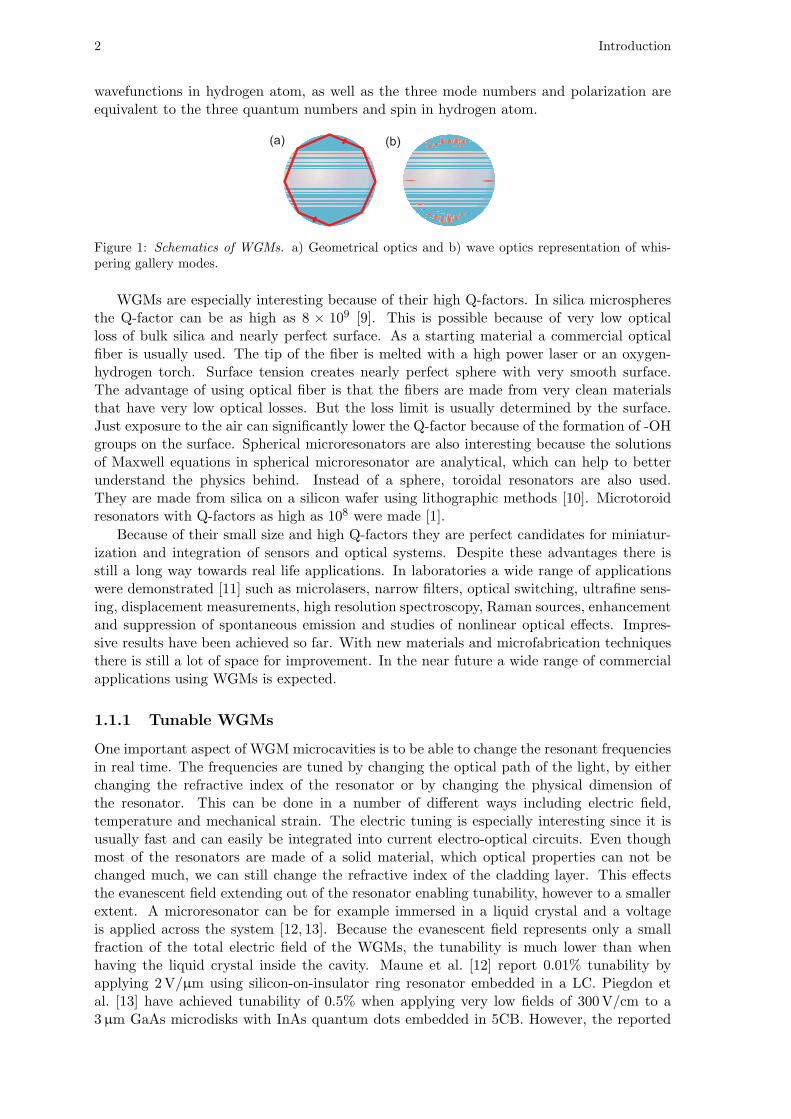
One type of microresonators are made of transparent dielectric spheres or planar circularstructures with typical radius of 10 − 50µm [8]. If the refraction index of the sphere isgrater than the index of the outside medium the light can be trapped inside the sphere asa consequence of total internal reflection (Figure 1a). If the circulating light returns to thesame point in phase, we get resonant standing waves (Figure 1b). This resonant modesare referred to as whispering-gallery modes (WGMs) or morphology-dependent resonances(MDRs). The first name comes from Whispering Gallery, the dome of St. Catherine’s cathe-dral in London where L. Rayleigh observed and analyzed sound bouncing of the dome walls.Sometimes they are called also optical atoms, since the electric field distribution resembles
2 Introduction
wavefunctions in hydrogen atom, as well as the three mode numbers and polarization areequivalent to the three quantum numbers and spin in hydrogen atom.
Figure 1: Schematics of WGMs. a) Geometrical optics and b) wave optics representation of whis-pering gallery modes.
WGMs are especially interesting because of their high Q-factors. In silica microspheresthe Q-factor can be as high as 8 × 10⁹ [9]. This is possible because of very low opticalloss of bulk silica and nearly perfect surface. As a starting material a commercial opticalfiber is usually used. The tip of the fiber is melted with a high power laser or an oxygen-hydrogen torch. Surface tension creates nearly perfect sphere with very smooth surface.The advantage of using optical fiber is that the fibers are made from very clean materialsthat have very low optical losses. But the loss limit is usually determined by the surface.Just exposure to the air can significantly lower the Q-factor because of the formation of -OHgroups on the surface. Spherical microresonators are also interesting because the solutionsof Maxwell equations in spherical microresonator are analytical, which can help to betterunderstand the physics behind. Instead of a sphere, toroidal resonators are also used.They are made from silica on a silicon wafer using lithographic methods [10]. Microtoroidresonators with Q-factors as high as 108 were made [1].
Because of their small size and high Q-factors they are perfect candidates for miniatur-ization and integration of sensors and optical systems. Despite these advantages there isstill a long way towards real life applications. In laboratories a wide range of applicationswere demonstrated [11] such as microlasers, narrow filters, optical switching, ultrafine sens-ing, displacement measurements, high resolution spectroscopy, Raman sources, enhancementand suppression of spontaneous emission and studies of nonlinear optical effects. Impres-sive results have been achieved so far. With new materials and microfabrication techniquesthere is still a lot of space for improvement. In the near future a wide range of commercialapplications using WGMs is expected.
1.1.1 Tunable WGMs
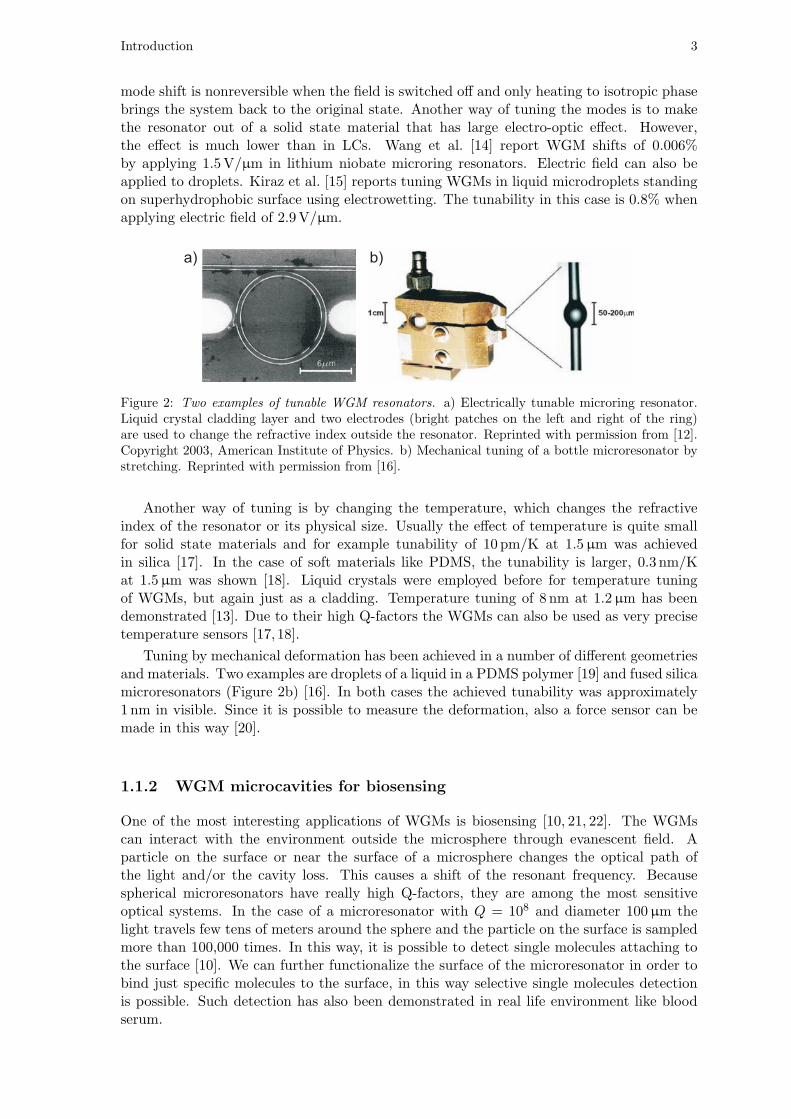
One important aspect of WGM microcavities is to be able to change the resonant frequenciesin real time. The frequencies are tuned by changing the optical path of the light, by eitherchanging the refractive index of the resonator or by changing the physical dimension ofthe resonator. This can be done in a number of different ways including electric field,temperature and mechanical strain. The electric tuning is especially interesting since it isusually fast and can easily be integrated into current electro-optical circuits. Even thoughmost of the resonators are made of a solid material, which optical properties can not bechanged much, we can still change the refractive index of the cladding layer. This effectsthe evanescent field extending out of the resonator enabling tunability, however to a smallerextent. A microresonator can be for example immersed in a liquid crystal and a voltageis applied across the system [12, 13]. Because the evanescent field represents only a smallfraction of the total electric field of the WGMs, the tunability is much lower than whenhaving the liquid crystal inside the cavity. Maune et al. [12] report 0.01% tunability byapplying 2V/µm using silicon-on-insulator ring resonator embedded in a LC. Piegdon etal. [13] have achieved tunability of 0.5% when applying very low fields of 300V/cm to a3µm GaAs microdisks with InAs quantum dots embedded in 5CB. However, the reported
Introduction 3
mode shift is nonreversible when the field is switched off and only heating to isotropic phasebrings the system back to the original state. Another way of tuning the modes is to makethe resonator out of a solid state material that has large electro-optic effect. However,the effect is much lower than in LCs. Wang et al. [14] report WGM shifts of 0.006%by applying 1.5V/µm in lithium niobate microring resonators. Electric field can also beapplied to droplets. Kiraz et al. [15] reports tuning WGMs in liquid microdroplets standingon superhydrophobic surface using electrowetting. The tunability in this case is 0.8% whenapplying electric field of 2.9V/µm.
Figure 2: Two examples of tunable WGM resonators. a) Electrically tunable microring resonator.Liquid crystal cladding layer and two electrodes (bright patches on the left and right of the ring)are used to change the refractive index outside the resonator. Reprinted with permission from [12].Copyright 2003, American Institute of Physics. b) Mechanical tuning of a bottle microresonator bystretching. Reprinted with permission from [16].
Another way of tuning is by changing the temperature, which changes the refractiveindex of the resonator or its physical size. Usually the effect of temperature is quite smallfor solid state materials and for example tunability of 10 pm/K at 1.5µm was achievedin silica [17]. In the case of soft materials like PDMS, the tunability is larger, 0.3 nm/Kat 1.5µm was shown [18]. Liquid crystals were employed before for temperature tuningof WGMs, but again just as a cladding. Temperature tuning of 8 nm at 1.2µm has beendemonstrated [13]. Due to their high Q-factors the WGMs can also be used as very precisetemperature sensors [17,18].
Tuning by mechanical deformation has been achieved in a number of different geometriesand materials. Two examples are droplets of a liquid in a PDMS polymer [19] and fused silicamicroresonators (Figure 2b) [16]. In both cases the achieved tunability was approximately1 nm in visible. Since it is possible to measure the deformation, also a force sensor can bemade in this way [20].
1.1.2 WGM microcavities for biosensing
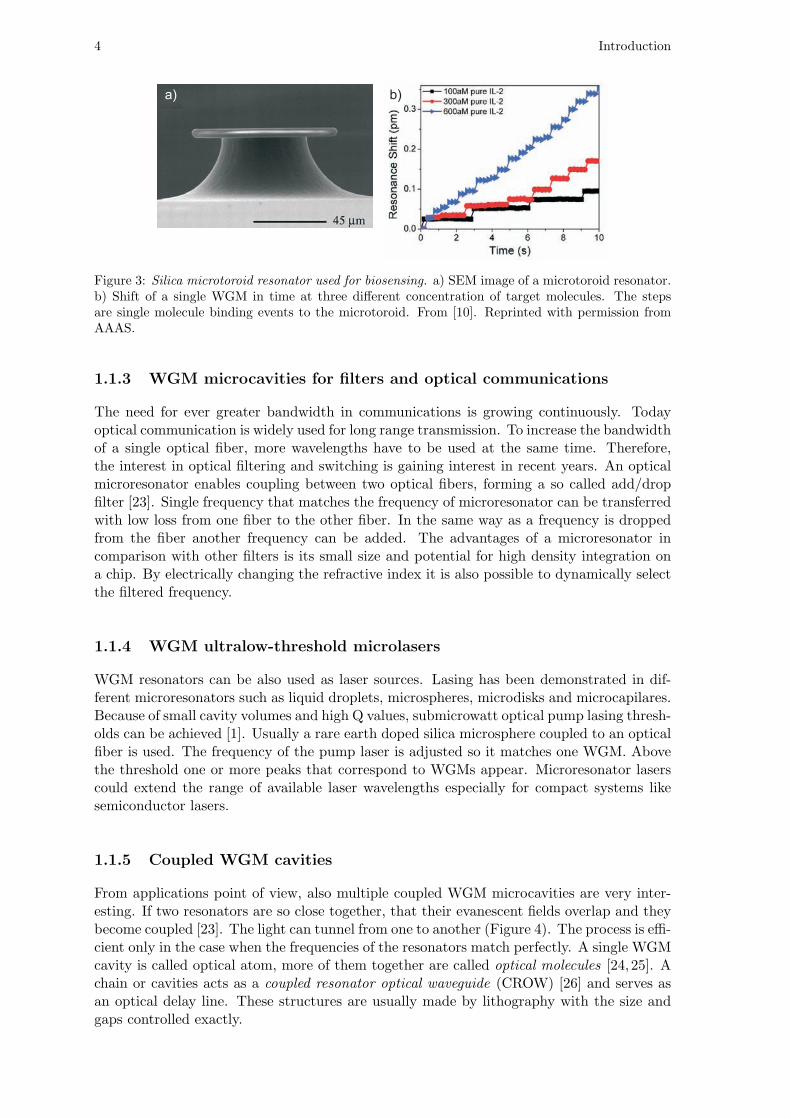
One of the most interesting applications of WGMs is biosensing [10, 21, 22]. The WGMscan interact with the environment outside the microsphere through evanescent field. Aparticle on the surface or near the surface of a microsphere changes the optical path ofthe light and/or the cavity loss. This causes a shift of the resonant frequency. Becausespherical microresonators have really high Q-factors, they are among the most sensitiveoptical systems. In the case of a microresonator with Q = 108 and diameter 100µm thelight travels few tens of meters around the sphere and the particle on the surface is sampledmore than 100,000 times. In this way, it is possible to detect single molecules attaching tothe surface [10]. We can further functionalize the surface of the microresonator in order tobind just specific molecules to the surface, in this way selective single molecules detectionis possible. Such detection has also been demonstrated in real life environment like bloodserum.
4 Introduction
Figure 3: Silica microtoroid resonator used for biosensing. a) SEM image of a microtoroid resonator.b) Shift of a single WGM in time at three different concentration of target molecules. The stepsare single molecule binding events to the microtoroid. From [10]. Reprinted with permission fromAAAS.
1.1.3 WGM microcavities for filters and optical communications
The need for ever greater bandwidth in communications is growing continuously. Todayoptical communication is widely used for long range transmission. To increase the bandwidthof a single optical fiber, more wavelengths have to be used at the same time. Therefore,the interest in optical filtering and switching is gaining interest in recent years. An opticalmicroresonator enables coupling between two optical fibers, forming a so called add/dropfilter [23]. Single frequency that matches the frequency of microresonator can be transferredwith low loss from one fiber to the other fiber. In the same way as a frequency is droppedfrom the fiber another frequency can be added. The advantages of a microresonator incomparison with other filters is its small size and potential for high density integration ona chip. By electrically changing the refractive index it is also possible to dynamically selectthe filtered frequency.
1.1.4 WGM ultralow-threshold microlasers
WGM resonators can be also used as laser sources. Lasing has been demonstrated in dif-ferent microresonators such as liquid droplets, microspheres, microdisks and microcapilares.Because of small cavity volumes and high Q values, submicrowatt optical pump lasing thresh-olds can be achieved [1]. Usually a rare earth doped silica microsphere coupled to an opticalfiber is used. The frequency of the pump laser is adjusted so it matches one WGM. Abovethe threshold one or more peaks that correspond to WGMs appear. Microresonator laserscould extend the range of available laser wavelengths especially for compact systems likesemiconductor lasers.
1.1.5 Coupled WGM cavities
From applications point of view, also multiple coupled WGM microcavities are very inter-esting. If two resonators are so close together, that their evanescent fields overlap and theybecome coupled [23]. The light can tunnel from one to another (Figure 4). The process is effi-cient only in the case when the frequencies of the resonators match perfectly. A single WGMcavity is called optical atom, more of them together are called optical molecules [24, 25]. Achain or cavities acts as a coupled resonator optical waveguide (CROW) [26] and serves asan optical delay line. These structures are usually made by lithography with the size andgaps controlled exactly.

Introduction 5
Figure 4: CROW simulation. Electric field intensity distribution in a chain of five touching micro-spheres. Reprinted with permission from [27].
1.2 Circular and spherical Bragg microcavities
Apart from light confinement by reflection and total internal reflection such as in WGMs,confinement by photonic structures is even more efficient. Dielectric photonic structures havea periodic modulation of the refractive index with the period comparable to the wavelengthof the light. The periodic structure can be one-, two- or three-dimensional. On each periodof the structure a part of incident light is reflected and than constructively or destructivelyinterferes. Therefore, the light can be reflected from the structure, this effect is calledBragg reflection. Bragg reflection is more known in the case scattering of X-rays from acrystal lattice, which is exactly the same phenomenon, just at shorter wavelengths. Forthe wavelength range that is reflected from the structure, we say that photonic bandgap(PBG) exists. The frequencies in this range are forbidden inside the periodic material. ThePBG usually changes for different directions. Structures having the PBG are referred toas photonic crystals. If the propagation of the same frequency range is forbidden in all thedirections in space and for all the polarizations, we have full photonic bandgap. Typicallythe structures based on photonic crystals can confine light in a volume much smaller thanfor example in the case of WGMs, however at the cost of lower Q-factors, that are up toapproximately 105 compared to 1010 for WGMs [1].
One type of PBG structures are the circular Bragg microcavities [28–30] and sphericalBragg microcavities [31–34] made of concentric rings (planar structure, Figure 5a) or con-centric shells (”onion” structure), respectively. Such structures are basically one dimensionalphotonic crystals, but wrapped around the central point. Light going out from this centralpoint is reflected back by the periodic structure and is confined in the center. SphericalBragg-reflector microcavities, are particularly interesting because of their perfect rotationalsymmetry in 3D. The PBG is independent of the direction of light propagation and the lightis strongly confined in all directions.
In non-layered spheres there are a large number of modes present, which can be tailoredto our needs only in a very limited way. But for a Bragg microcavity the layered structurescan be modified so that only a limited number of modes are possible. In contrast with other3D photonic crystals such as opals, the refractive index contrast between the layers can bearbitrarily small in order to generate full PBG. Therefore spherical Bragg microcavities areuseful in a number of ways. By placing an emitter in the center of the cavity, suppressionof the spontaneous emission and modification of the fluorescent decay rate can be achieved.High intensity of the light trapped in the center enables nonlinear processes such as secondharmonic generation and in strong coupling of light with matter. Furthermore, such cavitiescan be used for light sources such as microcavity lasers and electroluminescent devices.
A number of Bragg-onion resonator structures have been realized in 2D using standardplanar lithography (Figure 5a) and lasing has been demonstrated in these structures (Figure5b) [28–30]. The natural step now would be to go into three dimensions. However, unfortu-nately, it is quite difficult to manufacture any 3D solid-state microcavity [35]. There havebeen several attempts to produce 3D Bragg-onion resonators by chemical synthesis [36] orby combining etching and chemical vapor deposition [34], but to our knowledge, lasing hasnot been achieved in these solid-state structures.

6 Introduction
Figure 5: 2D Bragg microcavity laser. a) SEM image of a laser made by lithography. b) Simulationof electric field distribution in such a laser for the mode with the lowest angular modal number, thathas the maximum in the center of the microcavity. Reprinted with permission from [37].
1.3 Liquid crystals
Liquid crystals (LCs) are anisotropic fluids whose molecules have orientational and some-times positional order [38]. The alligment direction is dictated by the external field orconfining surfaces. Nematic liquid crystals (NLCs) are the simplest case of liquid crystalsand are composed of rod-like molecules that are oriented in a particular direction and do nothave positional order. If the molecules of a NLC are chiral or another chiral molecule, calledchiral dopant, is added to the NLC, a helical twist is introduced. Such LCs are refereed toas cholesteric liquid crystals (CLCs).
When an external AC electric field is applied to a NLC sandwiched between confiningsurfaces, molecules tend to align with their long axes into the field direction to minimize theelastic and electric energy. This causes collective reorientations of NLC molecules, and theliquid crystal is elastically distorted. As the NLC molecules are usually strongly anchoredat the confining surfaces of the device, the elastic deformation provides restoring torques,which drive the NLC into original configuration, once the field is switched-off. Due to theirhigh birefringence (typically 0.1 − 0.2) and large optical response to the external electricfield, nematic liquid crystals are now widely used in LCDs, 2D spatial light modulators,optical filters, tunable waveplates and optical switches. Electrically tunable optical devicessuch as cholesteric liquid crystal lasers [5,39–43], beam steering devices, tunable 2D photonicnematic colloidal crystals [44] and solid state optical microresonators with a NLC claddinglayer [12] have been demonstrated.
1.3.1 Polymer dispersed liquid crystals
In practical applications, the LCs are confined by some external surface that aligns themolecules in a particular direction. The confinement is in most cases in a form of a thinlayer of LC, several micrometers thick. The confining glass plates used as substrates arecoated with different materials and mechanically treated to induce the correct anchoring.Another type of confinement is to encapsulate the LC droplets into a carrying material. LCdroplets in a polymer matrix are known as polymer dispersed liquid crystals (PDLCs) [45,46].The size of the droplets is usually in the order of a micron, so that the scattering of lightis as efficient as possible. The fraction of the LC in PDLCs can be as high as 50% to90%. PDLCs are useful for switchable windows and displays, however they are actually notreally much used in commercial applications, even though, they have the advantage that noalignment layers and no polarizers are necessary. PDLC switchable windows and displays arebased on the fact, that with no electric field, the LC molecules in the droplets are randomlyoriented and they scatter light, making the film opaque. But when the electric field isapplied, the LC orients along the field, so that the refractive index for the light traveling
Introduction 7
perpendicular to the film matches the refractive index of the polymer matrix, making the filmtransparent. PDLCs are also interesting from basic research point of view, since they poseslarge surface-volume ratio, so that the surface effects and strong confinement can be studiedinto detail. By using different liquid crystals, different droplets size and different anchoringconditions, a huge variety of director configuration in the droplets can be achieved. Also thelight propagation in such nonuniform and birefringent materials is very complex and canintroduce a number of interesting optical phenomena including random lasing [47,48].
1.3.2 Lasing in cholesteric liquid crystals
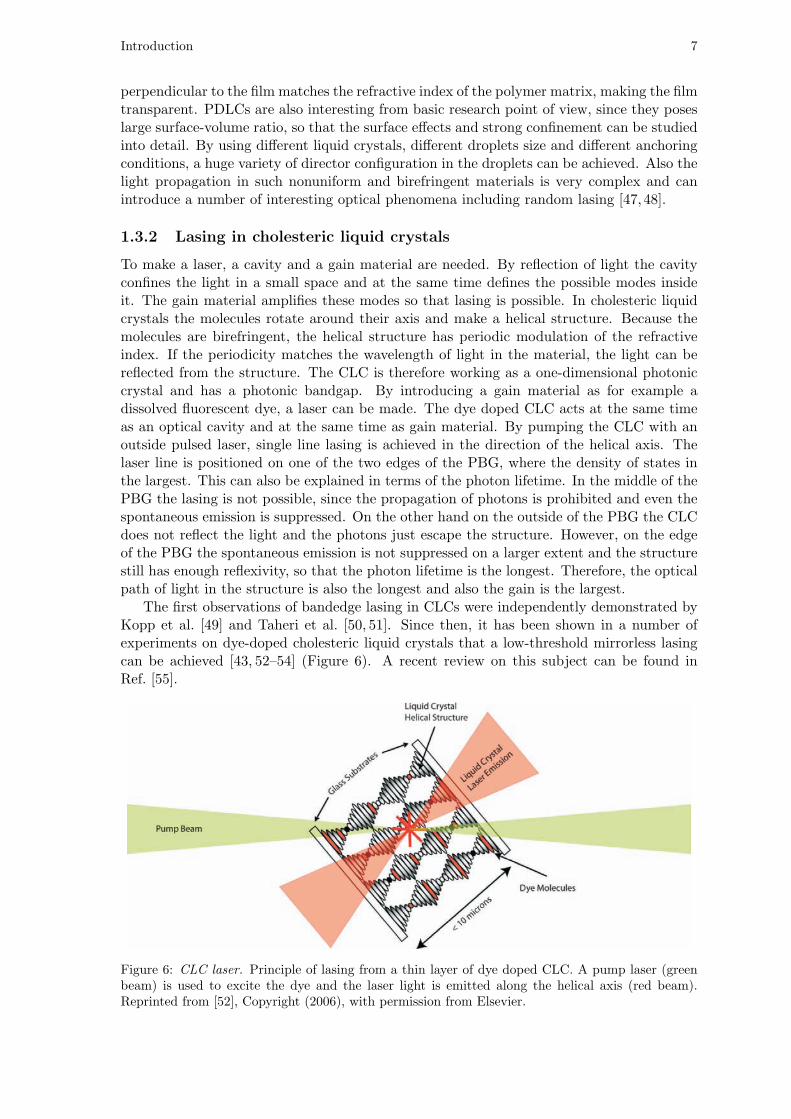
To make a laser, a cavity and a gain material are needed. By reflection of light the cavityconfines the light in a small space and at the same time defines the possible modes insideit. The gain material amplifies these modes so that lasing is possible. In cholesteric liquidcrystals the molecules rotate around their axis and make a helical structure. Because themolecules are birefringent, the helical structure has periodic modulation of the refractiveindex. If the periodicity matches the wavelength of light in the material, the light can bereflected from the structure. The CLC is therefore working as a one-dimensional photoniccrystal and has a photonic bandgap. By introducing a gain material as for example adissolved fluorescent dye, a laser can be made. The dye doped CLC acts at the same timeas an optical cavity and at the same time as gain material. By pumping the CLC with anoutside pulsed laser, single line lasing is achieved in the direction of the helical axis. Thelaser line is positioned on one of the two edges of the PBG, where the density of states inthe largest. This can also be explained in terms of the photon lifetime. In the middle of thePBG the lasing is not possible, since the propagation of photons is prohibited and even thespontaneous emission is suppressed. On the other hand on the outside of the PBG the CLCdoes not reflect the light and the photons just escape the structure. However, on the edgeof the PBG the spontaneous emission is not suppressed on a larger extent and the structurestill has enough reflexivity, so that the photon lifetime is the longest. Therefore, the opticalpath of light in the structure is also the longest and also the gain is the largest.
The first observations of bandedge lasing in CLCs were independently demonstrated byKopp et al. [49] and Taheri et al. [50, 51]. Since then, it has been shown in a number ofexperiments on dye-doped cholesteric liquid crystals that a low-threshold mirrorless lasingcan be achieved [43, 52–54] (Figure 6). A recent review on this subject can be found inRef. [55].
Figure 6: CLC laser. Principle of lasing from a thin layer of dye doped CLC. A pump laser (greenbeam) is used to excite the dye and the laser light is emitted along the helical axis (red beam).Reprinted from [52], Copyright (2006), with permission from Elsevier.
8 Introduction
1.3.3 Liquid crystal biosensors
Surface science appears in a huge range of areas including basics science and large scaleindustrial production. In dispersions of small particles the surface has a large effect on theirproperties or the properties of the material containing them. Liquid crystals are especiallyinteresting in this regard, since the effect of the surface extends deep into the bulk phase.The director orientation is therefore sensitive to the interface properties [56] such as theshape of the surface and its chemical composition. In most liquid crystal applications,such as LCDs, the surface is treated so that the correct anchoring of the liquid crystalis achieved. Planar anchoring is made by rubbing the surface, whereas the homeotropicanchoring is achieved by the deposition of a surfactant to the substrate. Similarly themolecules can be absorbed to the interface between a LC and water, changing the alignmentof the LC. Since the anchoring angle is very sensitive to the surfactant concentration, thissystem can be used as a sensor. The anchoring also affects the bulk liquid crystal, thechange being amplified through the long range orientational order of the liquid crystal,so the changes can be easily observed under a polarizing microscope. Therefore, the LCinterfaces can be used as sensors to detect a variety of chemicals including phospholipidsat LC-water interface [57, 58], protein binding [59], viruses [60, 61], bacteria [61] and pHmeasurements [62]. However, current methods of observing these changes are still based onbare-eye observation and small changes in the anchoring can not be detected in this way.
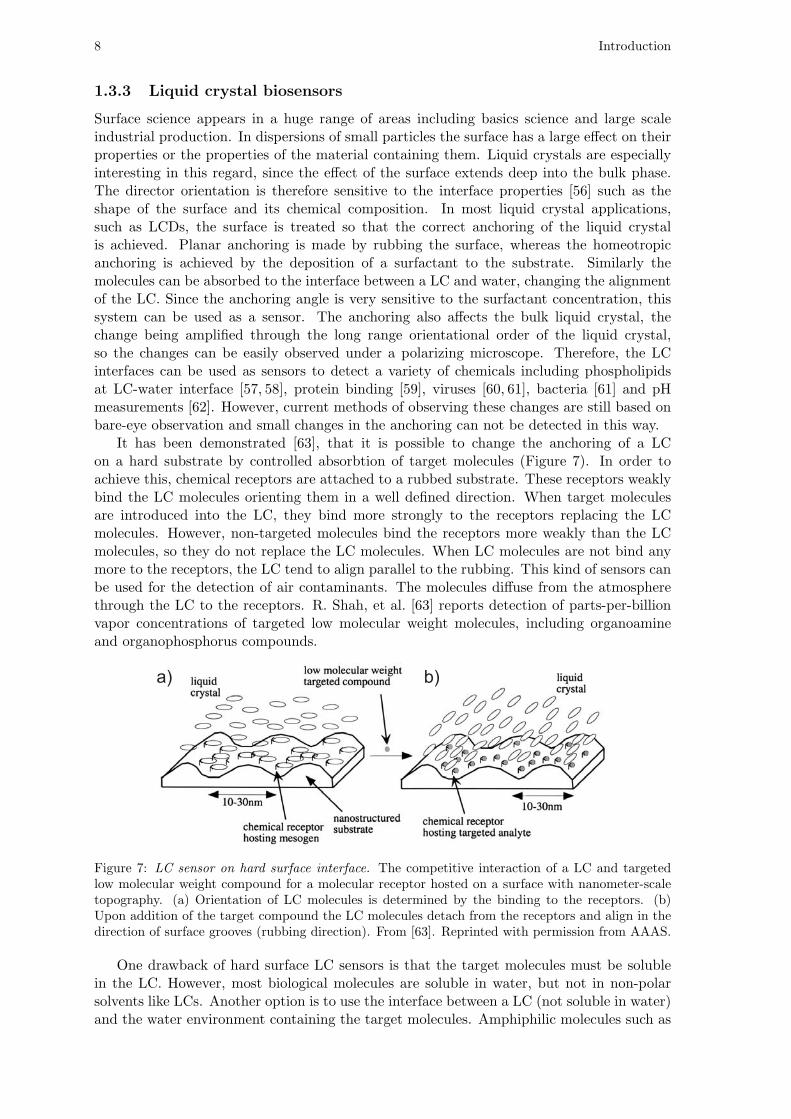
It has been demonstrated [63], that it is possible to change the anchoring of a LCon a hard substrate by controlled absorbtion of target molecules (Figure 7). In order toachieve this, chemical receptors are attached to a rubbed substrate. These receptors weaklybind the LC molecules orienting them in a well defined direction. When target moleculesare introduced into the LC, they bind more strongly to the receptors replacing the LCmolecules. However, non-targeted molecules bind the receptors more weakly than the LCmolecules, so they do not replace the LC molecules. When LC molecules are not bind anymore to the receptors, the LC tend to align parallel to the rubbing. This kind of sensors canbe used for the detection of air contaminants. The molecules diffuse from the atmospherethrough the LC to the receptors. R. Shah, et al. [63] reports detection of parts-per-billionvapor concentrations of targeted low molecular weight molecules, including organoamineand organophosphorus compounds.
Figure 7: LC sensor on hard surface interface. The competitive interaction of a LC and targetedlow molecular weight compound for a molecular receptor hosted on a surface with nanometer-scaletopography. (a) Orientation of LC molecules is determined by the binding to the receptors. (b)Upon addition of the target compound the LC molecules detach from the receptors and align in thedirection of surface grooves (rubbing direction). From [63]. Reprinted with permission from AAAS.
One drawback of hard surface LC sensors is that the target molecules must be solublein the LC. However, most biological molecules are soluble in water, but not in non-polarsolvents like LCs. Another option is to use the interface between a LC (not soluble in water)and the water environment containing the target molecules. Amphiphilic molecules such as

Introduction 9
phospholipids can bind to the interface, changing the anchoring (Figure 8). A typical setupconsists of a thin metallic grid that is originally used for transmission electron microscopy.The square 100µm × 100µm openings in the grid are filled with a several micrometersthick LC layer, that is on one side in contact with a hard surface and on the other side incontact with water. The orientational changes are typically observed using a microscope andcrossed polarizers. The reported sensitivities of such sensors are of the order of 10µg/mlconcentration in water, which corresponds to approximately one monolayer coverage of theLC interface with targeted molecules.
Figure 8: LC sensor on fluid interface. a) Experimental geometry used to create stable interfacesbetween aqueous phases and LCs. b) and c) optical images in crossed polarizers of 5CB confinedto a copper grid immersed in b) pure water or c) an aqueous solution of 2.2 mM SDS. (d) and (e)schematic illustrations of the director profiles of the LC corresponding to d) planar anchoring of theliquid crystal at the interface with the aqueous phase and e) homeotropic anchoring with the SDSadded. Reprinted from [64], Copyright (2005), with permission from Elsevier.
However, by this sensing method we do not have selective detection, as all the amphiphilicmolecules are going to be absorbed to the interface. Alternatively, a monolayer of surfactantmolecules can be made on the surface. If these molecules have specific binding sites, onlytarget molecules will attach to them, changing their order or concentration. It has been alsoshown that is possible to measure the pH of the solution by carefully choosing the moleculesabsorbed on LC-water interface [62].
Instead of a flat layer of LC, also LC droplets dispersed in water can be used as sensors[61, 65, 66]. The director configuration in nematic droplets is dependent on the surfaceanchoring and it can be easily identified using a microscope. The advantage of such systemis, that the droplets do not need any mechanical support or surface treatment, they aresmall and can be introduced into a microfluidic chip. Furthermore, it has been recentlydemonstrated that the sensitivity of droplets to specific molecules can be at least a factor ofa million better compared to that of a flat sensing interface [67]. For endotoxins the sensinglimit is as low as 1 pg/ml, which corresponds to about 30 molecules per droplet. Such hugeamplification of sensitivity is attributed to the local binding of the surfactant molecules tothe two surface boojum defects. This kind of sensor is also very specific, since only veryspecific surfactants such as endotoxins with six carbon chains are able to induce the changesin director configuration of the droplets.
10 Introduction
1.4 Goal of the thesis
The purpose of this PhD work was to explore the possibility to use liquid crystal micro-droplets as optical microcavities that could be employed as novel micro light sources andother active optical elements in the microscale. The possible applications of such opticalcomponents extend from integrated optical circuits to imaging, holography and sensing. Thework was stimulated by the lack of research in the area of soft photonics and the lack ofsuch optical components.
We anticipated that liquid crystals could be used in the field of microresonators becauseof two main characteristics. Firstly, because of their long distance interaction and molec-ular order, liquid crystals offer high degree of self assembly and therefore possibly a routeto easy, cheap and scalable manufacture of optical components. Secondly, they have largeresponse to external stimuli, like electric and magnetic field, temperature, surface charac-teristics and light. These influences can change their optical properties and in this wayoffer large tunability of optical components. PDLCs have been studied extensively in thepast, but individual droplets have never been considered as tunable optical microcavities.Most research in optical microcavities was conducted on solid state optic components or inisotropic liquids.
Primary goal was to demonstrate that liquid-crystal droplets (nematic, cholesteric, fer-roelectric, smectic or blue phase) can support a number of different optical modes. Bychoosing different LC materials and different anchoring conditions we can achieve variousLC configurations in the droplet, which will confine light in different ways. The simplestway how to achieve this, is to use the droplet as whispering-gallery-mode microcavity. Whatis needed is just a nice spherical shape of the droplet and the refractive index inside to belarger than on the outside. For non-miscible, soft-matter materials, a spherical shape ap-pears naturally because of the surface tension, which tends to reduce the amount of surfacefor a given volume of material. Different LCs could be used, but the simplest case is thenematic liquid crystal. For anchoring on the droplet interface with the outside material wecan choose either planar for bipolar director configuration or homeotropic for radial directorconfiguration. We can again choose the simpler case, so the radial configuration, since ithas spherical symmetry.
Once demonstrating the presence of optical modes in LC droplets, the goal was to tunethe positions of the resonance frequencies. This could be achieved by external stimuli likeelectric or magnetic field, temperature, optical field, mechanical deformation, change insurface anchoring and chemical composition. Because of large response of LCs to externalstimuli, the tunability of such LC microcavities was expected to be orders of magnitudelarger than of solid state materials. However, such large response could also have drawbacksin the sense of resonant frequency and amplitude stability. Instead of tuning the modesby external stimuli, the LC microcavities could also be used as sensors. One of the mostinteresting applications would be a biosensor, where varying the concentration of a specificcompound present in the exterior of the droplet could change the anchoring or directly theinternal properties of the LC, such as the pitch. We expected that very sensitive chemicalsensors could be realized using liquid-crystal droplets immersed in water containing thetarget substance.
By having a microcavity and fluorescent dye in the LC microcavity we expected lasing tooccur above the lasing threshold when pumping the fluorescent dye with an external sourceof light. By carefully choosing the configuration of the LC director in the droplet as wellas the gain medium, singlemode as well as different multimode lasing is expected to occur.The lasing lines should tune in a very similar way as the modes bellow the lasing threshold.
Further, we wanted to use CLCs to confine light into a droplet. CLCs are known toproduce selective Bragg reflection of light on the periodic structure. By making a dropletout of a CLC, the onion Bragg structure was expected to produce omnidirectional PBG
Introduction 11
and confine the light in the center of the droplet. By introducing a gain material and usingexternal pumping, lasing should be achieved in the same way as in planar CLC structure.Because of nearly spherical symmetric structure, this laser is supposed to emit light in allthe directions, making it an omnidirectional coherent point source of light.
To achieve all the above goals, the intention was to use commercially available substancesand as simple procedures as possible. In this way, repeatability of the experiments aswell as scalability and price of possible future applications could be achieved. To test themicrocavities, an upgrade of an existing optical system was planed, by adding a pulsed laserfor excitation and a high resolution spectrophotometer with a sensitive EMCCD for thedetection of light.
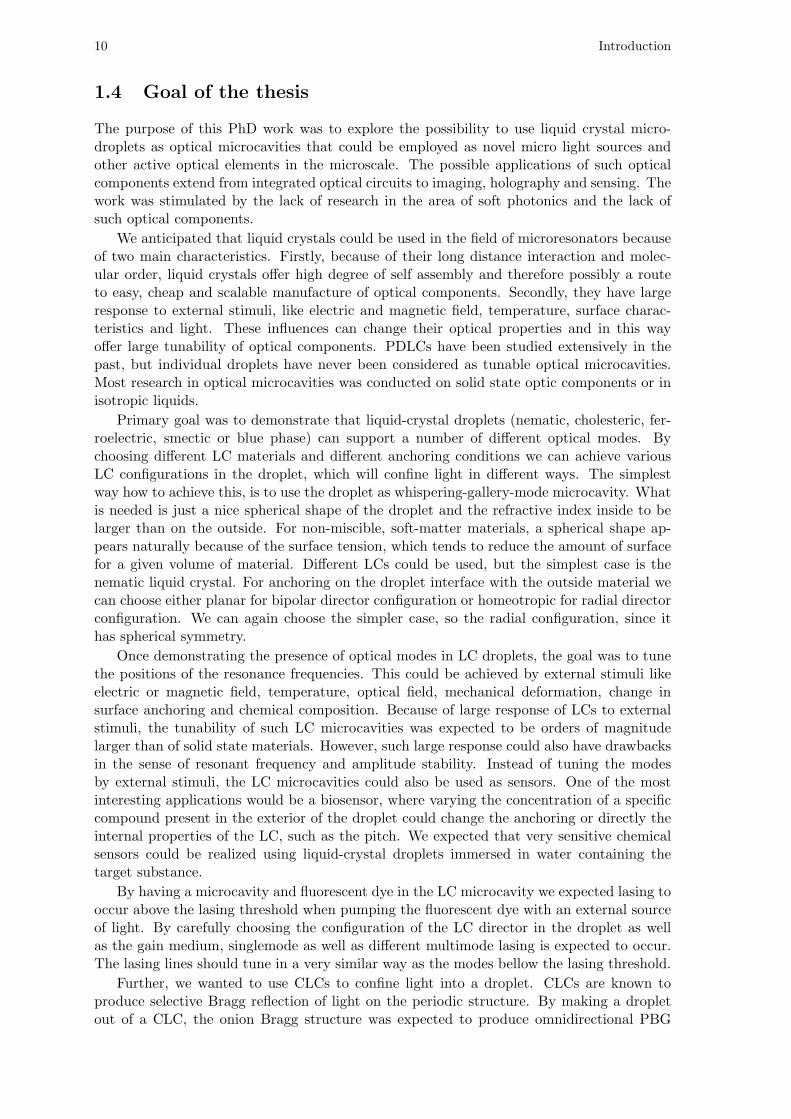
In reality, in the beginning of this research work, the idea was not to use liquid-crystaldroplets as microcavities, but to study the inverted system. So to use hard isotropic spheresembedded in a LC as optical microresonators. It has been shown in a number of exper-iments that particles in nematic liquid crystal can be assembled in a very rich varietyof structures such as chains [68], two-dimensional colloidal crystals [69], entangled struc-tures [70], hierarchical self-assembled nematic colloidal superstructures [71], knots [72] andeven three-dimensional colloidal crystals [73]. All this structures could be used for a numberof photonic applications such as photonic crystals, split ring resonators for metamaterialsand optical microcavities. The original idea of this work was to use spherical particles inLC as WGM microresonators. The LC around the microresonators would serve for threedifferent purposes. Firstly, the outside LC can act as a tunable cladding layer and make themicrocavities tunable [12,13]. Secondly, the forces in between the particles in LC bind themtogether enabling self assembly. For example a chain of resonators assembled in this waywould work as coupled resonator optical waveguide transferring light from one resonatorto the other. Thirdly, by changing the optical properties of the layer of LC in betweenneighboring microresonators by electric field or laser beam (Figure 9) one could control thecoupling between them and make an optical switch.
Figure 9: Proposed CROW structure made from nematic colloids. A chain of hard microspheres isembedded in a LC that are bound together by elastic forces. Each microsphere supports WGMs thatare coupled with neighbouring resonators so that the chain acts as a CROW. A laser beam is used tochange the optical properties of the LC between two microresonators achieving all-optical switching.

12 Introduction

13
2 Theoretical background
2.1 Optical microcavities
In this section we will give description of general properties for microcavities, no matter ifthe microcavity confines light by reflection, total internal reflection or by periodic structure.The most important property of a cavity is the number and frequencies of resonant modes1. Usually, the smaller the cavity, less modes will be present. The spacing between twoneighboring modes is given by free spectral range (FSR). Large FSR is in most cases desirable,since if we have a very large cavity, a huge number of modes will be present and singlemodes could not be distinguished any more. Another parameter of a microcavity is theMode volume. This is the volume that the electric field of a particular mode occupies in themicrocavity. In WGMs the mode volume is typically from several tens to several thousandcubic microns. Smaller the mode volume, higher is the energy density in the cavity, enablingvarious nonlinear processes and strong light-matter coupling.
2.1.1 Quality factor
The quality factor (Q-factor) is a measure of the resonance sharpness relative to its wave-length. Q-factor is defined as the ratio of the energy of light in the resonator to the energylost per optical cycle
Q = ωStored energy
Power loss(1)
where ω is the optical frequency given by ω = 2πc/λ. The Q-factor can also be expressedas
Q = ωτ, (2)
where τ is the decay time or photon lifetime. It can also be easily calculated from the modespectrum as
Q =λ
∆λ, (3)
where λ is the central wavelength of the resonance and ∆λ is the full-width at half-maximum(FWHM) of the resonance lineshape.
The overall Q-factor of a WGM microcavity is a sum of many contributions
1
Q=
1
Qrad+
1
Qmat+
1
Qss+
1
Qcoupling+
1
QLC. (4)
Radiation loss Qrad is because of curvature of the microcavity. For modes with radialmode number equal to one and cavity diameters larger than approximately 15µm, theQrad is usually very large and can be neglected in the sum. Material loss Qmat is causedby absorbtion and scattering in the dielectric medium from which the resonator is made.Surface scattering Qss is caused by surface roughness. If the resonator is coupled to anexternal optical device by evanescent field, the reduction of the Q-factor because of coupling
1For WGMs, the detailed calculation will be given in next section.
14 Theoretical background
(Qcoupling), should also be taken into account. And finally, if the resonator is made of liquidcrystal, an important factor is contributed to the thermal fluctuations of the LC director(QLC). The thermal fluctuations change locally and temporarily the refractive index. Thelight scatters on these local changes of refractive index. As well the mean refractive indexof the resonator changes in time. For a small time interval, the resonance is sharp, but itsfrequency fluctuates with time, so it broadens if averaged over time.
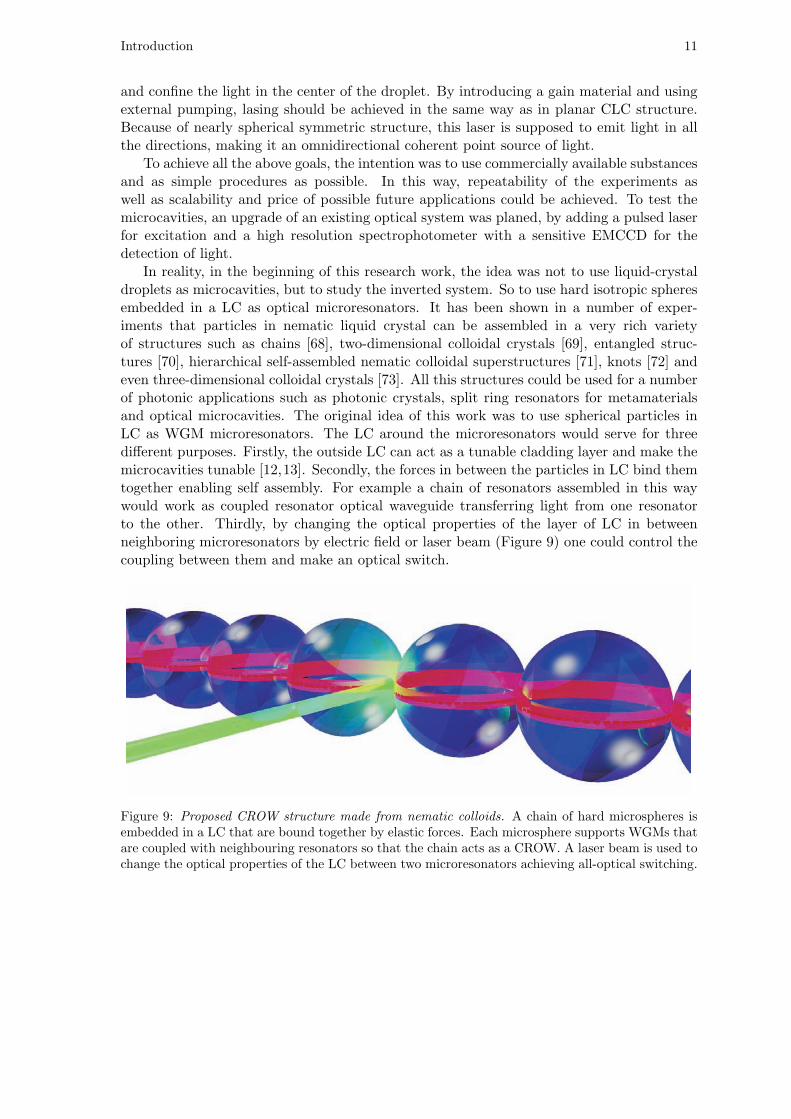
From the decay time, the path length that the light travels around the sphere can becalculated as
L =Qc
ωn(5)
and the number of circulations inside a sphere with the radius r is
N =Qc
2πrωn. (6)
For high Q-factors already small input power will induce large intensity of the circulatinglight in resonator. The circulating intensity can be calculated by [1]
I = PIN
(λ
2πn
)(Q
V
)(7)
where PIN is the input power and V is the mode volume.
We can calculate the maximum theoretical Q-factor for a resonator made from 5CB. Wetake into account only Qmat, so the absorbtion of bulk 5CB, that can be found in Ref. [74].The maximum Q-factors at different wavelengths are
Q(λ = 600 nm) = 5 · 107
Q(λ = 800 nm) > 108 (8)
Q(λ = 1500 nm) = 2 · 105.
Minimum absorbtion is reached at 800 nm. At shorter wavelengths, especially in blueand UV, the absorbtion is higher like in all the organic materials and in NIR the absorbtionis larger because of molecular vibrations.
2.1.2 Purcell effect
The spontaneous emission of a two level system depends on the properties of the systemitself, as well as the environment surrounding the system. The spontaneous decay rate isproportional to the spectral density of the modes at the transition frequency. In vacuumthe density of modes is constant, but inside a cavity the density of modes is much higher atresonant frequencies. The modification of the spontaneous emission in a cavity is referredto as Purcell effect [1]. At resonant frequencies of the cavity the emission is enhanced bythe Purcell factor
P =3
4π2
(λ
n
)3(QV
)(9)
where λ is the resonance wavelength, n is the refractive index, Q is the Q-factor and Vis the mode volume. Furthermore, not only the decay rate is larger, but also the light isdirectionally emitted to the mode itself, greatly increasing the light intensity of this mode.At frequencies that do not match the resonances, the mode density can be below the densityin free space, so the emission is suppressed. The emission of light is also inhibited in photonicbandgap materials. Just as a remark, the Purcell effect can not be explained by classicalelectrodynamics, but cavity quantum electrodynamics (cavity QED) is needed.

Theoretical background 15
An example of the Purcell effect would be a spherical WGM microcavity with embeddedfluorescent dye. In the bulk, the dye emits in a broad spectrum and isotropically in all thedirections. But inside the microcavity, more light is be emitted at frequencies matchingthe resonances. This is visible in the spectrum of the light emitted from such a sphere assharp peaks above the fluorescent background. The light is also preferably emitted in suchdirection, that it is trapped in the resonant modes. The directionality of the emission ishowever more difficult to measure.
2.2 Theory of WGMs
To calculate the positions and linewidths of optical modes (WGMs) in spherical dielectricmicrocavities we have to solve the Maxwell’s equations in spherical coordinates with ap-propriate boundary conditions [11, 75–77]. Calculation of electric field inside and outside asphere is known for a long time and is mostly used to calculate scattering on small parti-cles [78]. The general solutions are known as Mie theory or Mie scattering.
2.2.1 WGM frequencies in an isotropic sphere
Here we are going to calculate solutions for electric and magnetic field in an isotropic di-electric sphere. The derivation is summarized from Ref. [78].
We start with source-free Maxwell’s equations for isotropic medium
∇ ·E = 0 (10)
∇×E = −∂B∂t
(11)
∇ ·B = 0 (12)
∇×B = µµ0εε0∂E
∂t. (13)
Taking the curl of equations (11) and (13) gives
∇×∇×E = − ∂
∂t∇×B = −µµ0εε0
∂2E
∂t2(14)
∇×∇×B = µµ0εε0∂
∂t∇×E = −µµ0εε0
∂2B
∂t2. (15)
By using the vector identity
∇× (∇×V) = ∇ (∇ ·V)−∇2V (16)
and c = 1√µµ0εε0
it gives the wave equations for electric and magnetic field
∂2E
∂t2− c2∇2E = 0
∂2B
∂t2− c2∇2B = 0. (17)
By using oscillating electric field in the form of E = E0ei(k·r−ωt) and k = ω
c we can rewritethe wave equation in the form of Helmholtz equation
k2E+∇2E = 0 k2B+∇2B = 0. (18)
By using a scalar function ψ and a constant vector c we construct a vector function Mthat has zero divergence, such that
M = ∇× (cψ). (19)

16 Theoretical background
It can be shown [78] that if M satisfies the vector Helmholtz equation and ψ is a solutionto the scalar Helmholtz equation
k2ψ +∇2ψ = 0. (20)
We can construct another vector function N which also satisfies the vector Helmholtz equa-tion and has zero divergence, so that
N =∇×M
k. (21)
and also
∇×N = kM. (22)
The scalar function ψ is called generating function for the vector harmonics M and N. BothM and N have all the all the required properties of an electromagnetic filed. They satisfythe vector wave equation, they have zero divergence and the curl of M is proportional toN and the curl of N is proportional to M. Therefore instead of solving the vector waveequation we can solve the scalar wave equation, which is much more simple.
The generating function should be chosen so that it fits the symmetry of our problem.Since we want to calculate the fields in a sphere we choose functions ψ that satisfy the waveequation in spherical coordinates and for the vector c we choose the radius vector r. Wehave now to solve scalar wave equation (20) in spherical coordinates:
1
r2∂
∂r
(r2∂ψ
∂r
)+
1
r2 sin θ
∂
∂θ
(sin θ
∂ψ
∂θ
)+
1
r2 sin2 θ
∂2ψ
∂ϕ2+ k2ψ = 0 (23)
The variables can be separated and the solution can be written as
ψ(r, θ, ϕ) = R(r)Θ(θ)Φ(ϕ) (24)
and the separated equations ared2Φ
dϕ2+m2Φ = 0 (25)
1
sin θ
d
dθ
(sin θ
dΘ
dθ
)+
(l(l + 1)− m2
sin2 θ
)Θ = 0 (26)
d
dr
(r2dR
dr
)+ (k2r2 − l(l + 1))R = 0 (27)
The solutions to (25) are
Φ =1√2πe±imϕ (28)
and the solutions to (26) are associated Legendre functions of the first kind
Θ = Pml (cosθ) (29)
where for each polar mode number l, the allowed azimuthal mode numbers m are in therange of −l < m < l. The two above solutions for ϕ and θ can be also combined, so we getspherical harmonics
Θ(θ)Φ(ϕ) = N eimϕ Pml (cos θ) = Y m
l (θ, ϕ) (30)
where N is a normalization factor.
The solutions to (27) are spherical Bessel functions of first and second kind
jl(kr) =
√π
2krJl+1/2(kr) (31)

Theoretical background 17
yl(kr) =
√π
2krYl+1/2(kr) (32)
where J and Y are ordinary Bessel functions.
The whole solution is now equal to
ψlm = Y ml (θ, ϕ)zl(kr) (33)
where zl is jl or yl or any linear combination of the two. Two special linear combinations areknown as spherical Bessel functions of the third kind, also called spherical Hankel functions
h(1)l (kr) = jl(kr) + iyl(kr) (34)
h(2)l (kr) = jl(kr)− iyl(kr). (35)
The optical modes in the sphere can be uniquely characterized by a set of three modenumbers, the radial mode number q, the polar mode number l, the azimuthal mode numberm and the polarization p. The radial mode number indicates the number of maxima inthe radial intensity distribution in the sphere, the polar mode number gives the number ofwavelengths for one circulation of the light and the azimuthal mode number indicates theinclination of the circular orbit of the light in respect to our reference frame. In Figure 10there are represented the electric field intensity distributions for modes with the same polarmode number, but different radial mode numbers.
Figure 10: Electric field intensity distributions in the equatorial plane of the sphere for TE WGMswith l = m = 30 and n = 1, 2 and 3. It can be seen that for all the three cases the number ofmaxima in tangential direction is equal to 60, which corresponds to 30 wavelengths, so also to thepolar mode number. In the radial direction the number of maxima corresponds to the radial modenumber. Reprinted with permission from [76].
Because the Bessel function of second kind is singular at the origin, only first kindfunction is retained inside of the sphere. On the outside, the Hankel functions are used,
h(1)l corresponds to outward propagating spherical wave and h
(2)l corresponds to inwards
propagating wave. We are interested just in leaking of the modes, so we keep just h(1)l . From
radial functions, electric and magnetic fields can be written. At the surface of the sphere(r = a) the inner fields must match the exterior ones giving the characteristic equations
[nrxjl(nrx)]′
jl(nrx)=
[xh(1)l (x)]′
h(1)l (x)
for TE (36)
[nrjl(nrx)]′
m2jl(nrx)=
[xh(1)l (x)]′
h(1)l (x)
for TM (37)

18 Theoretical background
where nr = ns/na is the relative refractive index between the interior and the surroundingof the sphere, x = ka is the size parameter, where k = ω
c na is the wavenumber in thesurrounding medium. The primes denote differentiations with respect to the argument.Solving these two equations numerically, gives the exact solutions for WGMs. For eachpolar mode number l there are a number of solutions, that correspond to different radialmode numbers q. The solutions for x can not be real, so that the eigenfrequencies ωql arecomplex. This means that the modes are leaky and that the resonances are not infinitelysharp. The real part of ωql is the central frequency of the resonance and the imaginary partrepresents its width. The Q-factor can be calculated as
Q =Re(ωql)
2|Im(ωql)|. (38)
2.2.2 Approximate solutions
Resonant WGM frequencies for small radial mode numbers q can be accurately computedusing asymptotic expansion in powers of (l/2)−1/3 [79,80]
nska = l − αq
(l
2
)1/3
− χnr√n2r − 1
+3α2
q
20
(l
2
)−1/3
− αqnrχ(2χ2 − 3n2r)
6(n2r − 1)3/2
(l
2
)−2/3
+O(l−1)
(39)where
χ =
1 for TE modes
1/n2r for TM modes
and a is the radius of the sphere, k is wavenumber, l ≫ 1 and q = 1, 2, 3, ... are modenumbers, αq are negative q-th zeroes of the Airy function and nr = ns/na is relative refractiveindex, where ns is the refractive index of the sphere and na is the index of the surroundingmedium.
For even better accuracy, additional terms can be added to the expansion. However, fortypical microresonators used in this work (l > 100 and q < 4) the error using (39) is lessthan 10−4. For a mode at 600 nm this means 0.06 nm which is the same as the resolutionof the spectrometer used in this work.
For a really simple approximation and to understand physics behind WGMs, just thefirst term l can be considered. The equation is in this case reduced to nka ≈ l. Usingk = 2π/λ we get
2πan ≈ lλ. (40)
Left side of the equation is the circumference multiplied by the refractive index, which isthe optical path around the droplet. The optical path is approximately equal to the integernumber of wavelengths around the sphere. This expression is of course valid just for firstradial modes (q = 1). For l = 100 the relative error that we make by using (40), is around10%, but for larger droplets with l = 1000 the error is just 0.2%, so in many cases is usefulfor making rough estimations.
Instead of positions of resonant frequencies also approximate mode separation versus thetwo indices l and q up to O(l−2) can be given as
1
ω
∂ω
∂l≈ l−1
[1 +
αq
6
(l
2
)−2/3]
(41)
1
ω
∂ω
∂q≈ π
2√−αq
(l
2
)−2/3[1 +
αq
20
(l
2
)−2/3]
(42)
Theoretical background 19
The Q-factor can be as well approximately calculated [79] using
Q =χ(n2r − 1)
2
[(2u0ν
)1/2
− 1
4u0
]−1
e4u03
(2u0ν
)1/2
(43)
where
χ =
1 for TE modes
1/n2r for TM modes
and nr is relative refractive index, u0 is the value of u = ν − x at the resonance position,ν = l+1/2 and x = 2πr
λ is the size parameter. However, this approximation is not good forvery small or very large polar mode numbers l and can deviate from the correct solution bymore than an order of magnitude.
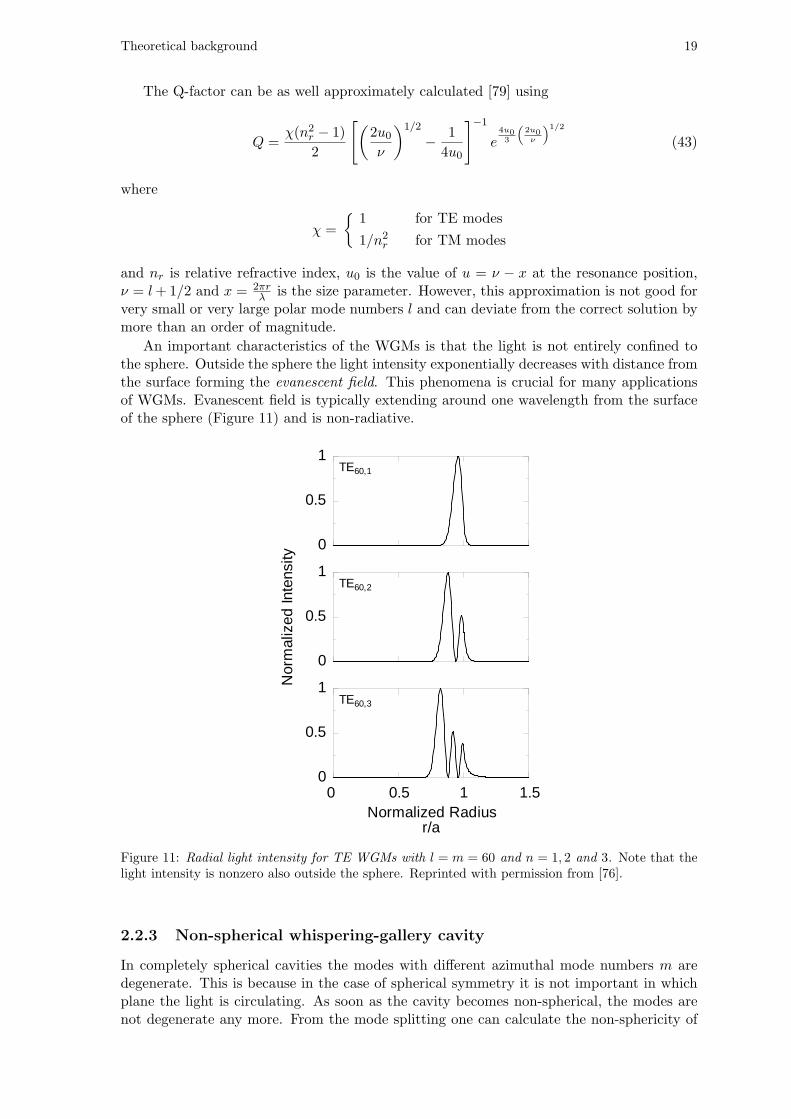
An important characteristics of the WGMs is that the light is not entirely confined tothe sphere. Outside the sphere the light intensity exponentially decreases with distance fromthe surface forming the evanescent field. This phenomena is crucial for many applicationsof WGMs. Evanescent field is typically extending around one wavelength from the surfaceof the sphere (Figure 11) and is non-radiative.
Normalized Radius
0
0.5
1
0
0.5
1
Norm
alized
Inte
nsity
0 0.5 1 1.50
0.5
1
r/a
TE60,1
TE60,2
TE60,3
Figure 11: Radial light intensity for TE WGMs with l = m = 60 and n = 1, 2 and 3. Note that thelight intensity is nonzero also outside the sphere. Reprinted with permission from [76].
2.2.3 Non-spherical whispering-gallery cavity
In completely spherical cavities the modes with different azimuthal mode numbers m aredegenerate. This is because in the case of spherical symmetry it is not important in whichplane the light is circulating. As soon as the cavity becomes non-spherical, the modes arenot degenerate any more. From the mode splitting one can calculate the non-sphericity of

20 Theoretical background
the cavity. For a spheroid we can approximately calculate the frequencies of WGMs usingthe asymptotic expansion [81]
nska = l − αq
(l
2
)1/3
+2g(a− b) + a
2b− χnr√
n2r − 1+
3α2q
20
(l
2
)−1/3
−αq
12
(2g(a3 − b3) + a3
b3+
2nrχ(2χ2 − 3n2r)
(n2r − 1)3/2
)(l
2
)−2/3
+O(l−1) (44)
where
χ =
1 for TE modes
1/n2r for TM modes
and a and b are equatorial and polar semiaxes of the spheroid, k is wavenumber, l ≫ 1,g = l − |m| = 0, 1, 2, ... and q = 1, 2, 3, ... are mode numbers, αq are negative q-th zeroesof the Airy function and nr = ns/na is relative refractive index, where ns is the refractiveindex of the spheroid and na is the index of the surrounding medium. The equation reducesto the spherical case (39) if a = b. And the mode separation versus index m up to O(l−2) is
1
ω
∂ω
∂m≈ l−1 b− a
b
[1 +
αq
12
(b− a)(a+ 2b)
b2
(l
2
)−2/3]. (45)
2.2.4 WGM frequencies in an anisotropic sphere
To find frequencies of WGMs in a nematic droplet, the derivation from Section 2.2.1 hasto be performed for an anisotropic sphere where the optical axis is always in the radialdirection. In the radial direction we have extraordinary dielectric permittivity εe and in thetangential direction we have ordinary dielectric permittivity εo. The differential equationsfor the radial dependance of the electric and magnetic field for TE and TM modes are [82]
d
dr
(r2dR(1)(r)
dr
)+ (k2r2 − l(l + 1))R(1)(r) = 0 (46)
and
d
dr
(r2dR(1)(r)
dr
)+ (k2r2 − l(l + 1)
εoεe)R(1)(r) = 0. (47)
For εe = εo both equations are the same and are equal for the isotropic case (27). Therefore,the solutions to (46) are the same as in isotropic case, so spherical Bessel (jl(kr)) andspherical Hankel functions (hl(kr)). For (47) the solutions [83] are also spherical Bessel(jl(kr)) and spherical Hankel functions (hl(kr)), but with a non-integer order
l(l) =1
2
−1 +
√1 + 4
(none
)2
l(l + 1)
. (48)
Note that for no = ne, l(l) = l. Apart from the non-integer order, the characteristicequations (36) and (37) are the same as for the isotropic case, where nr = no/ns. It isinteresting, that the equation for TE modes is dependent only on the ordinary refractiveindex, whereas TM modes couple both ordinary and extraordinary refractive indices.

Theoretical background 21
2.2.5 Excitation of WGMs
2.2.5.1 Evanescent field coupling
We can excite WGMs by coupling the evanescent field of the sphere with an external evanes-cent field. The external evanescent field can be made in two main ways. The first methodis by total internal reflection of light in a prism. The second source of evanescent field canbe a thin optical fiber, typically several micrometers in diameter. In both cases we needto mechanically bring the microspehere in close contact with the prism or fiber and typicaldistance between the two must be under 1µm for visible wavelengths. Single longitudinalmode tunable laser is used as a light source. By selecting the wavelength that correspondsthe to one WGM is it possible to selectively excite single WGMs. Usually we measure thetransmission of an optical fiber coupled to a microresonator as a function of wavelength. Atthe wavelengths that correspond to WGMs the light energy is flowing into the sphere whereit is dissipating, reducing the transmission through the fiber at that frequency.
2.2.5.2 Fluorescence
A more simple way of exciting WGMs is fluorescence. For example glass microspheresdoped with rare earth elements or microspheres made from polymer material mixed with afluorescent dye are used. Shorter wavelength light is used to excite the fluorescence and thefluorescent substance is emitting light in a broad spectrum at longer wavelengths and in allthe directions. Because of Purcell effect (Section 2.1.2) a larger portion of light is trappedto the optical modes, which can be seen as peaks in the fluorescent spectrum. To furtherincrease the amount of coupled light, it is better not to illuminate the whole microsphere, butjust with a tightly focused beam near the edge of the sphere, where the modes are located.In the same way, having the fluorescent substance near the surface is a more efficient way ofexiting WGMs, because the light captured inside the sphere is circumnavigating just belowthe surface. The fluorescent substance can also be on the surface outside the microsphere.In this case the WGMs are excited through the coupling between the fluorescent substanceand the WGMs trough evanescent field.
2.3 Theory of lasing
Laser is a special light source with high temporal and spatial coherence that uses stimulatedemission to achieve these characteristics. LASER is an acronym for Light Amplification byStimulated Emission of Radiation. A laser is made of a gain medium that amplifies thelight and a resonant cavity that enables the recirculation of light through the gain medium.To understand the optical amplification [84, 85] we have to look at the levels in the gainmaterial, transition probabilities and the optical loses in the laser cavity.
Suppose that we have a two level system (|1⟩ and |2⟩), the lower level having energyE1 and the upper having energy equal to E2. The number of electrons in the two levels isN1 and N2, respectively, with the total number of electrons N = N1 + N2 and energy oftransition E2 − E1 = hν. In thermal equilibrium the ratio of the populations of these twolevels is
N2
N1= e(E1−E2)/kBT . (49)
At zero temperature all the electrons are in |1⟩, while at infinite temperature both levels areequally occupied. As we will se later, for optical gain to be present, population inversion(N2 > N1) is necessary. To achieve population inversion at least a three level system isrequired (|1⟩, |2⟩ and |3⟩). The electrons are pumped from |1⟩ to |3⟩. Population inversionis achieved between |1⟩ and |2⟩ if the transition from |2⟩ and |3⟩ is faster or between |2⟩ and|3⟩ if the transition from |1⟩ and |2⟩ is faster.
22 Theoretical background
To describe the probabilities of transitions in a two level system we introduce so calledEinstein coefficients. Three processes are possible in a two level system. If the system isin high energy state and is perturbated by an electric field of frequency ω it may emit anphoton, that has the same frequency and in the same phase as the external field. Thisprocess is called stimulated emission. The rate of stimulated emission is
∂N1
∂t= B21u(ω)g(ω)N2 (50)
where B21 is the Einstein B coefficient, u(ω) is the spectral energy density and g(ω) is thelineshape of the transition. The transition rate is proportional to the number of excitedstates and the density of incident photons. The second process is absorption, the rate isequal to
∂N2
∂t= B12u(ω)g(ω)N1. (51)
The rate is proportional to the number of ground states and again density of the incidentphotons. The third process is spontaneous emission which is not dependent on the densityof the incident photons. The rate is given by Einstein A coefficient as
∂N2
∂t= −A21N2. (52)
It can be shown [84] thatB12 = B21 = B (53)
andA
B=
~ω3
π2c3. (54)
For the light with photon flux density ϕ propagating inside a gain material, the followingequation can be written [85]
dϕ
dz=
γ0ϕ
1 + ϕ/ϕ0, (55)
where γ0 is small signal gain coefficient and ϕ0 is saturation photon-flux density that isconnected to Einstein coefficients by
ϕ0 ∝A
B. (56)
For the laser resonator in equilibrium, the total energy W in the resonator should beconstant. The energy gain for propagation of light back and forth through the resonator(path length 2L, where L is the resonator length) is
∆Wgain =γ0W2L
1 +W/WS, (57)
where WS is the saturation energy, that is connected to the saturation photon-flux density.On the other hand, the loses are
∆Wloss = −[α02L+ (1−R1) + (1−R2)]W = −2ΛW, (58)
where R1 and R2 are reflectivities of the two mirrors and α0 is the absorbtion coefficient.In equilibrium the losses should be the same as the gain, so
2ΛW =γ0W2L
1 +W/WS(59)
and therefore
W =
(γ0L
Λ− 1
)WS . (60)
The threshold of the laser is at γ0L/Λ = 1. From that point on the energy in the laser islinearly increasing with gain. The power output, if R1 = 1 and R2 < 1, is
P = (1−R2)c
2LW. (61)

Theoretical background 23
2.4 Bragg microcavities
The same as for WGMs, to get the modes in a spherical Bragg microcavity, we have to solveHelmholtz equation in spherical coordinates. The derivation is summarized from Ref. [86].
Ingoing and outgoing light can be expressed as spherical waves by using spherical har-monics. For TE wave polarization the electric and magnetic fields of a spherical wave withfrequency ω can be written as
E = −µk0(
m
sin θP
|m|l (cos θ)eθ + i
∂
∂θP
|m|l (cos θ)eφ
)V (r)eimφ and (62)
H =
[l(l + 1)
rV (r)P
|m|l (cos θ)er +
(∂
∂θP
|m|l (cos θ)eθ
im
sin θP
|m|l (cos θ)eφ
)1
r
∂
∂r(rV (r))
]eimφ,
where V (r) = Ah(1)l (kr) +Bh
(2)l (kr) are spherical Hankel functions, A and B are constants
and k = nω/c where n is the refractive index of the medium the spherical wave is propagatingthrough. Orbital momentum is equal to l and its projection m can be in the intervalfrom −l to l. An orbital momentum l = 0 corresponds to a fully spherically symmetricelectromagnetic wave, which does not exist. Similarly, also fields for a TM mode can bewritten.
To obtain the spatial distribution of an electromagnetic field in a layered structure, thetransfer matrix technique is used. In this way also transmission and reflection coefficientscan be calculated. For planar Bragg reflector, to obtain maximum reflection at the frequencyωBR, the layers should have the thickness corresponding to quarter wavelength of the light.The thicknesses (d1 and d2) for the two layers with refractive indexes n1 and n2 mustsatisfy the relation d1,2 = πc/2ωBRn1,2. However, spherical Bragg structure that optimallyreflects light is non-periodic [37]. This directly reflects the non-periodicity of the outgoingspherical Henkel functions. The layers should therefore be quarter-wavelength thick, butcorresponding to the actual wavelength, that changes with the distance from the center.At larger distances from the center the spherical Henkel functions become periodic, so thewavelength becomes constant and equal to that of a planar wave. The derivation of thereflection coefficient (rb) of the spherical Bragg structure can be found in Ref. [86].
Depending on the structure of the cavity we have three basic types of spherical Braggmicrocavities. The simplest is the structure where the periodic structure fills all the volumeof the spherical cavity (Figure 12a). In the second case there is a defect in the center (Figure12b). This is a sphere, typically half wavelength or larger in diameter that can have thesame or different refractive index than the layers. The third type of Bragg microcavity hasa shell defect, that is the case when one of the spherical layers is thicker (Figure 12c) or hasdifferent refractive index. Modes similar to WGMs are confined to this layer. We will notbe interested in this last type. All this structures also have equivalents in 2D case, that arereferred to as circular, disk and ring Bragg microcavities, respectively [87].
In the case of microcavity with the central defect, the optical modes are confined intothis central region, with the intensity exponentially decaying into the surrounding periodicstructure. The resonant frequencies lie in the PBG frequency region, and are therefore calledbandgap modes or defect modes. If there is no defect at the center, the modes in such cavityare delocalized and occupy much of the volume of the cavity. Their frequencies lie on theedge of the bandgap or near the bandedge, so they are called bandedge modes.
For the Bragg microcavity with the defect at the center, the electromagnetic field in thecore can be expressed as the sum of incoming and outgoing waves. In stationary case theamplitude of both waves in the core should be equal and finite in the center. Therefore, thefield in the core is described with spherical Bessel functions. On the other hand, the at theinterface of the defect, the amplitude of the outgoing wave should be equal to the amplitudeof the outgoing wave from the layered structure multiplied by the reflection coefficient rb.

24 Theoretical background
Figure 12: Three basic types of spherical Bragg microcavities. a) A normal spherical Bragg micro-cavity, b) with a defect in the center and c) with a shell defect.
So, the equation for the eigenmodes of a spherical Bragg microcavity with the defect radiusof R0 is
rbh(1)l (kR0) = h
(2)l (kR0). (63)
This equation gives solutions for both TE and TM modes, however, the reflection coefficientrb is different for each polarization. If rb is close to unity, that is in the case of low absorbtion(high Q-factor) and the core diameter is equal or larger than the wavelength of the light,the frequencies of the TE modes can be approximated as
ω =b+ π(2N + l + 1)
b/ωb + 2n0R0/c(64)
and for TM modes as
ω =b+ π(2N + l)
b/ωb + 2n0R0/c(65)
where ωb is the Bragg frequency for the spherical Bragg structure, b = πn1n2/(n0(n2 −n1))and N is an integer. For smaller core diameters we have to solve the equation (63).
All the TE and TM modes have zero electric field in the center of the cavity, except forTM mode with l = 1 and m = 0 (Figure 13a). For this case, the electric field is orientedalong the z-axis and the maximum is achieved in the polar areas in the low index layer, justoutside the core. For TE mode with l = 1 and m = 0 (Figure 13b) the field has torroidalstructure with zero electric field in the center. For both TE and TM polarizations with l = 0and m = 0 the far field pattern corresponds to the radiation of a dipole oscillating along thez-direction.
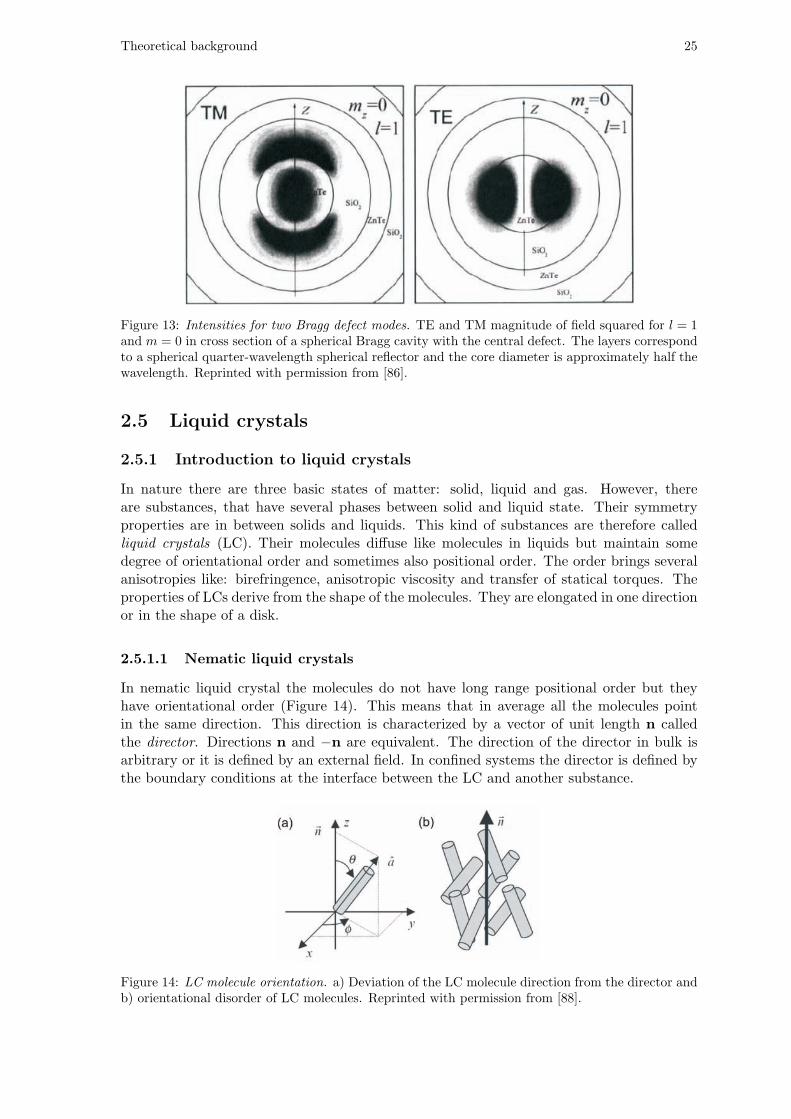
Theoretical background 25
Figure 13: Intensities for two Bragg defect modes. TE and TM magnitude of field squared for l = 1and m = 0 in cross section of a spherical Bragg cavity with the central defect. The layers correspondto a spherical quarter-wavelength spherical reflector and the core diameter is approximately half thewavelength. Reprinted with permission from [86].
2.5 Liquid crystals
2.5.1 Introduction to liquid crystals
In nature there are three basic states of matter: solid, liquid and gas. However, thereare substances, that have several phases between solid and liquid state. Their symmetryproperties are in between solids and liquids. This kind of substances are therefore calledliquid crystals (LC). Their molecules diffuse like molecules in liquids but maintain somedegree of orientational order and sometimes also positional order. The order brings severalanisotropies like: birefringence, anisotropic viscosity and transfer of statical torques. Theproperties of LCs derive from the shape of the molecules. They are elongated in one directionor in the shape of a disk.
2.5.1.1 Nematic liquid crystals
In nematic liquid crystal the molecules do not have long range positional order but theyhave orientational order (Figure 14). This means that in average all the molecules pointin the same direction. This direction is characterized by a vector of unit length n calledthe director. Directions n and −n are equivalent. The direction of the director in bulk isarbitrary or it is defined by an external field. In confined systems the director is defined bythe boundary conditions at the interface between the LC and another substance.
Figure 14: LC molecule orientation. a) Deviation of the LC molecule direction from the director andb) orientational disorder of LC molecules. Reprinted with permission from [88].

26 Theoretical background
2.5.1.2 Order parameter
With the director we described the mean direction of the LC molecules. Now we want tocharacterize how good is the orientation of the molecules in that direction. For that purposewe construct a scalar quantity called order parameter, defined as
S =1
2< (3 cos2 θ − 1) >=
∫f(θ)
1
2(3 cos2 θ − 1)dΩ. (66)
where θ is the angle between the director and the long axis of the molecules (Figure 14a).In the isotropic phase it is equal to zero, in the crystal phase equal to one, whereas in thenematic phase its value is usually in between 0.3 and 0.7
2.5.1.3 Elastic properties of liquid crystals
In the nematic phase the director is uniform in space. However, usually because of confine-ment and external fields the director varies spatially. This deformation of LC costs energyand therefore the elastic energy density is equal to
felast =1
2K11(∇ · n)2 + 1
2K22(n · ∇ × n)2 +
1
2K33(n×∇× n)2. (67)
This elastic energy is called also Oseen-Frank energy, andK11, K22 andK33 are referred to asthe Frank elastic constants. For 5CB at room temperature the values are K11 = 0.64×10⁻¹¹
N, K22 = 0.3× 10⁻¹¹ N and K33 = 1× 10⁻¹¹ N.
2.5.1.4 Electric field effect in liquid crystals
Liquid crystals are important from the application stand point of view because of theirlarge response to an external electric field. With just few volts applied to a LC cell, thereorientation of the LC molecules and change of the optical properties of the cell can beachieved. Electric field induces electric dipole in LC molecules, which is dependent on theorientation of the molecules, since they posses dielectric anisotropy. We define χ∥ as thedielectric susceptibility parallel to the long axes of the molecule, and χ⊥ as the dielectricsusceptibility perpendicular to this direction. The anisotropy of the dielectric susceptibilityis then ∆χ = χ∥ − χ⊥ and the anisotropy of the dielectric constant is ∆ϵ = ϵ∥ − ϵ⊥ =(1 + χ∥) − (1 + χ⊥) = χ∥ − χ⊥ = ∆χ. The induced polarization for an arbitrary anglebetween the electric field and the nematic director is given by
P = ϵ0χ∥(E · n)n+ ϵ0χ⊥[E− (E · n)n] = ϵ0[χ⊥E+∆χ(E · n)n]. (68)
The density of the electric free energy is calculated as
felec = −1
2P ·E = −1
2ϵ0[χ⊥E+∆χ(E · n)n] ·E = −1
2ϵ0χ⊥E
2 − 1
2ϵ0∆ϵ(E · n)2. (69)
This is an additional contribution to the total free energy of the LC (67). We can neglect thefirst term, since it is not dependent on the orientation of the nematic director. The directorwill orient so that the total free energy will be minimal. If ∆ϵ > 0 the molecules tend toalign along the electric field and if ∆ϵ < 0 the molecules tend align in the perpendiculardirection. Most nematic LCs have positive dielectric constant, since the polarizability islarger along the long axis of the molecule.

Theoretical background 27
2.5.1.5 Change of the refractive indices of liquid crystals by temperature
In the nematic liquid crystal phase the bulk refractive indices ne and no correspond tothe dielectric constants along and perpendicular to the nematic director. We can definebirefringence ∆n that is the difference between the two indices
∆n = ne − no. (70)
At high temperature, when the LC is in the isotropic phase, the molecules do not haveany rotational order. In this case the liquid crystal is optically isotropic and the averagerefractive index is
⟨n⟩ = ne + 2no3
. (71)
Similar to the isotropic liquids, the average refractive index of LCs depends on thedensity of the material and decreases with the increasing temperature, since also the densitydecreases. The average refractive index in the isotropic, as well as in the nematic phase canbe approximated as
⟨n⟩ = A−BT, (72)
where A and B are the material parameters. In the nematic phase the molecules are inaverage oriented along the director direction, but are fluctuating around this average di-rection. The degree of the orientational order is given by the order parameter S that isstrongly temperature dependent and decreases when approaching the isotropic phase. Thebulk refractive indices are also dependent on the amount of orientational fluctuations andtherefore on temperature [89]. The birefringence decreases with temperature and reacheszero in the isotropic phase. It is described by the Haller approximation
∆n(T ) = (∆n)0
(1− T
TC
)β
, (73)
where (∆n)0 is the birefringence in the crystalline state with perfect orientational orderat T = 0, TC is the isotropic-nematic phase transition temperature and β is a materialconstant. Using (70), (71), (72) and (73) the ordinary and extraordinary refractive indicesare
no(T ) = A−BT − (∆n)03
(1− T
TC
)β
(74)
and
ne(T ) = A−BT +2(∆n)0
3
(1− T
TC
)β
. (75)
Near to the isotropic-nematic phase transition temperature, the contribution of the BT fac-tor is negligible in comparison to the effect of the last term. The ordinary refractive index istherefore increasing with temperature, while the extraordinary refractive index is decreas-ing. Their change is much faster near the isotropic-nematic phase transition temperature.The extraordinary refractive index change is approximately twice as large as that of theordinary refractive index.
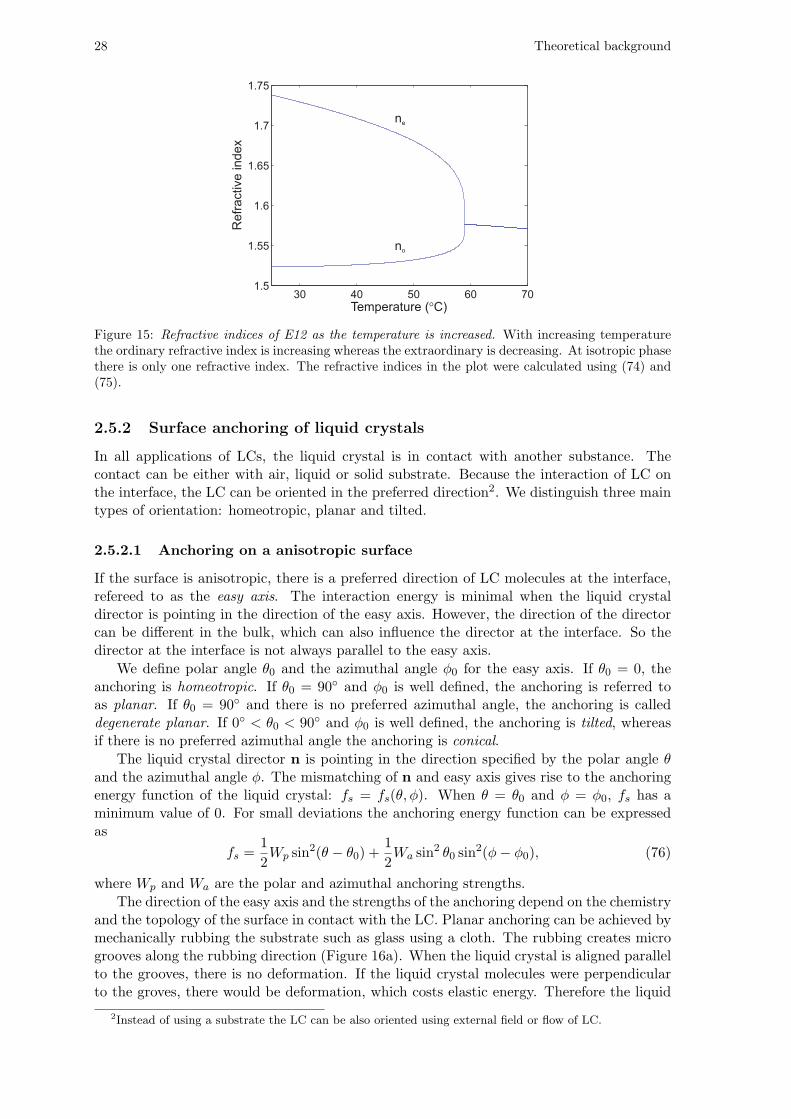
28 Theoretical background
Figure 15: Refractive indices of E12 as the temperature is increased. With increasing temperaturethe ordinary refractive index is increasing whereas the extraordinary is decreasing. At isotropic phasethere is only one refractive index. The refractive indices in the plot were calculated using (74) and(75).
2.5.2 Surface anchoring of liquid crystals
In all applications of LCs, the liquid crystal is in contact with another substance. Thecontact can be either with air, liquid or solid substrate. Because the interaction of LC onthe interface, the LC can be oriented in the preferred direction2. We distinguish three maintypes of orientation: homeotropic, planar and tilted.
2.5.2.1 Anchoring on a anisotropic surface
If the surface is anisotropic, there is a preferred direction of LC molecules at the interface,refereed to as the easy axis. The interaction energy is minimal when the liquid crystaldirector is pointing in the direction of the easy axis. However, the direction of the directorcan be different in the bulk, which can also influence the director at the interface. So thedirector at the interface is not always parallel to the easy axis.
We define polar angle θ0 and the azimuthal angle ϕ0 for the easy axis. If θ0 = 0, theanchoring is homeotropic. If θ0 = 90 and ϕ0 is well defined, the anchoring is referred toas planar. If θ0 = 90 and there is no preferred azimuthal angle, the anchoring is calleddegenerate planar. If 0 < θ0 < 90 and ϕ0 is well defined, the anchoring is tilted, whereasif there is no preferred azimuthal angle the anchoring is conical.
The liquid crystal director n is pointing in the direction specified by the polar angle θand the azimuthal angle ϕ. The mismatching of n and easy axis gives rise to the anchoringenergy function of the liquid crystal: fs = fs(θ, ϕ). When θ = θ0 and ϕ = ϕ0, fs has aminimum value of 0. For small deviations the anchoring energy function can be expressedas
fs =1
2Wp sin
2(θ − θ0) +1
2Wa sin
2 θ0 sin2(ϕ− ϕ0), (76)
where Wp and Wa are the polar and azimuthal anchoring strengths.
The direction of the easy axis and the strengths of the anchoring depend on the chemistryand the topology of the surface in contact with the LC. Planar anchoring can be achieved bymechanically rubbing the substrate such as glass using a cloth. The rubbing creates microgrooves along the rubbing direction (Figure 16a). When the liquid crystal is aligned parallelto the grooves, there is no deformation. If the liquid crystal molecules were perpendicularto the groves, there would be deformation, which costs elastic energy. Therefore the liquid
2Instead of using a substrate the LC can be also oriented using external field or flow of LC.

Theoretical background 29
Figure 16: Two types of anchoring of a NLC. a) Planar anchoring and b) homeotropic anchoring.Reprinted with permission from [88]
crystal is homogeneously aligned along the grooves. The drawback with alignment created inthis way is that the anchoring strength (10−5 J/m2) is weak. A better choice for the planaralignment layer is rubbed polyimide. The rubbing not only creates the micro grooves butalso aligns the polymer chains. The interaction between the liquid crystal and the alignedpolymer chains also favors parallel alignment and thus increases the anchoring energy. Theanchoring strength can become as high as 10−3 J/m2. Furthermore, tilted anchoring with afew degrees pretilt angle can be made.
Homeotropic anchoring can be achieved using a monolayer of surfactants such as lecithinor silane. The polar head of the surfactant is chemically attached to the glass substrate andthe hydrocarbon tail points out and perpendicular to the surface (Figure 16b). The inter-molecular interaction between the surfactant and the liquid crystal promotes the homeotropicalignment.
2.5.2.2 Anchoring on an isotropic surface
Consider a LC in contact with an isotropic interface such as isotropic solid (e.g. glass),isotropic liquid (e.g. water) or as a free surface. It can also be in contact with gas orisotropic phase of the LC itself. The later is especially easy to describe, since there is nointeraction with the substrate involved. The only thing that changes at this kind of interfaceis the density and the order parameter of the LC.
On an isotropic surface there are three possible types of anchoring: degenerate planar,homeotropic and conical. Planar and tilted anchoring are not possible for obvious sym-metrical reasons. The degenerate planar anchoring is geometrically most reasonable withelongated molecules lying parallel to the surface. An example is a free surface of nCB incontact with clean flat glass or water. However, in some cases the anchoring can also behomeotropic, as with nCB in contact with the solution of surfactant such as SDS. Takinginto account also the electrostatic interactions between the LC molecules and the substrate,we can get conic anchoring. This is the case of the free surface of MBBA or its nematic-isotropic interface. The angle of the conic anchoring at isotropic surface is very sensitive totemperature and surface contaminants.
2.5.3 Cholesteric liquid crystals
If the LC mixture is chiral, the molecules are not any more oriented in the same direction,but tend to rotate, making a helical twist, but locally the structure is still nematic. Thiskind of liquid crystals are called cholesteric liquid crystals (CLC). The components of thedirector are
nx = cos(q0z + ϕ)
ny = sin(q0z + ϕ)
nz = 0, (77)
30 Theoretical background
where the pitch is
p =2π
|q0|. (78)
Both the direction and the phase of the helical twist z and ϕ are arbitrary and are usuallydefined by the surface. The sign of q0 distinguishes between left- and right-handedness.
The liquid crystal molecules can be chiral by themselves, but usually a mixture of nematicLC and a chiral dopant is used. By changing the concentration of the dopant the pitch canbe adjusted to the needs. The pitch is inversely proportional to the dopant concentrationas
p =1
βcw(79)
where β is helical twisting power (HTP) and cw is weight concentration of the chiral dopant.HTP it is highly temperature dependent, so it is also the pitch. It can increase or decreasewith temperature or even change sign.
2.5.3.1 Position and width of the photonic bandgap
Chiral nematic liquid crystals provide periodic modulation of the refractive index that in-fluences the light passing through the material. Due to the molecular chirality, the directorspontaneously twists in a direction perpendicular to the long molecular axes. The period-icity of this helical birefringent structure depends on the molecular chirality and is in therange from ∼ 100 nm to several micrometers. According to the pitch length compared tothe wavelength of the light we distinguish two interesting regimes of light propagation alongthe helical axis [88]. When the pitch is much longer than the wavelength of light (P ≫ λ),the polarization twists in phase with the liquid crystal director and follows the helix. Thisis called the waveguide regime.
In the case when Pn ∼ λ, CLC reflects circularly polarized light with the same hand-edness as the CLC. This means that a one-dimensional photonic bandgap exists along thehelical axis. The edges of the reflection band are given by λ1 = nep and λ2 = nop, so thecenter of the bandgap is
λc =ne + no
2p = np (80)
and its width is∆λ = ∆np. (81)
At angles different from normal incidence, the center of the reflection band shifts towardsshorter wavelengths in accordance to Bragg’s law. Under white-light illumination, cholestericliquid crystals are often characterized by the fascinating iridescent colors of the reflectedlight. The reflectance of a cholesteric layer for the light in the center of the reflection bandcan be approximately given by [88]
R ≈
(1− e−2∆nπh/np
1 + e−2∆nπh/np
)2
, (82)
where h is the thickness of the layer.

31
3 Materials and methods
3.1 Liquid crystals
To make the microcavities, different nematic liquid crystals were used as the material for thedroplets. The most common and widely studied NLC is the 5CB (4-cyano-4’-pentylbiphenyl,Nematel). It has ∼ 10C wide nematic temperature range around room temperature andmedium birefringence. In this work, 5CB was used in some experiments, especially for LCbiosensors. For experiments with electric field tuning, E12, a mixture of cyano-biphenyls(Merck), was used. Higher birefringence enables wider tunability and higher refractive indexgives larger index contrast to the outside medium, the microcavities therefore having higherQ-factors. Larger birefringence and wider nematic temperature range also enables largertemperature tunability. For some time now, E12 is no more commercially available, so otherwide temperature range commercial LC mixtures have been used also in this work. Highbirefringence mixture MLC-2132 (Merck) and low birefringence mixture MLC-7023 (Merck)were used. All the LCs used in this work have positive dielectric anisotropy.
To prepare chiral nematic (cholesteric) mixtures, S-811 chiral dopant (Merck) was usedin concentrations from few percents up to 30wt%. The dopant was added to the nematicLC, the mixture was heated to isotropic phase and mixed for few minutes. If the mixingwas performed at room temperature in the nematic phase, the concentration of the dopantwas very nonuniform and so was also the pitch and the wavelength of the reflection band.
Table 1: Properties of LCs. Refractive indices (measured at room temperature and at ∼ 600 nm)and transitions temperatures for liquid crystals used in this work.
Liquid crystal no ne ∆n C → N N → I
5CB 1.54 1.71 0.17 24C 35CE12 1.52 1.74 0.22 −10C 59CMLC-2132 1.51 1.77 0.26 ND 114CMLC-7023 1.46 1.53 0.07 ND 80C
3.2 Dyes
As a source of light inside the LC microcavities, different fluorescent dyes were used. Sincewe used green excitation lasers (514 nm and 532 nm), all the used dyes have strong absorbtionin green part of the spectrum and emission in the red.
One of the most important property of the dyes is their solubility in LCs. Typicalconcentrations ranged from 0.01wt% to 0.1wt%. But especially for lasing, very large con-centrations, sometimes several percents, are needed, so nearly saturated solutions up to0.3wt% were used. Other important properties are quantum efficiency and photostabilityagainst photobleaching. Photobleaching is a process where the dye molecules are irreversiblyconverted to a non-fluorescent form. Depending on the shape of dye molecules they can ori-ent in the same direction as the LC director or they can be randomly oriented. If they areoriented, also their dipole moment has a well defined direction and therefore the absorbtion

32 Materials and methods
as well as the emission is strongly polarization dependent. This effect is used to imagelocal director field using a technique called fluorescence confocal polarization microscopy(FCPM). In the case of microcavities the orientation of the dye molecules could increase thecoupling of the dye to a specific optical mode if the polarization matches the dipole moment.However, in this work we did not notice a major impact on the results.
The dyes used were
• Rhodamine B tetradecyl ester chloride (SPP-106), Figure 17a
• Rhodamine B octadecyl ester perchlorate (Sigma-Aldrich)
• BASF Lumogen F Red 305
• 4-dicyanomethylene-2-methyl-6-(p-dimethylaminostyryl)-4H-pyran (DCM, Exciton)
• 7-diethylamino-3,4-benzophenoxazine-2-one (Nile red, Sigma-Aldrich), Figure 17b.
At first we tried to use used Rhodamine B, since it has high quantum yield, but wefound that it has low solubility in LCs. SPP-106 is Rhodamine B but with an added non-polar tail. It has advantages over plain Rhodamine B, since the non-polar tail of the dyeensures better solubility in the liquid crystal and prevents the diffusion of the dye into thesurrounding medium such as PDMS polymer. The SPP-106 was synthesized by Dr. StanePajk from Prof. Slavko Pecar research group, Faculty of Pharmacy, University of Ljubljana.Rhodamine B octadecyl ester perchlorate is a similar compound and it is commerciallyavailable. Another commercially available dye is BASF Lumogen, that is used to dye plasticproducts. It has very high stability against photobleaching, but it can have low solubility incertain LCs. For lasing experiments in cholesteric liquid crystals, DCM dye is from literatureby far the most used one. With good stability and solubility is well suited for most lasingexperiments. We have found that Nile Red has among this dyes the best solubility in mostliquid crystals. Higher concentrations in this case can give lower thresholds for lasing. NileRed is also used for FCPM since it has good dipole orientation in LCs.
To prepare the dye solution in a LC, a small amount of dye was weighted and added tothe LC. The LC was heated to isotropic phase and well mixed. After cooling back to roomtemperature, the solution was centrifuged to remove non-dissolved dye crystals. If smallerconcentration of dye was needed it was difficult to weight sub milligram quantities of dye.Therefore, a more concentrated solution was first prepared and than diluted.
In the first experiments also CdSe fluorescent quantum dots were used instead of a dye.They poses superior optical stability, but tend to agglomerate in LCs, which limits theirconcentration.
Figure 17: Dye molecules. Molecular structure of (a) SPP-6 and (b) Nile red. Adapted from Ref. [90].
3.3 Carrying medium
An important part of a LC dispersion is also the carrying medium. It enables formationof droplets, gives them mechanical support and the right anchoring. We can for exampleuse just distilled water, that gives planar anchoring. However, if there are some impuritiesin the water, the anchoring can become tilted or even homeotropic. For stronger planaranchoring we can add 5% of polyvinyl alcohol (PVA), which also makes the dispersion morestable, preventing coalescence of droplets. For homeotropic anchoring in water, a surfactant

Materials and methods 33
can be added (see Section 4.7). Typical concentrations are in the order of 10µg/ml. In ourwork > 4mM sodium dodecyl sulfate (SDS) was used for homeotropic anchoring. Criticalmicelle concentration for SDS is 8.4mM. Using SDS at concentration above the criticalmicelle concentration results in 5CB dissolving in the aqueous solution of micelles [91]. SDSmakes the dispersion stable for months. As the outside medium with planar anchoring alsoglycerine can be used. It has higher viscosity, which facilitates the formation of dropletsby mechanical mixing and also prevents to a certain level the movement of the droplets.Its higher refractive index can be beneficial in certain cases. Some LCs are slightly solublein glycerol, but this was not a big problem in our experiments. All of this materials workperfectly for making droplets, however they are not appropriate for applying electric field tothe droplets. In this case water is not at all suitable, since electrolysis occurs. The dropletsare also deformed by the electric field and can also be pushed to one electrode, so a solidmatrix should be used. By trying different polymers we found that majority of them aresoluble in LC or have planar anchoring. We found, that PDMS (Sylgard 184, Dow Corning)is the most suitable for our purposes. It is a two component system: a base polymer anda curing agent. The base polymer is a viscous fluid, that can be used alone to make theLC dispersion, giving good results. For initiation of the polymerization 10% of the curingagent is mixed with the base. The polymerization rate is temperature dependent and thepolymerization takes 48 hours at room temperature or as little as 15 min at 150 C. In ourcase the polymerization was performed at room temperature, not to effect much the LCdroplets. The PDMS containing the droplets can also be used as a free standing film, thatcan be mechanically deformed. An alternative to PDMS is CYTOP fluoropolymer. Becauseof its low refractive index (1.34), homeotropic anchoring, good chemical stability and lowLC solubility it is a good candidate.
Table 2: Carrying materials. Refractive indices and anchoring of materials used as medium for LCdroplets.
Material Refractive index LC anchoring
PDMS (Sylgard 184) unpolymerized 1.38 homeotropicPDMS (Sylgard 184) polymerized 1.42 homeotropicwater 1.33 planar5% PVA solution in water 1.34 planar5mM SDS solution in water 1.33 homeotropicglycerol 1.47 planar
3.4 Making dispersion of LC droplets
After preparation of the dye doped LC mixture, the LC dispersion should be prepared. Inthe case of PDLCs the droplets are usually made by phase separation [45]. This means thatinitially the LC is dissolved in a polymer and the droplets are formed by polymerization-,thermally- or solvent-induced phase separation. In this case the droplets are very small,usually less than one micrometer, very dense and sometimes also of irregular shapes. In ourcase we need droplets larger than 10µm, with as possible smooth surface, spherical shapeand that are well separated from each other. Therefore, the procedures for making PDLCsare not appropriate for our case. The easiest way to achieve the desiderate properties ofthe dispersion is by mechanical mixing of the LC with a fluid that is immiscible with theLC (Table 2). The surface tension makes the droplets perfectly spherical and with smoothsurface.
The mixing procedure differs for different carrying mediums. For fluids with high vis-cosity like glycerol and PDMS a small quantity, typically around 100µl was put into a smallbottle. Using a 10µl pipette a small amount of LC mixture (typically 1µl− 5µl) was intro-
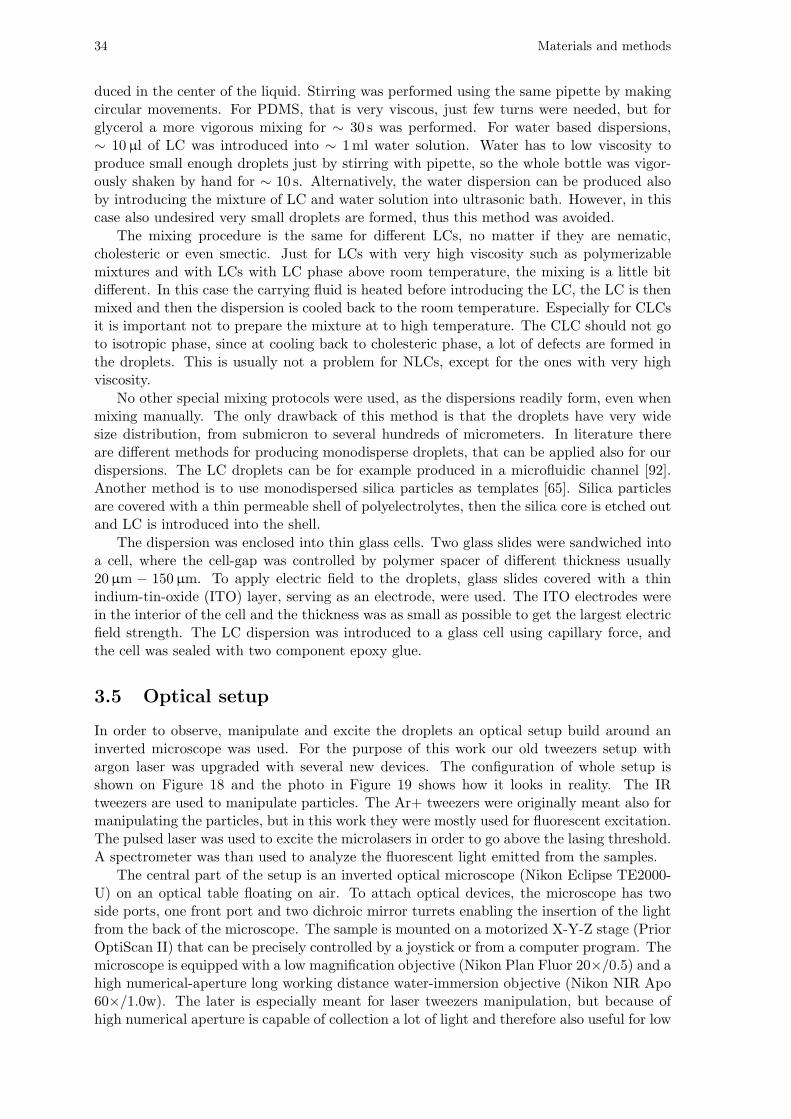
34 Materials and methods
duced in the center of the liquid. Stirring was performed using the same pipette by makingcircular movements. For PDMS, that is very viscous, just few turns were needed, but forglycerol a more vigorous mixing for ∼ 30 s was performed. For water based dispersions,∼ 10µl of LC was introduced into ∼ 1ml water solution. Water has to low viscosity toproduce small enough droplets just by stirring with pipette, so the whole bottle was vigor-ously shaken by hand for ∼ 10 s. Alternatively, the water dispersion can be produced alsoby introducing the mixture of LC and water solution into ultrasonic bath. However, in thiscase also undesired very small droplets are formed, thus this method was avoided.
The mixing procedure is the same for different LCs, no matter if they are nematic,cholesteric or even smectic. Just for LCs with very high viscosity such as polymerizablemixtures and with LCs with LC phase above room temperature, the mixing is a little bitdifferent. In this case the carrying fluid is heated before introducing the LC, the LC is thenmixed and then the dispersion is cooled back to the room temperature. Especially for CLCsit is important not to prepare the mixture at to high temperature. The CLC should not goto isotropic phase, since at cooling back to cholesteric phase, a lot of defects are formed inthe droplets. This is usually not a problem for NLCs, except for the ones with very highviscosity.
No other special mixing protocols were used, as the dispersions readily form, even whenmixing manually. The only drawback of this method is that the droplets have very widesize distribution, from submicron to several hundreds of micrometers. In literature thereare different methods for producing monodisperse droplets, that can be applied also for ourdispersions. The LC droplets can be for example produced in a microfluidic channel [92].Another method is to use monodispersed silica particles as templates [65]. Silica particlesare covered with a thin permeable shell of polyelectrolytes, then the silica core is etched outand LC is introduced into the shell.
The dispersion was enclosed into thin glass cells. Two glass slides were sandwiched intoa cell, where the cell-gap was controlled by polymer spacer of different thickness usually20µm − 150µm. To apply electric field to the droplets, glass slides covered with a thinindium-tin-oxide (ITO) layer, serving as an electrode, were used. The ITO electrodes werein the interior of the cell and the thickness was as small as possible to get the largest electricfield strength. The LC dispersion was introduced to a glass cell using capillary force, andthe cell was sealed with two component epoxy glue.
3.5 Optical setup
In order to observe, manipulate and excite the droplets an optical setup build around aninverted microscope was used. For the purpose of this work our old tweezers setup withargon laser was upgraded with several new devices. The configuration of whole setup isshown on Figure 18 and the photo in Figure 19 shows how it looks in reality. The IRtweezers are used to manipulate particles. The Ar+ tweezers were originally meant also formanipulating the particles, but in this work they were mostly used for fluorescent excitation.The pulsed laser was used to excite the microlasers in order to go above the lasing threshold.A spectrometer was than used to analyze the fluorescent light emitted from the samples.
The central part of the setup is an inverted optical microscope (Nikon Eclipse TE2000-U) on an optical table floating on air. To attach optical devices, the microscope has twoside ports, one front port and two dichroic mirror turrets enabling the insertion of the lightfrom the back of the microscope. The sample is mounted on a motorized X-Y-Z stage (PriorOptiScan II) that can be precisely controlled by a joystick or from a computer program. Themicroscope is equipped with a low magnification objective (Nikon Plan Fluor 20×/0.5) and ahigh numerical-aperture long working distance water-immersion objective (Nikon NIR Apo60×/1.0w). The later is especially meant for laser tweezers manipulation, but because ofhigh numerical aperture is capable of collection a lot of light and therefore also useful for low

Materials and methods 35
intensity processes such as fluorescence. In the experiments with temperature control of thesample, the water-immersion objective is not appropriate since the water that is in contactwith the sample conducts heat and in the case of elevated temperatures also evaporatestoo quickly. In this cases a high numerical-aperture long working-distance objective withcoverglass thickness correction ring (Nikon Plan Fluor 60×/0.7) was used. On the back ofthe microscope two tweezers setups were attached, each using its own filter turret. Thelaser light from both tweezers is reflected from the dichroic mirrors to the objective, fillingits back aperture. The laser tweezers (TOU-200si, Tweezer unit, Aresis) on the top turretoperate in infrared at 1064 nm using a CW 5W Nd:YAG fiber laser (Tweez 200si, Laserunit, Aresis). In this case the used dichroic mirror reflects light with wavelength longerthan 700 nm and transmits light bellow it. The laser tweezers at the bottom turret (LTM-N2000-A, Aresis) uses a CW Ar+ ion laser (Coherent, Innova 90C-4) with wavelength of514.5 nm and 1.7W of maximum power. The dichroic mirror reflects light with wavelengthshorter than 520 nm and transmits light above it. Each laser tweezers are controlled by aseparate software (Tweez v2.1 and Tweez v2.13m, Aresis) that enables creation of multipletraps which position and strength can be controlled individually.
Figure 18: Schematics of the optical setup. The optical setup is build around an inverted microscope(center). There are three lasers (right) coupled in the microscope through different optical devicesincluding two AODs working as optical tweezers. A spectrophotometer (bottom left) used for spectralanalysis, is also coupled to the microscope. A computer (top left) controls the temperature, electricfield and the position of the sample as well as other optical devices.
In between the bottom laser-tweezers setup and the filter turret there is an additionalport with a dichroic mirror that is used for the insertion of a third laser. This port is usedfor an actively Q-switched doubled Nd:YAG laser with a pulse length of 1 ns, a maximumrepetition rate of 10 kHz and a maximum pulse energy of 10µJ (Pulselas-A-1064-500, Alpha-las). The active Q-switching enables precise triggering of laser pulses by an outside pulsegenerator with frequencies ranging from single shot up to the maximum repetition rate.At the laser output, both second harmonic (532 nm) and the remaining fundamental wave-length (1064 nm) that is not doubled, are present1. By introducing cold or hot mirror, we
1Recently also an external third harmonic generator (THG, Alphalas) was bought that can be mountedin front of the pulsed laser and can produce UV light with 355 nm wavelength.

36 Materials and methods
can send either just IR or just green laser light to the microscope. The laser is then passedthrough two Glan-Taylor polarizers. The first polarizer is aligned with the polarization ofthe laser and so just improves its polarization. The second one can be rotated such that thetransmitted intensity can be adjusted. After the polarizers, there is a adjustable Galileanbeam expander (f1 = −50mm and f2 = 100mm). By changing the distance between thetwo lenses the beam can be made either collimated or a little bit convergent or divergent. Inthe case of a collimated beam it fills the back aperture of the 60× objective and it is focusedby it to a diffraction limited spot. If the beam is divergent or convergent it is focused by theobjective outside the focal plane. In this way we can illuminate larger spot on the sample,that can be as large as 100µm by using 20× objective. To manually steer the laser beam, agimbal mirror is located in the focal point of the telescope that transfers the angle changeto the back aperture of the objective.
By using appropriate dichroic mirrors, almost any combination of the four laser beams(CW 514 nm, CW 1064 nm, pulsed 532 nm and pulsed 1064 nm) can be used simultaneouslyexcept the two IR lasers can not be used at the same time, as well as the two green laserscan not be used at the same time.
To collect light from the sample, it can be sent to either one of the side or front ports.On the right port there is a CMOS camera (PixeLINK, PLA741, 1280×960 pixels, physicalpixel size 6.7µm) enabling observation of the sample. The camera is especially suitablefor fast imaging, such as tracking of particles, but it is not sensitive enough to observelow intensity fluorescence. To the left port we attached an imaging spectrometer (Andor,Shamrock SR-500i) with the input slit positioned in the focal plane of the microscope, whichmeans that the sample is imaged onto the slit. The spectrometer is a Czerny-Turner typewith 500mm focal length. In the spectrometer there are three interchangeable diffractiongratings (300 lines/mm, 1200 lines/mm and 2400 lines/mm), all of them blazed at around500 nm. The gratings can be rotated to any position so that the appropriate spectral rangeis imaged onto the CCD. By using the 2400 lines/mm grating a maximum optical spectralresolution of 0.05 nm can be achieved. Imaging spectrometer means that the plane at theinput slit is imaged 1:1 to the output slit or CCD camera. If there will be a mirror insteadof a grating, the spectrometer would just transfer the image. Actually this can be done byrotating the grating to its zero order where it acts as a mirror and if the input slit is wideopen, the image from the microscope can actually be seen by the CCD. In normal operationthe slit is narrow (minimum width is 10µm) and the grating is rotated so that the firstdiffraction order is transmitted through the spectrometer. In this case each point on the slitis dispersed to different wavelengths by the grating. This enables the capturing of differentspectra along the slit, that means a line stretching along the sample. The spectrometer alsohas an additional input for coupling in the light from a fiber and an additional output slit.
To the spectrometer there is attached a cooled back illuminated EM-CCD camera (An-dor, Newton DU970N). It has an elongated detector with 16×16µm pixel size and 1600×200pixels, specially designed for spectroscopy. The 95% peak quantum efficiency, cooling to−85C and electron multiplication (EM) enable the sensor to have single photon sensitivity.Therefore it is especially suitable for low light applications such as fluorescence. Using fullvertical binning, spectra can be taken up to a maximum rate of 1600 per second, enablingthe study of fast processes.
Before we bought the imaging spectrometer and the EMCCD camera, two compact spec-trophotometers were used. The light was coupled out of the microscope from the front portinto an optical fiber and to the spectrophotometer. Ocean Optics USB4000 spectropho-tometer with spectral resolution of 1.5 nm and Ocean Optics Maya 2000 Pro with spectralresolution of 0.03 nm were used. Both have fixed grating and slit and are not particularysensitive to light. A small number of high resolution linewidth measurements were alsoperformed on a Raman spectrometer (LabRAM HR800, Horiba Jobin Yvone) equippedwith multi-channel, air cooled CCD detector, coupled to an optical microscope (BXFM,

Materials and methods 37
Olympus). The resolution of the spectrometer is 0.019 nm per detector pixel.
Figure 19: Photo of the optical setup. An artistic view of how the actual setup looks like in thelaboratory.
Most of the devices integrated into the optical setup are connected to the computer andcan be controlled by it. Several computer programs were written in Matlab to control thedevices. This includes the temperature control by using ITC-503 temperature controller(Oxford Instruments), digital-to-analog converter (National Instruments, NI USB-6008) forapplying electric field to the sample, CCD camera triggering, external AOD control and PriorZ stage control. Custom software was also developed for reading and analyzing spectra.
3.6 Microfluidic setup for chemical sensing
For sensing experiments, measurements of lasing on single trapped droplet were carried outwhile at the same time changing the concentration of the surfactant. The droplets wereprepared from 5CB doped with 0.1wt% Nile red. The dispersion was produced by shakingof 1ml of 4mM water solution of SDS and 10µl of dye-doped 5CB. In this solution, the5CB droplets obtain the radial configuration of the LC molecules and the SDS stabilizes thedispersion and prevents from sticking of the droplets to the walls of the microfluidic channels.A single LC droplet was observed and held in place by the IR laser tweezers through the60× water-immersion objective. Most of the other droplets were flushed out by the flow.To reduce the necessary trapping power to minimum not to heat or deform the droplet, themeasurements were performed in a blind leg of a T-shaped microfluidic channel where theflow is slower. The needed trapping power in this case was of 70mW. We were not able totrap the droplets in 3D, so they were pushed to the upper channel surface. The channels weremad manually by cutting with a knife into an already polymerized PDMS layer (Sylgard184, Dow Corning) that was attached to a glass slide to seal the channel. Three holes havebeen made in PDMS to which silicon tubes with inner diameter of 1mm were attached. Thechannels had a relatively large cross section of approximately 1mm × 1mm enabling large
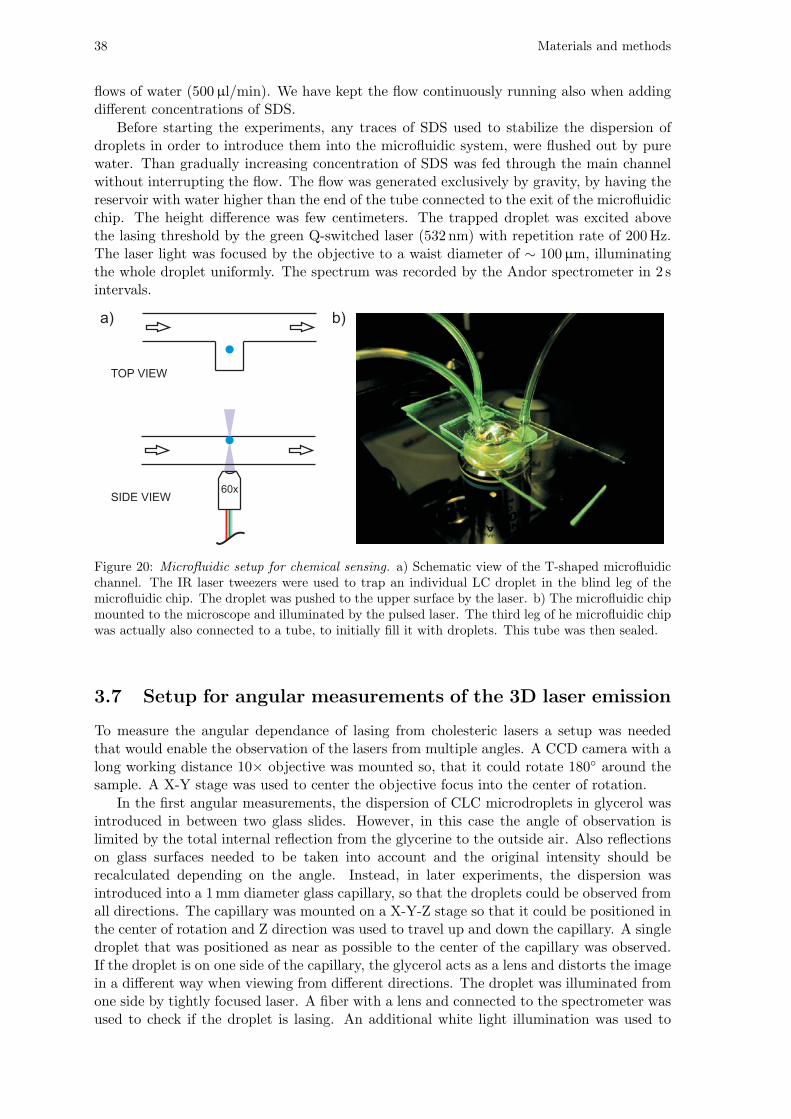
38 Materials and methods
flows of water (500µl/min). We have kept the flow continuously running also when addingdifferent concentrations of SDS.
Before starting the experiments, any traces of SDS used to stabilize the dispersion ofdroplets in order to introduce them into the microfluidic system, were flushed out by purewater. Than gradually increasing concentration of SDS was fed through the main channelwithout interrupting the flow. The flow was generated exclusively by gravity, by having thereservoir with water higher than the end of the tube connected to the exit of the microfluidicchip. The height difference was few centimeters. The trapped droplet was excited abovethe lasing threshold by the green Q-switched laser (532 nm) with repetition rate of 200Hz.The laser light was focused by the objective to a waist diameter of ∼ 100µm, illuminatingthe whole droplet uniformly. The spectrum was recorded by the Andor spectrometer in 2 sintervals.
Figure 20: Microfluidic setup for chemical sensing. a) Schematic view of the T-shaped microfluidicchannel. The IR laser tweezers were used to trap an individual LC droplet in the blind leg of themicrofluidic chip. The droplet was pushed to the upper surface by the laser. b) The microfluidic chipmounted to the microscope and illuminated by the pulsed laser. The third leg of he microfluidic chipwas actually also connected to a tube, to initially fill it with droplets. This tube was then sealed.
3.7 Setup for angular measurements of the 3D laser emission
To measure the angular dependance of lasing from cholesteric lasers a setup was neededthat would enable the observation of the lasers from multiple angles. A CCD camera with along working distance 10× objective was mounted so, that it could rotate 180 around thesample. A X-Y stage was used to center the objective focus into the center of rotation.
In the first angular measurements, the dispersion of CLC microdroplets in glycerol wasintroduced in between two glass slides. However, in this case the angle of observation islimited by the total internal reflection from the glycerine to the outside air. Also reflectionson glass surfaces needed to be taken into account and the original intensity should berecalculated depending on the angle. Instead, in later experiments, the dispersion wasintroduced into a 1mm diameter glass capillary, so that the droplets could be observed fromall directions. The capillary was mounted on a X-Y-Z stage so that it could be positioned inthe center of rotation and Z direction was used to travel up and down the capillary. A singledroplet that was positioned as near as possible to the center of the capillary was observed.If the droplet is on one side of the capillary, the glycerol acts as a lens and distorts the imagein a different way when viewing from different directions. The droplet was illuminated fromone side by tightly focused laser. A fiber with a lens and connected to the spectrometer wasused to check if the droplet is lasing. An additional white light illumination was used to

Materials and methods 39
see the droplets and to align the setup. The CCD camera was rotated around the sampleand a video was taken. The intensity of lasing was extracted from this video taken atdifferent positions around the droplet (Figure 73). Only pixels with the highest intensitycorresponding to high intensity from the center of the droplet were taken into account.
To measure the spectral dependence of lasing, the optical fiber that has been used tocheck if the droplet was lasing, was placed instead of the camera and rotated around thesample. With the fiber we were not able to accurately measure the intensity, since with thefiber it is no possible to actually see the droplets and to align it perfectly. Also with thecamera, if the image of the droplet moves across the image while rotating the camera, theintensity can still be extracted. In the case of the fiber the image of the droplet should bealways exactly centered to the fiber. Even though the measured intensity with the fiber wasnot constant, the spectral position of the laser line could be easily extracted from the data.
Figure 21: Experimental setup for angle dependence measurements. The sample, in this case thedispersion of CLC droplets in glycerol in between two glass slides, is located in the center of theimage. From left, the sample is illuminated by a green pulse laser. The light from the sample is thancaptured by a fixed fiber (top left) and a rotating CCD camera (top right). A white light illuminationsource is also used (bottom left).
3.8 Setup for 3D laser polarization measurements
Polarization of the light emitted from the CLC microlasers was also investigated. The setupshould be able to measure if the light is linearly, circularly or elliptically polarized. Thesample was illuminated by circulary polarized light from the doubled Nd:YAG pulsed laserby inserting a quarter-wave plate. To measure linear polarization of the light emitted froma single 3D laser, a polarizer is inserted between the sample and the detector. If the lightis linearly polarized there will be a modulation of light intensity on the detector, when thepolarizer is rotated. To measure circular polarization a broadband quarter-wave plate wasinserted in between the sample and the polarizer and the intensity is again measured as
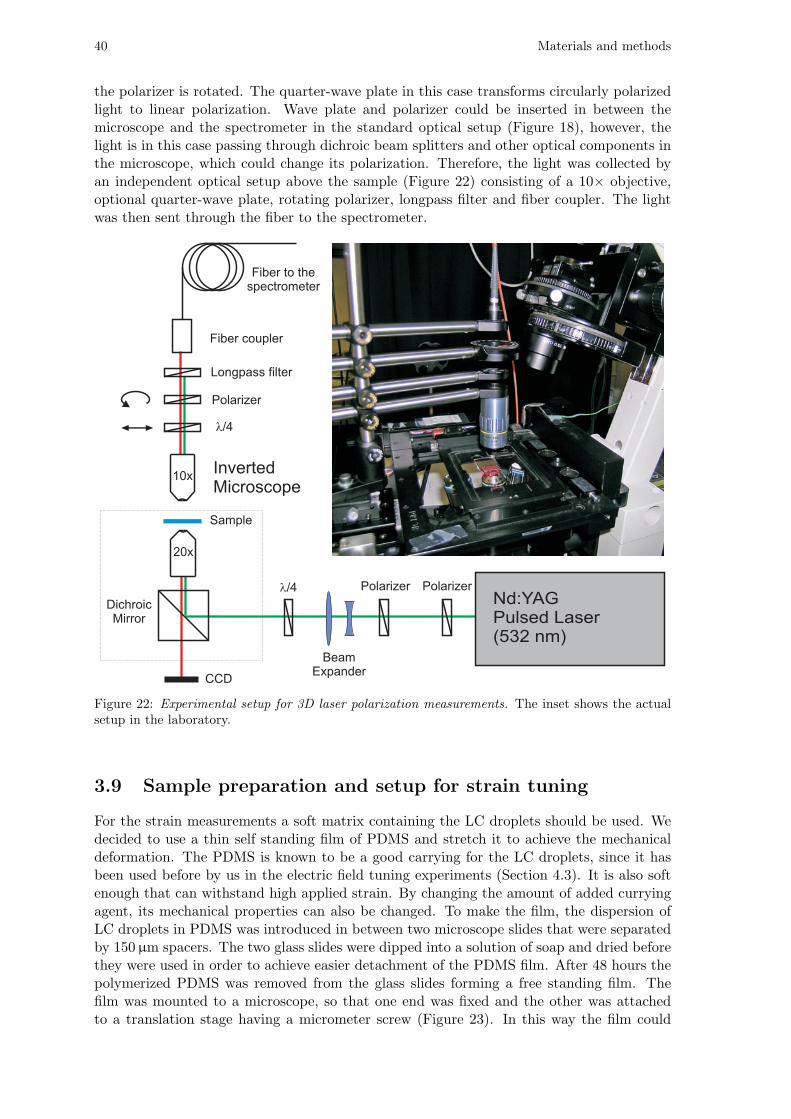
40 Materials and methods
the polarizer is rotated. The quarter-wave plate in this case transforms circularly polarizedlight to linear polarization. Wave plate and polarizer could be inserted in between themicroscope and the spectrometer in the standard optical setup (Figure 18), however, thelight is in this case passing through dichroic beam splitters and other optical components inthe microscope, which could change its polarization. Therefore, the light was collected byan independent optical setup above the sample (Figure 22) consisting of a 10× objective,optional quarter-wave plate, rotating polarizer, longpass filter and fiber coupler. The lightwas then sent through the fiber to the spectrometer.
Figure 22: Experimental setup for 3D laser polarization measurements. The inset shows the actualsetup in the laboratory.
3.9 Sample preparation and setup for strain tuning
For the strain measurements a soft matrix containing the LC droplets should be used. Wedecided to use a thin self standing film of PDMS and stretch it to achieve the mechanicaldeformation. The PDMS is known to be a good carrying for the LC droplets, since it hasbeen used before by us in the electric field tuning experiments (Section 4.3). It is also softenough that can withstand high applied strain. By changing the amount of added curryingagent, its mechanical properties can also be changed. To make the film, the dispersion ofLC droplets in PDMS was introduced in between two microscope slides that were separatedby 150µm spacers. The two glass slides were dipped into a solution of soap and dried beforethey were used in order to achieve easier detachment of the PDMS film. After 48 hours thepolymerized PDMS was removed from the glass slides forming a free standing film. Thefilm was mounted to a microscope, so that one end was fixed and the other was attachedto a translation stage having a micrometer screw (Figure 23). In this way the film could

Materials and methods 41
be manually stretched with 10µm precision. The Ar+ laser was used to illuminate a singledroplet near its rim. The film was stretched in small steps and each time the spectrum wasrecorded. Every time when strain was increased, the droplet moved out of the center of theimage and the laser was not illuminating it any more. So the droplet had to be repositionedto the original location by using the motorized X-Y microscope stage.
Figure 23: Experimental setup for strain tuning measurements. a) A 150µm thick free standingPDMS film containing the LC droplets is glued to two metal holders. The right holder is attachedto a micrometer screw that allows precise stretching of the film. b) A closer view of the film.
3.10 Sample preparation for electric field tuning
For electric field tuning experiments, a dispersion of E12 was prepared in PDMS, which wasthen polymerized. When applying electric field it is important, that the droplets are fixedand do not deform or move under the action of the field. Therefore, a solid matrix was used.As a material E12 was chosen because it had the highest birefringence among the availableLCs in the lab, therefore enabling the highest tunability. The E12 LC was doped withSPP-106, the only LC soluble dye, that did not diffuse in to the surrounding PDMS andwas available in the laboratory. Later, a number of different fluorescent dyes were found tobe suitable for this purpose (Nile red, BASF Lumogen dyes, DCM, etc.). The LC dropletswere prepared by method described in Section 3.4. The dispersion was then introduced inbetween two glass slides covered with a thin indium-tin-oxide (ITO) layer, serving as anelectrode. The electrodes were in the interior and the cell thickness was controlled by 20µmpolymer spacers. A single droplet was observed using the inverted microscope by the 60×objective, illuminated by the argon laser and the spectra was analyzed by a spectrometer.While measuring the spectrum, a sinusoidal electric voltage with the frequency of 50 kHzwas applied to the ITO electrodes. The corresponding electric field in the cell was up to2.6VRMS/µm. The voltage amplitude was controlled using the digital-to-analog converter,that was used as a external modulation connected to a function generator. A 10× amplifierwas used in between the function generator and the sample.
3.11 Preparation of cholesteric 3D lasers
For 3D Bragg lasers, a mixture of a nematic LC and a chiral dopant was needed with thepitch in the range of 400 nm producing photonic bandgap in red part of the spectrum. Afluorescent dye dissolved in the CLC mixture was used as an active material. Two differentdye-doped cholesteric liquid-crystal mixtures were used. The low birefringence mixture wasprepared using MLC-7023 liquid crystal with 25.5wt% S-811 chiral dopant and 0.2wt% Nilered fluorescent dye. The high birefringence mixture was prepared using MLC-2132 liquidcrystal with 26wt% S-811 chiral dopant and 0.5wt% DCM fluorescent dye. In both cases the

42 Materials and methods
dye concentration was near saturation. The concentration of the chiral dopant was chosenso, that the longer wavelength edge of the cholesteric photonic bandgap overlapped withthe emission maximum of the fluorescent dye. To test this, the position of the photonicbandgap was determined by measuring the spectrum of white light reflected from a 30-µm-thick planar cell containing the mixture.
The dispersion of droplets in glycerol was prepared by method described in Section3.4. The dispersion was introduced in between two glass slides separated by approximately150µm. As single droplet was observed and illuminated by a pulsed laser through the 20×objective. The actively Q-switched doubled Nd:YAG laser with a pulse length of 1 ns, at therepetition rate of 200Hz and a maximum pulse energy of 10µJ was used as the excitationsource. It was focused through the same objective to a waist diameter of ∼ 100µm.

43
4 Experimental results and discussion
4.1 Dispersion of liquid-crystal droplets
To make the LC microcavities the most important step is to be able to produce nice sphericalLC droplets in a carrying material. We have tried different methods known from the prepa-ration of PDLCs [45,46]. Most of these procedures are based on phase separation of initiallyhomogenous mixture of a LC and a polymer. The droplets formed by phase separation areusually quite small (∼ 1µm), of irregular shape and very dense. None of this is good forour purposes. Therefore we used a very simple procedure of mechanical mixing of a LC andnon-miscible fluid. Figure 24 shows a dispersion of E12 droplets in PDMS under crossespolarizers. The droplets are polydispersed, with sizes ranging from 1µm to 50µm. Becauseof surface tension they have almost perfect spherical shape and smooth surface (Figure 25a).PDMS gives homeotropic anchoring so that the molecules are perpendicular to the dropletsurface. The director configuration is radial, that means, that the director is pointing inthe radial direction in every point of the droplet volume (Figure 25c) inducing splay elasticdistortion [38]. The exception is the center of the droplet where a point topological defectappears, called radial hedgehog defect [93]. It can be seen as a black spot in the center ofthe droplet (Figure 25a). The radial structure can be also observed under crossed polarizerswhere we can see the typical dark cross (Figure 25b). To further confirm the structure,fluorescence confocal polarizing microscopy (FCPM) [94] images of the droplets were taken.The droplets contained Nile red dye, which molecules orient in the direction of the director,so that the excitation and emission of light is the highest along the director. In Figure 25dwe can clearly see the radial orientation of the molecules.
Figure 24: Dispersion of E12 droplets in PDMS under crossed polarizers. The colors of the dropletsare caused by the interference of ordinary and extraordinary ray and is dependent on the birefringenceand the size of the droplet. Scale bar 20µm.

44 Experimental results and discussion
Similar dispersion can also be readily formed in water solution of SDS. The appearanceof the droplets is identical as when using PDMS. The difference is that after waiting 48 hoursthe PDMS polymerizes and fixes the position of the droplets. The appearance of the dropletsas well as the WGMs did not change much after polymerization. However, after few daysafter polymerization, the WGMs were not visible any more in most of the droplets, but theappearance of the droplets did not change. This did not happen in non-polymerized PDMS(no curing agent added) and the WGMs were visible also in several months old samples.
Figure 25: Radial NLC droplet. a) Micrograph of a 15µm droplet of nematic liquid crystal E12 inPDMS. b) The same droplet under crossed polarizers. c) Structure of the director field inside themicrodroplet, deduced from b). The lines (i.e. director field) present the direction of orientationof LC molecules. d) A FCPM slice through the center of the droplet. The excitation and emissionpolarization is vertical.
An important part in using LC WGM microcavities for applications is not just theability to make nice droplets, but also to be able to place them in precisely determinedpositions to couple them with other optical components. In the case of LC droplets they arefloating in a liquid medium and can be moved and assembled to complex structures by usinglaser tweezers (Figure 26). If a polymerizable carrying fluid is used, for example PDMS,the structure can be assembled and then the fluid is polymerized fixing the position of thedroplets. In PDMS it is however quite difficult to move the droplets because of very highviscosity and assembly takes a lot of time. Also the surface separation between the dropletscan not be adjusted precisely, but fortunately the repulsive force between the surfaces of thedroplets prevents their coalescence.
Figure 26: Assembly of liquid-crystal droplets in PDMS. Before the PDMS was polymerized, thedroplets were assembled into a T-shape structure by using laser tweezers. Scale bar 5µm.
By mechanical mixing we have very limited control over droplets size. The average sizecan be partially controlled by the time and speed of mixing, however, the size distributionis quite wide. The polydispersity of the droplets is not that important for laboratory ex-periments, since we can select one droplet of a desired size and do experiments on it. Inthis case, it is important that the droplets are well separated from each other, so we canstudy individual ones. However, with low droplet density in PDMS we had some problems.The cyanobiphenyls, from which the E12 is composed, are slightly soluble in PDMS. Athigh concentrations of droplets, the PDMS gets saturated quite quickly and the droplets arenot much affected by this. However, at concentrations of LC lower than approximately 1%,some components of E12, probably the lighter ones, are transferred to the PDMS. What

Experimental results and discussion 45
is left does not have spherical shape any more and it is also not fluid any more, especiallyif heavier cyanobiphenyls are left. Interestingly, most of the droplets are transformed intobirefringent tubes (Figure 27). The walls of the tubes are made from the remainings ofthe E12 and probably still have at least partially ordered director structure, since theyshow birefringence under crossed polarizers (Figure 27c and d). This process happens quitequickly after mixing of LC into PDMS and is not affected by latter PDMS polymerization.
Figure 27: Two examples of tubes formed from E12 LC when mixed with PDMS. a) A tube from sideview and b) a tube viewed through its hole. c) and d) The same two tubes under crossed polarizers.Birefringence is clearly seen.
Figure 28: A LC shell. A 10µm melamine formaldehyde particle is positioned in the center of a LCdroplet. The outside medium is PDMS. a) The droplet in white light illumination and b) the samedroplet in crossed polarizers. Scale bar is 5µm.
Instead of using just LC to make the droplets, also hard particles can be introduced.In Figure 28 a 10µm melamine formaldehyde particle having homeotropic anchoring issitting in the middle of a droplet. The boundary conditions promote the central positionof the particle making a shell of LC of almost arbitrary thickness around the particle. Theparticle-droplet combination is made in a fairly simple way. At first a dense dispersion ofparticles is made in a LC. The dispersion is then mixed with PDMS. In the mixing process,when the droplets ar formed, some of them contain one or more particles. In the dropletscontaining just one particle, the shell thickness varies, depending how big droplet of LC isformed. Some particle are also expelled out of the LC into the PDMS. Thin shells could beinteresting because they could provide faster switching speed with the electric field, since ofsmall LC volume and small thickness. By measuring the spectra of WGMs in shells as thin

46 Experimental results and discussion
as 1.5µm we did not observe any difference in the modes of a droplet of the same size, butnot containing the particle.
4.2 Whispering-gallery modes in nematic liquid-crystal droplets
Once we were able to produce nice spherical droplets, we could introduce a fluorescentsubstance into the LC and than excite and observe the modes inside the droplets. A singledroplet was illuminated by a tightly focused 514 nm laser beam near its edge (Figure 29).A bright spot of fluorescent light was observed at the point of the laser beam as well as onthe opposite side of the droplet (Figure 30). A bright stripe is also observed in between thetwo bright spots and there is a hint of a light ring around the droplet. What is observedcan be explained by WGMs circulating inside the droplet near its surface. The fluorescentmolecules are excited at the point of the laser spot and emit light in all the directions. Someof the light gets trapped as WGMs. Just the light that circulate in planes that intersect thelaser spot are present in the droplet. What light is actually observed is dependent on thedirection of observation. We can mostly see the light that circulates in the plane along theviewing direction as the bright spot on both sides of the droplet and a stripe in between.
Figure 29: Schematic view of WGMs in a LC droplet. WGMs are excited by a focused Ar+ laser(green light illuminating the edge of the droplet). Only the light irradiating towards the microscopeobjective is detected (red cone). A TM WGM is shown, with its electric field oscillating in a radialdirection.
We observe fluorescence only inside the NLC droplets, which indicates that the dye hasnot diffused into the surrounding PDMS. In the first experiments we have used CdSe fluores-cent quantum dots (QDs) dispersed in 5CB. The QDs experience very little photobleachingand have quite bright fluorescence. However, because of elastic deformation of LC aroundthem, they tend to agglomerate in order to reduce the distortion. The clusters formed inthis way scatter light and therefore drastically lower the Q-factor. Despite this, the firstWGM observed in a LC droplet were indeed excited in dispersion of QDs in 5CB. However,this was only possible with very low concentrations of QDs and just in droplets that did notcontain larger agglomerates.
The fluorescent light from a single droplet was sent to the spectrometer and analyzed.In Figure 31 there is one example of such spectrum for a 16µm droplet. We can seethe fluorescent background, which is nearly the same as for bulk dye doped LC, with the

Experimental results and discussion 47
Figure 30: False color image of fluorescent light intensity from a LC droplet. The droplet is illumi-nated by Ar+ laser near the left edge (black cross).
maximum located in red at 580 nm. On this background there are a number of very sharpspectral peaks. They correspond to WGMs circulating near the surface of the droplet. Themodes are grouped in distinct groups, where they are almost equally spaced.
560 570 580 590 600 6100
0.5
1
1.5
2
2.5
3
Wavelength (nm)
Inte
nsity
(a.
u.)
Figure 31: Spectrum od fluorescent light captured from a LC droplet. Very sharp peaks correspondingto WGMs are observed on the broad fluorescent background. Droplet size is 16µm.
Instead of peaks at the positions of the optical modes, one would rather expect dips in thespectrum. The fluorescent molecules emit light in a broad spectrum and in all the directions.The light that matches the frequency as well as the direction of a WGM is trapped by thedroplet and because of longer optical path it is absorbed and scattered by the material. Allthe other light that does not match any mode is directly emitted from the droplet. Thereforeat the WGM frequencies we should observe dips in the spectrum. However, Purcell effect(Section 2.1.2), which makes the dye to emit more light at the resonant frequencies, has tobe taken into account.
If the light, that is sent sent to the spectrometer, is captured just from the part of thedroplet opposite to the excitation point, the spectral peaks of the WGMs are higher inrespect to the fluorescent background. This is because mostly the light that is captured asWGMs is transferred to the other side and leaks out. If we are capturing the light from thelaser excitation point, also the light that is spontaneously emitted in all the directions fromthe dye molecules is contributing to the fluorescent background.

48 Experimental results and discussion
The droplets can also be excited by using an optical fiber (Figure 32). The laser lightis coupled into the fiber and the fiber end is introduced into the dispersion of the droplets(Figure 32a). The light from the excited droplets can be collected by a microscope objective,or by the same fiber. The fluorescent light from the droplet entering the fiber is separatedfrom the excitation light by a dichroic mirror and sent to a spectrometer (Figure 32b).
Figure 32: Fiber excitation of WGMs in LC droplets. a) A multimode fiber with the core diameterof 60µm is introduced in the dispersion of LC droplets in PDMS. The fiber is positioned so, that itilluminates just one droplet. b) In the spectrum of fluorescent light that gets coupled back into thefiber we can observe the WGM peaks.
4.2.1 Polarization properties
In order to understand which modes are present in the spectrum, we first have to look at thepolarization properties. There are two possible WGMs polarizations, the TE polarizationwhere the electric field oscillates parallel to the surface of the sphere (Figure 33a) and TMpolarization where the electric filed is perpendicular to the surface (Figure 33b). For isotropicsphere both modes have the same refractive index. However, LCs are birefringent anddifferent polarizations sense different refractive indices. In the LC droplets the optical axispoints in the radial direction. Therefore, the TE modes sense the lower index, the ordinaryone (no = 1.52), and the TM modes sense the larger one, the extraordinary index (ne =1.74). The TM modes have larger index contrast to the outside medium (ns = 1.43), so weexpect them to have higher Q-factors than TE modes. In smaller droplets we expect only TMmodes to be visible, since the higher contrast. Two different indices for the two polarizationsare quite an unique feature of the LC microresonators. In isotropic microresonators thetwo polarizations are always in pairs, but in our case the two polarizations are completelyindependent and can be tuned individually by selecting the appropriate material with acertain birefringence.
Figure 33: WGM polarization schematics in LC droplets. Schematic drawing of the electric fielddirection for a) TE modes and b) TM modes. c) The yellow prolate ellipsoid represents the uniaxialdielectric tensor of the LC.

Experimental results and discussion 49
Polarization properties of light emitted from a smaller droplet, where just one set of TMmodes was visible, were analyzed. The polarization of the excitation laser was rotated toeither parallel or perpendicular to the surface of the droplet at the point of illumination byusing a λ/2 waveplate. The polarizer through which the light was sent to the spectrometeror camera was also rotated. The results are presented in Figure 34 and Figure 35 for thefour cases. It can be observed that the highest intensity we get when both the excitation ondetection polarizations coincide with the polarization of TM modes (Figure 34a).
Figure 34: WGM spectra at different polarizations. Spectra of light emitted from a 11.7µm E12droplet when the excitation and emission polarization is changed. The polarization direction is givenby the arrows. The horizontal polarization direction corresponds to TM modes. The inset in d)shows the orientation of the droplet and points of excitation and light detection.
Additionally also images of WGMs circulating in droplets were taken at different laserpolarization and analyzer rotation (Figure 35). The intensity on the images matches thespectral results (Figure 34).

50 Experimental results and discussion
Figure 35: Fluorescence images at different polarizations. Images of fluorescent light emitted froma 11.7µm E12 droplet when the excitation and emission polarization is changed. The polarizationdirection is given by the arrows. The horizontal polarization direction corresponds to TM modes.For clarity the images are inverted, so the darker color represents higher intensity. The illuminationspot is at the top of the droplets. a) The laser polarization and analyzer direction are the same andmatch the TM modes. A bright spot is observed on the other side of the droplet indicating the TMmodes circulating in the plane parallel to the direction of observation. b) When the laser polarizationis rotated the intensity is greatly reduced, since it does not match the TM modes any more. c) Ifthe laser polarization matches the TM modes, but the analyzer is perpendicular to this direction aring around the droplet is observed. These are the TM modes circulating in the plane perpendicularto the observation direction. d) An finally if both polarizations do not match the TM modes, just abright spot corresponding to fluorescence is observed at the point of laser excitation.
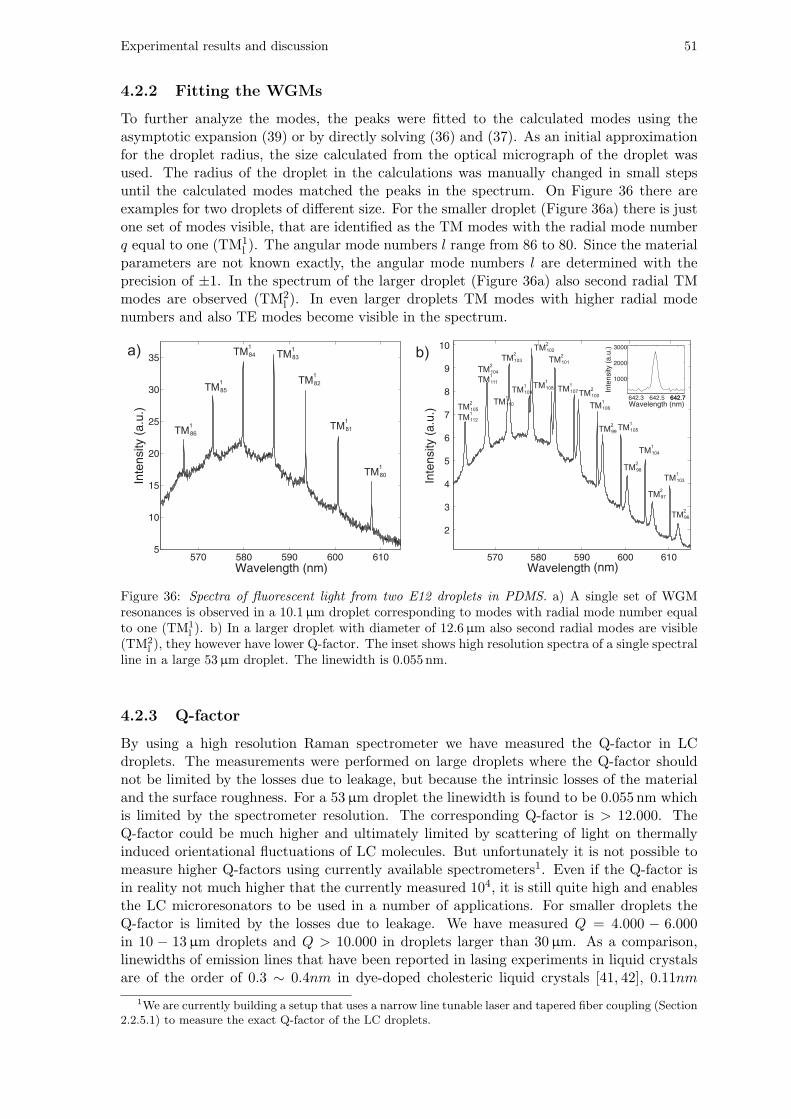
Experimental results and discussion 51
4.2.2 Fitting the WGMs
To further analyze the modes, the peaks were fitted to the calculated modes using theasymptotic expansion (39) or by directly solving (36) and (37). As an initial approximationfor the droplet radius, the size calculated from the optical micrograph of the droplet wasused. The radius of the droplet in the calculations was manually changed in small stepsuntil the calculated modes matched the peaks in the spectrum. On Figure 36 there areexamples for two droplets of different size. For the smaller droplet (Figure 36a) there is justone set of modes visible, that are identified as the TM modes with the radial mode numberq equal to one (TM1
l ). The angular mode numbers l range from 86 to 80. Since the materialparameters are not known exactly, the angular mode numbers l are determined with theprecision of ±1. In the spectrum of the larger droplet (Figure 36a) also second radial TMmodes are observed (TM2
l ). In even larger droplets TM modes with higher radial modenumbers and also TE modes become visible in the spectrum.
Figure 36: Spectra of fluorescent light from two E12 droplets in PDMS. a) A single set of WGMresonances is observed in a 10.1µm droplet corresponding to modes with radial mode number equalto one (TM1
l ). b) In a larger droplet with diameter of 12.6µm also second radial modes are visible(TM2
l ), they however have lower Q-factor. The inset shows high resolution spectra of a single spectralline in a large 53µm droplet. The linewidth is 0.055 nm.
4.2.3 Q-factor
By using a high resolution Raman spectrometer we have measured the Q-factor in LCdroplets. The measurements were performed on large droplets where the Q-factor shouldnot be limited by the losses due to leakage, but because the intrinsic losses of the materialand the surface roughness. For a 53µm droplet the linewidth is found to be 0.055 nm whichis limited by the spectrometer resolution. The corresponding Q-factor is > 12.000. TheQ-factor could be much higher and ultimately limited by scattering of light on thermallyinduced orientational fluctuations of LC molecules. But unfortunately it is not possible tomeasure higher Q-factors using currently available spectrometers1. Even if the Q-factor isin reality not much higher that the currently measured 104, it is still quite high and enablesthe LC microresonators to be used in a number of applications. For smaller droplets theQ-factor is limited by the losses due to leakage. We have measured Q = 4.000 − 6.000in 10 − 13µm droplets and Q > 10.000 in droplets larger than 30µm. As a comparison,linewidths of emission lines that have been reported in lasing experiments in liquid crystalsare of the order of 0.3 ∼ 0.4nm in dye-doped cholesteric liquid crystals [41, 42], 0.11nm
1We are currently building a setup that uses a narrow line tunable laser and tapered fiber coupling (Section2.2.5.1) to measure the exact Q-factor of the LC droplets.

52 Experimental results and discussion
in dye-doped liquid crystal blue phases [5], and 0.06nm in an order parameter optimizeddye-doped cholesteric liquid crystals (CLC) [43].
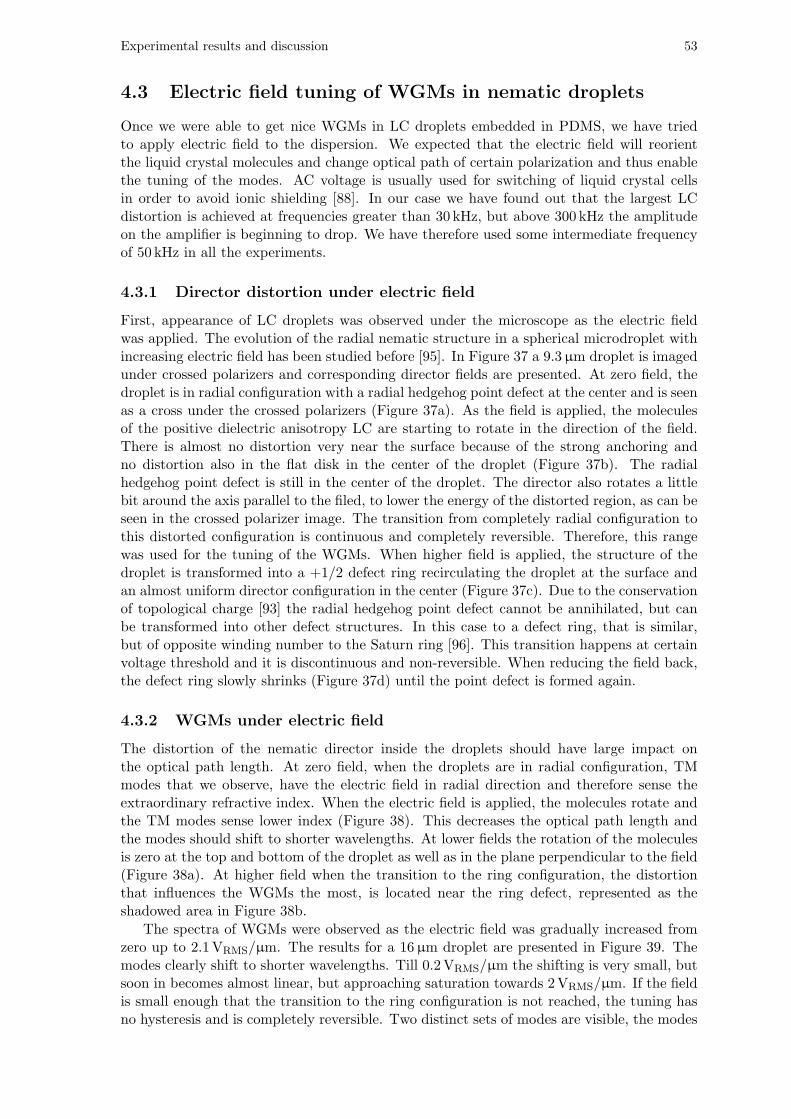
Experimental results and discussion 53
4.3 Electric field tuning of WGMs in nematic droplets
Once we were able to get nice WGMs in LC droplets embedded in PDMS, we have triedto apply electric field to the dispersion. We expected that the electric field will reorientthe liquid crystal molecules and change optical path of certain polarization and thus enablethe tuning of the modes. AC voltage is usually used for switching of liquid crystal cellsin order to avoid ionic shielding [88]. In our case we have found out that the largest LCdistortion is achieved at frequencies greater than 30 kHz, but above 300 kHz the amplitudeon the amplifier is beginning to drop. We have therefore used some intermediate frequencyof 50 kHz in all the experiments.
4.3.1 Director distortion under electric field
First, appearance of LC droplets was observed under the microscope as the electric fieldwas applied. The evolution of the radial nematic structure in a spherical microdroplet withincreasing electric field has been studied before [95]. In Figure 37 a 9.3µm droplet is imagedunder crossed polarizers and corresponding director fields are presented. At zero field, thedroplet is in radial configuration with a radial hedgehog point defect at the center and is seenas a cross under the crossed polarizers (Figure 37a). As the field is applied, the moleculesof the positive dielectric anisotropy LC are starting to rotate in the direction of the field.There is almost no distortion very near the surface because of the strong anchoring andno distortion also in the flat disk in the center of the droplet (Figure 37b). The radialhedgehog point defect is still in the center of the droplet. The director also rotates a littlebit around the axis parallel to the filed, to lower the energy of the distorted region, as can beseen in the crossed polarizer image. The transition from completely radial configuration tothis distorted configuration is continuous and completely reversible. Therefore, this rangewas used for the tuning of the WGMs. When higher field is applied, the structure of thedroplet is transformed into a +1/2 defect ring recirculating the droplet at the surface andan almost uniform director configuration in the center (Figure 37c). Due to the conservationof topological charge [93] the radial hedgehog point defect cannot be annihilated, but canbe transformed into other defect structures. In this case to a defect ring, that is similar,but of opposite winding number to the Saturn ring [96]. This transition happens at certainvoltage threshold and it is discontinuous and non-reversible. When reducing the field back,the defect ring slowly shrinks (Figure 37d) until the point defect is formed again.
4.3.2 WGMs under electric field
The distortion of the nematic director inside the droplets should have large impact onthe optical path length. At zero field, when the droplets are in radial configuration, TMmodes that we observe, have the electric field in radial direction and therefore sense theextraordinary refractive index. When the electric field is applied, the molecules rotate andthe TM modes sense lower index (Figure 38). This decreases the optical path length andthe modes should shift to shorter wavelengths. At lower fields the rotation of the moleculesis zero at the top and bottom of the droplet as well as in the plane perpendicular to the field(Figure 38a). At higher field when the transition to the ring configuration, the distortionthat influences the WGMs the most, is located near the ring defect, represented as theshadowed area in Figure 38b.
The spectra of WGMs were observed as the electric field was gradually increased fromzero up to 2.1VRMS/µm. The results for a 16µm droplet are presented in Figure 39. Themodes clearly shift to shorter wavelengths. Till 0.2VRMS/µm the shifting is very small, butsoon in becomes almost linear, but approaching saturation towards 2VRMS/µm. If the fieldis small enough that the transition to the ring configuration is not reached, the tuning hasno hysteresis and is completely reversible. Two distinct sets of modes are visible, the modes
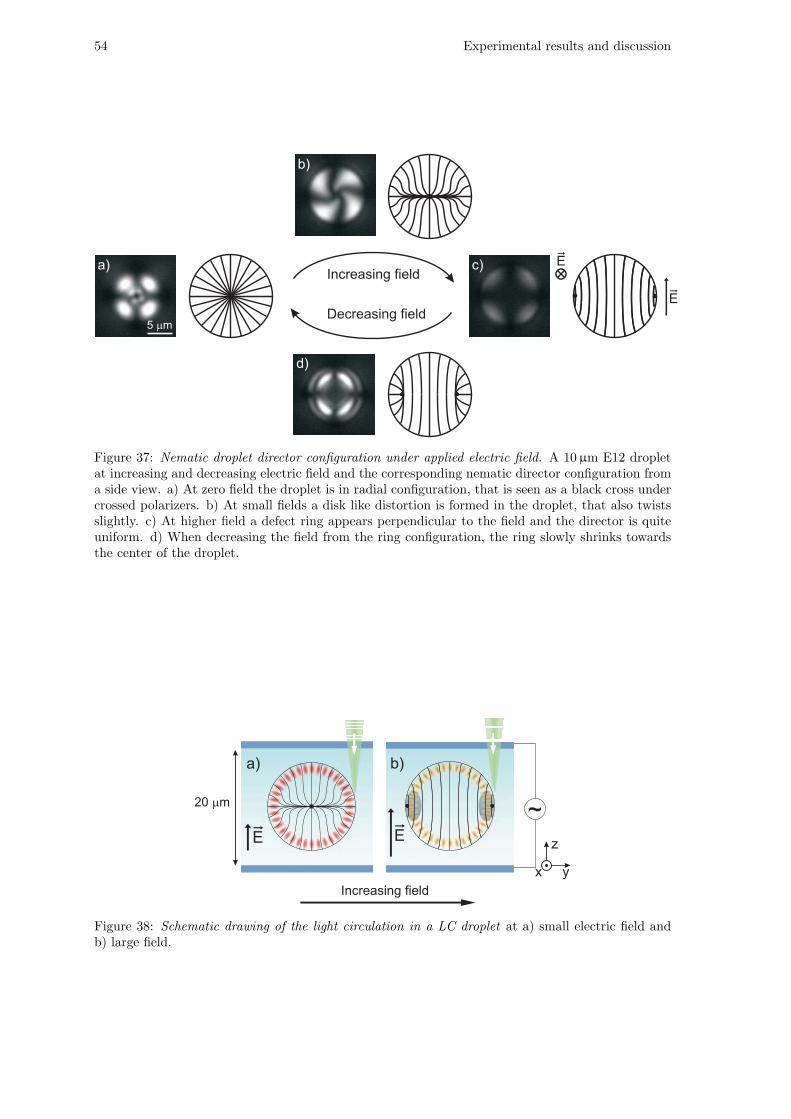
54 Experimental results and discussion
Figure 37: Nematic droplet director configuration under applied electric field. A 10µm E12 dropletat increasing and decreasing electric field and the corresponding nematic director configuration froma side view. a) At zero field the droplet is in radial configuration, that is seen as a black cross undercrossed polarizers. b) At small fields a disk like distortion is formed in the droplet, that also twistsslightly. c) At higher field a defect ring appears perpendicular to the field and the director is quiteuniform. d) When decreasing the field from the ring configuration, the ring slowly shrinks towardsthe center of the droplet.
Figure 38: Schematic drawing of the light circulation in a LC droplet at a) small electric field andb) large field.
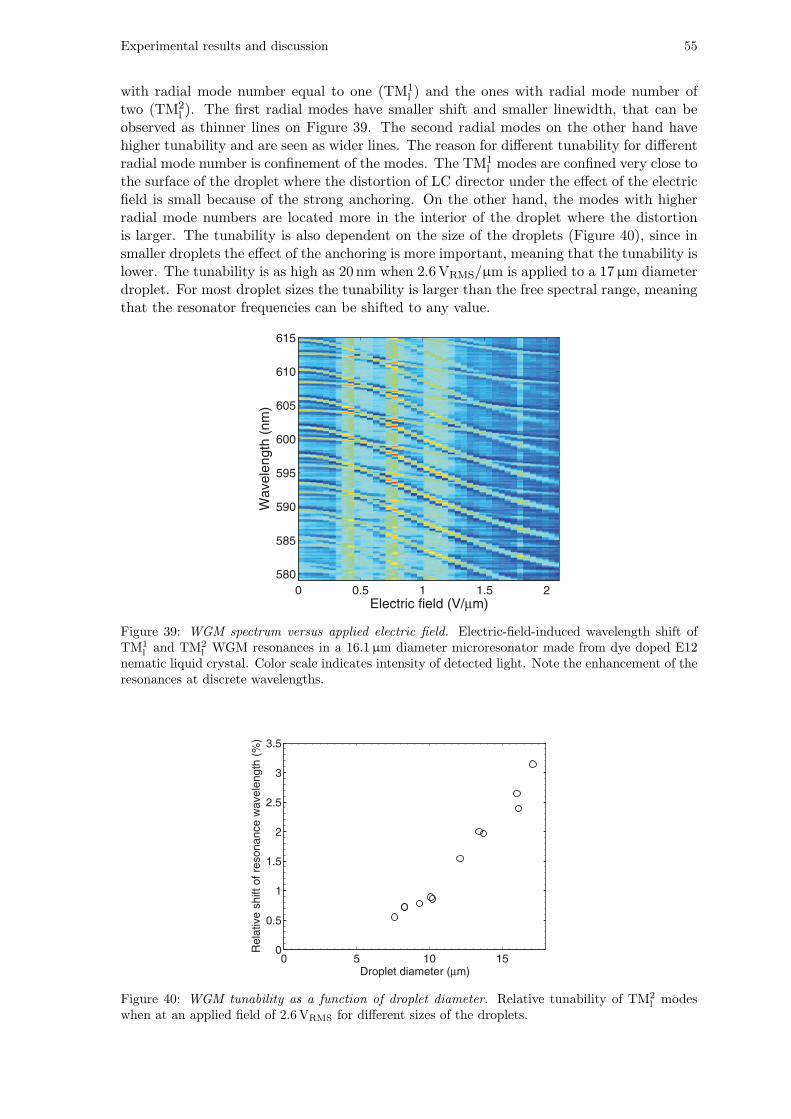
Experimental results and discussion 55
with radial mode number equal to one (TM1l ) and the ones with radial mode number of
two (TM2l ). The first radial modes have smaller shift and smaller linewidth, that can be
observed as thinner lines on Figure 39. The second radial modes on the other hand havehigher tunability and are seen as wider lines. The reason for different tunability for differentradial mode number is confinement of the modes. The TM1
l modes are confined very close tothe surface of the droplet where the distortion of LC director under the effect of the electricfield is small because of the strong anchoring. On the other hand, the modes with higherradial mode numbers are located more in the interior of the droplet where the distortionis larger. The tunability is also dependent on the size of the droplets (Figure 40), since insmaller droplets the effect of the anchoring is more important, meaning that the tunability islower. The tunability is as high as 20 nm when 2.6VRMS/µm is applied to a 17µm diameterdroplet. For most droplet sizes the tunability is larger than the free spectral range, meaningthat the resonator frequencies can be shifted to any value.
Figure 39: WGM spectrum versus applied electric field. Electric-field-induced wavelength shift ofTM1
l and TM2l WGM resonances in a 16.1µm diameter microresonator made from dye doped E12
nematic liquid crystal. Color scale indicates intensity of detected light. Note the enhancement of theresonances at discrete wavelengths.
Figure 40: WGM tunability as a function of droplet diameter. Relative tunability of TM2l modes
when at an applied field of 2.6VRMS for different sizes of the droplets.
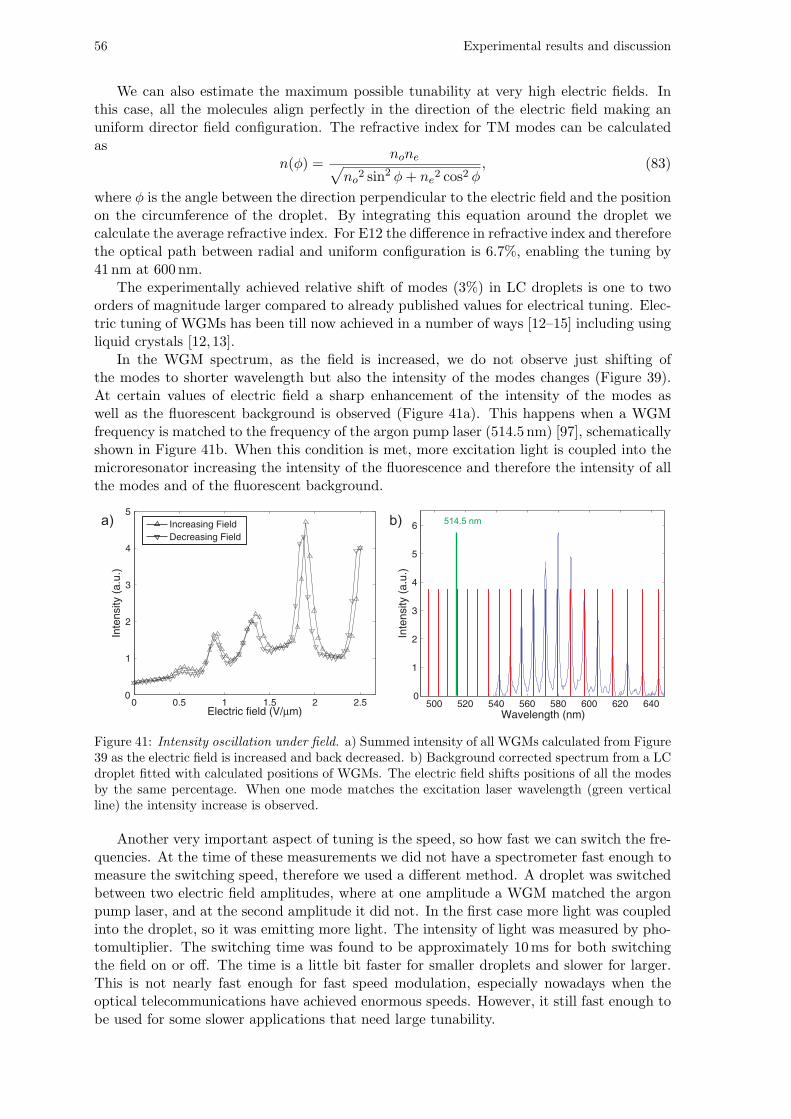
56 Experimental results and discussion
We can also estimate the maximum possible tunability at very high electric fields. Inthis case, all the molecules align perfectly in the direction of the electric field making anuniform director field configuration. The refractive index for TM modes can be calculatedas
n(ϕ) =none√
no2 sin2 ϕ+ ne2 cos2 ϕ
, (83)
where ϕ is the angle between the direction perpendicular to the electric field and the positionon the circumference of the droplet. By integrating this equation around the droplet wecalculate the average refractive index. For E12 the difference in refractive index and thereforethe optical path between radial and uniform configuration is 6.7%, enabling the tuning by41 nm at 600 nm.
The experimentally achieved relative shift of modes (3%) in LC droplets is one to twoorders of magnitude larger compared to already published values for electrical tuning. Elec-tric tuning of WGMs has been till now achieved in a number of ways [12–15] including usingliquid crystals [12,13].
In the WGM spectrum, as the field is increased, we do not observe just shifting ofthe modes to shorter wavelength but also the intensity of the modes changes (Figure 39).At certain values of electric field a sharp enhancement of the intensity of the modes aswell as the fluorescent background is observed (Figure 41a). This happens when a WGMfrequency is matched to the frequency of the argon pump laser (514.5 nm) [97], schematicallyshown in Figure 41b. When this condition is met, more excitation light is coupled into themicroresonator increasing the intensity of the fluorescence and therefore the intensity of allthe modes and of the fluorescent background.
Figure 41: Intensity oscillation under field. a) Summed intensity of all WGMs calculated from Figure39 as the electric field is increased and back decreased. b) Background corrected spectrum from a LCdroplet fitted with calculated positions of WGMs. The electric field shifts positions of all the modesby the same percentage. When one mode matches the excitation laser wavelength (green verticalline) the intensity increase is observed.
Another very important aspect of tuning is the speed, so how fast we can switch the fre-quencies. At the time of these measurements we did not have a spectrometer fast enough tomeasure the switching speed, therefore we used a different method. A droplet was switchedbetween two electric field amplitudes, where at one amplitude a WGM matched the argonpump laser, and at the second amplitude it did not. In the first case more light was coupledinto the droplet, so it was emitting more light. The intensity of light was measured by pho-tomultiplier. The switching time was found to be approximately 10ms for both switchingthe field on or off. The time is a little bit faster for smaller droplets and slower for larger.This is not nearly fast enough for fast speed modulation, especially nowadays when theoptical telecommunications have achieved enormous speeds. However, it still fast enough tobe used for some slower applications that need large tunability.

Experimental results and discussion 57
4.3.3 Tuning of multiple droplets
In Section 4.1 we have shown that the droplets can be assembled into structures so that theyare positioned close to each other. The coupling between the LC microcavities enables thelight to be transferred from one to the other. However, for the process to be effective, thefrequencies of two neighboring microcavities should match precisely. The frequencies can bematched already when manufacturing the microcavities, but in the case of LC droplets thisis not possible, since they are made just by mechanical mixing and are very polydispersed.However, the LC microcavities are tunable. If we have two droplets of different size, theirtunability is also different, and when increasing the electric field, at one point, the modefrequencies match (Figure 42). At that point, the light in the two droplets is coupled andcan be transferred from one to the other. However, this works just for two droplets, withthree or more, we can not achieve frequency matching. In this case, more electrodes shouldbe made so that each droplet could be addressed and tuned independently.
Figure 42: Tunability of two droplets. Positions of WGMs in two separated LC microdroplets ofdifferent size as the electric field is increased. Droplet 1 has the diameter of 7.8µm and droplet 2has the diameter of 12.8µm.
4.3.4 In-plane electric field
To confirm and better understand the results of electric field tunability, we also used in-planeelectric field. A gap of 60µm was etched into ITO that was used as an electrode. Voltageof 70VRMS was applied between the electrodes and the droplets in the gap were observedunder optical microscope and the spectra of WGMs was measured. The electric field inbetween the electrodes is not uniform, but still good enough to see its effects and make goodestimations of tunability. When applying electric filed, we clearly see that the distortion ofthe director field (Figure 43) matches the configuration shown in Figure 37b. However, thefield is not strong enough to induce the configuration with the ring in the droplet (Figure37c).
The WGMs were measured in two orthogonal directions, perpendicular to the electricfield (Figure 44a) and parallel to the field (Figure 44b). This was simply achieved by selectingthe appropriate laser excitation point. The positions of one mode in the perpendicular andin the parallel direction as the amplitude of the electric field is increases are shown in Figure44c. In the disc through the center of the droplet, perpendicular to the field, there is noreorientation of the LC molecules, since they point all the time perpendicular to the electricfield. Therefore, in the perpendicular direction the modes do not shift considerably. In the

58 Experimental results and discussion
Figure 43: Images of a droplet with in-plane field. The electric field is applied in the directionperpendicular to the direction of viewing. A clear distortion is visible with a non-distorted disc inthe center.
other direction the situation is the same as with planar electrodes (Figure 38a). The modeshift is of 0.9 nm, which is however considerably less than we get with planar electrodes atsimilar electric fields and size of the droplet. The difference can probably be explained bythe non-uniformity of the electric field between the electrodes. The droplet was not in thecenter between the electrodes and it was also at a vertical distance from the electrodes thatis comparable to the gap distance. Because the droplet is embedded in polymerized PDMS,we did not observe any geometrical deformation, so that the tuning is purely caused bydirector reorientation and therefore the change in the refractive index.
Figure 44: Tunability with in-plane field. Scheme of the WGMs circulating in a plane a) perpendicularto the electric field and b) parallel to the filed. The green cross represents the point of the excitationlaser. c) Position of a WGM in a 17µm diameter droplet for the two directions as the electric fieldis increased up to 1.1V/µm.
4.3.5 Electric field with droplets containing particles
We have shown in Section 4.1 that droplets containing microparticles can be produced easily.We have tried to apply electric field to them. If there is just one particle in the center of thedroplet, by applying electric field, it does not move or change in other way the propertiesof the droplet. But if there are two particles in the droplet, when applying electric field,they move to the surface (Figure 45). This can be useful for selecting modes with different
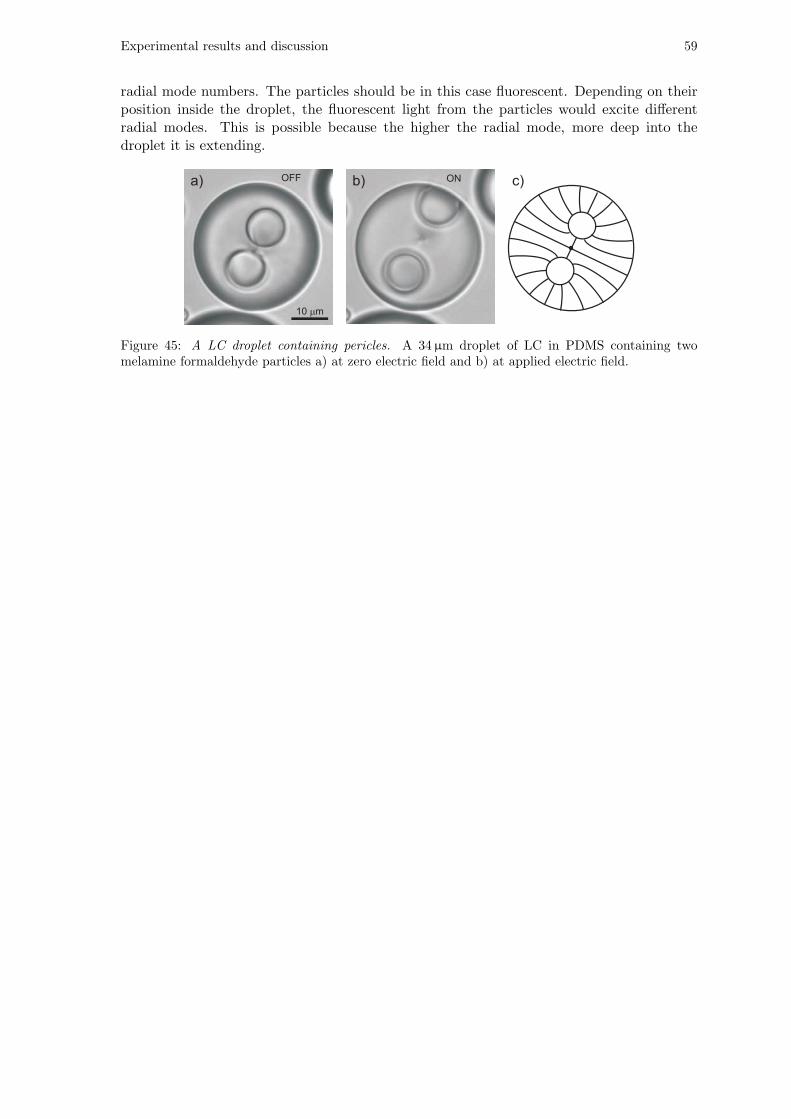
Experimental results and discussion 59
radial mode numbers. The particles should be in this case fluorescent. Depending on theirposition inside the droplet, the fluorescent light from the particles would excite differentradial modes. This is possible because the higher the radial mode, more deep into thedroplet it is extending.
Figure 45: A LC droplet containing pericles. A 34µm droplet of LC in PDMS containing twomelamine formaldehyde particles a) at zero electric field and b) at applied electric field.

60 Experimental results and discussion

Experimental results and discussion 61
4.4 Temperature tuning
WGMs from a E12 droplet in 20mM SDS solution in water were studied as temperaturewas increased from room temperature to above the clearing point of the LC. Spectrum fora 24µm droplet as a function of temperature is presented in Figure 46. Several distinctspectral lines are observed, which shift at different rates and in different directions. Thereare six sets of modes with different polarization and radial mode number: TM1
l , TM2l ,
TM3l , TM4
l , TE1l and TE2
l . The TM modes shift to shorter wavelengths, while the TEmodes shift to longer wavelengths. The TM polarization is associated with extraordinaryrefractive index, which decreases with temperature and the TE polarization is associatedwith ordinary refractive index, which on the other hand increases with temperature. Thisagrees with the negative shift of TM WGMs and positive shift of TE WGMs. The shift isalmost proportional to the change of the refractive index and qualitatively matches with theplot of refractive index change (Figure 15).
Figure 46: Temperature tunability of WGMs. Positions of the optical modes in a 24µm diameterE12 droplet as the temperature is increased.
Figure 47 shows the calculated positions of the modes for a 24µm E12 droplet as thetemperature is increased. The refractive index was calculated using (74) and (75). Refractiveindex was than used in (39) to calculate the positions of the WGM modes. The calculationsagree well with the experimental data.
Both in the experiment and in the calculations the modes with different radial modenumbers have slightly different tunability. The WGMs with higher radial mode numbersshift less that the WGMs with lower. We believe that the reason for this is the lowerconfinement of higher modes. That means that for modes with higher radial mode numbera larger part of the total optical electric field of the mode is outside the droplet. This part is

62 Experimental results and discussion
Figure 47: Calculation of temperature tunability of WGMs (large droplet). Calculated positions ofsix different WGMs in a 24µm E12 droplet.
Figure 48: Calculation of temperature tunability of WGMs (small droplet). Calculated positions ofsix different WGMs in a 5µm E12 droplet.
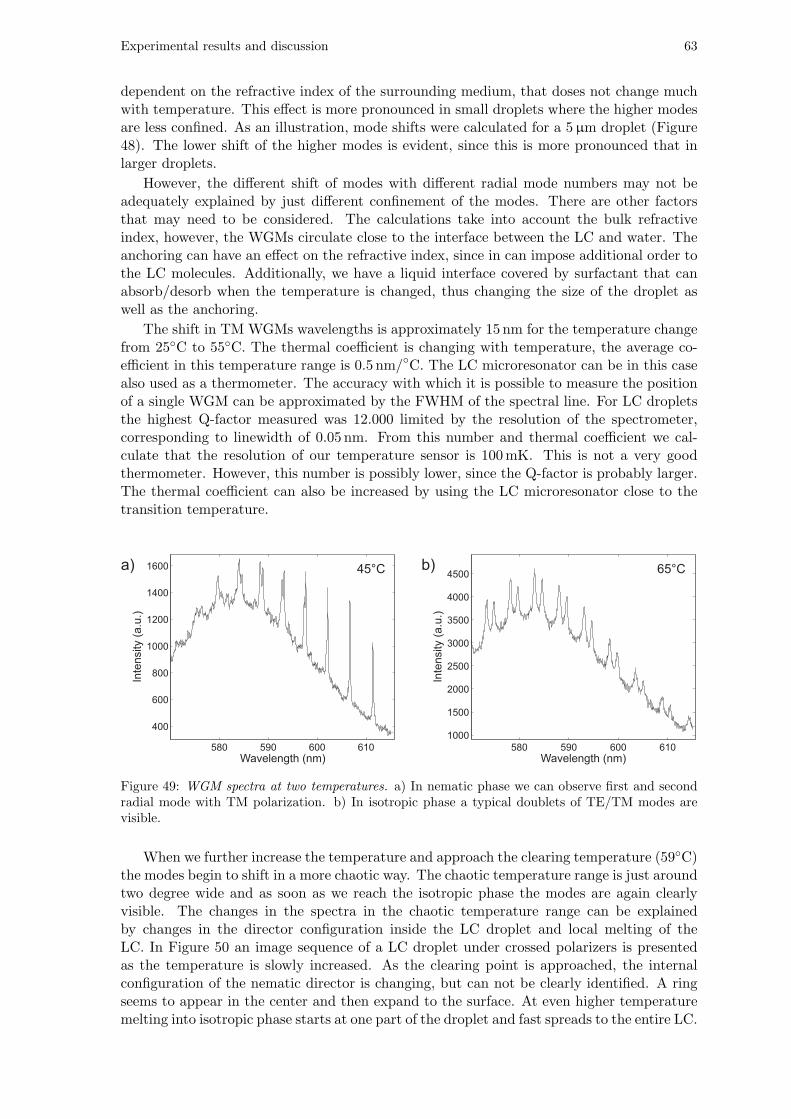
Experimental results and discussion 63
dependent on the refractive index of the surrounding medium, that doses not change muchwith temperature. This effect is more pronounced in small droplets where the higher modesare less confined. As an illustration, mode shifts were calculated for a 5µm droplet (Figure48). The lower shift of the higher modes is evident, since this is more pronounced that inlarger droplets.
However, the different shift of modes with different radial mode numbers may not beadequately explained by just different confinement of the modes. There are other factorsthat may need to be considered. The calculations take into account the bulk refractiveindex, however, the WGMs circulate close to the interface between the LC and water. Theanchoring can have an effect on the refractive index, since in can impose additional order tothe LC molecules. Additionally, we have a liquid interface covered by surfactant that canabsorb/desorb when the temperature is changed, thus changing the size of the droplet aswell as the anchoring.
The shift in TM WGMs wavelengths is approximately 15 nm for the temperature changefrom 25C to 55C. The thermal coefficient is changing with temperature, the average co-efficient in this temperature range is 0.5 nm/C. The LC microresonator can be in this casealso used as a thermometer. The accuracy with which it is possible to measure the positionof a single WGM can be approximated by the FWHM of the spectral line. For LC dropletsthe highest Q-factor measured was 12.000 limited by the resolution of the spectrometer,corresponding to linewidth of 0.05 nm. From this number and thermal coefficient we cal-culate that the resolution of our temperature sensor is 100mK. This is not a very goodthermometer. However, this number is possibly lower, since the Q-factor is probably larger.The thermal coefficient can also be increased by using the LC microresonator close to thetransition temperature.
Figure 49: WGM spectra at two temperatures. a) In nematic phase we can observe first and secondradial mode with TM polarization. b) In isotropic phase a typical doublets of TE/TM modes arevisible.
When we further increase the temperature and approach the clearing temperature (59C)the modes begin to shift in a more chaotic way. The chaotic temperature range is just aroundtwo degree wide and as soon as we reach the isotropic phase the modes are again clearlyvisible. The changes in the spectra in the chaotic temperature range can be explainedby changes in the director configuration inside the LC droplet and local melting of theLC. In Figure 50 an image sequence of a LC droplet under crossed polarizers is presentedas the temperature is slowly increased. As the clearing point is approached, the internalconfiguration of the nematic director is changing, but can not be clearly identified. A ringseems to appear in the center and then expand to the surface. At even higher temperaturemelting into isotropic phase starts at one part of the droplet and fast spreads to the entire LC.
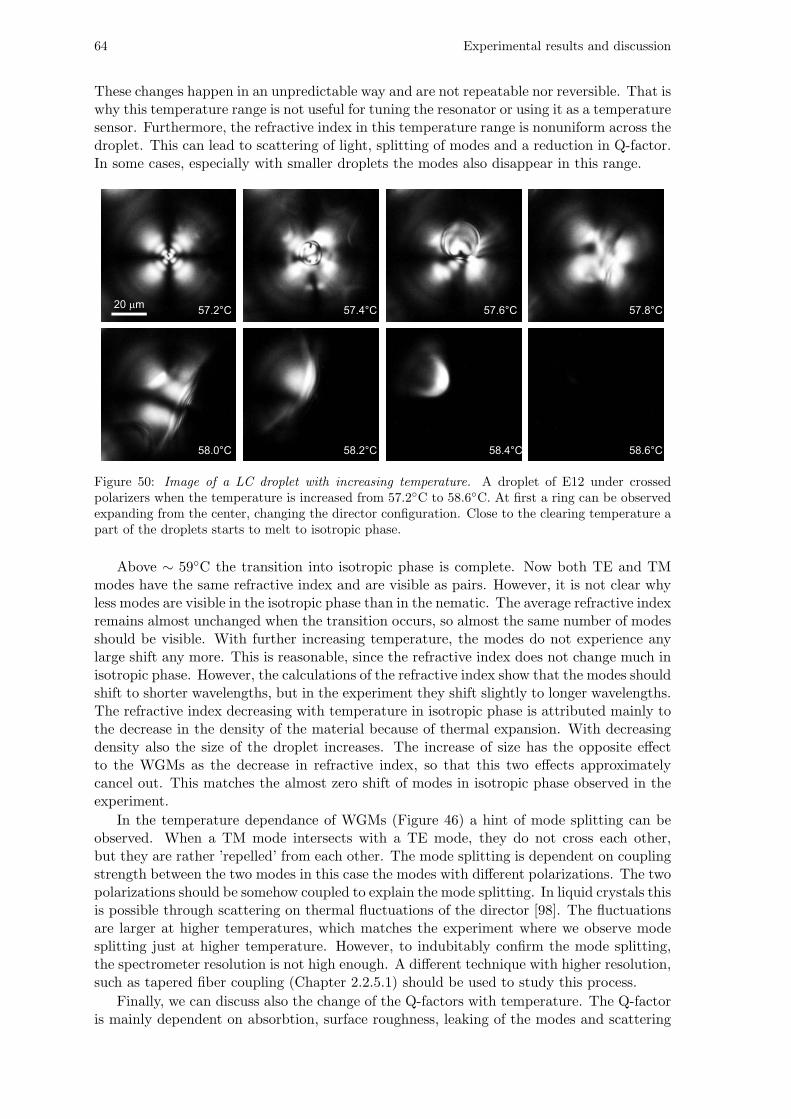
64 Experimental results and discussion
These changes happen in an unpredictable way and are not repeatable nor reversible. That iswhy this temperature range is not useful for tuning the resonator or using it as a temperaturesensor. Furthermore, the refractive index in this temperature range is nonuniform across thedroplet. This can lead to scattering of light, splitting of modes and a reduction in Q-factor.In some cases, especially with smaller droplets the modes also disappear in this range.
Figure 50: Image of a LC droplet with increasing temperature. A droplet of E12 under crossedpolarizers when the temperature is increased from 57.2C to 58.6C. At first a ring can be observedexpanding from the center, changing the director configuration. Close to the clearing temperature apart of the droplets starts to melt to isotropic phase.
Above ∼ 59C the transition into isotropic phase is complete. Now both TE and TMmodes have the same refractive index and are visible as pairs. However, it is not clear whyless modes are visible in the isotropic phase than in the nematic. The average refractive indexremains almost unchanged when the transition occurs, so almost the same number of modesshould be visible. With further increasing temperature, the modes do not experience anylarge shift any more. This is reasonable, since the refractive index does not change much inisotropic phase. However, the calculations of the refractive index show that the modes shouldshift to shorter wavelengths, but in the experiment they shift slightly to longer wavelengths.The refractive index decreasing with temperature in isotropic phase is attributed mainly tothe decrease in the density of the material because of thermal expansion. With decreasingdensity also the size of the droplet increases. The increase of size has the opposite effectto the WGMs as the decrease in refractive index, so that this two effects approximatelycancel out. This matches the almost zero shift of modes in isotropic phase observed in theexperiment.
In the temperature dependance of WGMs (Figure 46) a hint of mode splitting can beobserved. When a TM mode intersects with a TE mode, they do not cross each other,but they are rather ’repelled’ from each other. The mode splitting is dependent on couplingstrength between the two modes in this case the modes with different polarizations. The twopolarizations should be somehow coupled to explain the mode splitting. In liquid crystals thisis possible through scattering on thermal fluctuations of the director [98]. The fluctuationsare larger at higher temperatures, which matches the experiment where we observe modesplitting just at higher temperature. However, to indubitably confirm the mode splitting,the spectrometer resolution is not high enough. A different technique with higher resolution,such as tapered fiber coupling (Chapter 2.2.5.1) should be used to study this process.
Finally, we can discuss also the change of the Q-factors with temperature. The Q-factoris mainly dependent on absorbtion, surface roughness, leaking of the modes and scattering

Experimental results and discussion 65
because thermal fluctuations in LC (Section 2.1.1). Absorbtion and surface roughness arein principle not very temperature dependent. The Q-factor reduction caused by the leakingof modes because of the curvature is dependent on the size of the droplet and the refractiveindex contrast between the interior and exterior of the droplet. The refractive index of theLC changes with temperature and so does the contrast. For TM modes the index contrastdecreases with temperature, so the Q-factor should also decrease. This is indeed observedin the experiment and presented in Figure 51. At temperatures higher than 38C the TM2
l
modes become to wide and of too low intensity to measure their widths. The linewidthsof TE modes were not measured, since for them to be visible the droplet should be largeenough, but then there are a lot of TM modes present that overlap with each other andit is therefore difficult to measure the linewidhts. However, in Figure 46 it can be clearlyseen that the TE2
l mode is not visible at room temperature, but at higher temperatures isbecomes visible and narrower. The contribution to the reduction of the Q-factor becausethe scattering on thermal fluctuations is difficult to estimate. At least for the TE modes wecan say that the leaking has higher contribution than the fluctuations, since the Q-factorincreases with temperature. In general the fluctuation contribution should have almost thesame effect on all modes. At high temperature some TM modes still have narrower linewidththan the spectrometer resolution. So this contribution probably can not be measured withour spectrometer. Again, a higher resolution technique is needed also in this case (Chapter2.2.5.1).
Figure 51: Linewidth and Q-factor as a function of temperature. Spectral linewidths of two TMmodes were measured in a 16.4µm diameter droplet. Clear increase in a) linewidth or equivalentlyb) decrease of the Q-factor can be observed. To measure the linewidth, the spectral lines closest to600 nm were used.
4.5 Optical tuning
Apart from electric and temperature tuning we have also tried tuning by laser beam. Itis known that by using a powerful laser beam, a distortion in the nematic director can becreated above the optical Fredericks transition [99]. By changing the director we also changethe refractive index and so we should be able to tune the WGMs. Laser tweezers setup wasused to tightly focus the IR laser beam (1064 nm) to a droplet. The Ar-ion laser (514.5 nm)was used to excite the WGMs. The IR laser power was slowly increased up to 140mW andspectra were acquired. The results presented in Figure 52 are almost identical to the caseof temperature tuning (Figure 46). This result already suggests that the droplet is heatedby the laser beam, which consequently causes mode shifting. We tested this hypothesis byplacing two droplets at a distance of 100µm. Mode tuning was measured on both droplets,but only one droplet was illuminated by IR laser of increasing power. We have found out

66 Experimental results and discussion
that the mode shift is almost the same for both droplets. This can be explained by heattransfer through the sample. If a nearby droplet is heated, the heat is transferred also to theother droplets, that also experience the mode tuning. An additional mechanism for modeshifting could also be the mechanical deformation of the droplet by optical forces in the lasertrap. This kind of tuning was already observed in isotropic droplets [100]. In the case ofdeformation (Chapter 2.2.3) the TE and TM modes should shift in the same direction. Wehave not observed this and we believe that the deformation contribution is negligible in ourcase.
Figure 52: Optical tuning of WGMs. Positions of WGMs in a 16µm 5CB droplet as it is illuminatedby IR laser tweezers with the power increasing from 0 to 140mW.
We further confirmed the absence of optical tuning by directly observing the internalstructure of the droplet when illuminated by the laser beam (Figure 53). The droplets wereembedded in PDMS which was polymerized to fix the droplets. The focused laser beam wasthen moved across the droplet and images under crossed polarizers were taken. It can beclearly observed that we can actually move the central point defect by pushing it with thetrap. However, because of strong homeotropic anchoring, we can not change the directorconfiguration close to the edge of the droplet. The WGMs are located very close to thesurface and if the index can not be changed there, the WGMs are not affected by the laserbeam. We could of course increase the laser power, but then the thermal effects are alreadyvery large and the LC finally melts to isotropic phase.

Experimental results and discussion 67
Figure 53: Optical manipulation of the LC in a droplet. Manipulation of the director configurationin a 22µm 5CB droplet using the IR tweezers imaged under crossed polarizers. a) The laser is offand the droplet is showing typical cross. b) and c) laser trap (red cross) is moved across the dropletpushing the central defect slightly.

68 Experimental results and discussion

Experimental results and discussion 69
4.6 Strain tuning
One way of tuning the WGM microcavities is also by mechanical deformation. When strainis applied the microcavities the geometrical path of the light is changed, usually in differentway in different directions. Strain tuning has been achieved before in a number of differentgeometries and materials. Two examples are droplets of a liquid in a PDMS polymer [19] andfused silica microresonators [16]. In both cases the achieved tunability was approximately1 nm in visible light.
The shift of WGM modes was observed as the free standing PDMS film containing the5CB droplets was stretched. All the droplets in the film were in the beginning of a sphericalshape (Figure 54a) and by applying strain they deformed into prolate ellipsoids (Figure54b). To excite WGMs, an Ar+ laser was focused to the rim of the droplet on one side oflonger ellipsoid axis, so that the light was circulating in the plane parallel to the deformation(Figure 54c). After the spectrum was measured, the micrometer screw was rotated and thefilm further stretched. This caused the droplet to move towards the stretching direction,so the sample was than manually repositioned back, so that the laser beam was again inthe original position. This was repeated in small steps until the maximal strain of 15% wasachieved. In the spectra only one set of WGM modes were observed, matching the TM1
l
modes. Because of small droplet size higher radial modes did not have large Q-factor enoughto be observed. As well the TE1
l were not present since they sense the ordinary refractiveindex that is much lower than for TM modes.
The results presented in Figure 54d show position of modes from TM1114 to TM
1134 plotted
versus strain. When the strain is increased all the WGMs shift to longer wavelengths. Theshift is caused by the increase in the optical path of the light traveling around the dropletin the plane parallel to the applied strain. When the strain was increased from zero to themaximal value, the mode at 590.4 nm shifted to 622.1 nm (Figure 54d), the tunability being31.7 nm or 5.4%. Modes at other wavelengths were shifted by the same percentage.
Taking into account the applied strain we can calculate the change in the circumferenceof the droplet. We have measured the actual major and minor axes of the droplet usingoptical micrographs (Figure 54a and b). The diameter of the droplet before the appliedstrain was 14.4µm. After the strain the axes were 13.2µm and 16.9µm corresponding to arelative change of −6.4% and 15.8%. The major axis length change agrees with the appliedstrain of 15.1%. The initial circumference of the droplet was 90.2µm. After the stretchingthe ellipsoid circumference is calculated as
C = 4aE(ε) (84)
where
ε2 = 1−(b
a
)2
(85)
is the ellipsoid eccentricity, E is complete elliptic integral of the second kind, a is thesemi-major axis and b is semi-minor axis. The new circumference now being 94.9µm, corre-sponding to a relative change of 5.2%. This change agrees well with the actual optical modeshift of 5.4%
We know that for non-spherical shape WGM microcavities the modes with different az-imuthal mode numbers are not degenerate any more (see Section 2.2.3). Light in differentplanes of circulation travels different optical path, therefore we should observe mode split-ting. By using (44) we calculate that the mode splitting at 15.1% strain should be equal to0.65 nm. However, no mode splitting is observed in the experiments. The reason for this isthe use of an old spectrometer with the resolution of 1.5 nm, which is clearly not enough forthe discrimination of single modes. By using tightly focused laser as a illumination, probablyjust few modes near the illumination spot were excited, corresponding to different azimuthalmode numbers. These modes were measured by the spectrometer as a single broader line.

70 Experimental results and discussion
Figure 54: Images and WGM positions of a LC droplet under increasing strain. a) A LC droplet14.4µm in diameter embedded in PDMS polymer at 0% strain and b) at 15% strain. c) Fluorescentintensity at 7.4% strain. The droplet was illuminated by a laser near its rim at the lower part of theimage. d) Positions of the optical modes as the strain is increased.
The shift of theWGMs could be also a consequence of change in the director configurationin the droplet. The mechanical deformation of the droplet could induce significant changes inthe director configuration. This would change the refractive index and additionally modifythe optical path for the circulating light. However, in the experiment we can not see anychange of the texture under crossed polarizers. The director field is just stretched as ifthe droplet was solid. The magnitude of the tuning also well matches to just mechanicaldeformation. Therefore, we are confident that the tuning of WGMs is purely caused byphysical length change of the light path. One could now ask, why not to use just an droplet ofisotropic liquid, since the tuning would be the same. There are several advantages in using aLC droplet. First of all, the TE and TM modes are dependent on different refractive indices,the ordinary and extraordinary and are therefore decoupled. By choosing the right indiceswe can change the free spectral range and positions of both polarization individually. If oneindex is much higher than the other one, just one polarization can have the Q-factor largeenough to be visible. In this case the mode structure in the droplet simplifies considerably.This is indeed the case in our experiments. Furthermore, by using LC microresonators wecan at the same time tune the modes also by temperature and electric field.

Experimental results and discussion 71
4.7 Chemical sensors based on WGMs in LC droplets
The idea was to combine two chemical sensing methods, the fist one based on anchoring ofliquid crystals (Section 1.3.3) and the second, sensing by using WGM (Section 1.1.2). Adye doped nematic droplet is used as a sensor. In this case, a molecule attaching to theresonator does not change the index of refraction only because its dielectric properties, buthas an long range effect on other LC molecules. It reorients the LC molecules thus causing achange in the index of refraction of a large area on the resonator surface. A single moleculecould in this way shift the resonance peak much more that with the existing WGM sensors.
Figure 55: Artist impression of a WGM LC chemical sensor. A LC droplet is floating in a solutionof surfactant molecules that are adsorbed on the surface and change the LC anchoring. A laser isused to excite the WGMs in the droplet through which the changes in molecular orientation ca bedetected.
4.7.1 LC droplets at different surfactant concentrations
Before we have started measuring the optical modes inside LC droplets for sensing purposes,we have first repeated previously published results on director configuration in the dropletsat different surfactant concentrations [65]. We have studied the same combination of liquidcrystal (5CB) and surfactant (SDS) since it is a well known system. We have observedLC droplets under the microscope under different concentrations of SDS, ranging from 0 to2mM. In these experiments the microfluidic device was not used, but instead dispersionsof different concentrations were prepared, filled in between two clean glasses and sealed.In Figure 56 there are the proposed nematic director configurations in droplets (Figure56a), bright field (Figure 56b) and crossed polarizers (Figure 56c) images of selected 17µm5CB droplets at increasing SDS concentrations. In pure water the anchoring is planar andthe structure should be bipolar with two surface boojums at the two ends. However, thetwo boojums are rarely observed in the experiment, probably because the anchoring is notperfectly planar, because of impurities in water. If we add for example 5% PVA to the water,strong planar anchoring is achieved, and the two boojums are clearly visible. However, in our
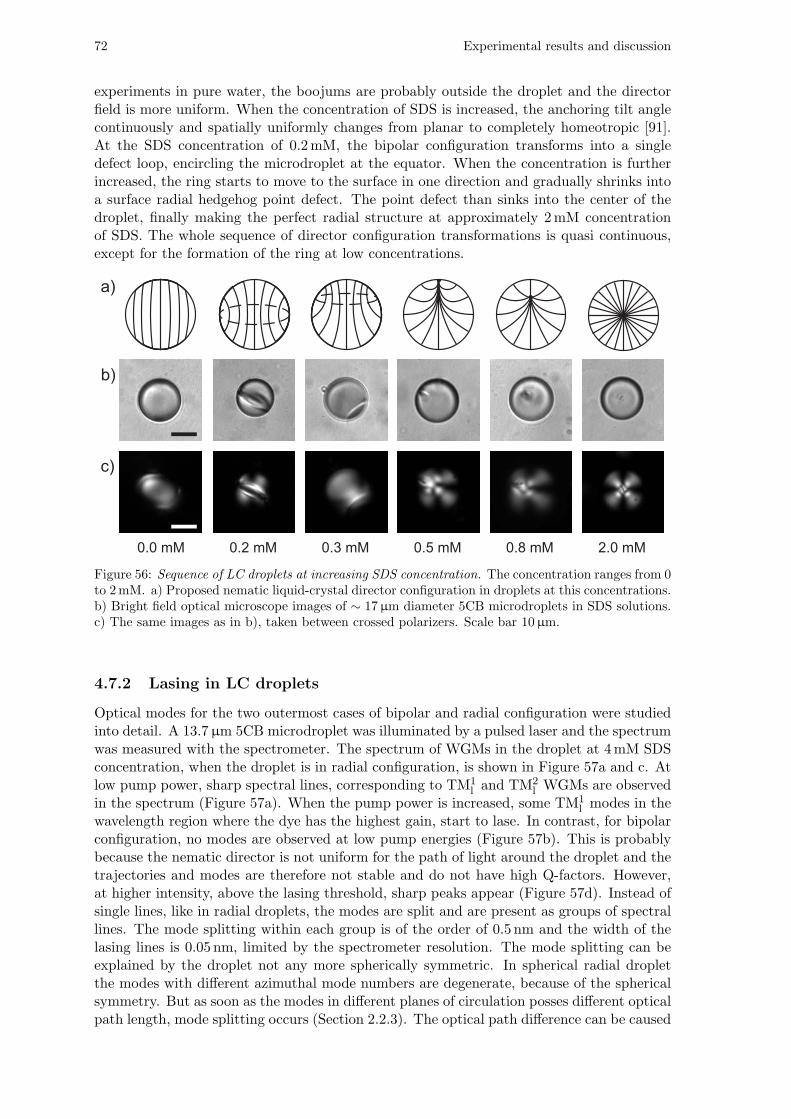
72 Experimental results and discussion
experiments in pure water, the boojums are probably outside the droplet and the directorfield is more uniform. When the concentration of SDS is increased, the anchoring tilt anglecontinuously and spatially uniformly changes from planar to completely homeotropic [91].At the SDS concentration of 0.2mM, the bipolar configuration transforms into a singledefect loop, encircling the microdroplet at the equator. When the concentration is furtherincreased, the ring starts to move to the surface in one direction and gradually shrinks intoa surface radial hedgehog point defect. The point defect than sinks into the center of thedroplet, finally making the perfect radial structure at approximately 2mM concentrationof SDS. The whole sequence of director configuration transformations is quasi continuous,except for the formation of the ring at low concentrations.
Figure 56: Sequence of LC droplets at increasing SDS concentration. The concentration ranges from 0to 2mM. a) Proposed nematic liquid-crystal director configuration in droplets at this concentrations.b) Bright field optical microscope images of ∼ 17µm diameter 5CB microdroplets in SDS solutions.c) The same images as in b), taken between crossed polarizers. Scale bar 10µm.
4.7.2 Lasing in LC droplets
Optical modes for the two outermost cases of bipolar and radial configuration were studiedinto detail. A 13.7µm 5CB microdroplet was illuminated by a pulsed laser and the spectrumwas measured with the spectrometer. The spectrum of WGMs in the droplet at 4mM SDSconcentration, when the droplet is in radial configuration, is shown in Figure 57a and c. Atlow pump power, sharp spectral lines, corresponding to TM1
l and TM2l WGMs are observed
in the spectrum (Figure 57a). When the pump power is increased, some TM1l modes in the
wavelength region where the dye has the highest gain, start to lase. In contrast, for bipolarconfiguration, no modes are observed at low pump energies (Figure 57b). This is probablybecause the nematic director is not uniform for the path of light around the droplet and thetrajectories and modes are therefore not stable and do not have high Q-factors. However,at higher intensity, above the lasing threshold, sharp peaks appear (Figure 57d). Instead ofsingle lines, like in radial droplets, the modes are split and are present as groups of spectrallines. The mode splitting within each group is of the order of 0.5 nm and the width of thelasing lines is 0.05 nm, limited by the spectrometer resolution. The mode splitting can beexplained by the droplet not any more spherically symmetric. In spherical radial dropletthe modes with different azimuthal mode numbers are degenerate, because of the sphericalsymmetry. But as soon as the modes in different planes of circulation posses different opticalpath length, mode splitting occurs (Section 2.2.3). The optical path difference can be caused

Experimental results and discussion 73
by geometrical deformation or in our case, since we do not observe any deformation, thedifference is caused by non-uniformities of refractive index. In terms of optical path, thebipolar droplet is a prolate ellipsoid and can be therefore also approximated by an ellipsoidwith uniform refractive index. The optical path difference can be in this case calculated fromthe mode splitting using (45). The calculated mode splitting corresponds to the optical pathdifference of 8% between the two perpendicular planes. This number can be compared to theoptical path difference in the case when the director field is completely uniform. We havecalculated this in Section 4.3 using (83). For the 5CB droplet the optical path difference forthe two perpendicular planes is 5.4%, which is a little bit less than calculated from modesplitting. Just as an observation, the droplet configuration with the two boojums at thesurface can not adequately explain such large mode splitting. Namely, in this case the LCmolecules have planar alignment on all of the droplet surface, except very near the defects.This introduces just a minute difference in optical paths that go through the defect or awayfrom it. Therefore, this is an additional indication that the bojooms are expelled out of thedroplet and the director configuration in the droplet is nearly homogenous.
Figure 57: Fluorescent spectra for radial and bipolar droplets. Spectra of light emitted from a 13.7µm5CB microdroplet were measured when exited by a pulsed laser. a) For radial droplet at low intensity,WGM peaks are clearly visible. b) In contrast, for the bipolar configuration no spectral lines canbe observed at low pump power. c) Above the lasing threshold of 0.25mJ/cm2 some WGMs startto lase, which is visible as very high peaks compared to the fluorescent background. d) In bipolardroplet also spectral lines appear above lasing threshold of 0.7mJ/cm2. Each mode is split in anumber of closely spaced lines.
To confirm that the observed spectral features are really lasing, intensity of the spectrallines was measured as the pump energy was increased. The results in Figure 58 showclear thresholds for both radial and bipolar droplets. For a 13.7µm 5CB microdropletthe threshold for the radial configuration is 0.25mJ/cm2 and for bipolar configuration is0.7mJ/cm2. The radial configuration has three times lower threshold as well as more steepslope above the threshold. Above the lasing threshold we can also see that the points aremore scattered for bipolar droplet (Figure 58b) than for radial one (Figure 58a), meaningthat the lasing is more stable in radial droplets. The insets in Figure 58 show the imageof the droplet above the threshold. For radial droplet configuration there are two distinctbright spots that are a typical indication of lasing. However, for bipolar configuration the

74 Experimental results and discussion
light intensity is more nonuniform suggesting a little more complicated light paths in thedroplet.
Figure 58: Lasing intensity for radial and bipolar droplets. Laser line intensity for a 13.7µm LCdroplet as the pump energy is increased for a) radial configuration and b) bipolar configuration. Thelines are just a guide for the eye indicating a clear lasing threshold. The insets show image of thefluorescent light coming from the droplet above the threshold for the two cases.
4.7.3 Sensing characteristics
Fluorescent spectrum from a single trapped droplet was measured as the SDS concentrationwas gradually increased. In the case of non-radial director configuration, the trapping laserrotated the droplet so, that the rotational symmetry axis was lying in the plane of themicrofluidic cell, perpendicular to the direction of the laser beam. Results in Figure 59show significant changes in the spectrum at different concentrations. For concentrationsbelow 0.1mM the droplet is in bipolar configuration and the spectra shows typical groupsof lasing lines separated by 0.5 nm. As the SDS concentration is increased to 0.1mM, whenthe defect ring appears, the spectrum begins to change. There are still groups of linespresent, but at slightly different positions. When the concentration is increased beyond0.3mM the split modes join into a single spectral line and shift strongly. The spectrum isthen changing quite chaotically with spectral lines appearing and disappearing and changingpostings quite randomly. At 0.5mM when the defect ring closes into a point defect, singlestrong spectral lines appear and do not shift considerably all the way the droplet changesto radial configuration at high SDS concentrations. For bipolar and radial droplets wehave proven lasing by measuring the threshold characteristics, but for intermediate dropletconfigurations, the spectral lines may not always be lasing. For the concentration rangebetween 0.3mM and 0.4mM where the ”chaotic” change in the spectral features occurs, amore detailed measurement was performed on a 16µm droplet by changing the concentrationin 0.02mM steps (Figure 59c). The spectral lines are clearly visible, but they are quite wide.As the concentration is increased the lines change position and width in a non-monotonic andunpredictable way. Also if the experiment is repeated multiple times on the same droplet,the spectrum is changing in slightly different ways in each experiment.
At this point, it is not possible to precisely measure the concentration of SDS usingthe spectral features. Even though the spectrum is sensitive to small variations in theconcentration, it just not changes in a predictable way nor following monotonically theconcentration. We can however, see from the spectrum if the SDS concentration is below0.2mM or above 0.5mM. So the sensor can not in this way measure the concentration, butit can be used as an indicator of the presence of a targeted molecule. The concentrationsensitivity of such a sensor can be dramatically reduced by using different target molecules.It has been recently demonstrated for endotoxins [67], that already a million times smallerconcentrations than for SDS, can induce the change from bipolar to the radial configuration.
The changes induced by different surfactant concentrations are reversible, since the sur-

Experimental results and discussion 75
Figure 59: Lasing spectrum as the concentration is increased. a) The director configurations fordifferent concentrations corresponding to b) spectrum of fluorescent emitted from a 13µm 5CBdroplet as the concentration of SDS was gradually increased. c) The range from 0.3 to 0.4mM wherechaotic changes in the spectrum occur, was measured more into detail on a 16µm droplet withconcentration steps of 0.02mM.
factant molecules on the interface are in thermodynamic equilibrium with the surroundingwater solution [101] and can therefore adsorb and desorb from the surface. Droplets can bemultiple times transformed from bipolar to radial and vice versa by changing the contrac-tion of SDS, which can also be seen in the lasing spectrum (Figure 60). The equilibriumstates, the bipolar and radial configuration have well defined spectrum. However, within thetransition between these two states, the spectrum does not change in the same way in oneor the other direction. What is more, as already explained before, even one way transitionon the same droplet is different every time.
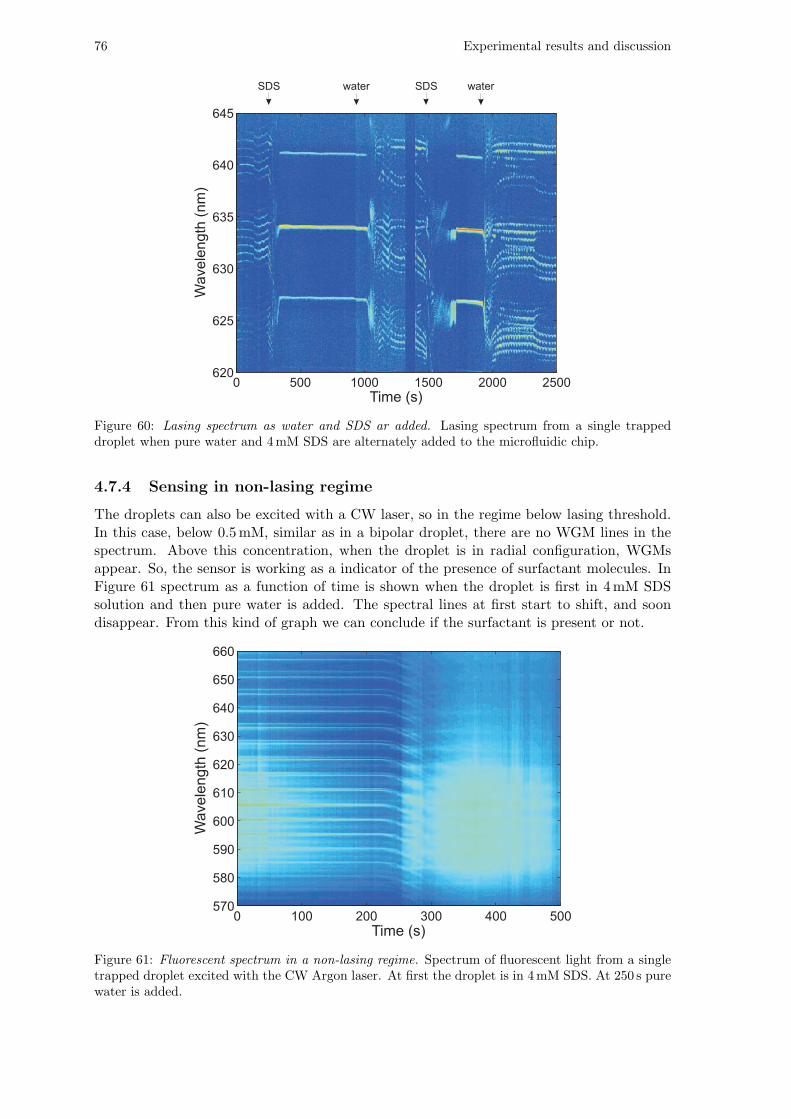
76 Experimental results and discussion
Figure 60: Lasing spectrum as water and SDS ar added. Lasing spectrum from a single trappeddroplet when pure water and 4mM SDS are alternately added to the microfluidic chip.
4.7.4 Sensing in non-lasing regime
The droplets can also be excited with a CW laser, so in the regime below lasing threshold.In this case, below 0.5mM, similar as in a bipolar droplet, there are no WGM lines in thespectrum. Above this concentration, when the droplet is in radial configuration, WGMsappear. So, the sensor is working as a indicator of the presence of surfactant molecules. InFigure 61 spectrum as a function of time is shown when the droplet is first in 4mM SDSsolution and then pure water is added. The spectral lines at first start to shift, and soondisappear. From this kind of graph we can conclude if the surfactant is present or not.
Figure 61: Fluorescent spectrum in a non-lasing regime. Spectrum of fluorescent light from a singletrapped droplet excited with the CW Argon laser. At first the droplet is in 4mM SDS. At 250 s purewater is added.
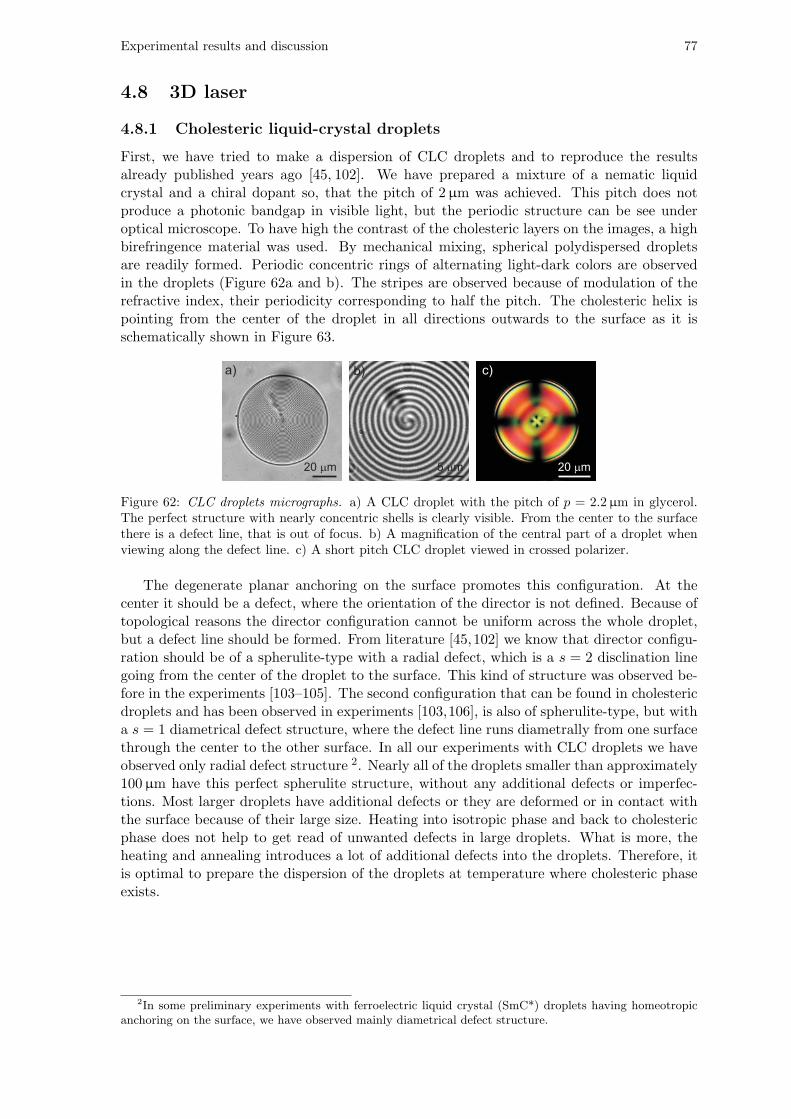
Experimental results and discussion 77
4.8 3D laser
4.8.1 Cholesteric liquid-crystal droplets
First, we have tried to make a dispersion of CLC droplets and to reproduce the resultsalready published years ago [45, 102]. We have prepared a mixture of a nematic liquidcrystal and a chiral dopant so, that the pitch of 2µm was achieved. This pitch does notproduce a photonic bandgap in visible light, but the periodic structure can be see underoptical microscope. To have high the contrast of the cholesteric layers on the images, a highbirefringence material was used. By mechanical mixing, spherical polydispersed dropletsare readily formed. Periodic concentric rings of alternating light-dark colors are observedin the droplets (Figure 62a and b). The stripes are observed because of modulation of therefractive index, their periodicity corresponding to half the pitch. The cholesteric helix ispointing from the center of the droplet in all directions outwards to the surface as it isschematically shown in Figure 63.
Figure 62: CLC droplets micrographs. a) A CLC droplet with the pitch of p = 2.2µm in glycerol.The perfect structure with nearly concentric shells is clearly visible. From the center to the surfacethere is a defect line, that is out of focus. b) A magnification of the central part of a droplet whenviewing along the defect line. c) A short pitch CLC droplet viewed in crossed polarizer.
The degenerate planar anchoring on the surface promotes this configuration. At thecenter it should be a defect, where the orientation of the director is not defined. Because oftopological reasons the director configuration cannot be uniform across the whole droplet,but a defect line should be formed. From literature [45,102] we know that director configu-ration should be of a spherulite-type with a radial defect, which is a s = 2 disclination linegoing from the center of the droplet to the surface. This kind of structure was observed be-fore in the experiments [103–105]. The second configuration that can be found in cholestericdroplets and has been observed in experiments [103,106], is also of spherulite-type, but witha s = 1 diametrical defect structure, where the defect line runs diametrally from one surfacethrough the center to the other surface. In all our experiments with CLC droplets we haveobserved only radial defect structure 2. Nearly all of the droplets smaller than approximately100µm have this perfect spherulite structure, without any additional defects or imperfec-tions. Most larger droplets have additional defects or they are deformed or in contact withthe surface because of their large size. Heating into isotropic phase and back to cholestericphase does not help to get read of unwanted defects in large droplets. What is more, theheating and annealing introduces a lot of additional defects into the droplets. Therefore, itis optimal to prepare the dispersion of the droplets at temperature where cholesteric phaseexists.
2In some preliminary experiments with ferroelectric liquid crystal (SmC*) droplets having homeotropicanchoring on the surface, we have observed mainly diametrical defect structure.

78 Experimental results and discussion
Figure 63: An artist’s impression of a 3D CLC laser. The yellow rods represent LC molecules thatform a helix from the center of the droplet outwards. The helix is seen as a concentric shells thatact as a spherical Bragg mirror. When the droplet is excited by an external laser, it emits light fromits center.
4.8.2 Simulation of the CLC droplet configuration
To better understand the structure inside the CLC droplet, numerical modeling was per-formed by David Sec and Tine Porenta [107] from Prof. Slobodan Zumer’s soft mattertheoretical group, Faculty of mathematics and physics, University of Ljubljana. To modelthe droplets, a continuum, single elastic constant Landau-de Gennes approach based on thenematic order parameter tensor Qij was used. The model takes into account the Frankelasticity due to deformation of the liquid crystal, as well as the local variations of the scalarorder parameter. The minimal free energy configurations of the director field and the scalarorder parameter were obtained by solving a system of coupled partial differential equationswith appropriate boundary conditions using an explicit Euler finite difference relaxationalgorithm on a cubic mesh. At the droplet surface strong degenerate planar anchoring con-ditions were taken into account. The diameter of the droplet in the simulations was 4.5µmand the pitch was 0.75µm, so that the ratio between the droplet diameter and the pitchwas a factor of 6. The results are presented in Figure 64. We can see a defect structurethat extends from the center of the droplet to its surface. On the surface there are twopoint defects that are close together and can not be really distinguished in the experimentalpictures as two separate defects.
To compare the experimental micrographs of the long pitch droplets (Figure 62a and b)with the simulations of the director field, David Sec also simulated the appearance of the

Experimental results and discussion 79
Figure 64: CLC droplet director configuration simulation. Director configuration in a 4.5µm diameterdroplet for two perpendicular planes a) y-z and b) x-y. The pitch length is 0.75µm. The directororientation in the plane of the image is represented by the orientation of the lines. The orientationout of the plane is presented as different colors and line lengths. a) A complex defect structureextending from the droplet to the surface is clearly visible. At the surface there are two point defectsrepresented by white points.
droplets under crossed polarizers [107]. The previously calculated director field configurationin the droplets was upscaled to a larger diameter so that the pitch was 4.5µm. The refractiveindices were no = 1.5 and ne = 1.7. The transmission of white light through the structure ofthe droplet was calculated using Jones 2× 2 matrix formalism, where just the birefringencebecause of the director orientation was taken into account. In this case, refraction andreflection were not taken into account, just the phase difference between the ordinary andextraordinary ray due to the director orientation. As a white light, ten wavelengths fromthe spectrum of an approximate black body radiation were taken. Transmission for eachwavelength was calculated separately and the final picture (Figure 65a and b) is their sum.The experimental results (Figure 65c and d) match the calculations. The colors are not thesame, since the pitch, droplet size and refractive indices are not the same in the experimentscompared to theory. The illumination in the experiments is also not completely parallel andthe light is captured by a high numerical aperture objective. The colors of the layers alsochange when changing the focus of the microscope.

80 Experimental results and discussion
Figure 65: Transmission through a CLC droplet: simulation and experiment. Calculation of thetransmission of white light through a cholesteric droplet for two directions a) perpendicular to theline defect and b) along the defect. The pitch is 4.5µm. c) and d) experimental images of twocholesteric droplets under crossed polarizers for the same light propagation direction as for calculatedtransmission. The pitch is 4.3µm. Scale bar in all the images is 5µm.

Experimental results and discussion 81
4.8.3 Lasing characterization
When we were able to make droplets with nice internal structure, we have used higherchiral dopant concentration, to reduce the pitch, so that the reflection bandgap was invisible light. Such a droplet is shown in Figure 62c in crossed polarizers. Fluorescent dyewas added as well. The droplets were also nice up to 100µm and the radial defect was stillvisible. A single droplet was observed through a 20x objective and illuminated with the532 nm green Q-switched laser with repetition rate of 200Hz and a waist diameter on thesample of ∼ 100µm.
At low excitation laser power, the whole droplet is emitting fluorescent light (Figure66a). When increasing the power of the pump laser, a bright spot suddenly appears inthe center of the droplet (Figure 66b and c). The intensity of the emitted light is slightlyfluctuating and speckles are observed, suggesting coherent light emission. When furtherincreasing the input laser the light intensity from the center of the droplet becomes reallystrong and a bright spot on the sample can be seen even with naked eye.
Figure 66: Emission of light from a 3D laser when the intensity of the pump laser is graduallyincreased. a) Below the lasing threshold at 1.6mJ/cm2 only some fluorescence is observed in thedroplet. b) Just above the threshold (1.9mJ/cm2), a bright spot is observed in the center of thedroplet corresponding to omnidirectional lasing. c) At high pump power (12mJ/cm2) the lasingbecomes very intense.
Next, the light from the droplet was analyzed as a function of the pump intensity byusing the spectrometer (Figure 67a). At lower intensity, when no bright spot is present inthe center of the droplet, just typical fluorescent background in red light is observed. Butat higher intensities a single sharp spectral line positioned at around 600 nm appears in thespectrum indicating threshold behavior. Indeed, when spectral line intensity is measuredas a function of pump intensity, typical lasing threshold behavior is observed (Figure 67b)with a threshold of 1.7mJ/cm2, equivalent to the pulse energy of 20 nJ for a 1 ns pumpingpulse, focused to uniformly illuminate a 40µm diameter droplet. As a comparison, thethreshold for planar cell filled with the same mixture with 40µm thickness was 1.3mJ/cm2.The threshold is dependent upon the size of the droplet and increases with small diameterdroplets (Figure 67c). The reflectivity for the light trapped in the center decreases withsmaller number of layers and therefore increasing the threshold. The smallest dropletsmade of high-birefringence cholesteric liquid crystal that were still lasing were 15µm indiameter. Nearly all the droplets larger than this diameter were lasing when illuminatedwith high enough intensity. Also the droplets that did not posses perfect internal structure,but contained defects, were also lasing but usually the lasing was multimode with multiplespectral lines and non-point-like emission intensity. We have achieved a maximum averagepower of a CLC Bragg laser of 0.05mW at a 200Hz repetition rate. The maximum poweris limited by photobleaching of the dye as well as thermal heating and optical force of thepump laser, that pushes the droplet to the cover glass. At lower powers the lasing at 200Hzrepetition rate can be maintained for more than 10 minutes. The lasing time is dependenton photobleaching of the dye, that in contrast to lasing in planar CLC cell, can not bereplaced by diffusion from other parts of the cell, since single droplets are isolated systems.
The laser line spectral width is typically ∼ 0.1 nm (Figure 67d). This is comparable

82 Experimental results and discussion
Figure 67: Optical properties of a spherical CLC laser. a) Spectra of light from a single CLC dropletwhen the pump power is increased. b) The intensity of the laser line as the pump intensity isincreased. A clear laser threshold can be observed at ∼ 1.8mJ/cm2. c) The laser threshold as afunction of droplet diameter. d) High resolution spectra of the laser line shows spectral width of0.1 nm.
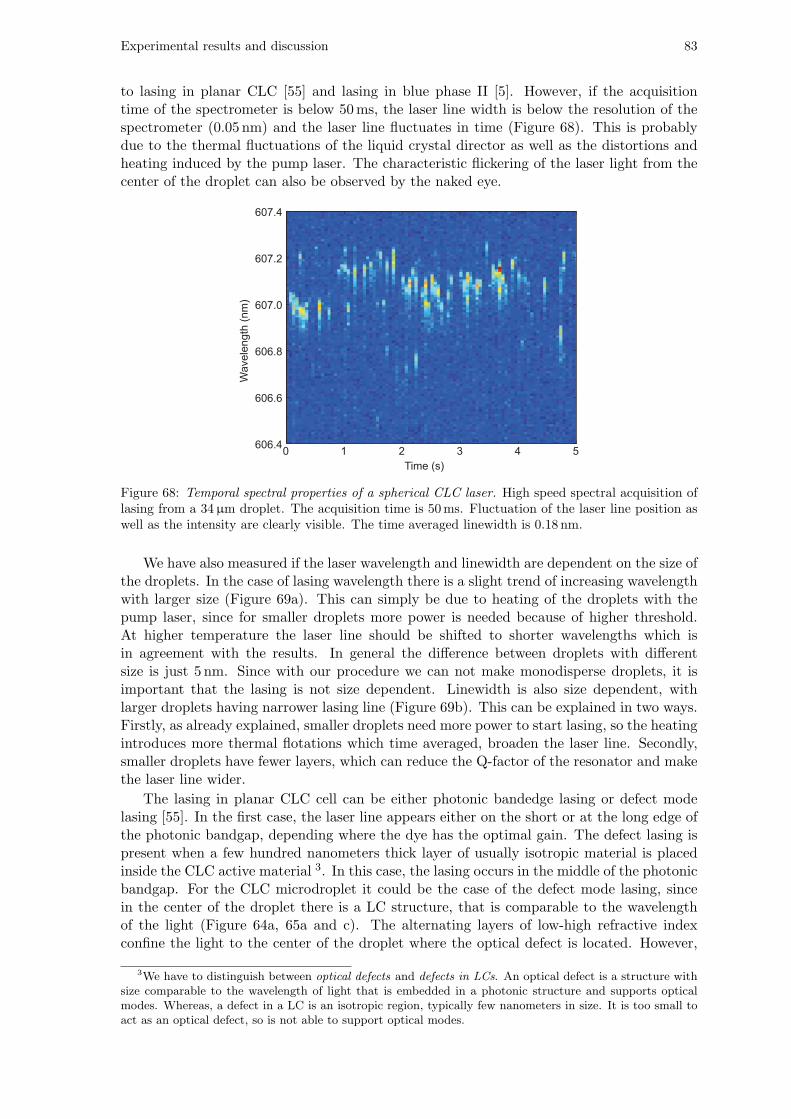
Experimental results and discussion 83
to lasing in planar CLC [55] and lasing in blue phase II [5]. However, if the acquisitiontime of the spectrometer is below 50ms, the laser line width is below the resolution of thespectrometer (0.05 nm) and the laser line fluctuates in time (Figure 68). This is probablydue to the thermal fluctuations of the liquid crystal director as well as the distortions andheating induced by the pump laser. The characteristic flickering of the laser light from thecenter of the droplet can also be observed by the naked eye.
Figure 68: Temporal spectral properties of a spherical CLC laser. High speed spectral acquisition oflasing from a 34µm droplet. The acquisition time is 50ms. Fluctuation of the laser line position aswell as the intensity are clearly visible. The time averaged linewidth is 0.18 nm.
We have also measured if the laser wavelength and linewidth are dependent on the size ofthe droplets. In the case of lasing wavelength there is a slight trend of increasing wavelengthwith larger size (Figure 69a). This can simply be due to heating of the droplets with thepump laser, since for smaller droplets more power is needed because of higher threshold.At higher temperature the laser line should be shifted to shorter wavelengths which isin agreement with the results. In general the difference between droplets with differentsize is just 5 nm. Since with our procedure we can not make monodisperse droplets, it isimportant that the lasing is not size dependent. Linewidth is also size dependent, withlarger droplets having narrower lasing line (Figure 69b). This can be explained in two ways.Firstly, as already explained, smaller droplets need more power to start lasing, so the heatingintroduces more thermal flotations which time averaged, broaden the laser line. Secondly,smaller droplets have fewer layers, which can reduce the Q-factor of the resonator and makethe laser line wider.
The lasing in planar CLC cell can be either photonic bandedge lasing or defect modelasing [55]. In the first case, the laser line appears either on the short or at the long edge ofthe photonic bandgap, depending where the dye has the optimal gain. The defect lasing ispresent when a few hundred nanometers thick layer of usually isotropic material is placedinside the CLC active material 3. In this case, the lasing occurs in the middle of the photonicbandgap. For the CLC microdroplet it could be the case of the defect mode lasing, sincein the center of the droplet there is a LC structure, that is comparable to the wavelengthof the light (Figure 64a, 65a and c). The alternating layers of low-high refractive indexconfine the light to the center of the droplet where the optical defect is located. However,
3We have to distinguish between optical defects and defects in LCs. An optical defect is a structure withsize comparable to the wavelength of light that is embedded in a photonic structure and supports opticalmodes. Whereas, a defect in a LC is an isotropic region, typically few nanometers in size. It is too small toact as an optical defect, so is not able to support optical modes.

84 Experimental results and discussion
Figure 69: Lasing properties as a function of droplet diameters. a) Lasing wavelengths and b) lasinglinewidths of droplets with different diameters. Both measurers were performed using high refractiveindex LC.
when viewing the droplet from other direction, there is no such structure present, but justholesteric layers that end in the center of the droplet (Figure 64b, 65b and d).
To find out which type of lasing is occurring in the droplets, the position of the reflectionbandgap should be compared to the lasing line. The reflection bandgap of the same materialas used to make the droplets, was measured in a planar cell. The central position of thereflection bandgap is 595 nm, equivalent to the pitch of 400 nm. The lasing occurs at thelonger bandedge (Figure 70) and is therefore a bandedge lasing. This is true for all thedirections of lasing, as we will see in Section 4.8.5. The lasing mechanism for our CLCmicrodroplets is therefore the same as in planar CLC lasers that do not contain a defect.In that case the lasing occurs in the direction of the helical axis. In the droplet, the helixis pointing in all the directions from the center and also lasing is than occurring in all thedirections corresponding to many independent lasers emitting light in different directions.
Figure 70: Lasing and reflection spectrum. Laser spectrum above the threshold (red) compared tothe reflection spectrum (blue) of white light on planar cell 30µm in thickness filled with the sameCLC material.

Experimental results and discussion 85
4.8.4 Polarization
Polarization of the laser light emitted by 3D Bragg laser is an important parameter thatshould be measured. For planar CLC lasers the polarization is circular, so also for sphericalCLC lasers circular polarization is expected. First, the lasing intensity from a single dropletwas measured as the polarizer was rotated. The intensity was extracted from the spectraseparately just for the laser line and just for the fluorescent background (spontaneous emis-sion). In Figure 71a a small modulation of light can be seen, so the fluorescent backgroundlight is slightly linearly polarized. This can be explained by a slight ellipticity of the exci-tation light, that is generated when the circularly polarized excitation light is reflected bythe dichroic mirror. Since the excitation light is slightly linearly polarized, so is also theemitted light. The laser line of the 3D laser is not linearly polarized, as can be seen fromFigure 71c. For measurement of circular polarization a quarter-wave plate was added beforethe polarizer with its axis at 45. The fluorescent background is slightly circularly polarized(Figure 71b), which can be explained by suppression of the spontaneous emission of just onecircular polarization caused by the PBG. For the laser line, a large amplitude modulationcan be observed (Figure 71d), therefore it is highly circularly polarized. However, we haveto emphasize that the results for different droplets varied greatly and we can not say forcertain that the output of the 3D lasers is really circularly polarized. We have also notmeasured in detail the polarization of the light emitted along the defect line. In all theexperiments the defect line was oriented randomly.
Figure 71: Polarization measurements of the 3D laser. Intensity of the fluorescent background (toprow) and intensity of the laser line (bottom row) as the polarizer is rotated (left column) and withan additional quarter-wave plate added (right column).
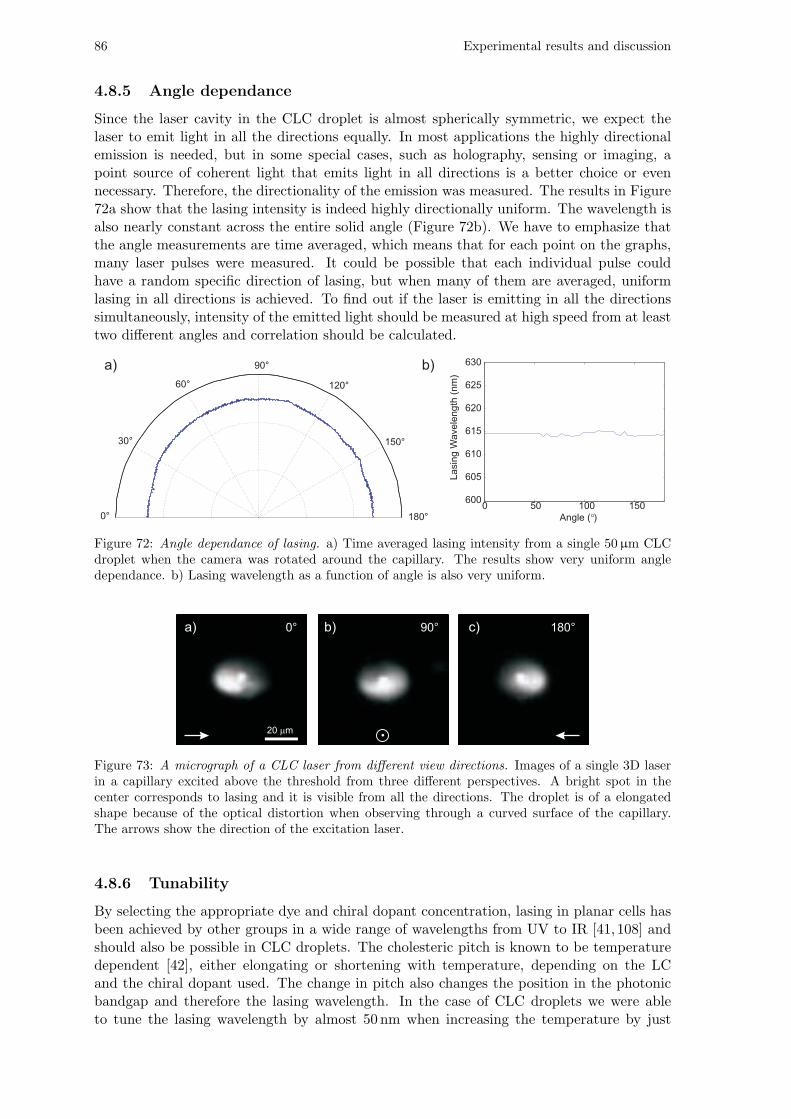
86 Experimental results and discussion
4.8.5 Angle dependance
Since the laser cavity in the CLC droplet is almost spherically symmetric, we expect thelaser to emit light in all the directions equally. In most applications the highly directionalemission is needed, but in some special cases, such as holography, sensing or imaging, apoint source of coherent light that emits light in all directions is a better choice or evennecessary. Therefore, the directionality of the emission was measured. The results in Figure72a show that the lasing intensity is indeed highly directionally uniform. The wavelength isalso nearly constant across the entire solid angle (Figure 72b). We have to emphasize thatthe angle measurements are time averaged, which means that for each point on the graphs,many laser pulses were measured. It could be possible that each individual pulse couldhave a random specific direction of lasing, but when many of them are averaged, uniformlasing in all directions is achieved. To find out if the laser is emitting in all the directionssimultaneously, intensity of the emitted light should be measured at high speed from at leasttwo different angles and correlation should be calculated.
Figure 72: Angle dependance of lasing. a) Time averaged lasing intensity from a single 50µm CLCdroplet when the camera was rotated around the capillary. The results show very uniform angledependance. b) Lasing wavelength as a function of angle is also very uniform.
Figure 73: A micrograph of a CLC laser from different view directions. Images of a single 3D laserin a capillary excited above the threshold from three different perspectives. A bright spot in thecenter corresponds to lasing and it is visible from all the directions. The droplet is of a elongatedshape because of the optical distortion when observing through a curved surface of the capillary.The arrows show the direction of the excitation laser.
4.8.6 Tunability
By selecting the appropriate dye and chiral dopant concentration, lasing in planar cells hasbeen achieved by other groups in a wide range of wavelengths from UV to IR [41, 108] andshould also be possible in CLC droplets. The cholesteric pitch is known to be temperaturedependent [42], either elongating or shortening with temperature, depending on the LCand the chiral dopant used. The change in pitch also changes the position in the photonicbandgap and therefore the lasing wavelength. In the case of CLC droplets we were ableto tune the lasing wavelength by almost 50 nm when increasing the temperature by just

Experimental results and discussion 87
15C (Figure 74a). The spectral shift is almost linear with temperature (Figure 74b),the tuning coefficient being 3.5 nm/K and completely reversible. Phototunability has alsobeen demonstrated in cholesteric lasers [109] and should be interesting for application inphototunable spherical lasers.
Furthermore, by applying electric field, the lasing characteristics should also be changed.In the case of positive dielectric anisotropy of the CLC, the electric field should unwind thehelix [88], thus changing the directionality and wavelength of lasing. At even higher fieldswe expect that the lasing will cease, because of the helix would be too much deformed.More interesting could be using a negative dielectric anisotropy LC. In this case the electricfield should induce planar CLC structure [110] such as in planar cells, making the laserunidirectional. Some experiments with electric field have been already done, however withliquid matrix such as glycerol the problem is that the field deforms the droplets and pushesthem to one surface. Therefore, a solid carrying medium with planar anchoring has to beused. No appropriate material has been found till now.
Figure 74: Temperature tunability. a) Lasing spectra from a single droplet when the temperaturewas increased. At temperatures higher than 310K the bandgap was not in the optimal range ofthe fluorescent dye and the lasing ceased. Therefore, the excitation power had to be increased,also increasing the fluorescent background. b) Continuous temperature change shows almost lineardependence.
4.8.7 Lasing of higher Bragg modes
Till now we were focusing only on completely radial lasing in cholesteric droplets, having asingle sharp spectral line and the light coming from the center of the droplet. In cholestericdroplets we can also achieve lasing of higher Bragg modes that also have angular momentum.By using lower concentration of chiral dopant the PBG can be pushed to infrared part ofthe spectrum, so that it is out of the gain region of the dye and the droplet does not laseany more. This is true just for light with the incidence along the helical axis. Following theBragg’s law, at smaller angles, light with shorter wavelengths is reflected from the periodicstructure. In the droplet this means, that the red fluorescent light from the dye is not anymore reflected in radial direction, but instead reflects multiple times from the layers at asmaller angle and so circulates in the droplet. This is similar to WGMs, where the lightis multiply reflected from the surface and circulates around the droplet. The difference incholesteric droplet is, that the light is not reflected because of total internal reflection, butbecause of Bragg structure. The light also does not circulate close to the surface, but inthe interior of the droplet. In Figure 75 lasing spectra and images of three droplets withincreasing pitch length are shown. When a droplet is pumped by a pulsed laser, a ring oflight is clearly visible in the interior of the droplet. As the pitch length becomes longer, thering of light becomes larger. Also at longer pitch, the droplet needs to be larger, in orderto support these modes. In the spectrum there are multiple modes visible and as we go

88 Experimental results and discussion
to longer pitch the number of lasing modes increases. Overall, these are still preliminaryresults and we do not know exactly which modes are lasing, what is the mode spacing andwhat is the radius of the light circulation dependent on.
Figure 75: Lasing of higher Bragg modes in longer pitch droplets. Images of three cholesteric dropletswith different pitch in white light, under excitation and their lasing spectrum. a) Droplet with pitchof 470 nm, corresponding to central position of the PBG of 700 nm. b) Droplet with pitch of 510 nm,corresponding to the PBG at 770 nm and c) Droplet with pitch of 550 nm, corresponding to the PBGat 830 nm.
In most experiments we have used low refractive index LC and high refractive index ofthe outside medium, so that the index contrast is as low as possible in order to suppressWGMs on the surface of the droplet. By using a high refractive index LC (MLC-2132) alsoWGMs can start to lase at the same time as the Bragg lasing (Figure 76a). The WGMs
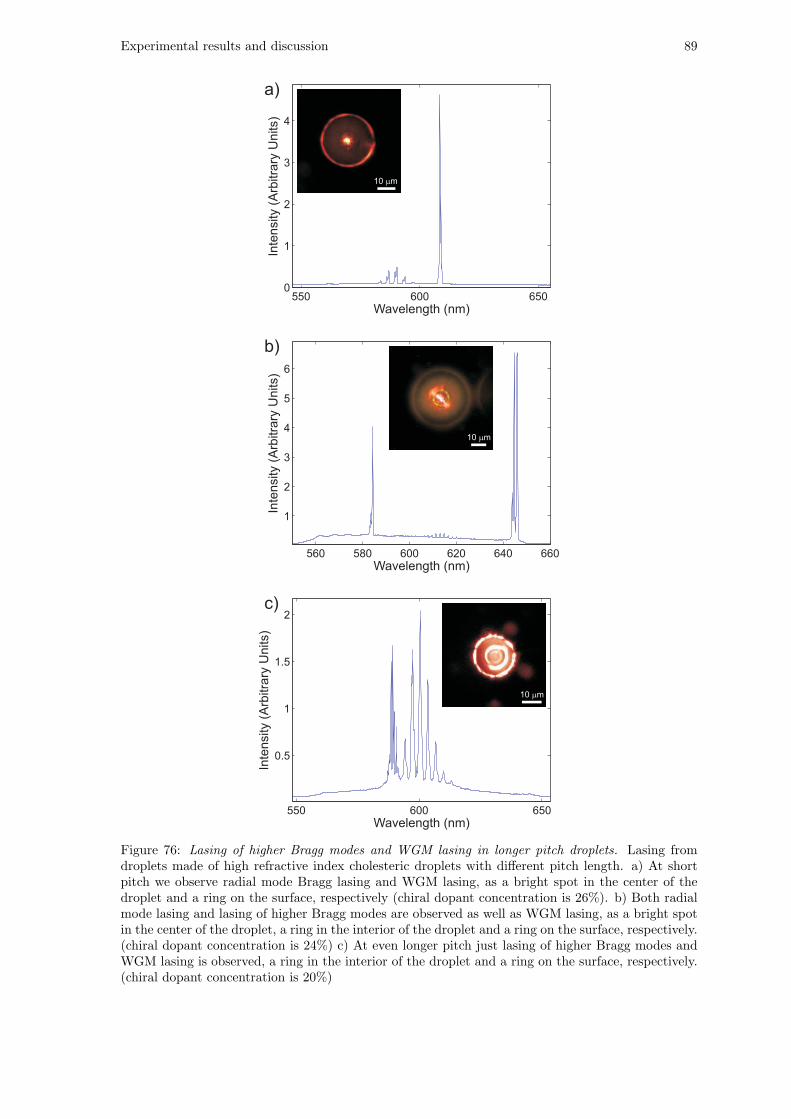
Experimental results and discussion 89
Figure 76: Lasing of higher Bragg modes and WGM lasing in longer pitch droplets. Lasing fromdroplets made of high refractive index cholesteric droplets with different pitch length. a) At shortpitch we observe radial mode Bragg lasing and WGM lasing, as a bright spot in the center of thedroplet and a ring on the surface, respectively (chiral dopant concentration is 26%). b) Both radialmode lasing and lasing of higher Bragg modes are observed as well as WGM lasing, as a bright spotin the center of the droplet, a ring in the interior of the droplet and a ring on the surface, respectively.(chiral dopant concentration is 24%) c) At even longer pitch just lasing of higher Bragg modes andWGM lasing is observed, a ring in the interior of the droplet and a ring on the surface, respectively.(chiral dopant concentration is 20%)

90 Experimental results and discussion
are visible as an ring on the surface of the droplet and the Bragg lasing is coming from thecenter of the droplet. In the spectrum several peaks at shorter wavelength correspond toWGMs and a single peak at 610 nm corresponds to Bragg lasing. When we increase thepitch length, lasing of higher Bragg modes appear as a ring visible in the droplet (Figure76b). WGMs are visible as well. At even longer pitch the radial Bragg mode is not lasingany more. Lasing of higher Bragg modes is visible as a set of closely spaced spectral linesat shorter wavelengths and WGMs are visible as peaks at longer wavelengths (Figure 76c).
Figure 77: WGM and Bragg thresholds. Thresholds for WGMs and radial Bragg lasing in highrefractive index LC droplets and corresponding planar cells with the same thickness.
Thresholds for both Bragg and WGM lasing are dependent on droplet size and arelower in bigger droplets because of higher Q-factors (Figure 77). The threshold for WGMsdecreases faster with the droplet diameter than for Bragg lasing. The droplets below 25µmhave lower threshold for Bragg lasing, whereas above 25µm the threshold is lower for WGMs.The smaller droplet with Bragg lasing is 15µm in diameter and the smallest with WGMlasing is 19µm in diameter. For planar cell filled with the same mixture as used for thedroplets, the threshold is nearly constant with the thickness and is comparable to thresholdfor larger droplets.
4.8.8 Polymerizable 3D laser
It has been shown that lasing can also be achieved in polymerizable cholesteric LCs [111,112] and cholesteric liquid crystalline elastomers [113]. The advantage of polymerizing thestructure is that it can be stabilized. After polymerization the director structure remainsthe same, the order parameter does not change a lot, usually it increases and the thermalfluctuations are quenched. The LC is also not sensitive to changes in temperature andexternal fields any more. This is an advantage to achieve stable optical properties of theCLC, but on the other hand also a disadvantage, since the system is not tunable anymore.In the case of CLC lasers, the polymerization stabilizes the lasing, both the wavelength andthe pulse-to-pulse energy. Since there are no more thermal fluctuations, the refractive indexand the pitch are also not fluctuating and the lasing wavelength is more stable. The pumplaser locally heats and reorients the LC causing even larger fluctuations, which is avoided bypolymerization. Unfortunately, the polymerization increases the lasing threshold. Why thishappens is not clear. In the case of droplets, the polymerization has additional advantage, inthe sense, that we can also mechanically stabilize the droplets. They can be then extracted
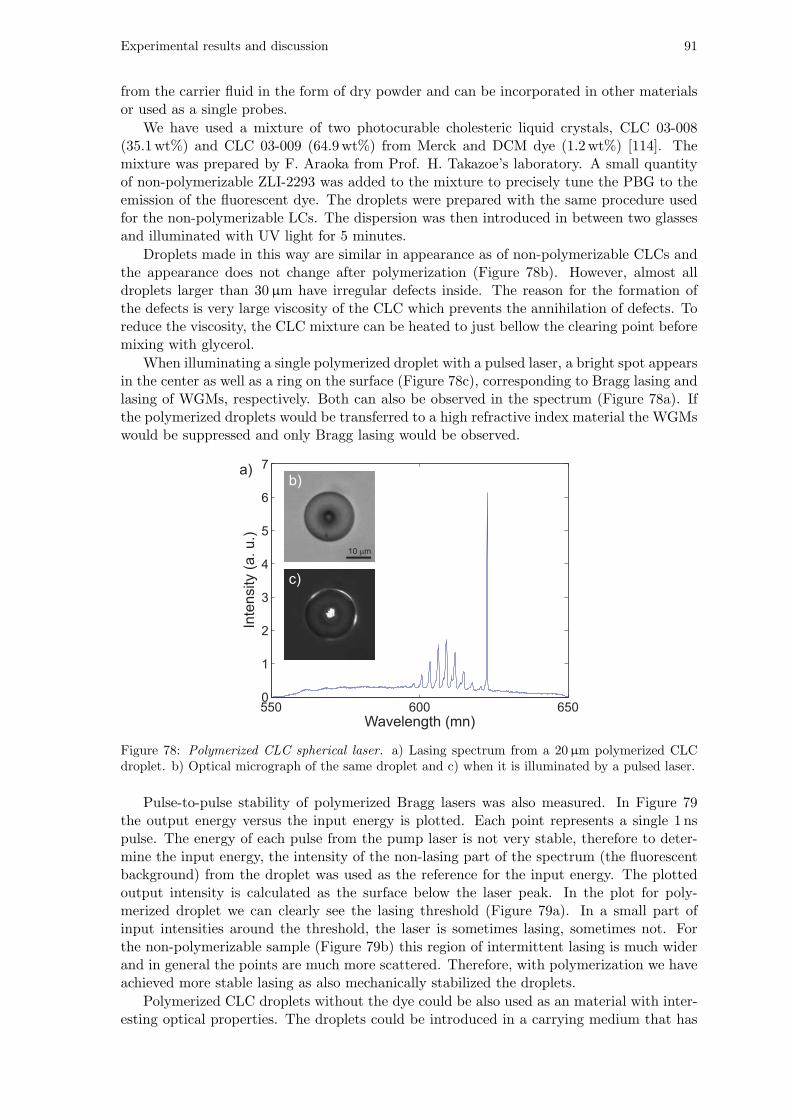
Experimental results and discussion 91
from the carrier fluid in the form of dry powder and can be incorporated in other materialsor used as a single probes.
We have used a mixture of two photocurable cholesteric liquid crystals, CLC 03-008(35.1wt%) and CLC 03-009 (64.9wt%) from Merck and DCM dye (1.2wt%) [114]. Themixture was prepared by F. Araoka from Prof. H. Takazoe’s laboratory. A small quantityof non-polymerizable ZLI-2293 was added to the mixture to precisely tune the PBG to theemission of the fluorescent dye. The droplets were prepared with the same procedure usedfor the non-polymerizable LCs. The dispersion was then introduced in between two glassesand illuminated with UV light for 5 minutes.
Droplets made in this way are similar in appearance as of non-polymerizable CLCs andthe appearance does not change after polymerization (Figure 78b). However, almost alldroplets larger than 30µm have irregular defects inside. The reason for the formation ofthe defects is very large viscosity of the CLC which prevents the annihilation of defects. Toreduce the viscosity, the CLC mixture can be heated to just bellow the clearing point beforemixing with glycerol.
When illuminating a single polymerized droplet with a pulsed laser, a bright spot appearsin the center as well as a ring on the surface (Figure 78c), corresponding to Bragg lasing andlasing of WGMs, respectively. Both can also be observed in the spectrum (Figure 78a). Ifthe polymerized droplets would be transferred to a high refractive index material the WGMswould be suppressed and only Bragg lasing would be observed.
Figure 78: Polymerized CLC spherical laser. a) Lasing spectrum from a 20µm polymerized CLCdroplet. b) Optical micrograph of the same droplet and c) when it is illuminated by a pulsed laser.
Pulse-to-pulse stability of polymerized Bragg lasers was also measured. In Figure 79the output energy versus the input energy is plotted. Each point represents a single 1 nspulse. The energy of each pulse from the pump laser is not very stable, therefore to deter-mine the input energy, the intensity of the non-lasing part of the spectrum (the fluorescentbackground) from the droplet was used as the reference for the input energy. The plottedoutput intensity is calculated as the surface below the laser peak. In the plot for poly-merized droplet we can clearly see the lasing threshold (Figure 79a). In a small part ofinput intensities around the threshold, the laser is sometimes lasing, sometimes not. Forthe non-polymerizable sample (Figure 79b) this region of intermittent lasing is much widerand in general the points are much more scattered. Therefore, with polymerization we haveachieved more stable lasing as also mechanically stabilized the droplets.
Polymerized CLC droplets without the dye could be also used as an material with inter-esting optical properties. The droplets could be introduced in a carrying medium that has

92 Experimental results and discussion
Figure 79: Output intensity versus input intensity of single laser pulses. Output intensity for a)polymerized droplet and b) non-polymerizable sample.
the refractive index the same as the average refractive index of the LC. The refractive indexmatching would prevent the droplets to act as lenses and the light to be scattered. Only theperiodic structure would have an effect on the optical properties of such material. Becausethe droplets are spherically symmetric, they have photonic bandgap in all the directions,therefore their dispersion could also have an isotropic photonic bandgap.

Experimental results and discussion 93
4.8.9 Particles incorporated into a CLC droplet
In all the experiments with spherical CLC lasers the dye was dissolved in the CLC and wastherefore distributed in the whole droplet. More efficient pumping could be achieved by onlyhaving the dye in the center of the droplet where there is the highest light intensity. In thisway, also suppression of the spontaneous emission could be achieved. This could be doneby introducing a fluorescent hard particle to the center of the droplet. The other reason forincluding a particle to the center of the droplet is to achieve defect mode lasing [53]. Thesame as in planar CLC cell where a thin layer of isotropic material is introduced in betweenlayers of CLC, in the droplet this would be achieved by a spherical particle. Furthermore,a plasmon particle or nonlinear core material for second-harmonic generation could be usedas an active core.
In the case of nematic droplets, the introduced particle is stable in the center of thedroplet, where the defect is located (Section 4.1). We would expect something similaralso in cholesteric droplets. In this case, planar anchoring on the surface of the particlewould match the director configuration. To try to achieve this, we have first dispersed thesolid particles into the CLC and then mixed this into the carrier medium using the sameprocedure as for nematic shells. We have used silica colloids with diameters from 150 nm upto 10µm with either planar or homeotropic anchoring or gold nanoparticles without surfacetreatment. The results were in all case the same. The particles did not go into the centerof the droplet, but rather to the radial defect line and most of the times where the defectline was pinned to the surface of the droplet.
Figure 80: A CLC spherical laser with included particles. a) A CLC droplet in glycerol with incor-porated 500 nm silica colloids and b) with gold nanoparticles. In both cases the defect line from thecenter of the droplet to the surface is visible. The particles aggregate on the surface where the defectline comes to the surface.

94 Experimental results and discussion

95
5 Conclusions
In the research work covered by this thesis, we have started a new area of research byusing for the first time liquid-crystal droplets as optical microcavities. The use of LC dropletswas before limited mostly to PDLC, where the optical modes were not supported inside thedroplets, mostly because their small size. It has been shown already many years ago bytheoretical and experimental groups, that liquid-crystal droplets are a very rich system. Thevariety of structures in the droplets reflects also in a variety of possible optical modes andtheir many possible applications. The structures in the droplets are self assembled becauseof elastic forces in LCs, which is a great advantage over solid state optical components,since no complicated fabrication methods are necessary. We have shown that nematic andcholesteric droplets can support optical modes. The modes in the two types of droplets aredifferent in their properties, such as the intensity distribution, number of modes, polarizationand direction of emission.
To observe, manipulate, excite and analyze the droplets and their spectral properties, anoptical setup build around an inverted microscope was used. The old setup that included agreen and an infrared tweezers was upgraded with a pulsed laser and a spectrometer with acooled EMCCD camera. Software was written to control most of the devices in the opticalsetup including temperature, electric field and position of the sample.
First, radial nematic droplets were used as optical microcavities [83]. They were pre-pared just by mechanical mixing of a nematic LC and a carrying fluid. It was found thatPDMS is a good choice as a carrying medium, since it gives homeotropic anchoring and canbe polymerized to fix the droplets. Prior to the polymerization, single droplets can also bemanipulated by the laser tweezers and assembled into arbitrary structures. Instead of usingjust LC also hard particles can be introduced in droplets, and can sit in the center of thedroplet making a thin shell of LC. The LC used in most experiments was doped with a fluo-rescent dye and a single droplet was illuminated by a laser through a microscope objective.Droplets can also be excited by introducing a fiber into the sample. Fluorescent signal wassent to a spectrophotometer and analyzed. Narrow spectral peaks in the spectrum wereidentified as WGM and by fitting to theory, the mode numbers were identified. Comparedto isotropic spheres, the two polarizations (TE and TM) of the modes sense different re-fractive indices and are decoupled from each other. In our case the TM modes have muchhigher Q-factors and is small droplets no TE modes are observed. The Q-factor of WGMsin droplets larger than 30µm is up to 12,000, limited by the resolution of the spectrometerused to analyze the signal. For both radial and bipolar nematic droplets also low-thresholdlasing has been achieved by using a pulsed laser as an excitation source.
After showing that LC droplets can support WGMs, the natural next step was to applyelectric field to the droplets. The electric filed changes the nematic director orientationinside the droplets, which has an effect on the average refractive index for the light travelinginside the droplet. By applying moderate field of up to 2.6V/µm we were able to tune theWGMs by almost 20 nm for the modes near 600 nm [83, 115]. This is one or two ordersof magnitude more than achieved before in solid state microresonators. The tunability isalmost linear and completely reversible. It exceeds the free spectral range of the cavity, sothat the modes can be shifted to any wavelength.

96 Conclusions
The WGMs in a LC droplet can also be tuned by temperature [116]. The refractive in-dices of LCs are highly temperature dependent. By increasing the temperature the ordinaryindex increases and the extraordinary index decreases. Therefore, also the TE and the TMmodes are shifted to longer or shorter wavelengths, respectively. The tunability for E12 LCdroplets is approximately 15 nm for temperature change of 30K. The tunability, except verynear the transition temperature, is completely reversible and exceeds the FSR. The tuningof single droplets can also be achieved by local heating with a laser. The LC WGM cavitiescan also be used as temperature sensor, a single droplet indicating local temperature in asample.
The third way of achieving tunability is by mechanical deformation [116]. A thin freestanding film of polymerized PDMS containing the droplets was mechanically stretched andthe positions of the modes were measured. At 15% strain the mode shift is more than 30 nm.The tuning mechanism is in this case not connected to the nematic director configuration ororder, but it has pure geometrical origin. Namely, the deformation changes the geometricalpath of the light, which is the same as it would be in an isotropic droplet. The tunability isalso in this case completely reversible and exceeds the FSR.
We have further demonstrated, that by observing optical modes in dye doped nematicLC droplets in water, they can be used as versatile chemical sensor [117]. Foreign surfactantmolecules adsorb to the LC-water interface influencing the surface anchoring, which in turnchanges the LC ordering inside the droplet and effects the frequencies of the WGMs. Incontrast to solid WGM microresonators, the molecules that bind to the LC-water interface,do not change refractive index just locally, but the perturbation is propagated into the bulkLC by long range interactions. We demonstrate that the presence of 0.3mM concentration ofSDS in water induces significant and clearly detectable changes in the lasing spectrum fromWGMs. The developed sensing method could be easily integrated into existing microfluidicschips. Monodispersed LC droplets could be formed within a microchannel and the excitationand detection of fluorescent light could be achieved through the integrated optical fibers[118]. Monitoring and automated recognition of the lasing spectra from LC microdropletshas therefore a clear advantage in comparison to the conventional observation of individualdroplets under an optical microscope and could provide efficient and automated readout ofthe presence of targeted molecules in water surrounding the LC microdroplet sensor.
We have extended lasing principle in cholesteric liquid crystals from planar geometryinto a spherical one [119, 120]. A small quantity of dye doped cholesteric liquid crystalwas mechanically mixed with an external carrier fluid such as glycerol. In the process ofmechanical mixing thousands of droplets with different sizes were produced. Each droplethas a spherulite structure that corresponds to the helical pitch having radial direction andbeing equivalent to a Bragg onion resonator. When a single droplet was illuminated by a Q-switched doubled Nd:YAG laser, a narrow spectral line appeared above the lasing threshold.The linewidth was 0.1 nm and the laser line was positioned at 620 nm, matching the longerwavelength photonic bandgap edge. Lasing could also be observed as a bright spot in thecenter of the droplet. The lasing wavelength is not dependent on the droplet size and canbe arbitrarily selected from UV to IR by utilizing liquid crystal with proper pitch lengthand a proper fluorescent dye. By changing the temperature of the droplet, the cholestericpitch is varied and the position of the laser line can be tuned by several tens of nanometers.The temperature change of 13K shifts the laser line by 40 nm. By measuring the angledependence of the emission we have found that the emission is highly uniform and thelaser is really emitting light isotropically, thus the laser is acting as a coherent, point-like,omnidirectional source of light. A number of other characteristics of the laser, such asthe polarization, stability, linewidth as a function of droplet size and thresholds have beenmeasured. Also multimode lasing has been achieved. A number of applications of thecholesteric onion microlasers is anticipated, such as holography, telecommunications, opticalcomputing, imaging, sensing and even as a material for paints [47] or light sources that emit

Conclusions 97
coherent light in all directions. By polymerizing the liquid crystal itself, a more mechanicallystable microlaser can be made, useful for example in biological imaging. Furthermore, the 3Dcholesteric laser is also one of the simplest lasers to make in general. Only four commerciallyavailable substances are needed: a nematic liquid crystal, a chiral dopant, a fluorescent dyeand a fluid as the external medium. No complicated mixing procedures are needed and thewhole process can be completed in less than fifteen minutes in any laboratory. Coupledregular arrays of thousands and even millions of CLC microlasers could also be made. Weanticipate that by using better materials and optimized material parameters, such as theconcentration of the chiral dopant and of the fluorescent dye, it will be possible to furtherreduce the size and increase the tunability and the functionality of the cholesteric onionlasers. The CLC onion microlasers could also be combined with optical fiber waveguides tocollect radiating light into the waveguides. Omnidirectional laser emission is one of the morerelevant results of the dissertation, since there are just few known lasers that emit light inall directions in space. This is probably the only such laser source that is also highly tunableat the same time. We also have to emphasize that lasing in a spherical Bragg structure hasbeen achieved for the first time.
By using different LC materials such as smectic, ferroelectric, discotic, blue phase andothers, plus different shapes of the droplets and by applying external fields, an almostinfinite number of combinations are possible. The final idea is not to use the LC dropletsas single optical components integrated in some other solid state optics, but to have thewhole integrated photonic structure made from soft materials. This opens a new areaof research called soft photonics. All living creatures have extraordinary complexity andare made mostly of soft matter, the single building blocks being self assembled by complexinteractions. Why not to have an artificially made photonic circuit that is entirely composedof soft materials and the single components being self assembled to the right positions.Bottom-up approach would in this case enable cheap, large scale production of such photonicstructures without the need of complex procedures such as lithography that is limited justto planar geometries. Such soft structures would also have a number of useful propertiessuch as tunability, real time reconfigurability and self healing. There is still a lot of work tobe done in order for this self assembled structures to be realizable. However, some simplecases could be manufactured with current knowledge and technology. It has been shownthat hard particles embedded in a LC can be self assembled in a variety of structures [68–72].In this way, the microcavities could be self assembled in various structures such as CROWsand connected to other solid state components. Coupling the resonators with waveguidescould lead to efficient extraction of light from cavities, as well as a potential to use them asfilters and routers.
The work in this dissertation has great potential in future micro-optics circuits as wellas in basic research. Form application point of view this work could have impact on thedevelopment of a number of tunable optical elements, such as microlasers, narrow filters,optical switching and routing, ultrasensitive biosensing, temperature and displacement mea-surements, high resolution spectroscopy, etc. Liquid-crystal resonators, could be useful notjust for commercial applications, but also in various studies such as nonlinear optics, cavityquantum electrodynamics and single photon sources.

98 Conclusions

99
6 Acknowledgements
First, great thanks to my supervisor Prof. Igor Musevic for remarkable guidance overthe entire duration of the PhD, giving wonderful scientific ideas, objective criticism, but atthe same time allowing me enough scientific freedom to develop my own ideas and methods.
Special thanks to Asst. Prof. Miha Skarabot for teaching me the experimental work aswell as giving me countless advices and making my work at the institute especially pleasant.As well I would like to thank Prof. Denis Arcon that introduced me to the research workin the first place and encouraged me to work in science.
I am very grateful to my coworkers Dr. Andriy Nych, Dr. Uliana Ognysta, Dr. UrosTkalec, Dr. Rok Zitko, Dr. Anna V. Ryzhkova, Venkata Subba Rao Jampani, MaryamNikkhoo and Huan Peng that we spent together infinite number of days in the laboratoryand office, for sharing the knowledge and making my working days enjoyable.
I would also like to thank Prof. Slobodan Zumer, Dr. Miha Ravnik, David Sec and IztokBajc for the insight into the theoretical background, for handing simulation results as wellas for many fruitful suggestions.
I also express my thanks to Ivan Kvasic, Silvano Mendizza, Silvija Pirs, Dr. Janez Pirs,Dr. Laura Ramon Gimenez, Dr. Polona Umek, Dr. Blaz Zupancic, Dr. Erik Zupanic, NikaKosir, Dr. Fumito Araoka, Prof. Hideo Takezoe, Dr. Manca Logar, Mag. Slavko Kralj,Dr. Stane Pajk, Prof. Slavko Pecar, Dr. Polonca Ropret, Dr. Daniele Biglino, Prof. JanezStrancar, Asst. Prof. Zoran Arsov and Dr. Tilen Koklic. They helped me with small, butimportant details, that made my work possible.
Thanks to Andreja Erste and Dr. Erik Zupanic for the LATEX template that greatlysimplified the writing of the thesis.
Finally, I would like to sincerely thank my parents Marjan and Vera, grandfather Milan,as well as Maja for the support they offered me all along. To them I dedicate this thesis.

100 Acknowledgements
101
7 Zahvala
Najlepsa hvala Prof. Dr. Igorju Musevicu za izjemno pomoc in usmerjanje preko celot-nega doktorskega raziskovanja, za posredovanje odlicnih znanstvenih idej, objektivne kri-ticnosti in hkrati omogocanja razvoja lastnih znanstvenih idej in metod.
Posebna zahvala gre Doc. Dr. Mihi Skarabotu, ki me je vpeljal v eksperimentalno delo.Hvala za stevilne nasvete in pozitivno energijo pri delu. Hvala tudi Prof. Dr. Denisu Arconuza prvo seznanitev z raziskovalnim delom, ter spodbudo za nadaljevanje dela v znanosti.
Zelo sem hvalezen sodelavcem Dr. Andriyu Nychu, Dr. Uliani Ognysti, Dr. UrosuTkalcu, Dr. Roku Zitkotu, Dr. Anni V. Ryzhkovi, Venkati Subba Rao Jampaniju, MaryamNikkhoo in Huanu Pengu s katerimi sem prezivel stevilne ure v laboratoriju in pisarni, zaizmenjavo izkusenj in znanja, ter ustvarjanja prijetnega delovnega vzdusja.
Zahvaljujem se tudi Prof. Dr. Slobodanu Zumru, Dr. Mihi Ravniku, Davidu Secuin Iztoku Bajcu za vpogled v teoreticno delo, za rezultate simulacij in stevilne uporabnenasvete.
Hvala tudi Ivanu Kvasicu, Silvanu Mendizzi, Silviji Pirs, Dr. Janezu Pirsu, Dr. LauriRamon Gimenez, Dr. Poloni Umek, Dr. Blazu Zupancicu, Dr. Eriku Zupanicu, Niki Kosir,Dr. Fumitu Araoki, Prof. Dr. Hideu Takezoi, Dr. Manci Logar, Mag. Slavku Kralju, Dr.Stanetu Pajku, Prof. Dr. Slavku Pecarju, Dr. Polonci Ropret, Dr. Danielu Biglinu, Prof.Dr. Janezu Strancaru, Doc. Dr. Zoranu Arsovu in Dr. Tilnu Koklicu za pomoc pri majhnih,ampak zato nic manj pomembnih detajlih, brez katerih moje delo ne bi bilo mogoce.
Hvala Andreji Erste in Dr. Eriku Zupanicu za LATEX predlogo, ki mi je olajsala pisanjedoktorske disertacije.
Na koncu se iskreno zahvaljujem mojim starsem Marjanu in Veri, dedku Milanu, kottudi Maji za neprecenljivo podporo. Njim tudi posvecam to doktorsko disertacijo.

102 Zahvala

103
8 References
[1] Vahala, K. J. Optical microcavities. Nature 424, 839–846 (2003).
[2] Painter, O.; Lee R. K., Scherer A., Yariv A., O’Brien J. D., Dapkus P. D., Kim I. Two-dimensional photonic band-gap defect mode laser. Science 284, 1819–1821 (1999).
[3] Jewell, J. L.; McCall, S. L.; Lee, Y. H.; Scherer, A.; Gossard, A. C.; English, J.H. Lasing characteristics of GaAs microresonators. Appl. Phys. Lett. 54, 1400–1402(1989).
[4] Treussart, F.; Dubreuil, N.; Knight, J. C.; Sandoghdar, V.; Hare, J.; Lefcvre-Seguin,V.; Raimond, J.-M.; Haroche, S. Microlasers based on silica microspheres. Ann.Telecommun. 52, 557–568 (1997).
[5] Cao, W.; Munoz, A.; Palffy-Muhoray, P.; Taheri, B. Lasing in a three-dimensionalphotonic crystal of the liquid crystal blue phase II. Nat. Mater. 1, 111–113 (2002).
[6] Noginov, M. A.; Zhu, G.; Belgrave, A. M.; Bakker, R.; Shalaev, V. M.; Narimanov, E.E.; Stout, S.; Herz, E.; Suteewong, T.; Wiesner, U. Demonstration of a spaser-basednanolaser. Nature 460, 1110–1112 (2009).
[7] Hill, M. T.; Oei, Y.-S.; Smalbrugge, B.; Zhu, Y.; de Vries, T.; van Veldhoven, P. J.;van Otten, F. W. M.; Eijkemans, T. J.; Turkiewicz, J. P.; de Waardt, H.; Geluk,E. J.; Kwon, S.-H.; Lee, Y.-H.; Notzel, R.; Smit, M. K. Lasing in metallic-coatednanocavities. Nat. Photonics 1, 589–594 (2007).
[8] Ashkin, A.; Dziedzic, J. M. Observation of resonances in the radiation pressure ondielectric spheres. Phys. Rev. Lett. 38, 1351–1354 (1977).
[9] Vernooy, D. W.; Ilchenko, V. S.; Mabuchi, H.; Streed, E. W.; Kimble, H. J. High-Qmeasurements of fused-silica microspheres in the near infrared. Opt. Lett. 23, 247–249(1998).
[10] Armani, A.; M. Kulkarni, R. P.; Fraser, S. E.; Flagan, R. C.; Vahala, K. J. Label-free,single-molecule detection with optical microcavities. Science 317, 783–787 (2007).
[11] Chang, R. K.; Campillo, A. J. Optical Processes in Microcavities (World Scientific,Singapore, 1998).
[12] Maune, B.; Lawson, R.; Gunn, C.; Scherer, A.; Dalton, L. Electrically tunable ringresonators incorporating nematic liquid crystals as cladding layers. Appl. Phys. Lett.83, 4689–4691 (2003).
[13] Piegdon, K. A.; Matthias, H.; Meier, C.; Kitzerow, H.-S. Tunable optical propertiesof photonic crystals and semiconductor microdisks using liquid crystals. Proc. SPIEInt. Soc. Opt. Eng. 6911, 69110J (2008).

104 References
[14] Wang, T.-J.; Chu, C.-H.; Lin, C.-Y. Electro-optically tunable microring resonators onlithium niobate. Opt. Lett. 32, 2777–2779 (2007).
[15] Kiraz, A.; Karadag, Y.; Coskun, A. F. Spectral tuning of liquid microdroplets standingon superhydrophobic surface using electrowetting. Appl. Phys. Lett. 92, 191104 (2008).
[16] von Klitzing, W.; Long, R.; Ilchenko, V. S.; Hare, J.; Lefevre-Seguin, V. Tunablewhispering gallery modes for spectroscopy and CQED experiments. New. J. Phys. 3,14.1–14.14 (2001).
[17] Ma, Q.; Rossmann, T.; Guo, Z. Whispering-gallery mode silica microsensors for cryo-genic to room temperature measurement. Meas. Sci. Technol. 21, 025310–025317(2010).
[18] Dong, C.-H.; He, L.; Xiao, Y.-F.; Gaddam, V. R.; Ozdemir, S. K.; Han, Z.-F.; Guo,G.-C.; Yang, L. Fabrication of high-Q polydimethylsiloxane optical microspheres forthermal sensing. Appl. Phys. Lett. 94, 231119 (2009).
[19] Saito, M.; Shimatani, H.; Naruhashi, H. Tunable whispering gallery mode emissionfrom a microdroplet in elastomer. Opt. Express 16, 11915–11919 (2008).
[20] Ioppolo, T.; Kozhevnikov, M.; Stepaniuk, V.; Otugen, M. V.; Sheverev, V. Micro-optical force sensor concept based on whispering gallery mode resonators. Appl. Optics47, 3009–3014 (2008).
[21] Vollmer, F. Resonant Detection of Nano to Microscopic Objects Using WhisperingGallery Modes (Thesis, Rockefeller University, New York, 2004).
[22] Vollmer, F.; Arnold, S. Whispering-gallery-mode biosensing: label-free detection downto single molecules. Nat. Methods 5, 591–596 (2008).
[23] Heebner, J. E.; Grover, R.; Ibrahim, T.; Ibrahim, T. A. Optical Microresonators:Theory, Fabrication, And Applications (Springer, London, 2008).
[24] Mukaiyama, T.; Takeda, K.; Miyazaki, H.; Jimba, Y.; Kuwata-Gonokami, M. Tight-binding photonic molecule modes of resonant bispheres. Phys. Rev. Lett. 82, 4623–4626(1999).
[25] Rakovich, Y. P.; Donegan, J. F.; Gerlach, M.; Bradley, A. L.; Connolly, T. M.; Boland,J. J.; Gaponik, N.; Rogach, A. Fine structure of coupled optical modes in photonicmolecules. Phys. Rev. A 70, 051801–051801 (2004).
[26] Poon, J. K. S.; Zhu, L.; DeRose, G. A.; Yariv, A. Polymer microring coupled-resonatoroptical waveguides. J. Lightwave Technol. 24, 1843–1849 (2006).
[27] Chen, Z.; Taflove, A.; Backman, V. Highly efficient optical coupling and transportphenomena in chains of dielectric microspheres. Opt. Lett. 31, 389–391 (2006).
[28] Shaw, A.; Roycroft, B.; Hegarty, J.; Labilloy, D.; Benisty, H.; Weisbuch, C.; Krauss,T. F.; Smith, C. J. M.; Stanley, R.; Houdre, R.; Oesterle, U. Lasing properties ofdisk microcavity based on a circular Bragg reflector. Appl. Phys. Lett. 75, 3051–3053(1999).
[29] Scheuer, J.; Green, W. M. J.; DeRose, G. A.; Yariv, A. InGaAsP annular Bragglasers: theory, applications and modal properties. IEEE J. Sel. Top. Quant. 11, 476–484 (2005).

References 105
[30] Scheuer, J.; Green, W. M. J.; DeRose, G.; Yariv, A. Low-threshold two-dimensionalannular Bragg lasers. Opt. Lett. 29, 2641–2643 (2004).
[31] Sullivan, K. G.; Hall, D. G. Radiation in spherically symmetric structures, I. Thecoupled-amplitude equations for vector spherical waves. Phys. Rev. A 50, 2701–2707(1994).
[32] Brady, D.; Papen, G.; Sipe, J. E. Spherical distributed dielectric resonators. J. Opt.Soc. Am. B 10, 644–657 (1993).
[33] Burlak, G. N. Optical radiation from coated microsphere with active core. Phys. Lett.A 299, 94–101 (2002).
[34] Xu, Y.; Liang, W.; Yariv, A.; Fleming, J. G.; Lin, S.-Y. Modal analysis of Bragg onionresonators. Opt. Lett. 29, 424–426 (2004).
[35] Tandaechanurat, A.; Ishida, S.; Aoki, K.; Guimard, D.; Nomura, M.; Iwamoto, S.;Arakawa, Y. Demonstration of high-Q (>8600) three-dimensional photonic crystalnanocavity embedding quantum dots. Appl. Phys. Lett. 94, 171115 (2009).
[36] Gourevich, I.; Field, L. M.; Wei, Z.; Paquet, C.; Petukhova, A.; Alteheld, A.; Ku-macheva, E.; Saarinen, J. J.; Sipe, J. E. Polymer multilayer particles: A route tospherical dielectric resonators. Macromolecules 39, 1449–1454 (2006).
[37] Scheuer, J. Radial Bragg lasers: optimal design for minimal threshold levels and en-hanced mode discrimination. J. Opt. Soc. Am. B 24, 2178–2184 (2007).
[38] de Gennes, P. G.; Prost, J. The Physics of Liquid Crystals, 2nd ed. (Oxford Science,Oxford, 1993).
[39] Song, M.; Park, B.; Nishimura, S.; Toyooka, T.; Chung, I.; Takanishi, Y.; Ishikawa,K.; Takezoe, H. Electrotunable non-reciprocal laser emission from a liquid-crystalphotonic device. Adv. Funct. Mater. 16, 1793–1798 (2006).
[40] Hands, P. J. W.; Morris, S. M.; Wilkinson, T. D.; Coles, H. J. Two-dimensional liquidcrystal laser array. Opt. Lett. 33, 515–517 (2008).
[41] Munoz, A.F.; Palffy-Muhoray, P.; Taheri, N. Ultraviolet lasing in cholesteric liquidcrystals. Opt. Lett. 26, 804–806 (2001).
[42] Moreira, M. F.; Carvalho, I. C. S.; Cao, W.; Bailey, C.; Taheri, B.; Palffy-Muhoray P.Cholesteric liquid-crystal laser as an optic fiber-based temperature sensor. Appl. Phys.Lett. 85, 2691–2693 (2004).
[43] Morris, S. M.; Ford, A. D.; Pivnenko, M. N.; Coles, H. J. Enhanced emission fromliquid crystal lasers. J. Appl. Phys. 97, 023103 (2005).
[44] Humar, M.; Skarabot, M.; Ravnik, M.; Zumer, S.; Poberaj, I.; Babic, D.; Musevic I.Electrically tunable diffraction of light from 2D nematic colloidal crystals. Eur. Phys.J. E 27, 73–79 (2008).
[45] Drzaic, P. S. Liquid Crystal Dispersions (World Scientific, Singapore, 1995).
[46] Doane, J. W.; Vaz, N. A.; Wu, B.-G.; Zumer, S. Field controlled light scattering fromnematic microdroplets. Appl. Phys. Lett. 48, 269–271 (1986).
[47] Hands, P. J. W.; Gardiner, D. J.; Morris, S. M.; Mowatt, C.; Wilkinson, T. D.; Coles,H. J. Band-edge and random lasing in paintable liquid crystal emulsions. Appl. Phys.Lett. 98, 141102 (2011).

106 References
[48] Lee, C.-R.; Lin, S.-H.; Guo, C.-H.; Chang, S.-H.; Mo, T.-S.; Chu, S.-C. All-opticallycontrollable random laser based on a dye-doped polymer-dispersed liquid crystal withnano-sized droplets. Opt. Express 18, 2406–2412 (2010).
[49] Kopp, V. I.; Fan, B.; Vithana, H. K. M.; Genack, A. Z. Low-threshold lasing at theedge of a photonic stop band in cholesteric liquid crystals. Opt. Lett. 23, 1707–1709(1998).
[50] Taheri, B.; Munoz, A.; Palffy-Muhoray P.; Twieg, R. Low threshold lasing incholesteric liquid crystals. Mol. Cryst. Liq. Cryst. 358, 73–82 (2001).
[51] Alvarez, E.; He, M.; Munoz, A. F.; Palffy-Muhoray, P.; Serak, S. V.; Taheri, B.; Tweig,R. Mirrorless lasing and energy transfer in cholesteric liquid crystals doped with dyes.Mol. Cryst. Liq. Cryst. 369, 75–82 (2001).
[52] Ford, A. D.; Morris, S. M.; Coles, H. J. Photonics and lasing in liquid crystals. Mater.Today 9, 36–42 (2006).
[53] Jeong, S. M.; Ha, N. Y.; Takanishi, Y.; Ishikawa, K.; Takezoe, H.; Nishimura, S.;Suzaki, G. Defect mode lasing from a double-layered dye-doped polymeric cholestericliquid crystal films with a thin rubbed defect layer. Appl. Phys. Lett. 90, 261108(2007).
[54] Araoka, F.; Shin, K.-C.; Takanishi, Y.; Ishikawa, K.; Takezoe, H.; Zhu, Z.; Swager,T. M. How doping a cholesteric liquid crystal with polymeric dye improves an orderparameter and makes possible low threshold lasing. J. Appl. Phys. 94, 279–283 (2009).
[55] Coles, H.; Morris, S. Liquid-crystal lasers. Nat. Photonics 4, 676–685 (2010).
[56] Rasing, T.; Musevic, I. Surfaces and Interfaces of Liquid Crystals (Springer, Berlin,Heidelberg, New York, 2004).
[57] Brake, J. M.; Daschner, M. K.; Abbott, N. L. Formation and characterization of phos-pholipid monolayers spontaneously assembled at interfaces between aqueous phasesand thermotropic liquid crystals. Langmuir 21, 2218–2228 (2005).
[58] Brake, J. M.; Daschner, M. K.; Luk, Y. Y.; Abbott, N. L. Biomolecular interactionsat phospholipid-decorated surfaces of liquid crystals. Science 302, 2094–2097 (2003).
[59] Luk, Y. Y.; Tingey, M. L.; Dickson, K. A.; Raines, R. T.; Abbott, N. L. Imaging thebinding ability of proteins immobilized on surfaces with different orientations by usingliquid crystals. J. Am. Chem. Soc. 126, 9024–9032 (2004).
[60] Jang, C.-H.; Cheng, L.-L.; Olsen, C. W.; Abbott, N. L. Anchoring of nematic liquidcrystals on viruses with different envelope structures. Nano Lett. 6, 1053–1058 (2006).
[61] Sivakumar, S.; Wark, K. L.; Gupta, J. K.; Abbott, N. L.; Caruso, F. Liquid crystalemulsions as the basis of biological sensors for the optical detection of bacteria andviruses. Adv. Funct. Mater. 19, 2260–2265 (2009).
[62] Kinsinger, M. I.; Sun, B.; Abbott, N. L.; Lynn, D. M. Reversible control of orderingtransitions at aqueous/liquid crystal interfaces using functional amphiphilic polymers.Adv. Mater. 19, 4208–4212 (2007).
[63] Shah, R. R.; Abbott, N. L. Principles for measurement of chemical exposure basedon recognition-driven anchoring transitions in liquid crystals. Science 293, 1296–1299(2001).

References 107
[64] Lockwood, N. A.; Abbott, N. L. Self-assembly of surfactants and phospholipids atinterfaces between aqueous phases and thermotropic liquid crystals. Current Opinionin Colloid & Interface Science 10, 111–120 (2005).
[65] Gupta, J. K.; Zimmerman, J. S.; de Pablo, J. J.; Caruso, F.; Abbott, N. L. Characteri-zation of adsorbate-induced ordering transitions of liquid crystals within monodispersedroplets. Langmuir 25, 9016–9024 (2009).
[66] Tjipto, E.; Cadwell, K. D.; Quinn, J. F.; Johnston, A. P. R.; Abbott, N. L.; Caruso, F.Tailoring the interfaces between nematic liquid crystal emulsions and aqueous phasesvia layer-by-layer assembly. Nano Lett. 6, 2243–2248 (2006).
[67] Lin, I-H.; Miller, D. S.; Bertics, P. J.; Murphy, C. J.; de Pablo, J. J.; Abbott, N. L.Endotoxin-induced structural transformations in liquid crystalline droplets. Science332, 1297–1300 (2011).
[68] Poulin, P.; Stark, H.; Lubensky, T. C.; Weitz, D. A. Science 275, 1770–1773 (1997).
[69] Musevic, I.; Skarabot, M.; Tkalec, U.; Ravnik, M.; Zumer, S. Two-dimensional nematiccolloidal crystals self-assembled by topological defects. Science 313, 954–958 (2006).
[70] Ravnik, M.; Skarabot, M.; Zumer, S.; Tkalec, U.; Poberaj, I.; Babic, D.; Osterman,N.; Musevic, I. Entangled nematic colloidal dimers and wires. Phys. Rev. Lett. 99,247801 (2007).
[71] Skarabot, M.; Ravnik, M.; Zumer, S.; Tkalec, U.; Poberaj, I.; Babic, D.; Musevic,I. Hierarchical self-assembly of nematic colloidal superstructures. Phys. Rev. E 77,061706 (2008).
[72] Tkalec, U.; Ravnik, M.; Copar, S.; Zumer, S.; Musevic, I. Reconfigurable knots andlinks in chiral nematic colloids. Science 333, 62–65 (2011).
[73] Ognysta, U.; Nych, A. B.; Skarabot, M.; Musevic, I. 3D dipolar structure in nematicliquid crystal. In: Book of abstracts of the 11th European Conference on Liquid Crys-tals. O62 (Maribor, 2011).
[74] Wua, S.-T. Absorption measurements of liquid crystals in the ultraviolet, visible, andinfrared. J. Appl. Phys. 84, 4462–4465 (1998).
[75] Spillane, S. M. Fiber-coupled Ultra-high-Q Microresonators for Nonlinear and Quan-tum Optics (Thesis, California Institute of Technology, Pasadena, 2004).
[76] Tona, M. Study on Spherical Microlasers Levitated in an Ion Trap (Thesis, KochiUniversity of Technology, 2002).
[77] Novotny, L.; Hesht, B. Principles of Nano-Optics, (Cambridge University Press, Cam-bridge, 2006).
[78] Bohren, C. F.; Huffman, D. R. Absorption and Scattering of Light by Small Particles(Wiley Science, New York, 1998).
[79] Lam, C. C.; Leung, P. T.; Young, K. Explicit asymptotic formulas for the positions,widths, and strengths of resonances in Mie scattering. J. Opt. Soc. Am. B 9, 1585–1592(1992).
[80] Schiller, S. Asymptotic expansion of morpliological resonance frequencies in Mie scat-tering. Appl. Optics 32, 2181–2185 (1993).

108 References
[81] Gorodetsky M. L.; Fomin A. E., Geometrical theory of whispering-gallery modes.IEEE J. Sel. Top. Quant. 12, 33–39 (2006).
[82] Cohoon, D.K. An exact solution of Mie type for scattering by a multilayer anisotropicsphere. J. Electromagnet. Wave. 3, 421–448 (1989).
[83] Humar, M.; Ravnik, M.; Pajk, S.; Musevic, I. Electrically tunable liquid crystal opticalmicroresonators. Nat. Photonics 3, 595–600 (2009).
[84] Hecht, E. Optics (Addison Wesley, San Francisco, 2002).
[85] Saleh, B. E. A.; Teich, M. C. Fundamentals of Photonics (Wiley-Interscience, NewYork, 1991).
[86] Kaliteevski, M. A.; Brand, S.; Abram, R. A.; Nikolaev, V. V. Optical eigenmodes ofa multilayered spherical microcavity. J. Mod. Optic. 48, 1503–1516 (2001).
[87] Sun X.; Yariv, A. Surface-emitting circular DFB, disk- and ring- Bragg resonatorlasers with chirped gratings: a unified theory and comparative study. Opt. Express16, 9155–9164 (2008).
[88] Yang, D.-K.; Wu, S.-T. Fundamentals of Liquid Crystals Devices (John Wiley & SonsLtd, Chichester, 2006).
[89] Li, J.; Wen, C.-H.; Gauza, S.; Lu, R.; Wu, S.-T. Refractive indices of liquid crystalsfor display applications. IEEE/OSA J. Disp. Technol. 1, 51–61 (2005).
[90] http://www.sigmaaldrich.com/ (accessed November 2011).
[91] Lockwood, N. A.; Gupta, J. K.; Abbott, N. L. Self-assembly of amphiphiles, polymersand proteins at interfaces between thermotropic liquid crystals and aqueous phases.Surf. Sci. Rep. 63, 255–293 (2008).
[92] Hamlington, B. D.; Steinhaus, B.; Feng, J. J.; Link, D.; Shelley, M. J.; Shen, A. Q.Liquid crystal droplet production in a microfluidic device. Liq. Cryst. 34, 861–870(2007).
[93] Stark, H. Physics of colloidal dispersions in nematic liquid crystals. Phys. Rep. 351,387–474 (2001).
[94] Smalyukh, I. I.; Shiyanovskii, S. V.; Lavrentovich, O. D. Three-dimensional imaging oforientational order by fluorescence confocal polarizing microscopy. Chem. Phys. Lett.336, 88–96 (2001).
[95] Bodnar, V. G.; Lavrentovich, O. D.; Pergamenshchik, V. M. Threshold of structuralhedgehog-ring transition in drops of a nematic in an alternating electric field. Sov.Phys. JETP 74, 60–67 (1992).
[96] Gu, Y.; Abbott, N. L. Observation of Saturn-ring defects around solid microspheresin nematic liquid crystals. Phys. Rev. Lett. 85, 4719–4722 (2000).
[97] Eversole, J. D.; Lin, H-B.; Campillo, A. J. Input/output resonance correlation inlaser-induced emission from microdroplets. J. Opt. Soc. Am. B 12, 287–296 (1995).
[98] Demus, D. (ed.); Goodby, J. (ed.); Gray, G. W. (ed.); Spiess, H.-W. (ed.); Vill V. (ed.)Handbook of Liquid Crystals, Vol. 1: Fundamentals (Wiley-VCH, Weinheim, 1998).
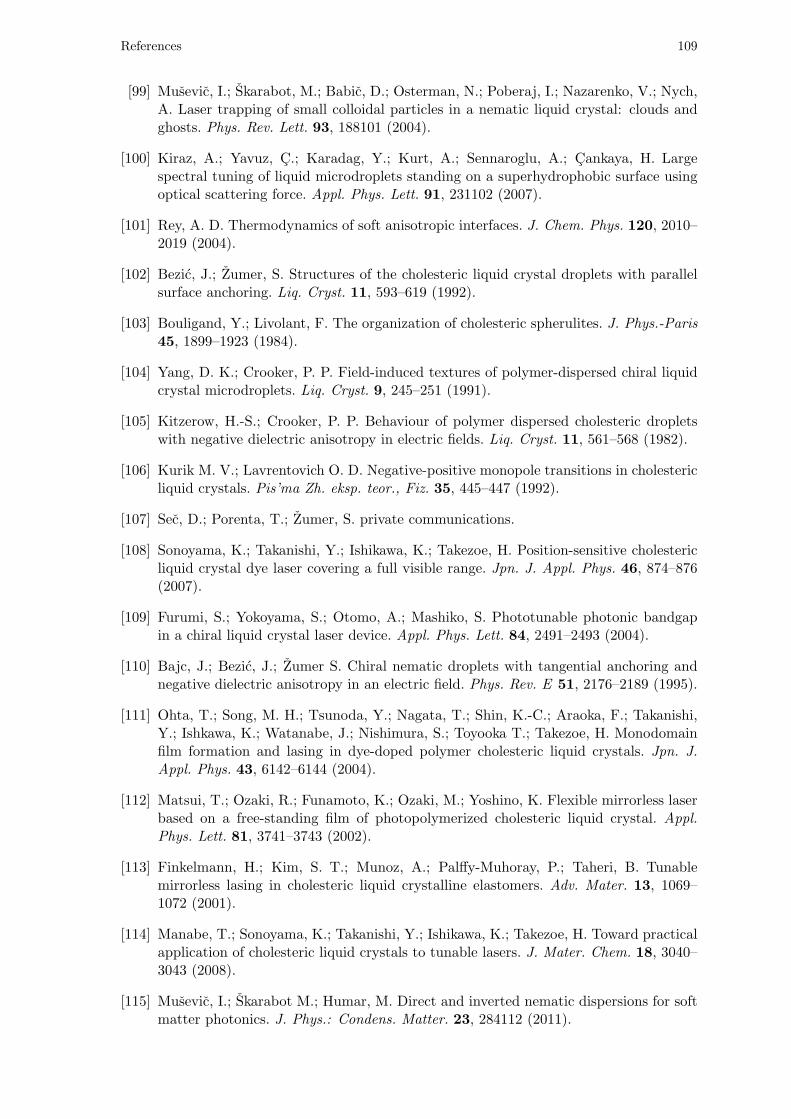
References 109
[99] Musevic, I.; Skarabot, M.; Babic, D.; Osterman, N.; Poberaj, I.; Nazarenko, V.; Nych,A. Laser trapping of small colloidal particles in a nematic liquid crystal: clouds andghosts. Phys. Rev. Lett. 93, 188101 (2004).
[100] Kiraz, A.; Yavuz, C.; Karadag, Y.; Kurt, A.; Sennaroglu, A.; Cankaya, H. Largespectral tuning of liquid microdroplets standing on a superhydrophobic surface usingoptical scattering force. Appl. Phys. Lett. 91, 231102 (2007).
[101] Rey, A. D. Thermodynamics of soft anisotropic interfaces. J. Chem. Phys. 120, 2010–2019 (2004).
[102] Bezic, J.; Zumer, S. Structures of the cholesteric liquid crystal droplets with parallelsurface anchoring. Liq. Cryst. 11, 593–619 (1992).
[103] Bouligand, Y.; Livolant, F. The organization of cholesteric spherulites. J. Phys.-Paris45, 1899–1923 (1984).
[104] Yang, D. K.; Crooker, P. P. Field-induced textures of polymer-dispersed chiral liquidcrystal microdroplets. Liq. Cryst. 9, 245–251 (1991).
[105] Kitzerow, H.-S.; Crooker, P. P. Behaviour of polymer dispersed cholesteric dropletswith negative dielectric anisotropy in electric fields. Liq. Cryst. 11, 561–568 (1982).
[106] Kurik M. V.; Lavrentovich O. D. Negative-positive monopole transitions in cholestericliquid crystals. Pis’ma Zh. eksp. teor., Fiz. 35, 445–447 (1992).
[107] Sec, D.; Porenta, T.; Zumer, S. private communications.
[108] Sonoyama, K.; Takanishi, Y.; Ishikawa, K.; Takezoe, H. Position-sensitive cholestericliquid crystal dye laser covering a full visible range. Jpn. J. Appl. Phys. 46, 874–876(2007).
[109] Furumi, S.; Yokoyama, S.; Otomo, A.; Mashiko, S. Phototunable photonic bandgapin a chiral liquid crystal laser device. Appl. Phys. Lett. 84, 2491–2493 (2004).
[110] Bajc, J.; Bezic, J.; Zumer S. Chiral nematic droplets with tangential anchoring andnegative dielectric anisotropy in an electric field. Phys. Rev. E 51, 2176–2189 (1995).
[111] Ohta, T.; Song, M. H.; Tsunoda, Y.; Nagata, T.; Shin, K.-C.; Araoka, F.; Takanishi,Y.; Ishkawa, K.; Watanabe, J.; Nishimura, S.; Toyooka T.; Takezoe, H. Monodomainfilm formation and lasing in dye-doped polymer cholesteric liquid crystals. Jpn. J.Appl. Phys. 43, 6142–6144 (2004).
[112] Matsui, T.; Ozaki, R.; Funamoto, K.; Ozaki, M.; Yoshino, K. Flexible mirrorless laserbased on a free-standing film of photopolymerized cholesteric liquid crystal. Appl.Phys. Lett. 81, 3741–3743 (2002).
[113] Finkelmann, H.; Kim, S. T.; Munoz, A.; Palffy-Muhoray, P.; Taheri, B. Tunablemirrorless lasing in cholesteric liquid crystalline elastomers. Adv. Mater. 13, 1069–1072 (2001).
[114] Manabe, T.; Sonoyama, K.; Takanishi, Y.; Ishikawa, K.; Takezoe, H. Toward practicalapplication of cholesteric liquid crystals to tunable lasers. J. Mater. Chem. 18, 3040–3043 (2008).
[115] Musevic, I.; Skarabot M.; Humar, M. Direct and inverted nematic dispersions for softmatter photonics. J. Phys.: Condens. Matter. 23, 284112 (2011).

110 References
[116] Musevic, I.; Humar, M. Tunable liquid crystal optical microcavities. Proceedings ofSPIE 7955, 795509 (2011).
[117] Humar, M.; Musevic, I. Surfactant sensing based on whispering-gallery-mode lasingin liquid-crystal microdroplets. Opt. Express 19, 19836–19844 (2011).
[118] Tanyeri, M.; Perron, R.; Kennedy, I. M. Lasing droplets in a microfabricated channel.Opt. Lett. 32, 2529–2531 (2007).
[119] Humar, M.; Musevic, I. 3D microlasers from self-assembled cholesteric liquid-crystalmicrodroplets. Opt. Express 18, 26995–27003 (2010).
[120] Won, R. Liquid crystals: Tiny tunable 3D lasers. Nat. Photonics 5, 133 (2011).

111
Index of Figures
1 Schematics of WGMs . . . . . . . . . . . . . . . . . . . . . . . . . . . . . . . . 2
2 Two examples of tunable WGM resonators . . . . . . . . . . . . . . . . . . . 3
3 Silica microtoroid resonator used for biosensing . . . . . . . . . . . . . . . . . 4
4 CROW simulation . . . . . . . . . . . . . . . . . . . . . . . . . . . . . . . . . 5
5 2D Bragg microcavity laser . . . . . . . . . . . . . . . . . . . . . . . . . . . . 6
6 CLC laser . . . . . . . . . . . . . . . . . . . . . . . . . . . . . . . . . . . . . . 7
7 LC sensor on hard surface interface . . . . . . . . . . . . . . . . . . . . . . . . 8
8 LC sensor on fluid interface . . . . . . . . . . . . . . . . . . . . . . . . . . . . 9
9 Proposed CROW structure made from nematic colloids . . . . . . . . . . . . 11
10 Electric field intensity distributions in the equatorial plane of the sphere forTE WGMs with l = m = 30 and n = 1, 2 and 3 . . . . . . . . . . . . . . . . . 17
11 Radial light intensity for TE WGMs with l = m = 60 and n = 1, 2 and 3 . . . 19
12 Three basic types of spherical Bragg microcavities . . . . . . . . . . . . . . . 24
13 Intensities for two Bragg defect modes . . . . . . . . . . . . . . . . . . . . . . 25
14 LC molecule orientation . . . . . . . . . . . . . . . . . . . . . . . . . . . . . . 25
15 Refractive indices of E12 as the temperature is increased . . . . . . . . . . . . 28
16 Two types of anchoring of a NLC . . . . . . . . . . . . . . . . . . . . . . . . . 29
17 Dye molecules . . . . . . . . . . . . . . . . . . . . . . . . . . . . . . . . . . . . 32
18 Schematics of the optical setup . . . . . . . . . . . . . . . . . . . . . . . . . . 35
19 Photo of the optical setup . . . . . . . . . . . . . . . . . . . . . . . . . . . . . 37
20 Microfluidic setup for chemical sensing . . . . . . . . . . . . . . . . . . . . . . 38
21 Experimental setup for angle dependence measurements . . . . . . . . . . . . 39
22 Experimental setup for 3D laser polarization measurements . . . . . . . . . . 40
23 Experimental setup for strain tuning measurements . . . . . . . . . . . . . . . 41
24 Dispersion of E12 droplets in PDMS under crossed polarizers . . . . . . . . . 43
25 Radial NLC droplet . . . . . . . . . . . . . . . . . . . . . . . . . . . . . . . . 44
26 Assembly of liquid-crystal droplets in PDMS . . . . . . . . . . . . . . . . . . 44
27 Two examples of tubes formed from E12 LC when mixed with PDMS . . . . 45
28 A LC shell . . . . . . . . . . . . . . . . . . . . . . . . . . . . . . . . . . . . . . 45
29 Schematic view of WGMs in a LC droplet . . . . . . . . . . . . . . . . . . . . 46
30 False color image of fluorescent light intensity from a LC droplet . . . . . . . 47
31 Spectrum od fluorescent light captured from a LC droplet . . . . . . . . . . . 47
32 Fiber excitation of WGMs in LC droplets . . . . . . . . . . . . . . . . . . . . 48
33 WGM polarization schematics in LC droplets . . . . . . . . . . . . . . . . . . 48
34 WGM spectra at different polarizations . . . . . . . . . . . . . . . . . . . . . 49
35 Fluorescence images at different polarizations . . . . . . . . . . . . . . . . . . 50
36 Spectra of fluorescent light from two E12 droplets in PDMS . . . . . . . . . . 51
37 Nematic droplet director configuration under applied electric field . . . . . . . 54
38 Schematic drawing of the light circulation in a LC droplet . . . . . . . . . . . 54

112 Index of Figures
39 WGM spectrum versus applied electric field . . . . . . . . . . . . . . . . . . . 5540 WGM tunability as a function of droplet diameter . . . . . . . . . . . . . . . 5541 Intensity oscillation under field . . . . . . . . . . . . . . . . . . . . . . . . . . 5642 Tunability of two droplets . . . . . . . . . . . . . . . . . . . . . . . . . . . . . 5743 Images of a droplet with in-plane field . . . . . . . . . . . . . . . . . . . . . . 5844 Tunability with in-plane field . . . . . . . . . . . . . . . . . . . . . . . . . . . 5845 A LC droplet containing pericles . . . . . . . . . . . . . . . . . . . . . . . . . 5946 Temperature tunability of WGMs . . . . . . . . . . . . . . . . . . . . . . . . . 6147 Calculation of temperature tunability of WGMs (large droplet) . . . . . . . . 6248 Calculation of temperature tunability of WGMs (small droplet) . . . . . . . . 6249 WGM spectra at two temperatures. . . . . . . . . . . . . . . . . . . . . . . . 6350 Image of a LC droplet with increasing temperature . . . . . . . . . . . . . . . 6451 Linewidth and Q-factor as a function of temperature . . . . . . . . . . . . . . 6552 Optical tuning of WGMs . . . . . . . . . . . . . . . . . . . . . . . . . . . . . . 6653 Optical manipulation of the LC in a droplet . . . . . . . . . . . . . . . . . . . 6754 Images and WGM positions of a LC droplet under increasing strain . . . . . 7055 Artist impression of a WGM LC chemical sensor . . . . . . . . . . . . . . . . 7156 Sequence of LC droplets at increasing SDS concentration . . . . . . . . . . . 7257 Fluorescent spectra for radial and bipolar droplets . . . . . . . . . . . . . . . 7358 Lasing intensity for radial and bipolar droplets . . . . . . . . . . . . . . . . . 7459 Lasing spectrum as the concentration is increased . . . . . . . . . . . . . . . . 7560 Lasing spectrum as water and SDS ar added . . . . . . . . . . . . . . . . . . . 7661 Fluorescent spectrum in a non-lasing regime . . . . . . . . . . . . . . . . . . . 7662 CLC droplets micrographs . . . . . . . . . . . . . . . . . . . . . . . . . . . . . 7763 An artist’s impression of a 3D CLC laser . . . . . . . . . . . . . . . . . . . . . 7864 CLC droplet director configuration simulation . . . . . . . . . . . . . . . . . . 7965 Transmission through a CLC droplet: simulation and experiment . . . . . . . 8066 Emission of light from a 3D laser when the intensity of the pump laser is
gradually increased . . . . . . . . . . . . . . . . . . . . . . . . . . . . . . . . . 8167 Optical properties of a spherical CLC laser . . . . . . . . . . . . . . . . . . . 8268 Temporal spectral properties of a spherical CLC laser . . . . . . . . . . . . . 8369 Lasing properties as a function of droplet diameters . . . . . . . . . . . . . . 8470 Lasing and reflection spectrum . . . . . . . . . . . . . . . . . . . . . . . . . . 8471 Polarization measurements of the 3D laser . . . . . . . . . . . . . . . . . . . . 8572 Angle dependance of lasing . . . . . . . . . . . . . . . . . . . . . . . . . . . . 8673 A micrograph of a CLC laser from different view directions . . . . . . . . . . 8674 Temperature tunability . . . . . . . . . . . . . . . . . . . . . . . . . . . . . . 8775 Lasing of higher Bragg modes in longer pitch droplets . . . . . . . . . . . . . 8876 Lasing of higher Bragg modes and WGM lasing in longer pitch droplets . . . 8977 WGM and Bragg thresholds . . . . . . . . . . . . . . . . . . . . . . . . . . . . 9078 Polymerized CLC spherical laser . . . . . . . . . . . . . . . . . . . . . . . . . 9179 Output intensity versus input intensity of single laser pulses . . . . . . . . . . 9280 A CLC spherical laser with included particles . . . . . . . . . . . . . . . . . . 93
81 Ferroelectric LC droplets in PDMS . . . . . . . . . . . . . . . . . . . . . . . . 11582 Lasing in ferroelectric LC droplets . . . . . . . . . . . . . . . . . . . . . . . . 11683 Electric field switching in ferroelectric LC droplets . . . . . . . . . . . . . . . 11684 Photonic molecules . . . . . . . . . . . . . . . . . . . . . . . . . . . . . . . . . 11785 Time response of the 3D laser . . . . . . . . . . . . . . . . . . . . . . . . . . . 119

Index of Tables 113
Index of Tables
1 Properties of LCs . . . . . . . . . . . . . . . . . . . . . . . . . . . . . . . . . . 312 Carrying materials . . . . . . . . . . . . . . . . . . . . . . . . . . . . . . . . . 33

114 Index of Tables

115
Appendix A: Further observations
In the appendix I will give some additional preliminary experimental results of the not yetfinished work and the results that do not have good enough explanation.
Lasing and switching in ferroelectric LCs
Ferroelectric liquid crystals are known for their fast switching under applied electric field.Therefore, they could be a good candidate as a material for droplets used for WGM micro-cavities instead of nematic LCs. We introduced nile red fluorescent dye into a ferroelectricliquid crystal (SmC*, Kingston Chemicals) and mixed it with PDMS. The ratios of the ma-terials and the mixing procedures were the same as with nematic droplets (Section 4.1). Theproduced droplets are unfortunately not completely spherical and their internal structure isalso in majority of cases full of defect lines (Figure 81). Some smaller droplets, have how-ever nice structure with a diametral defect line, extending from one surface of the droplets,through the center, to the other surface.
Figure 81: Ferroelectric LC droplets in PDMS. Most of the droplets do not have a nice sphericalshape or they contain defect structures. Scale bar 20µm.
We have illuminated the droplets with the CW Ar-ion laser to excite the WGMs. How-ever, in the fluorescent spectrum from a single droplet we did not observe any spectral peaks.We than used the pulsed Nd:YAG doubled laser as an excitation source. In this case wehave observed several spectral lines (Figure 82). The lines appear in groups, indicating anon-spherical shape of the droplet.
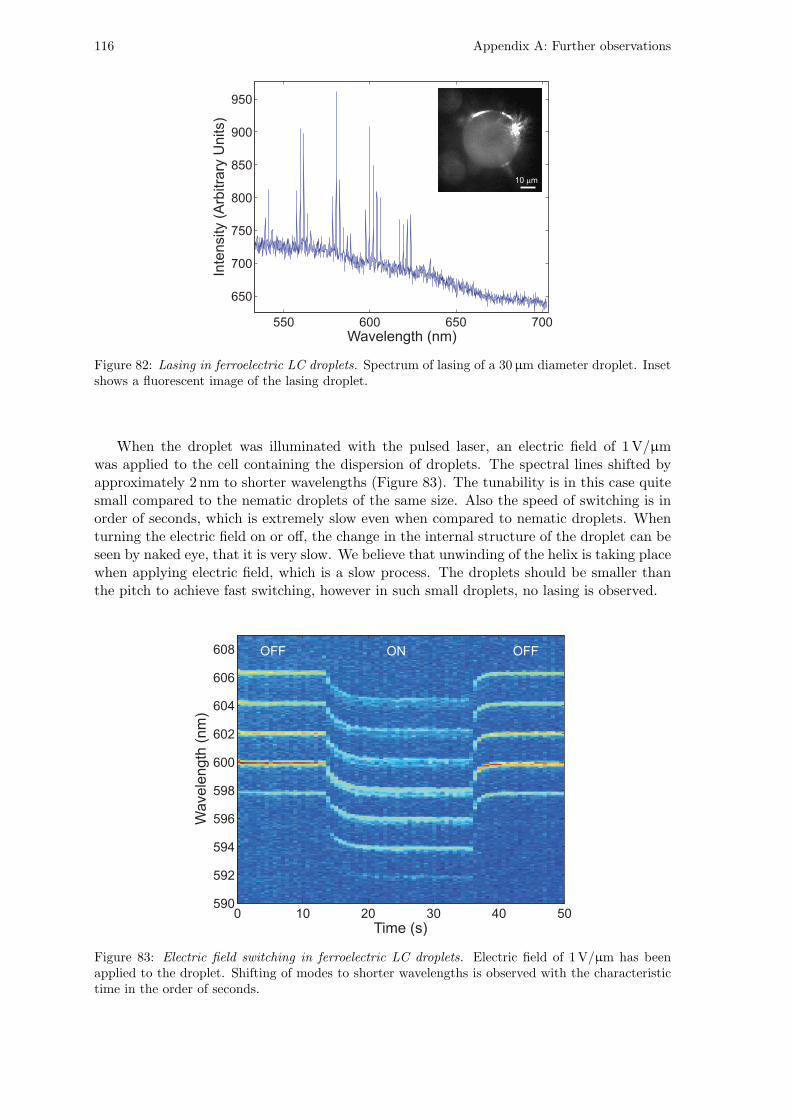
116 Appendix A: Further observations
Figure 82: Lasing in ferroelectric LC droplets. Spectrum of lasing of a 30µm diameter droplet. Insetshows a fluorescent image of the lasing droplet.
When the droplet was illuminated with the pulsed laser, an electric field of 1V/µmwas applied to the cell containing the dispersion of droplets. The spectral lines shifted byapproximately 2 nm to shorter wavelengths (Figure 83). The tunability is in this case quitesmall compared to the nematic droplets of the same size. Also the speed of switching is inorder of seconds, which is extremely slow even when compared to nematic droplets. Whenturning the electric field on or off, the change in the internal structure of the droplet can beseen by naked eye, that it is very slow. We believe that unwinding of the helix is taking placewhen applying electric field, which is a slow process. The droplets should be smaller thanthe pitch to achieve fast switching, however in such small droplets, no lasing is observed.
Figure 83: Electric field switching in ferroelectric LC droplets. Electric field of 1V/µm has beenapplied to the droplet. Shifting of modes to shorter wavelengths is observed with the characteristictime in the order of seconds.

Appendix A: Further observations 117
Photonic molecules
The idea was to couple two WGM microcavities and observe tunneling of light from one toanother and the splitting of their modes because of coupling. To achieve resonant transferof light, at least one mode from one microcavity should match one other mode in the othermicrocavity. With tunable WGMs in liquid-crystal droplets this is easy to achieve by usingelectric field. Two droplets of different size have different tunabilities and with increasingthe electric field, there is a great chance that two modes will match (Section 4.3.3). To havea simpler system we have used 10µm non-tunable fluorescent solid melamine formaldehyde(MF) particles and non-fluorescent E12 LC droplets. Both the solid particles and the LCwere mixed into the PDMS forming a dispersion of both solid and liquid particles. In somecases a droplet was in close contact with a solid particle (Figure 84a). The separationbetween both could be also controlled by using the IR laser tweezers. The fluorescent MFparticle was illuminated by the CW Ar-ion laser and the spectrum was collected from the LCdroplet. As the electric field was increased, the positions of WGMs were analyzed (Figure84b). Instead of a continuous variation of the frequencies of WGMs, steps are observed. Thiscould indicate mode splitting because of coupling of modes in the two resonators. However,further measurements with higher resolution spectrometer have to be performed to confirmthe results.
Figure 84: Photonic molecules. a) A fluorescent 10µm MF particle in contact with an E12 LCdroplet in PDMS. b) Positions of WGMs in the droplet with the MF particle being excited while theelectric field is increased.
Measuring spectral width of WGMs using a Fabriy-Perot in-terferometer
To measure the Q-factor of WGMs in nematic LC crystal, we have used a spectrometerwith the resolution of 0.05 nm. We have found that the spectral width of WGMs is thesame or below this resolution. To use a higher resolution spectrometer of the same kind isnot convenient because of the large size and price of such a device. Other methods couldbe used such as coupling of a droplet with a tapered fiber and using a narrow line tunablelaser (Section 2.2.5.1). Other method would be to use a Fabriy-Perot interferometer. Theinterferometer is made similarly as a laser cavity with two highly reflective mirrors. Only thelight that matches a mode inside the resonator is transmitted through the interferometer.One mirror is connected to a piezo actuator so that the modes in the cavity are scanned over

118 Appendix A: Further observations
the whole FSR of the interferometer. The interferometer is useful just to measure spectralfeatures that are narrower than its FSR. In the other case the spectral features can overlap.The idea is to use the spectrometer as a monochromator that can pass to its output onlya very narrow spectral region. A single WGM line can be selected by rotating the gratingand by choosing the appropriate output slit width. This single line is then sent through thescanning interferometer to a photomultiplier.
Unfortunately when performing this experiment, the intensity of this single spectral linewas so weak, that just noise was detected on the photomultiplier. To get better signal, theWGMs should be exited above the lasing threshold to achieve higher intensity, as well as alock-in amplifier should be used at the output of the photomultiplier.
Pulse length of the 3D laser
We have also measured pulse length of the 3D laser and compared it to the pulse lengthof the spontaneous fluorescence (that is below the lasing threshold) and the pulse length ofthe Q-switched Nd:YAG excitation laser. We have used a fast photodiode and a 2.5GHzoscilloscope (LeCray, WavePro 725Zi). A single CLC droplet was excited in the same wayas for previous experiments and the generated light was sent through an optical fiber to thephotodiode.
First, pulse length of the excitation laser (blue line) was measured. The results areshown in Figure 85. After the main pulse, a second pulse can be observed, which we believeoriginates from the photodiode and the amplifier. After the second pulse the signal alsogoes to negative values, which can not be attributed to the signal from the laser, but anartifact from the electronics. The length of the first pulse is 3 ns. The specified pulse lengthof the Q-switched laser given by the manufacturer is below 1 ns. We can conclude thatthe photodiode is not fast enough for this measurements. Regardless of this, a slightlydifferent time response can be measured for the light emitted by a 3D laser compared to theexcitation pulse. Below the lasing threshold (green line), the pulse length becomes longer inagreement to the typical fluorescence lifetime of the organic dyes. Above the lasing threshold(red line) the pulse length is shorter than for fluorescence. In this case, one would expectlonger pulse length, since the light is trapped in the resonator and does not escape so fast.However, for the 3D laser line spectral width of 0.1 nm, the Q-factor equals 6000 and thecorresponding photon lifetime in the resonator using (2) is of 0.002 ns. This is three ordersof magnitude faster than the fluorescence lifetime and does not contribute to the results. Onthe other hand, it is obvious that the laser pulse from the CLC laser should be shorter thanthe fluorescence lifetime, since after long time, most of the excited molecules spontaneouslydecay into lower states and the population inversion no longer exists.

Appendix A: Further observations 119
Figure 85: Time response of the 3D laser. Normalized intensity on a fast photodiode of a singlepulse for the three cases: the Q-switched excitation laser and the 3D laser below the lasing thresholdand above the lasing threshold.

120 Appendix A: Further observations

121
Appendix B: Bibliography
List of publications related to this dissertation
• Humar, M.; Ravnik, M.; Pajk, S.; Musevic. I. Electrically tunable liquid crystal opticalmicroresonators. Nat. Photonics 3, 595–600 (2009).
• Humar, M.; Musevic, I. 3D microlasers from self-assembled cholesteric liquid crystalmicrodroplets. Opt. Express 18, 26995–27003 (2010).
• Musevic, I.; Skarabot, M.; Humar, M. Direct and inverted nematic dispersions for softmatter photonics. J. Phys.: Condens. Matter. 23, 284112 (2011).
• Musevic, I.; Humar, M. Tunable liquid crystal optical microcavities. Proceedings ofSPIE 7955, 795509-1–795509-8 (2011).
• Humar, M.; Musevic, I. Surfactant sensing based on whispering-gallery-mode lasingin liquid-crystal microdroplets. Opt. Express 19, 19836–19844 (2011).
List of patents related to this dissertation
• Musevic, I.; Humar, M. Kroglasti tekocekristalni laser: patentna prijava P-201000377.Ljubljana: Urad RS za intelektualno lastnino, 2010.
• Musevic, I.; Humar, M. Spherical liquid-crystal laser: International Patent Applica-tion, PCT/EP2011/005607, 2011.