LIQUID ALUMINIUM CORROSION CHARACTERISTICS OF CAST IRON ...
319
LIQUID ALUMINIUM CORROSION CHARACTERISTICS OF CAST IRON AND STEEL A Thesis Submitted to the Department of Mechanical Engineering University of Canterbury By Mandeep Singh Sidhu IN PARTIAL FULFILLMENT OF THE REQUIREMENTS FOR THE DEGREE OF DOCTOR OF PHILOSOPHY IN MECHANICAL ENGINEERING 2012
Transcript of LIQUID ALUMINIUM CORROSION CHARACTERISTICS OF CAST IRON ...
LIQUID ALUMINIUM CORROSION
CHARACTERISTICS OF CAST IRON AND STEEL
A Thesis
Submitted to the Department of Mechanical Engineering
University of Canterbury
By
Mandeep Singh Sidhu
IN PARTIAL FULFILLMENT OF THE REQUIREMENTS FOR THE
DEGREE OF DOCTOR OF PHILOSOPHY
IN
MECHANICAL ENGINEERING
2012


i
Preface
This thesis is submitted as a partial requirement for the degree of Doctor of Philosophy
in Mechanical Engineering in the University of Canterbury. This research was conducted
under the supervision of Professor Milo V. Kral in the Department of Mechanical
Engineering, University of Canterbury, between October 2007 and August 2011.
A part of this work has been published in:
M.S. Sidhu, M.V. Kral, Erosion of Ferrous Alloys by Liquid Aluminum, Light Metals,
TMS Annual Meeting, Seattle, WA, USA, (2010) 325-330.
Acknowledgements
Numerous individuals contributed to make the realization of this project possible.
Firstly, the author wishes to express his gratitude to Professor Milo V. Kral, in addition
to his generous offer of PhD research, his patience, steadfast encouragement, and
personal support will long be appreciated. The author expresses his heartfelt thanks to
Dr. Catherine Bishop for providing insight, guidance and sharing her wealth of
knowledge in writing this thesis.
I want to thank New Zealand Aluminium Smelters and Blaine Morch for providing, not
only the financial support, but also the useful information pertaining to this project. I
also greatly appreciate the cooperation of Eric Colins and Eric Jack from Buchanan
Foundry, and Ian Close from Casting Shop for preparing the cast iron compositions.
Also, I want to thank work-shop staff; Scott Amies, Ken Brown, David Read and Jim
McLean for fabricating the parts of test set ups and test specimens, and for allowing me
to operate the workshop machines. I am thankful to Kevin Stobbs and Mike Flaws for
their help in laboratory work and electron microscopy. A very special thanks to Julian
ii
Philips - departmental electronics technician - his timely help in repairing and preparing
the parts of the test set ups is highly appreciated. I also thank fellow students; Takanori
Sato, Daniel Drabble, Karl Buchanan and Pawan Kumar for helping whenever I asked.
I am also thankful to Members of the University of Canterbury Materials Engineering
Group (MEG): Dr. Mark Staiger, Emeritus Professor Les Erasmus, Mike Flaws, and
Kevin Stobbs; MEG visitors, Dr. Chris Hutchinson and Professor Anil Saigal; and fellow
MEG students, for all their help, discussions and comments.
A special thanks to my wife, Rupinder. Without her encouragement and sacrifices, I
could never have undertaken such a daunting task. Thanks to my parents for their love
and continual encouragement, but especially to my father whose drive and determination
have always been an inspiration to me. I am thankful everyone else too; my teachers,
relatives, colleagues and friends, who motivated me and inspired me throughout my life.
iii
Abstract
Cast iron and steel alloys are commonly used for tooling and structural components in Al
production, Al die-casting and the aluminizing industry due to their favourable
properties including high strength, good formability and low cost. However, the liquid
Al corrosion of these materials is one of the crucial concerns in maintaining the efficient
production.
Al is produced by the electrolytic smelting of alumina. Cast iron and/or cast steel pipes -
commonly known as „tapping pipes‟ - are used to extract the liquid Al produced by
smelting. Tapping pipes mainly degrade by material loss because liquid Al reacts with
nearly all metals. Failure of tapping pipes is a significant contributor to the maintenance
expenses; therefore, the primary aim of this research is to develop a material to enhance
the life time of tapping pipes.
Various test methods were developed in order to examine the effect of molten Al
environment on cast iron and steel alloys. The corrosion resistance of these alloys was
determined under different conditions of Al flow and temperature. The intermetallic
compounds formed by exposing the ferrous to liquid Al were characterized using the
Energy Dispersive X-ray Spectroscopy (EDS) and Electron Back Scatter Diffraction
(EBSD) techniques. The formation, growth and nature of reaction products were
revealed to establish a link to the liquid Al corrosion resistance.
A relationship between the chemical composition and liquid Al corrosion resistance of
cast irons could not established in the past. In the present work, the corrosion rate was
found to depend upon the graphite morphology and fraction of each Fe-C phase of cast
iron matrix, which can be controlled by selecting the chemical composition. Moreover,
present research suggested the guidelines for producing a cast iron with enhanced liquid
iv
Al corrosion resistance. The presence of C-rich phases, graphite flakes and cementite
was found to be effective in enhancing the liquid Al corrosion resistance of gray cast
irons. Conversely, a higher Si content was found to enhance the susceptibility of cast
irons to liquid Al corrosion.
The corrosion mechanisms for ferrous alloys in liquid Al are not fully understood. Thus
the subsequent analysis of the dissolution data was supported by investigating the
reaction products formed between Al and substrate materials. In addition to commonly
existent ε-Fe2Al5 and ζ-FeAl3 phases, the formation of Al4C3 and κ-Fe3AlC compounds
was confirmed for the first time in the intermetallic layers of ferrous alloys. The Fe 3Si
phase in the intermetallic layers of high Si cast irons was found, which was believed to
facilitate the high corrosion rates of high Si cast irons. Moreover, the mechanism by
which C in Fe-substrates affects the liquid Al corrosion resistance can be better
understood given the present work.
Furthermore, the analysis presented here gives an understanding of the nature, growth
and dissolution of intermetallic compounds in several cast iron alloys. Higher Si
additions to cast irons played an important role in molten metal corrosion by accelerating
the material loss and changing the nature of intermetallic layers. The results of this study
clearly indicated that the dissolution and the growth of intermetallic compounds are
interrelated and the dissolution and/or spallation of the intermetallic layers may be the
primary mode of liquid Al corrosion of ferrous alloys.
v
Table of Contents
CHAPTER 1 : INTRODUCTION AND BACKGROUND 1
1.1 Research Overview 4
1.2 Research Objective 5
1.3 Format of Thesis 6
1.4 Background 8
1.4.1 Al Smelting 8
1.4.2 Tapping Pipes and Service Conditions 9
1.4.3 Failure of Tapping Pipes 12
1.4.4 Material Properties 20
CHAPTER 2 : LITERATURE REVIEW 23
Introduction 23
2.1 Cast Irons 23
2.1.1 GCIs 24
2.1.2 DCIs 30
2.1.3 Elevated Temperature Properties of Gray and Ductile Cast Irons 32
2.2 Formation and Growth Kinetics of Fe-Al Intermetallics 35
2.2.1 Fe-Al Binary System 35
2.2.2 Intermetallic Compounds of Fe-Al Interaction 39
2.2.3 Growth Kinetics of Fe-Al Intermetallic Compounds 49
2.3 Dissolution of Ferrous Alloys in Al Melts 59
2.3.1 Dissolution and Hydrodynamics 60
2.3.2 Dissolution Test Apparatuses 63
2.3.3 Rotating Disc Method for Fe-Liquid Al Systems 67
2.3.4 Corrosion by Diffusion and Spallation of the Intermetallic Layers 72
2.3.5 Comparing the Liquid Al Corrosion Resistance of Ferrous Alloys 73
2.3.6 Boronizing Surface Treatment 79
2.4 Concluding Remarks 81
CHAPTER 3 : EXPERIMENTAL METHODS AND MATERIALS 88
Introduction 88
3.1 Materials 88
3.1.1 Material Selection 88
3.1.2 Compositions and Microstructures 90
vi
3.2 Experimental Methods 102
3.2.1 Dynamic Corrosion Test Apparatus (Method-I) 102
3.2.2 Method for Characterizing Formation and Growth of Intermetallic Compounds
(Method-II) 106
3.3 Boronizing 110
CHAPTER 4 : RESULTS 112
Introduction 112
4.1 Characteristics of the Dynamic Corrosion Test Apparatus 112
4.2 Comparative Liquid Al Corrosion Resistance 113
4.2.1 GCIs 114
4.2.2 DCIs 116
4.2.3 Steels 117
4.3 Identification of Intermetallic Phases 118
4.3.1 Laboratory Materials 119
4.3.2 After-service Materials 145
4.4 Intermetallic Layer Growth 153
4.4.1 Determining Mean Intermetallic Layer Thickness 154
4.4.2 Mean Intermetallic Layer Thickness and Time Relationship 160
4.5 Dissolution and Intermetallic Layer Growth Kinetics 163
4.6 Morphology of the Intermetallic Layers 168
4.6.1 2D Morphology of the Intermetallic Layer 168
4.6.2 3D Morphology of the Intermetallic Layer 171
CHAPTER 5 : DISCUSSION 179
Introduction 179
5.1 Liquid Al Corrosion Resistance of Cast Irons and Steels 179
5.1.1 Cast Irons and Corrosion Resistance 179
5.1.2 GCIs 180
5.1.3 DCIs 189
5.1.4 Steels 192
5.1.5 Comparing DCIs, GCIs and Steel 193
5.1.6 Effect of Boronizing 195
5.2 Liquid Al Corrosion Characteristics of Ferrous Alloys 196
5.2.1 Mechanisms of Liquid Al Corrosion 196
5.2.2 Si Enrichment 202
vii
5.2.3 Concentration Distribution of Alloying Elements 203
5.3 Alloy Specific Mechanisms of Compound Formation and Liquid Al Corrosion204
5.3.1 GCIs 204
5.3.2 DCIs 216
5.3.3 Steels 223
5.3.4 Comparison of Corrosion Compounds in Ex-service and Laboratory Materials225
5.4 Intermetallic Layer Growth 226
5.4.1 Comparing GCIs, DCIs and CS 227
5.4.2 GCIs 229
5.4.3 DCIs 230
5.4.4 CS 230
5.5 Intermetallic Layer Growth and Dissolution Kinetics 231
5.6 Comparing Intermetallic Layer Growth and Corrosion Rates 234
5.6.1 Mean Intermetallic Layer Thickness at 950°C 234
5.6.2 Intermetallic Layer Growth Behaviour at 750°C and 950°C 235
5.7 Role of Si in Liquid Al Corrosion of Ferrous Alloys 237
5.7.1 Dissolution and Growth of Intermetallic Layers 237
5.7.2 Morphology of Intermetallic Layers 240
CHAPTER 6 : CONCLUSIONS 245
6.1 Liquid Al Corrosion Resistance and Chemical Composition 245
6.2 Intermetallic Compounds and Liquid Al Corrosion Resistance 247
6.3 Intermetallic Layer Growth and Dissolution 249
CHAPTER 7 : RECOMMENDATIONS TO INDUSTRY AND FUTURE WORK252
7.1 Materials Recommendations 252
7.1.1 Bottom Tapping Pipe 252
7.1.2 Top Tapping Pipe 252
7.2 Future Work 254
APPENDIX A : THERMAL FATIGUE RESISTANCE OF GRAY AND DUCTILE
CAST IRONS 256
A.1 Literature Review 256
A.1.1 Types of Thermal Fatigue Failures 256
A.1.2 Material Properties Affecting the Thermal Fatigue Resistance of Cast Irons 257
A.1.3 Thermal Fatigue Resistance of Cast Irons 259
viii
A.1.4 Evaluation of Thermal Fatigue Resistance 264
A.2 Service Conditions 265
A.3 Experimental Methods and Materials 266
A.3.1 Materials 266
A.3.2 Test Methods 266
A.4 Results and Discussion 275
A.4.1 Test Method- I 275
A.4.2 Test Method-II 281
A.5 Final Thoughts 284
A.6 Conclusions 285
APPENDIX B : EFFECT OF SURFACE CONDITION ON LIQUID Al CORROSION
RESISTANCE OF CAST IRONS 288
APPENDIX C : CHARACTERISTICS OF THE DYNAMIC CORROSION TEST
APPARATUS 294
APPENDIX D : EFFECT OF BORONIZING ON LIQUID Al CORROSION
RESISTANCE OF STEEL AND CAST IRONS 299
ix
Table of Figures
Figure 1.1 - A schematic of an Al smelting cell [16] and the application of tapping pipes in
transferring the liquid metal. ................................................................................................... 9
Figure 1.2 - The tapping pipe assembly (Lines 1-3). ............................................................ 10
Figure 1.3 - Thermal gradients at the top tapping pipe surface, a) before the start of a tapping
operation, b) during a tapping operation. .............................................................................. 12
Figure 1.4 - a) A hole through the top tapping pipe wall, b) an after-service bottom tapping
pipe section. .......................................................................................................................... 13
Figure 1.5 - Solidified bath layers on an ex-service top tapping pipe surface. ..................... 14
Figure 1.6 - Thickness of solidified-bath on top tapping pipe sections - arranged in order of
increasing distance from the top end (outlet). ....................................................................... 15
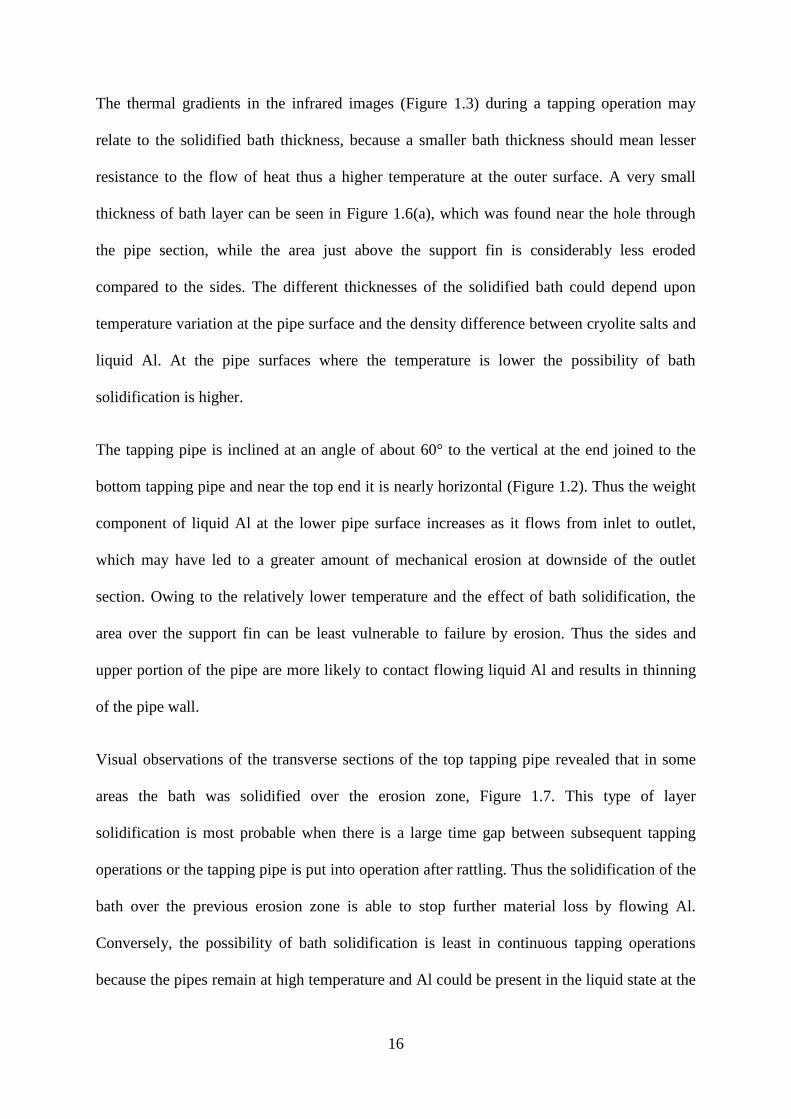
Figure 1.7 - Solidification of the bath over the erosion zone in the ex-service top tapping pipe.
............................................................................................................................................... 17
Figure 1.8 - An example of erosion patterns on the entire inner surface of an ex-service top
tapping pipe. .......................................................................................................................... 18
Figure 1.9 - Erosion pits formed by accelerated material loss at the place of failure in ex-
service top tapping pipe. ....................................................................................................... 18
Figure 1.10 - Continuous intermetallic layer at the surface of an ex-service steel tapping pipe
adjacent to the failure zone. .................................................................................................. 19
Figure 1.11 - A BSE image showing the bottom tapping pipe (GCI)/bath interface. ........... 19
Figure 2.1- Iron-iron carbide binary phase diagram [1]. ...................................................... 24
Figure 2.2 - Typical solidification cooling curve for a hypoeutectic GCI. [After [4]] ........ 26
Figure 2.3 - Graphite flakes in GCI (deep-etched in 50% HNO3). ....................................... 27
Figure 2.4 - Dispersion of graphite spheroids in a ferritic DCI (deep-etched with 50% HNO3).
............................................................................................................................................... 30
Figure 2.5 - Fe-Al binary phase diagram. [After [16]] ......................................................... 36
Figure 2.6 - A high contrast BSE image showing the formed ε-Fe2Al5 and ζ-FeAl3
compounds on a DCI substrate. ............................................................................................ 41
Figure 2.7 - A schematic of the reaction-diffusion mechanism of compound formation
between two solids. [After [36]] ........................................................................................... 50
Figure 2.8 - Intermetallic layer thickness versus square root of immersion time at 700°C,
750°C, 800°C and 850°C, a) C05 steel, b) C45 steel, c) C88 steel. [After [33]] .................. 52
Figure 2.9 - Square of intermetallic thickness plotted against time for 800ºC. [After [47]] 54
Figure 2.10 - A schematic of dissolution of solid into liquid by Nernst-Shchukarev concept.
............................................................................................................................................... 61
Figure 2.11 - A schematic of the rotating disc method. ........................................................ 65
Figure 2.12 - a) The USP-II apparatus for studying the dissolution of tablets under forced
convection, b) dissolution versus time for USP salicyclic acid calibrator tablets in a water-
sodium hydroxide solution at 100 rpm. [After [52]] ............................................................. 66
x
Figure 2.13 - Variation in dissolution constant (K) with time for pure Fe specimens rotated at
63.1 rpm in Al melts at 700° C under vacuum. [After [59]] ................................................. 68
Figure 2.14 - ln (CS-Co/CS-C) plotted against St/V for pure Fe in liquid Al at 700°C and at
about 229 rpm, flux was used to protect the melt against oxidation. [After [37]] ................ 69
Figure 2.15 - Weight loss of specimens of several ferrous materials in liquid Al melts at
800ºC and 900ºC tested by BCIRA/BNFRA (# annealed condition). [After [64]] .............. 75
Figure 2.16 - Comparative corrosion resistance of downspouts subjected to flowing liquid Al
at 800°C. [After [64]] ............................................................................................................ 77
Figure 2.17 - Mass transfer coefficients (k) of various ferrous alloys subjected to static liquid
Al. [After [65]] ...................................................................................................................... 78
Figure 3.1 - Optical image of GCI-S etched with alkaline sodium picrate, cementite appears
brown. ................................................................................................................................... 91
Figure 3.2 - Optical images of Series-I cast irons, a) GCI-A, b) GCI-B, c) GCI-S, d) DCI-C,
e) DCI-D, f) DCI-T. B) CS (etched with 2% Nital).............................................................. 96
Figure 3.3 - Phase fractions of ferrite, cementite, graphite in Series-I cast iron alloys. ....... 96
Figure 3.4 - Light optical micrographs of Series-II alloys, a) GCI-E, b) GCI-F, c) GCI-BT, d)
GCI- L e) AISI 4140, f) AISI W1 (etched with 2% Nital). ................................................ 100
Figure 3.5 - Fractions of cementite and graphite in Series-II GCIs. ................................... 101
Figure 3.6 - A schematic of test apparatus for determining the corrosion resistance of ferrous
alloys under forced flow. .................................................................................................... 103
Figure 3.7 - Photograph of cast iron specimens for corrosion testing under forced flow... 104
Figure 3.8 - A schematic of static immersion test apparatus for determining the intermetallic
layer growth characteristics. ............................................................................................... 107
Figure 3.9 - Photograph of the specimen for the formation and growth analysis of the
intermetallic compounds. .................................................................................................... 108
Figure 4.1 - Mass dissolution rate (R′) of Series-I GCIs under static and forced flow (0.48
m/s) melt conditions at 850°C and 950°C. ......................................................................... 114
Figure 4.2 - Mass dissolution rates (R′) of Series-I and Series-II GCIs under forced flow
(0.48m/s) at 950°C. ............................................................................................................. 115
Figure 4.3 - Mass dissolution rate (R′) of Series-I DCIs under static and forced flow (0.48
m/s) melt conditions at 850°C and 950°C. ......................................................................... 116
Figure 4.4 - Mass dissolution rate (R′) of CS under static and forced flow (0.48 m/s) melt
conditions at 850°C and 950°C. .......................................................................................... 117
Figure 4.5 - Mass dissolution rates (R′) of steel alloys at 950°C under forced flow (0.48 m/s).
............................................................................................................................................. 118
Figure 4.6 - An example of an intermetallic layer formed in laboratory samples. ............. 119
Figure 4.7 - ζ-FeAl3 particles at a GCI-A specimen (950°C-2400s-static). ....................... 120
Figure 4.8 - Magnified image of area „A‟ in Figure 4.7. .................................................... 121
Figure 4.9 - ζ-FeAl3 particles at a CS specimen (950C-60s-static). ................................... 121
xi
Figure 4.10 - SEM image showing the intermetallic layer at a CS specimen (750°C-1200s-
static) for EBSD analysis. ................................................................................................... 122
Figure 4.11 - CS specimen (750°C-1200s-static), a) EBSD map of ε-Fe2Al5, b) inverse pole
figures for ε-Fe2Al5. Reference data source [5] .................................................................. 123
Figure 4.12 - ζ-FeAl3/ε-Fe2Al5 interface on CS specimen (750°C-1200s-static). .............. 124
Figure 4.13 - CS specimen (750°C-1200s-static), a) EBSD map of ε-Fe2Al5/ζ-FeAl3 interface, b) inverse pole figures for ζ-FeAl3. Reference data source [5] ........................................... 124
Figure 4.14 - Si K-α X-ray maps of GCIs specimens showing SEP (bright zones) at 850°C
and 950°C (1200s-static). ................................................................................................... 126
Figure 4.15 - Si K-α X-ray maps of DCIs showing SEP (bright zones) at 850°C and 950°C
(1200s-static)....................................................................................................................... 127
Figure 4.16 - Si content of the cast iron matrix versus Si concentration of the SEP (950°C-
1200s-static). ....................................................................................................................... 127
Figure 4.17 - EDS profiles of various alloying elements across the GCI-S/ε-Fe2Al5 interface
(950°C-1200s-static). .......................................................................................................... 128
Figure 4.18 - K-α X-ray intensity maps of showing distribution of various elements across the
DCI-C/ε-Fe2Al5 interface (950°C-1200s-static), a) BSE image b) Fe, c) Al, d) Si, e) Mn.
(Brighter the colour higher the concentration) .................................................................... 129
Figure 4.19 - EDS profiles of alloying elements across the CS/ ε-Fe2Al5 interface (850°C-
1200-static). ........................................................................................................................ 130
Figure 4.20 - BSE image of the intermetallic layer between GCI-S and Al (950°C-1200s-
static). .................................................................................................................................. 131
Figure 4.21 - An image of the cementite/ε-Fe2Al5 interface in Figure 4.20 showing the
needle-shaped particles (Al4C3). ......................................................................................... 132
Figure 4.22 - Al4C3 particles in the GCI-S specimen (950°C-7200s-static). ...................... 132
Figure 4.23 - EBSD pattern of the Al4C3 particle shown in Figure 4.22 ............................ 133
Figure 4.24 - EDS results of the Al4C3 particle shown in Figure 4.22. .............................. 133
Figure 4.25 - Intermetallic layers at the GCI/ε-Fe2Al5 interface (950°C-static), a) GCI-S,
2400s, b) GCI-A, 2400s, c) GCI-S, 7200s, d) GCI-A, 7200s. ............................................ 134
Figure 4.26 - EBSD pattern at location „L2‟ in Figure 4.25(c), indexed as κ-Fe3AlC. ...... 135
Figure 4.27 - a) BSE image of GCI-S specimen (950ºC-7200-static), b) 3D EDS map of Si K-
α X-ray intensity distribution at an area of specimen in Figure 4.27 (a). ........................... 136
Figure 4.28 - Intermetallic layer at a GCI-B specimen (950°C-7200s-static). ................... 137
Figure 4.29 - Schematic of the area for determining the phase fraction of Al4C3. ............. 138
Figure 4.30 - BSE images of cast iron/ε-Fe2Al5 interface (950°C-1200s-static), a) DCI-C, b)
DCI-T. ................................................................................................................................. 139
Figure 4.31 - (a) BSE image of intermetallic layer between DCI-T and Al (850ºC-1200s
static), (b) particles (likely to be Al4C3) in the magnified area „A‟ of Figure 4.31(a). ....... 140
Figure 4.32 - a) BSE image of the CS intermetallic layer (950°C-2400s-static), b) EDS
spectrum at beam location „A‟ in Figure 4.32 (a). .............................................................. 141
xii
Figure 4.33 - BSE images showing EDS scan locations on substrate/ε-Fe2Al5 interfaces of
AISI-4140 specimens, a) 950°C-2400s-static and b) 950°C-7200s-static. ......................... 143
Figure 4.34 - BSE images showing EDS scan locations on substrate/ε-Fe2Al5 interfaces of
AISI-W1 specimens, a) 950°C-2400s-static and b) 950°C-7200s-static. ........................... 144
Figure 4.35 - An example of black particles (possibly Al4C3) dispersed in the ε-Fe2Al5 layer
adjacent to the AISI-4140 substrate (2400s-static). ............................................................ 145
Figure 4.36 - An optical image of a CS sample cross-section obtained from an after-service
top tapping pipe................................................................................................................... 146
Figure 4.37 - A high magnification SEM image of the ε-Fe2Al5/cast steel interface......... 147
Figure 4.38 - a) EBSD pattern at the beam location shown in Figure 4.37 indexed as ε-Fe2Al5, b) EDS spectrum of ε-Fe2Al5.............................................................................................. 147
Figure 4.39 - a) SEM image of the ε-Fe2Al5/Al interface showing ζ-FeAl3 particles
protruding towards solidified Al, b) ζ-FeAl3 particle in solidified Al. ............................... 148
Figure 4.40 - a) An example of an EBSD pattern obtained from beam locations shown in
Figure 4.39 that was indexed as ζ-FeAl3, b) EDS spectrum of ζ-FeAl3. ............................ 148
Figure 4.41 - BSE image of the region of interaction between GCI-BT and the liquid Al bath.
............................................................................................................................................. 149
Figure 4.42 - a) An optical image of GCI-BT/ε-Fe2Al5 interface, b) SEM image of a lath-
shaped particle in a matrix of β2-FeAl. ............................................................................... 150
Figure 4.43 - An EDS spectrum of the β2-FeAl phase layer in Figure 4.42(a). .................. 151
Figure 4.44 - (a) An example of the EBSD pattern of a lath-shaped particle, indexed as Al4C3,
(b) EDS spectrum of the Al4C3 particle shown in β2-FeAl phase in Figure 4.42 (b). ........ 151
Figure 4.45 - GCI-BT/ε-Fe2Al5 interface showing the beam locations for EBSD and EDS
analysis. ............................................................................................................................... 152
Figure 4.46 - EBSD pattern at the beam location „A‟ shown in Figure 4.45, indexed as δ-
FeAl2. .................................................................................................................................. 152
Figure 4.47 - EDS spectrum of δ-FeAl2 at beam location „A‟ in Figure 4.45. ................... 152
Figure 4.48 - EBSD pattern at beam location „B‟ shown in Figure 4.45, indexed as κ-Fe3AlC.
............................................................................................................................................. 153
Figure 4.49 - EDS spectrum at beam location „B‟ shown in Figure 4.45. .......................... 153
Figure 4.50 - BSE images of intermetallic layers, a) GCI-B, b) DCI-T, c) CS, obtained from
750°C-static specimens. ...................................................................................................... 155
Figure 4.51 - BSE images of intermetallic layers, a) GCI-B, b) DCI-T, c) CS, obtained from
850°C-static specimens. ...................................................................................................... 156
Figure 4.52 - BSE images of Intermetallic layers, a) GCI-B, b) DCI-T, c) CS, obtained from
950°C-static specimens. ...................................................................................................... 157
Figure 4.53 - A schematic for measuring the mean intermetallic layer (ε-Fe2Al5) thickness.
............................................................................................................................................. 158
Figure 4.54 - Mean intermetallic layer (ε-Fe2Al5) thickness v/s time plots of GCI-B, DCI-T
and CS specimens exposed to static liquid Al, a) 750°C, b) 850°C, c) 950°C. .................. 158
xiii
Figure 4.55 - Mean intermetallic layer (ε-Fe2Al5) thickness of cast irons and steel at 750°C,
850°C and 950°C, a) GCI-A, b) GCI-B, c) GCI-S, d) DCI-C, e) DCI-D, f) DCI-T, g) CS.160
Figure 4.56 - Log(x) v/s Log(t) plots at 750°C, 850°C and 950°C, a) GCI-A, b) GCI-B, c)
GCI-S, d) DCI-C, e) DCI-D, f) DCI-T, g) CS. ................................................................... 163
Figure 4.57 - Bi-directional growth of the intermetallic layer on a DCI-C specimen (850°C-
300s-static). ......................................................................................................................... 164
Figure 4.58 - A schematic for evaluating the dissolution of Fe-substrate in-terms of ε-Fe2Al5
thickness. ............................................................................................................................. 166
Figure 4.59 - Dependence of mean intermetallic layer thickness (x) and dissolution (dFe2Al5)
upon time (950°C-static), a) GCI-B, b) DCI-T, c) DCI-D, d) DCI-C. ............................... 167
Figure 4.60 - Morphology of the intermetallic layers of various cast iron alloys at 850°C, a)
600s-static, b) 1200s-static.................................................................................................. 169
Figure 4.61 - A schematic showing maxX and minX of an intermetallic layer. .................... 170
Figure 4.62 - Measured values of maxX and minX of GCIs, DCIs and CS. (Arranged left to
right in ascending order of corrosion rates) ........................................................................ 170
Figure 4.63 - Cross-section of an intermetallic layer of a CS specimen (850°C-1200s-static).
............................................................................................................................................. 172
Figure 4.64 - A deep-etched 3D image of the ε-Fe2Al5 intermetallic layer on CS specimen
(850°C-1200s-static). .......................................................................................................... 172
Figure 4.65 - SEM image showing the surface morphology of the ε-Fe2Al5 columns. ..... 173
Figure 4.66 - A 2-D image of a DCI-T specimen (750°C-1200s-static). ........................... 174
Figure 4.67 - Morphology of ε-Fe2Al5 columns on a DCI-T specimen (750°C-1200s-static).
............................................................................................................................................. 174
Figure 4.68 - A magnified image of a ε-Fe2Al5 column on a DCI-T specimen (750°C-1200s-
static). .................................................................................................................................. 175
Figure 4.69 - An SEI image showing beam locations for EDS analysis. ........................... 175
Figure 4.70 - EDS spectrums at beam locations shown in Figure 4.69, a) A, b) B. ........... 176
Figure 4.71 - Cross-section of a deep-etched DCI-C specimen (950°C-1200s-static). ...... 176
Figure 4.72 - A magnified view of a ε-Fe2Al5 crystal with a Fe3Si layer on a DCI-C specimen
(950°C-1200s-static). .......................................................................................................... 177
Figure 4.73 - An EDS spectrum of the Fe3Si layer in deep etched condition on a DCI-C
specimen (950°C-1200s-static). .......................................................................................... 177
Figure 5.1 - Comparing the chemical composition and corrosion resistance of GCIs from
literature and current work, a) 900°C-21600s-static [3], b) 950°C-3000s-0.48 m/s. ......... 182
Figure 5.2 - Average fraction of graphite, cementite and ferrite in GCIs from current work.
............................................................................................................................................. 183
Figure 5.3 - BSE images of cast iron microstructures, a) GCI-A, b) GCI-S (deep-etched with
50% HNO3 for 2 hours). ...................................................................................................... 184
xiv
Figure 5.4 - Ratios of corrosion rates of Series-I GCIs under different changes of conditions
of liquid Al exposure, a) Static, 950°C to 850°C, b) Forced, 950°C to 850°C, c) 850°C,
forced to static, d) 950°C, forced to static. ......................................................................... 188
Figure 5.5 - Si content and average fractions of ferrite and graphite (balance pearlite) in
DCIs. ................................................................................................................................... 190
Figure 5.6 - Ratios of corrosion rates of DCIs under different changed conditions of liquid Al
exposure, a) Static, 950°C to 850°C, b) Forced, 950°C to 850°C, c) 850°C, forced to static, d)
950°C, forced to static. ....................................................................................................... 191
Figure 5.7 - Graphite particles at the substrate/Al interface, a) GCI-A (950°C-1200s-0.48
m/s), b) DCI-C (850°C-1200s-0.48m/s). ............................................................................ 194
Figure 5.8 - Mass dissolution rates (R′) of selected cast irons and steel at 950°C-0.48 m/s.194
Figure 5.9 - Schematic of the dissolution of Fe into liquid Al, a) nucleation and reaction, b)
growth and dissolution. ....................................................................................................... 200
Figure 5.10 - A ζ-FeAl3 particle that was fractured during microhardness testing (CS, 950°C-
60s-static). ........................................................................................................................... 202
Figure 5.11 - A schematic representing various phases formed by GCI/liquid Al interaction.
............................................................................................................................................. 207
Figure 5.12 - A section of the ternary Fe-Al-C phase diagram at 5 at.% C. [After [31]] ... 208
Figure 5.13 - An isothermal section of ternary Fe-Al-C phase diagram at 800°C. [After [30]]
............................................................................................................................................. 209
Figure 5.14 - Pervoskite (κ) structure of Fe3AlC [34]. ....................................................... 211
Figure 5.15 - Optical image showing cementite, α-Fe(Al, Si) solid solution and β2-FeAl
layers on a GCI-S specimen (950°C-7200s-static). ............................................................ 214
Figure 5.16 - Si content of cast irons versus thickness of κ-Fe3AlC layer in GCIs. ........... 215
Figure 5.17 - A schematic of the corrosion phases formed in DCIs. .................................. 218
Figure 5.18 - A simplified Fe-Si binary phase diagram. [After [19]] ................................. 219
Figure 5.19 - D03 structure of Fe3Si [40]. ........................................................................... 220
Figure 5.20 - BSE images of intermetallic layers on DCI-C specimens, a) 850°C-1200s-0.48
m/s, b) 950°C-1200s-0.48 m/s, c) magnified area „c‟ (d) magnified area„d‟...................... 222
Figure 5.21 - BSE images of SEP on the DCI-C specimens, a) 850°C-1200s-static, b) 950°C-
1200-static. .......................................................................................................................... 222
Figure 5.22 - Solidified Al layer on test specimens (950°C-1200-static), a) cast steel (CS), b)
DCI-T, c) GCI-A, d) a magnified cross-section of GCI-A. ................................................ 227
Figure 5.23 - Mean Intermetallic layer thickness (xh) versus cementite fraction in GCIs. . 229
Figure 5.24 - Mean Intermetallic layer thickness (xh) versus ferrite fraction in DCIs. ...... 230
Figure 5.25 - a) Mean intermetallic layer thickness at 950°C-2400s-static (xd), Method-II, and
mass dissolution rate (R’) 950°C-0.48 m/s, Method-I. ....................................................... 235
Figure 5.26 - a) Mean intermetallic layer thickness versus Si content in cast irons (950°C-
1200s-static), b) Dissolution versus Si content in cast irons (950°C-1200s-static). ........... 239
xv
Figure A.1 - a) Thermal fatigue test apparatus, b) a view of rising liquid Al inside the test
pipe.......................................................................................................................................267
Figure A.2 - Automated vacuum control apparatus.............................................................268
Figure A.3 - A schematic showing the thermocouple positions on the test pipe cross-section
for temperature data logging................................................................................................269
Figure A.4 - Temperature versus time profile for the thermocouple locations shown in Figure
D.3.......................................................................................................................................269
Figure A.5 - Specimen for the thermal fatigue comparison of cast iron alloys...................270
Figure A.6 - Test Method -I thermal fatigue test apparatus.................................................271
Figure A.7 - Thermocouple locations on the specimen cross-section for temperature data
logging.................................................................................................................................272
Figure A.8 - Thermal cycle logging for the thermocouple locations shown in Figure
A.7.......................................................................................................................................272
Figure A.9 - Thermal fatigue test apparatus-II....................................................................274
Figure A.10 - A schematic of thermocouple locations for temperature data
logging.................................................................................................................................274
Figure A.11 - A closer view of a thermal fatigue specimen during a test...........................275
Figure A.12 - Time-temperature profiles at three different locations on the specimen section
shown in Figure A.10...........................................................................................................275
Figure A.13 - Bottom faces of GCI specimens and optical stereo-micrographs of crack
patterns after 45 thermal cycles, a) GCI-A, b) GCI-S.........................................................276
Figure A.14 - Cast iron specimens and crack patterns after 45 thermal cycles, a) DCI-D, b)
DCI-T. ................................................................................................................................. 277
Figure A.15 - Distortion of the bottom diameter of specimens versus the number of thermal
cycles....................................................................................................................................279
Figure A.16 - Cracking and distortion of specimens after 300 thermal fatigue cycles, a) GCI-
A, b) GCI-S, c) DCI-T, d) DCI-D.......................................................................................282
Figure A.17 - Schematic for measuring distortion; various parameters are marked on a DCI-T
specimen..............................................................................................................................283
Figure A.18 - Diametrical and longitudinal distortion in cast irons after 300 thermal
cycles...................................................................................................................................284
Figure B.1 - a) As-machined specimen with one as-cast surface, b) specimen with all the
surfaces finished (finished using 240 and 600 grit SiC papers, in order)............................288
Figure B.2 - Mass dissolution rates (R′) of unfinished and finished specimens of cast irons
(850°C-0.48 m/s)..................................................................................................................289
Figure B.3 - Solidified Al mounds over the reaction zones on an unfinished DCI-T specimen
(850°C-900s-0.48m/s)..........................................................................................................290
Figure B.4 - Optical image showing the merger of two reaction pits on the specimen surface
shown in Figure B3..............................................................................................................290
Figure B.5 - a) Finished DCI-T specimen (850°C-900s-0.48m/s) after withdrawal from the
melt, b) light optical image showing the continuous intermetallic layer at the cross-section of
xvi
specimen shown in Figure
B5(a)....................................................................................................................................291
Figure B.6 - As-cast surface of GCI-S................................................................................292
Figure B.7 - Formation of graphite flakes at the as-cast surface of DCI-T.........................292
Figure C.1- Mass loss versus time plot for the ferrous alloys exposed to liquid Al (850°C-
0.48 m/s), R2 values show goodness of fit for the entire data............................................ 294
Figure C.2 - Mass loss versus time plot of various ferrous alloys exposed to liquid Al (950°C-
0.48 m/s), R2 values show goodness of fit for slower mass loss regime.............................295
Figure C.3 - Relationship between volume per mean area and exposure time (850°C-
0.48m/s), R2 values show goodness of fit for the entire data..............................................297
Figure C.4 - Volume loss per mean area versus time plot (950°C-0.48m/s), R2 values show
goodness of fit for the stabilized dissolution regime...........................................................298
Figure D.1 - Formed boride layers after the boronizing treatment at 950°C for 4 hours, a)
DCI-T, b) GCI-S, c) CS.......................................................................................................299
Figure D.2 - Effect of boronizing surface treatment on the mass dissolution rates (R′) of cast
irons and steel (950°C-0.48m/s)..........................................................................................300
1
CHAPTER 1 : INTRODUCTION AND BACKGROUND
Since the earliest days of the development of the Al production process, there has been great
concern over the materials compatible with the liquid metal environment. In order to reduce
production costs - particularly maintenance costs - attention has focused on the equipment
used for transferring and holding the liquid Al. With this consideration, the liquid Al
corrosion characteristics of cast iron and steel alloys have been studied and this research was
sponsored by New Zealand Aluminium Smelters (NZAS).
The Al production process is commonly known as the Hall-Héroult smelting process, named
after its inventors. In Hall-Héroult smelting, Al is produced by the electrolytic dissociation of
alumina (Al2O3) into Al and oxygen in smelting cells operating at high temperatures (940°C-
970°C) [1]. At NZAS, each year around 360,000 tonnes of liquid Al are transferred from the
smelting cells by using cast iron/steel pipes, which are commonly known as „tapping pipes‟.
One end of the tapping pipe is periodically immersed in the liquid Al in the smelting cells and
the liquid metal is transferred to refractory lined steel crucibles. Thus the tapping pipe
surfaces are frequently exposed to a swift flow of liquid Al.
Tapping pipes fail through material loss and cracking. Material loss occurs because liquid Al
is extremely active with ferrous materials [2]. The periodic flow of liquid Al causes steep
thermal gradients leading to the cracking of pipes. Increasing the taping pipe lifetime is an
opportunity to reduce replacement expenses and costly production downtime. Moreover,
reducing the dissolution of pipe materials into Al is also a benefit in producing high purity
Al.
Cast iron and steel represent two large groups of ferrous alloys, and these are possibly the
most versatile of all engineering materials because they have several desirable properties such
2
as high strength, formability, structural rigidity, recyclability and low cost. Cast irons/steels
are preferred for many engineering applications because of their high ratio of service life to
component cost. These materials are commonly used in Al production and process industries
for tooling and structural components, such as parts of furnaces, casting dies, spouts,
crucibles and in the present case of tapping pipes.
Exposure of ferrous alloys to liquid Al can result in material degradation by chemical
corrosion and physical erosion. Chemical corrosion provides a wider description when the
exact nature of a metallurgical reaction is not known. Erosion can be defined as dissolution
from chemical corrosion combined with mechanical erosion from the swift flow of melt
relative to solid substrate [2]. Liquid metal corrosion can be classified in various categories
such as intergranular penetration, dissolution, impurity and interstitial reactions, and alloying.
In most cases, the four individual categories of corrosion are interrelated [3].
Intergranular corrosion is the localized attack at the grain boundaries upon exposure to liquid
metal under certain impurity and microstructural conditions. This type of corrosion occurs
when the grain boundaries have higher energy and/or become more anodic than the grains. In
most cases, the alloy chemistry or the depletion of alloying elements makes the grains
boundaries dissimilar to that of grains. An example is the corrosion of 316 stainless steel in
nitrogen contaminated lithium [3].
Dissolution is the simplest type of corrosion that can occur in a liquid metal system. The
amount of material loss from the solid depends upon the surface area of the solid exposed, the
volume of the liquid metal, solid metal solubility in liquid metal and the kinetic properties of
the rate controlling step in the dissolution reaction [3]. The terms corrosion and dissolution
are used interchangeably in the present work.
3
Impurity or interstitial reactions are the interaction of light elements in the solid or liquid
metal. In cases where the liquid metal has a low solid metal solubility, reactions involving
light elements such as oxygen, nitrogen, and carbon may dominate the dissolution reaction.
Decarburization of steel in lithium and the oxidation of steel in sodium occur by impurity or
interstitial reactions [3].
Another type of corrosion that occurs between solid and liquid metals is alloying or alloy
layer formation, for example, the present case of the Fe-liquid Al system. In this type of
corrosion, stable products are formed from the reaction of atoms within the solid metal with
those from the liquid metal. The product formed by this reaction may either be soluble or
insoluble in the liquid metal. Assuming that chemical contact is maintained between the
product layers, then at equilibrium, the growth of the intermetallic phase layers is controlled
by volume diffusion [3].
The present research describes the assessment of liquid Al corrosion resistance of cast iron
and steel alloys for tapping pipes and other similar applications. Moreover, the detailed
analysis of corrosion kinetics was made which will be helpful to understand and predict the
liquid Al corrosion behaviour of ferrous alloys.
The tapping pipes are frequently exposed to flowing liquid Al that causes temperature
gradients across the pipe sections. Thermal gradients result in differential thermal expansion
causing stresses across pipe sections. Repetitive thermal stresses can eventually cause
progressive opening of the cracks during service. This type of component failure is known as
thermal fatigue. From industrial point of view thermal fatigue is important; however, its
academic importance is relatively small compared to the liquid Al corrosion of ferrous
materials. Therefore, this thesis is based upon the investigations on the corrosion resistance

4
and mechanisms of liquid Al corrosion of ferrous alloys. Appendix A details the investigation
of the thermal fatigue resistance of cast irons for tapping pipe applications.
1.1 Research Overview
Most metals dissolve quickly when immersed in liquid Al baths at typical industrial operating
temperatures [2]. Thus the development of liquid Al corrosion resistant materials is of
considerable importance not only to the Al producers, but also to the industries involved in
the processing of liquid Al.
Refractory coatings are commonly used to protect metallic materials against liquid Al
corrosion. However, the coating efficiency strongly depends upon its adhesion to the
substrate and its chemical inertness to liquid Al. Significant improvement in the protection
effect through ceramic coatings has been achieved [4]. However, studies presented in [2]
show that even the ceramics compatible with liquid Al such as SiC, AlN, Al2O3 and graphite
have been found to react with liquid Al under certain conditions of temperature and time.
Thus the main concern over ceramic coatings is whether the coating itself could survive for a
satisfactory service life. Repeated thermal loading and erosion from liquid Al can eventually
lead to cracking and exfoliation of the coatings. In addition, the costs of application of such
coatings are high. Therefore, it is most desirable to improve the liquid Al corrosion resistance
of ferrous substrates.
Numerous publications [5-9] have reported on the dissolution kinetics of pure iron, stainless
steel and transition elements into liquid Al. However, experimental data on liquid Al
corrosion resistance of steels and/or cast irons is limited [10-12]. For a particular service
application, the intended mechanical and physical properties of cast irons and steels may be
achieved by the controlled addition of suitable alloying elements [13]. In contrast, there are
5
no comprehensive reports that can be utilized in the selection of a ferrous alloy for a liquid Al
environment.
Gray cast irons (GCIs) and ductile cast irons (DCIs) are more economical than cast steels
(CSs); however, their relative cost varies with the shape, size, and required mechanical and
physical properties of the end product. On the other hand, steels possess better mechanical
strength, higher toughness and better fracture toughness [14-15]. The scope of this research is
therefore to investigate the performance of various cast irons and steels close to the industrial
service conditions of liquid Al corrosion.
1.2 Research Objective
In this research project, the primary emphasis was upon enhancing the service life of tapping
pipes. The optimum service life of tapping pipes requires a material with enhanced liquid Al
corrosion resistance. Thus, current investigation utilized a series of experiments to determine
the corrosion and associated substrate reaction mechanisms of steels, GCIs and DCIs in liquid
Al baths at various temperatures.
Evaluation of liquid Al corrosion requires the experimental conditions to be as close as
possible to the actual industrial service conditions. Previous research [10-11] tests were
carried out in static melt conditions and it was found to be difficult to reveal the effect of the
chemical composition of cast irons on liquid Al corrosion resistance. Thus in the present
work, specialized experiments have been designed for testing the liquid Al corrosion at fixed
temperatures under dynamic corrosion conditions.
Reports from the literature [10-11] compared the corrosion resistance of several cast irons.
However, no detailed attempts have been made to understand the effect of microstructure on
liquid Al corrosion resistance. In the present work, the liquid Al corrosion resistance of cast
irons is analyzed with respect to the composition and microstructure. Exposure of ferrous

6
alloys to liquid Al results in the formation of intermetallic compounds, which have been
suggested to control the corrosion rate [2]. Thus the nature of the intermetallic phases and
their morphology are another subject of importance to the present study. Several ferrous
alloys were exposed to static liquid Al so that the compound formation kinetics could be
assessed against the liquid Al corrosion in static and forced flow melt conditions.
It is anticipated that enhanced comprehension of the liquid Al corrosion characteristics of
ferrous alloys will enable improvements to service life of tapping pipes and related hardware.
In addition to the significant industrial importance, the corrosion and intermetallic compound
formation kinetics of cast irons and steels exposed to liquid Al will enrich the scientific
literature.
1.3 Format of Thesis
This thesis comprises seven chapters and the contents of each chapter are described below:
Chapter 1 (this chapter) briefly describes the overview and objectives of the present
research program. The basics of the Al production process are described with an emphasis
on understanding the service conditions of tapping pipes. Special focus is placed upon the
degradation behaviour of tapping pipes by flowing liquid Al.
Chapter 2 comprises the literature review pertinent to the present research, which is
divided into three parts. The first section describes the role of the alloying elements in
controlling the microstructure, and mechanical and physical properties of cast irons. The
second section describes the formation and growth of the intermetallic compounds formed
by Fe/Al interaction. The third section is based upon the dissolution test apparatuses and
the previous studies on liquid Al corrosion resistance of ferrous alloys.
7
Chapter 3 presents the compositions and microstructures of the materials used in the
present investigation. This is followed by the description of microscopy techniques used to
characterize the intermetallic compounds. Finally, the details of experimental apparatuses
and methods used in the present investigation are described.
Chapter 4 comprises the results derived from the present work. This chapter starts with the
corrosion rates of several ferrous alloys under various conditions of temperature and flow
of Al. Next is the description of the characterization of the various intermetallic
compounds formed by the interaction between several ferrous alloys and liquid Al. This
chapter also includes results of static immersion tests to reveal the characteristics of the
intermetallic layers of several ferrous materials. Finally, the intermetallic layer
morphologies of various ferrous alloys are discussed.
Chapter 5 is the discussion section of the current investigation. This chapter starts with the
analysis of the liquid Al corrosion resistance with respect to the chemical composition and
microstructures of GCI, DCI and steel alloys. This is followed by the basic mechanisms of
liquid Al corrosion of ferrous alloys and compound formation. Next the research is
narrowed down to understand the underlying mechanisms of compound formation and
liquid Al corrosion of GCIs, DCIs and CS. The intermetallic layer growth and dissolution
of each type of alloy is discussed to provide a link between the two. The effect of Si on the
liquid Al corrosion of cast irons also forms a part of this chapter.
Chapter 6 presents the conclusions derived from the current work.
Chapter 7 comprises the recommendations to industry and future work.

8
Appendix A describes a brief literature review on thermal fatigue resistance of cast irons.
The design and development of various thermal fatigue test set-ups are described, and the
results obtained on the thermal fatigue resistance of cast irons are discussed.
Appendix B describes the effect of surface condition on the liquid Al corrosion resistance
of cast irons.
Appendix C shows the material loss results obtained using the dynamic corrosion test
apparatus.
Appendix D describes the effect of boronizing surface treatment on the liquid Al corrosion
resistance of steel and cast irons.
1.4 Background
This section focuses on the Al smelting process and the application of the tapping pipes in
transferring the liquid Al from smelting cells, which is important in understanding the service
conditions and failure of the tapping pipes. An analysis of the failure of after-service tapping
pipes was carried out to determine the effect of service conditions on the degradation
behaviour of pipe materials. In addition to the present study, analysis of service conditions
and failure of the tapping pipes may also be useful for future research.
1.4.1 Al Smelting
Hall-Héroult process is a commercial process for producing Al by passing an electric current
through a solution of alumina (Al2O3) dissolved in cryolite (Na3AlF6). In the Hall-Héroult
process, Al2O3 is dissociated into Al metal and O by electrolytic reduction. It is a continuous
process in which the alumina remains dissolved in a cryolite bath in the electrolytic cells
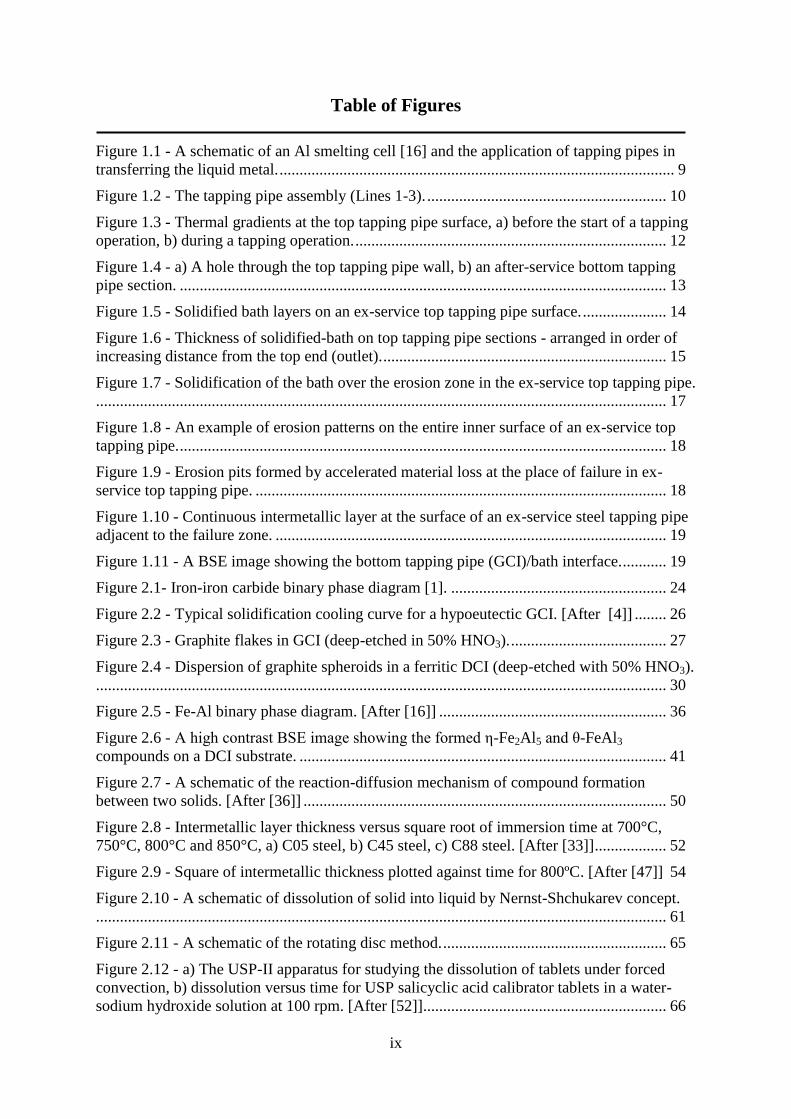
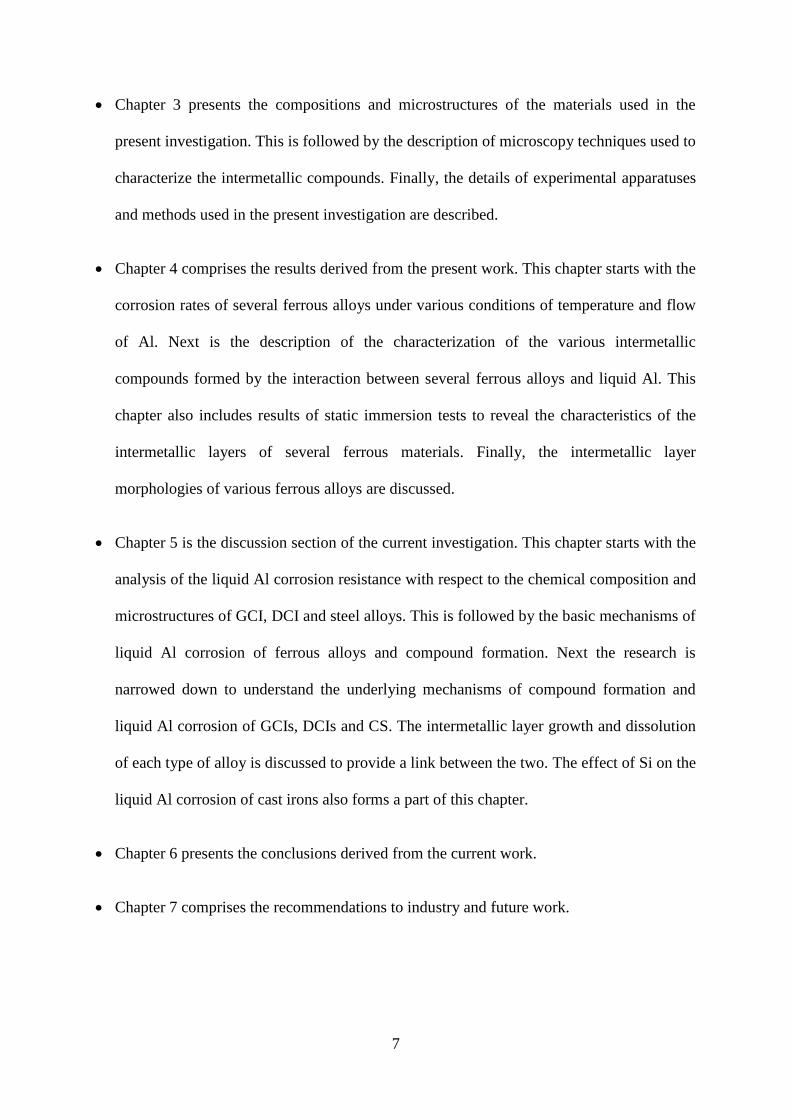
called pots. Figure 1.1 shows a simplified diagram of a smelting cell and transfer of liquid Al
using the tapping pipes.
9
Figure 1.1 - A schematic of an Al smelting cell [16] and the application of tapping pipes in
transferring the liquid metal.
As the electrolytic reaction proceeds - Al - which is slightly denser than the pot bath material
- is continuously deposited in a metal pool on the bottom of the pot while oxygen reacts with
the carbon material of the anodes to form oxides of carbon. A fraction of the Al collected at
the bottom of the cell is removed using tapping pipes as shown in Figure 1.1. The liquid Al
transfer operation is commonly known as „tapping‟.
At NZAS, there are four reduction lines of smelting cells. Lines 1, 2 and 3 each contain 208
individual cells and Line 4 has 48 cells. Each cell in Lines 1-3 produces approximately 1450
kg and each cell in Line 4 produces approximately 1670 kg of molten Al every 24 hours. The
molten Al is transported to the cast house for casting into billets.
1.4.2 Tapping Pipes and Service Conditions
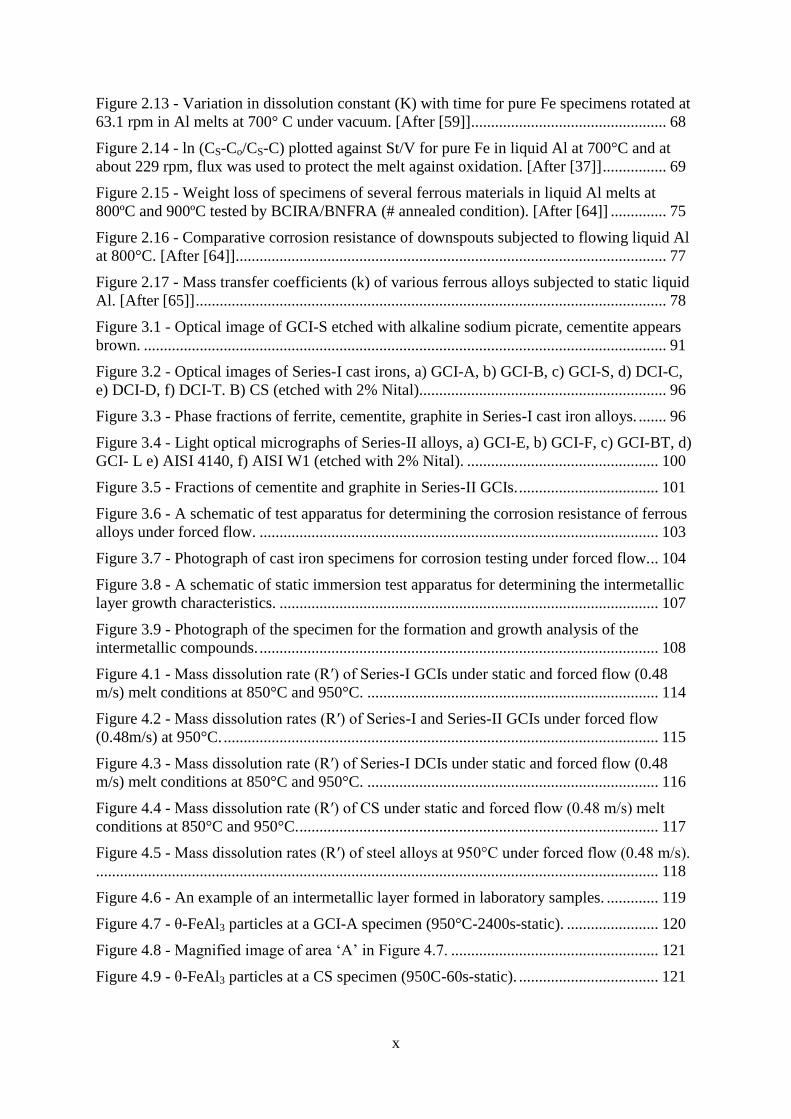
1.4.2.1 Tapping Pipe Assembly
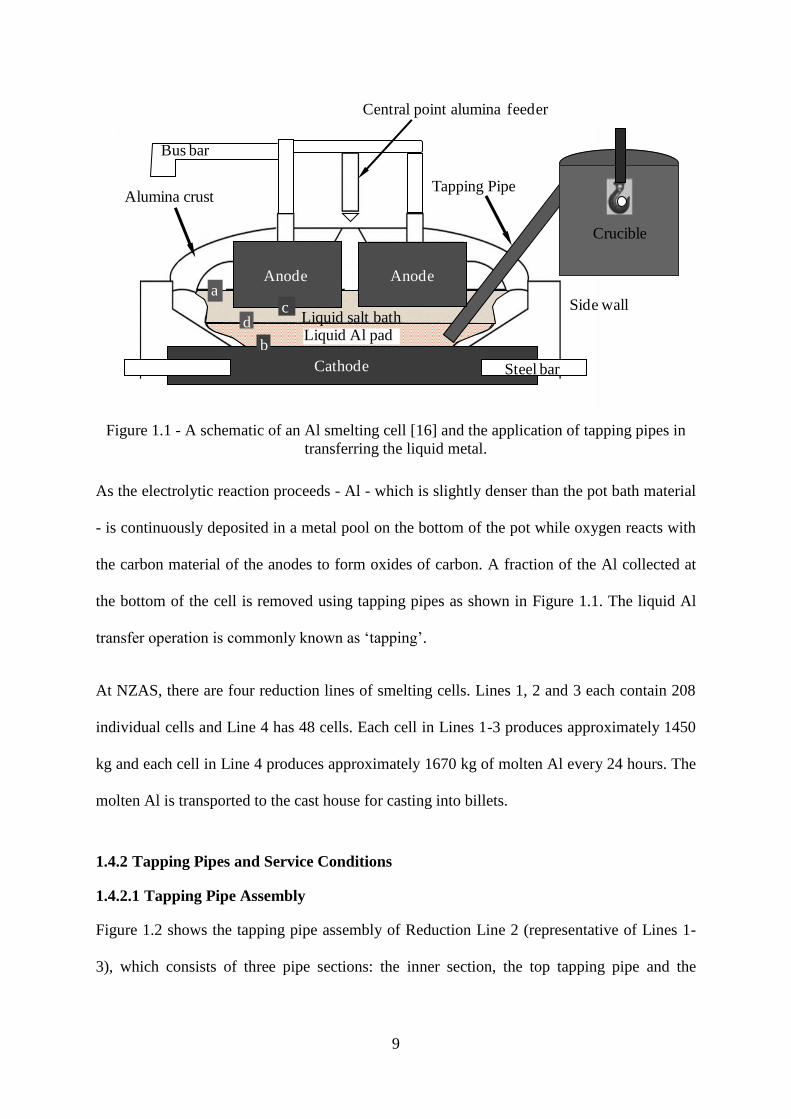
Figure 1.2 shows the tapping pipe assembly of Reduction Line 2 (representative of Lines 1-
3), which consists of three pipe sections: the inner section, the top tapping pipe and the
Liquid salt bathLiquid Al pad
Alumina crust
Side wall
Cathode
Bus bar
Tapping Pipe
Central point alumina feeder
a
d
b
Steel bar
Crucible
c
Anode Anode
10
bottom tapping pipe. These pipes are mounted over the lid of a refractory-lined steel crucible
in which a vacuum is created to transfer the liquid Al.
Figure 1.2 - The tapping pipe assembly (Lines 1-3).
1.4.2.2 Materials
The top tapping pipe material is cast steel, and the inner section and lower tapping pipes are
GCI. The Line 4 tapping pipe assembly consists of a DCI top tapping pipe of a different
design. The tapping pipe materials have been employed in service for several years, and
owing to the lack of scientific background, the selection of these materials is likely to be
based upon experience only.
1.4.2.3 Tapping Operation
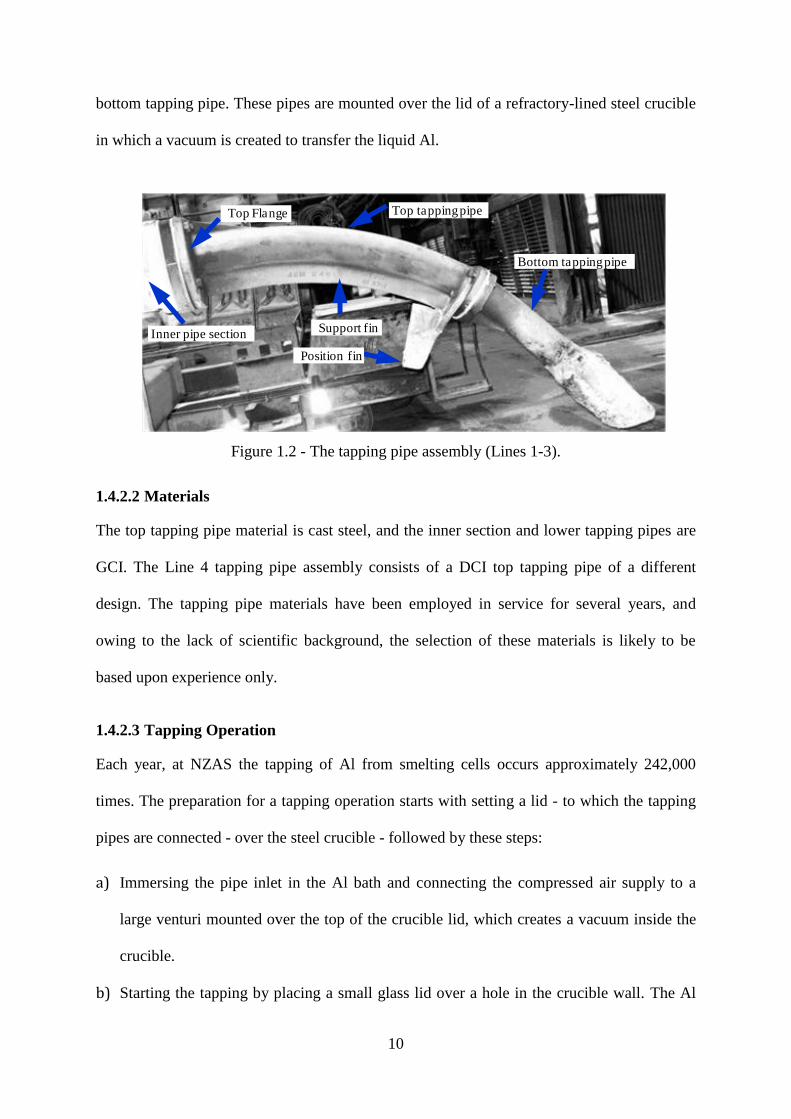
Each year, at NZAS the tapping of Al from smelting cells occurs approximately 242,000
times. The preparation for a tapping operation starts with setting a lid - to which the tapping
pipes are connected - over the steel crucible - followed by these steps:
a) Immersing the pipe inlet in the Al bath and connecting the compressed air supply to a
large venturi mounted over the top of the crucible lid, which creates a vacuum inside the
crucible.
b) Starting the tapping by placing a small glass lid over a hole in the crucible wall. The Al
Top tapping pipe
Bottom tapping pipe
Inner pipe sectionSupport fin
Position fin
Top Flange
11
flow velocity is adjusted by moving the glass lid, which controls the vacuum generated.
The velocity of liquid Al must be within limits because a too high velocity draws the bath
and increases cathode erosion [17].
c) Stopping tapping after withdrawal of approximately 1450 kg (Lines 1-3) of Al from a
cell. Each tapping operation takes about three minutes. Tapping time between the cells
varies between one to two minutes and depends on the location of the next cell for
tapping.
d) One crucible can hold Al from three cells. Once full, the crucible full of metal is skimmed
and subsequently transported to the cast house.
e) The crucible lid with tapping pipes assembly is fixed to the next crucible, and pipes are
readied to tap the next cell. This process usually takes 15-20 minutes.
f) The liquid cryolite bath and Al solidify inside the tapping pipes during tapping and have
to be removed periodically. The operation by which the tapping pipes are cleaned is
known as „rattling‟.
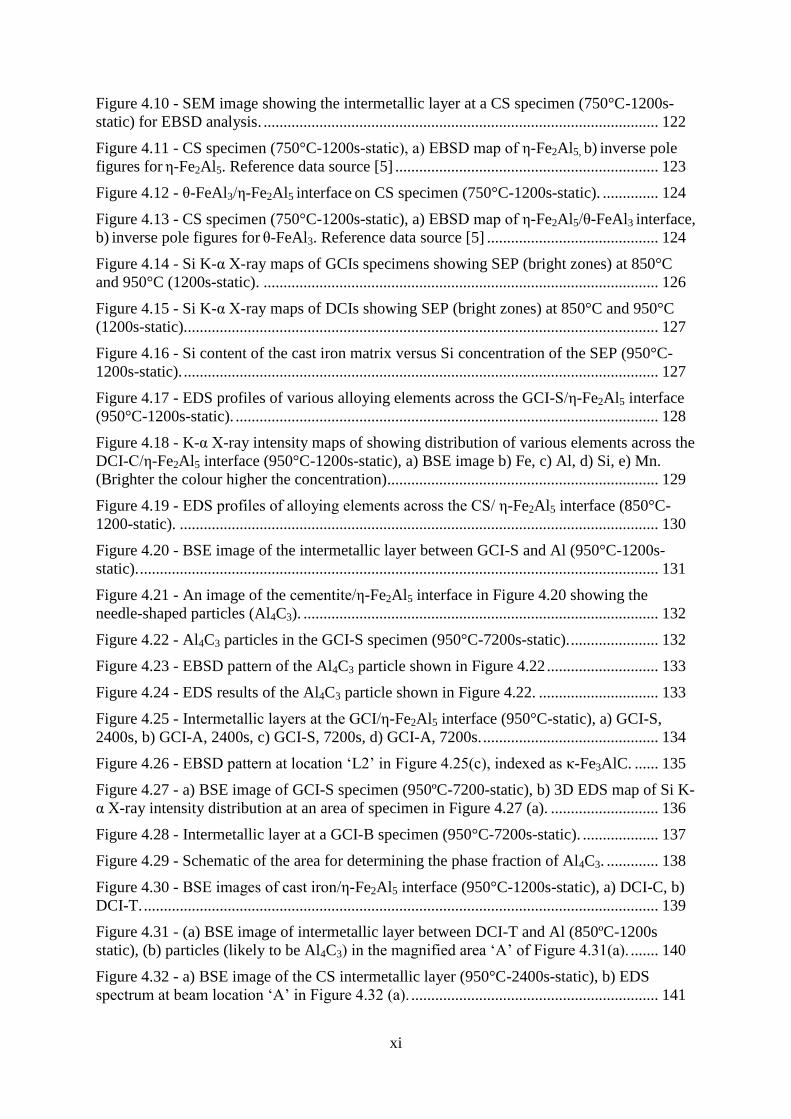
1.4.2.4 Thermal Gradients
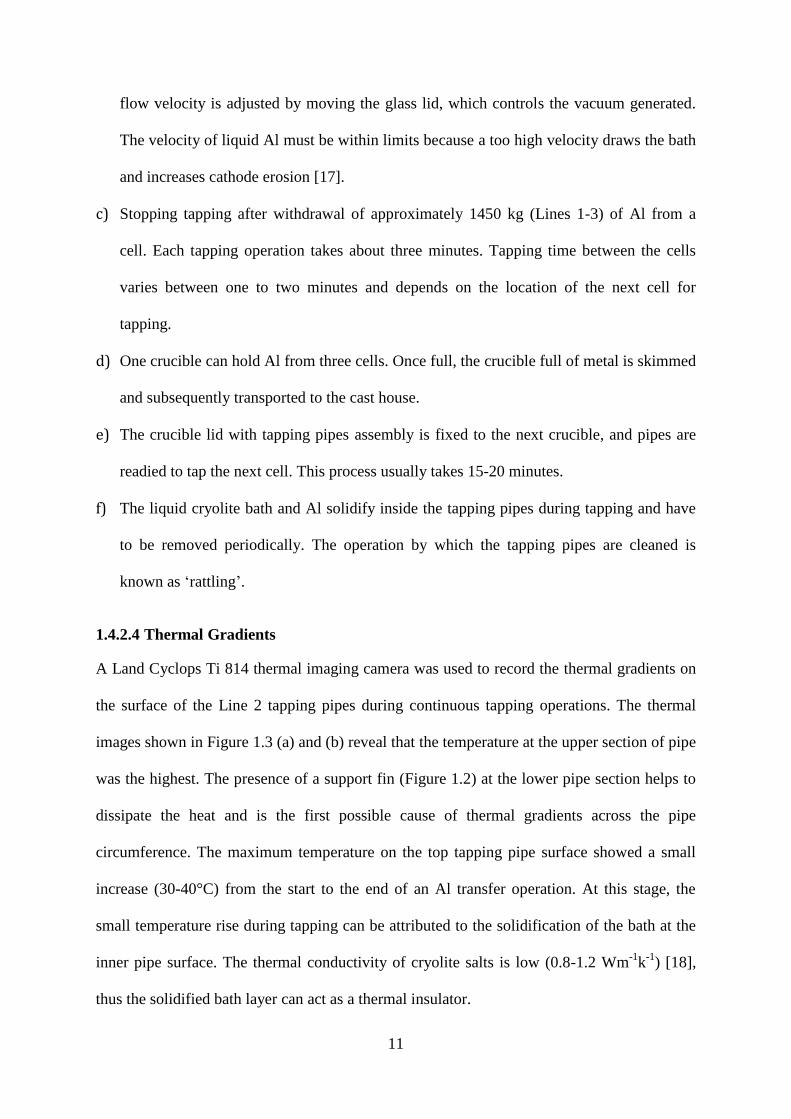
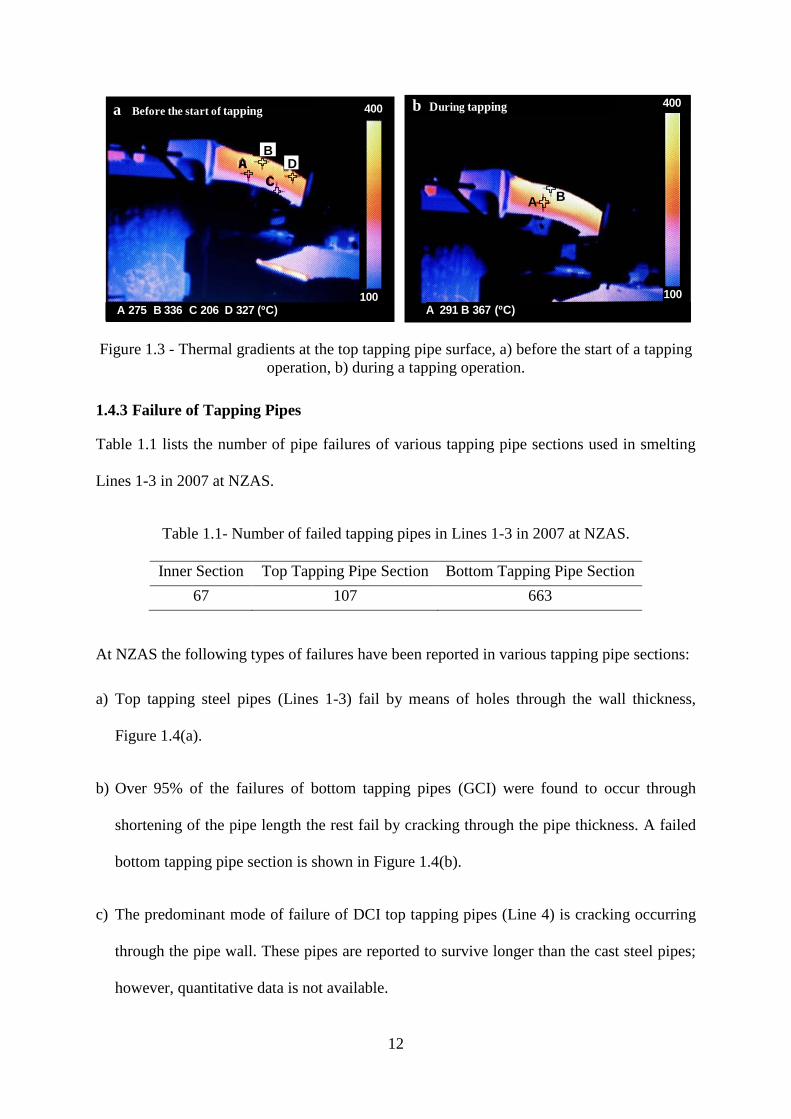
A Land Cyclops Ti 814 thermal imaging camera was used to record the thermal gradients on
the surface of the Line 2 tapping pipes during continuous tapping operations. The thermal
images shown in Figure 1.3 (a) and (b) reveal that the temperature at the upper section of pipe
was the highest. The presence of a support fin (Figure 1.2) at the lower pipe section helps to
dissipate the heat and is the first possible cause of thermal gradients across the pipe
circumference. The maximum temperature on the top tapping pipe surface showed a small
increase (30-40°C) from the start to the end of an Al transfer operation. At this stage, the
small temperature rise during tapping can be attributed to the solidification of the bath at the
inner pipe surface. The thermal conductivity of cryolite salts is low (0.8-1.2 Wm-1
k-1
) [18],
thus the solidified bath layer can act as a thermal insulator.
12
Figure 1.3 - Thermal gradients at the top tapping pipe surface, a) before the start of a tapping
operation, b) during a tapping operation.
1.4.3 Failure of Tapping Pipes
Table 1.1 lists the number of pipe failures of various tapping pipe sections used in smelting
Lines 1-3 in 2007 at NZAS.
Table 1.1- Number of failed tapping pipes in Lines 1-3 in 2007 at NZAS.
Inner Section Top Tapping Pipe Section Bottom Tapping Pipe Section
67 107 663
At NZAS the following types of failures have been reported in various tapping pipe sections:
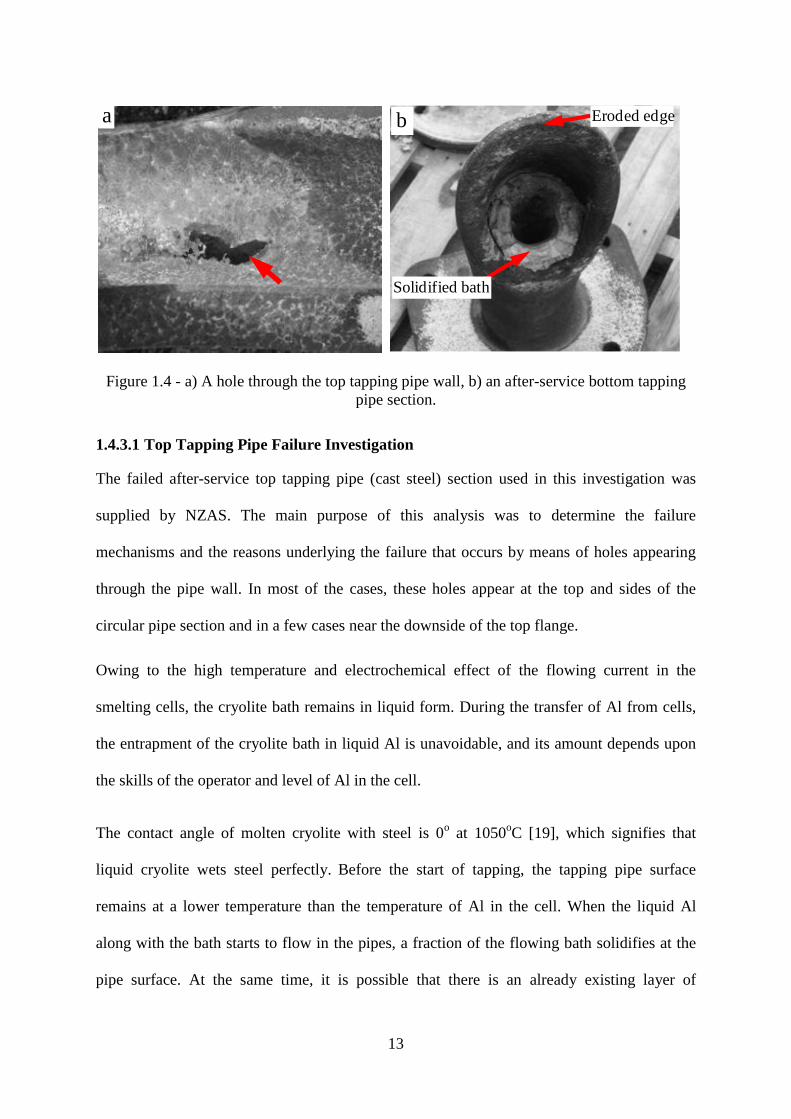
a) Top tapping steel pipes (Lines 1-3) fail by means of holes through the wall thickness,
Figure 1.4(a).
b) Over 95% of the failures of bottom tapping pipes (GCI) were found to occur through
shortening of the pipe length the rest fail by cracking through the pipe thickness. A failed
bottom tapping pipe section is shown in Figure 1.4(b).
c) The predominant mode of failure of DCI top tapping pipes (Line 4) is cracking occurring
through the pipe wall. These pipes are reported to survive longer than the cast steel pipes;
however, quantitative data is not available.
C
AB
D
A 275 B 336 C 206 D 327 (ºC)
a Before the start of tapping 400
100A 291 B 367 (ºC)
A B
b During tapping
100
400
13
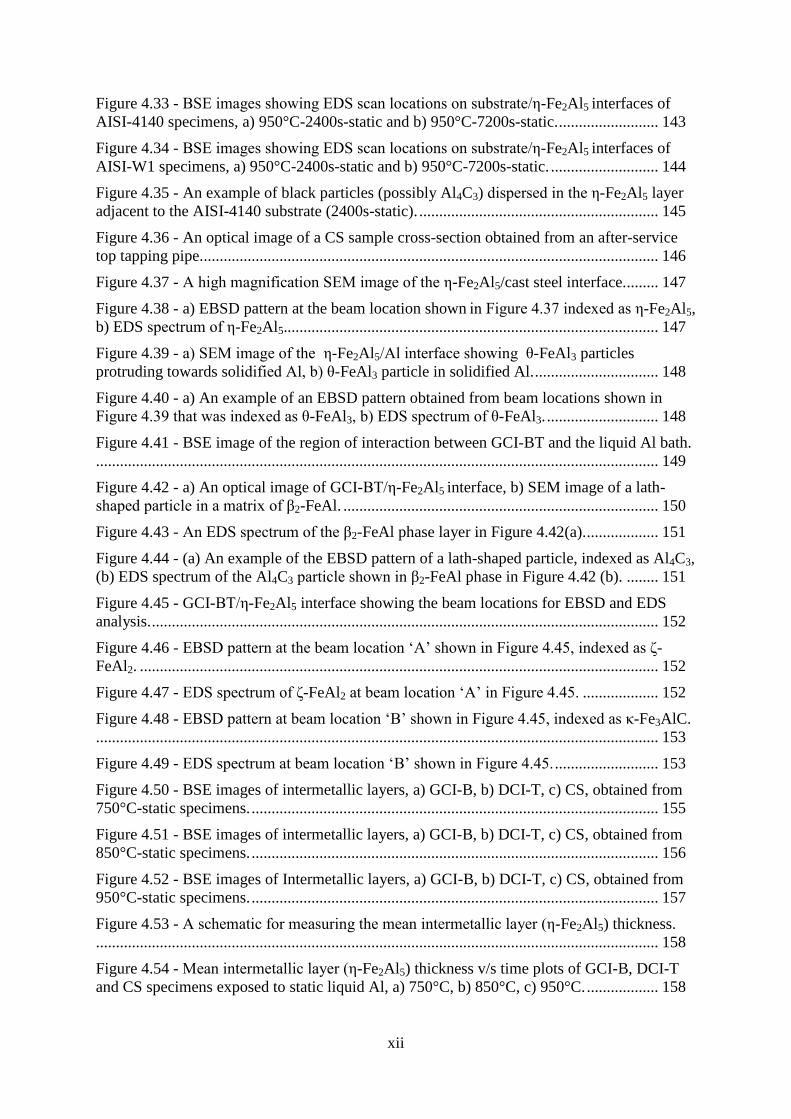
Figure 1.4 - a) A hole through the top tapping pipe wall, b) an after-service bottom tapping
pipe section.
1.4.3.1 Top Tapping Pipe Failure Investigation
The failed after-service top tapping pipe (cast steel) section used in this investigation was
supplied by NZAS. The main purpose of this analysis was to determine the failure
mechanisms and the reasons underlying the failure that occurs by means of holes appearing
through the pipe wall. In most of the cases, these holes appear at the top and sides of the
circular pipe section and in a few cases near the downside of the top flange.
Owing to the high temperature and electrochemical effect of the flowing current in the
smelting cells, the cryolite bath remains in liquid form. During the transfer of Al from cells,
the entrapment of the cryolite bath in liquid Al is unavoidable, and its amount depends upon
the skills of the operator and level of Al in the cell.
The contact angle of molten cryolite with steel is 0o at 1050
oC [19], which signifies that
liquid cryolite wets steel perfectly. Before the start of tapping, the tapping pipe surface
remains at a lower temperature than the temperature of Al in the cell. When the liquid Al
along with the bath starts to flow in the pipes, a fraction of the flowing bath solidifies at the
pipe surface. At the same time, it is possible that there is an already existing layer of
a
Solidified bath
Eroded edgeb
14
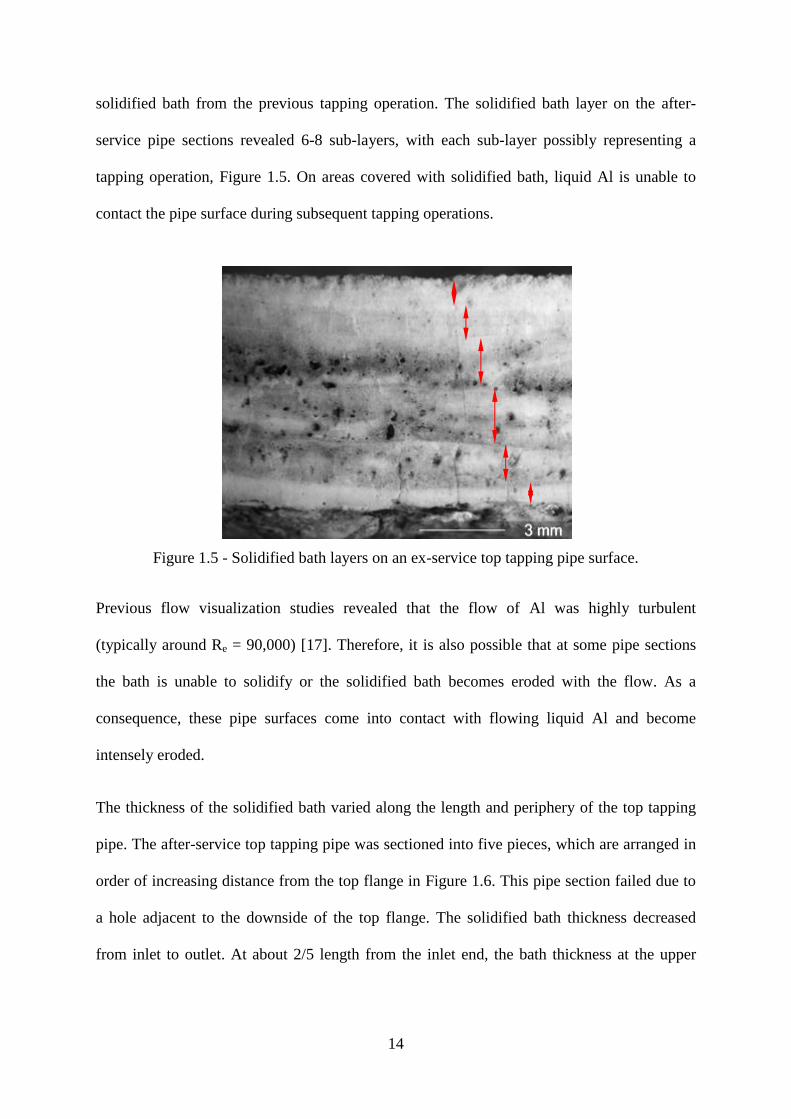
solidified bath from the previous tapping operation. The solidified bath layer on the after-
service pipe sections revealed 6-8 sub-layers, with each sub-layer possibly representing a
tapping operation, Figure 1.5. On areas covered with solidified bath, liquid Al is unable to
contact the pipe surface during subsequent tapping operations.
Figure 1.5 - Solidified bath layers on an ex-service top tapping pipe surface.
Previous flow visualization studies revealed that the flow of Al was highly turbulent
(typically around Re = 90,000) [17]. Therefore, it is also possible that at some pipe sections
the bath is unable to solidify or the solidified bath becomes eroded with the flow. As a
consequence, these pipe surfaces come into contact with flowing liquid Al and become
intensely eroded.
The thickness of the solidified bath varied along the length and periphery of the top tapping
pipe. The after-service top tapping pipe was sectioned into five pieces, which are arranged in
order of increasing distance from the top flange in Figure 1.6. This pipe section failed due to
a hole adjacent to the downside of the top flange. The solidified bath thickness decreased
from inlet to outlet. At about 2/5 length from the inlet end, the bath thickness at the upper
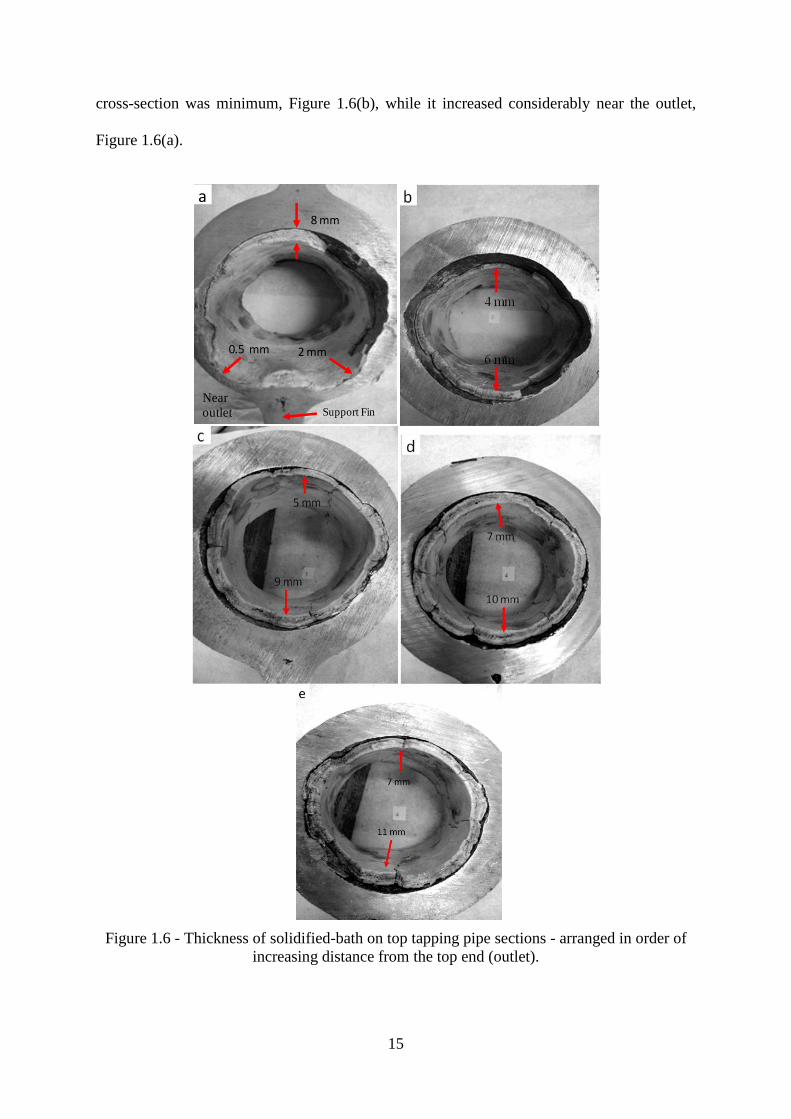
15
cross-section was minimum, Figure 1.6(b), while it increased considerably near the outlet,
Figure 1.6(a).
Figure 1.6 - Thickness of solidified-bath on top tapping pipe sections - arranged in order of
increasing distance from the top end (outlet).
0.5 mm 2 mm
8 mm
a
Near outlet Support Fin
16
The thermal gradients in the infrared images (Figure 1.3) during a tapping operation may
relate to the solidified bath thickness, because a smaller bath thickness should mean lesser
resistance to the flow of heat thus a higher temperature at the outer surface. A very small
thickness of bath layer can be seen in Figure 1.6(a), which was found near the hole through
the pipe section, while the area just above the support fin is considerably less eroded
compared to the sides. The different thicknesses of the solidified bath could depend upon
temperature variation at the pipe surface and the density difference between cryolite salts and
liquid Al. At the pipe surfaces where the temperature is lower the possibility of bath
solidification is higher.
The tapping pipe is inclined at an angle of about 60° to the vertical at the end joined to the
bottom tapping pipe and near the top end it is nearly horizontal (Figure 1.2). Thus the weight
component of liquid Al at the lower pipe surface increases as it flows from inlet to outlet,
which may have led to a greater amount of mechanical erosion at downside of the outlet
section. Owing to the relatively lower temperature and the effect of bath solidification, the
area over the support fin can be least vulnerable to failure by erosion. Thus the sides and
upper portion of the pipe are more likely to contact flowing liquid Al and results in thinning
of the pipe wall.
Visual observations of the transverse sections of the top tapping pipe revealed that in some
areas the bath was solidified over the erosion zone, Figure 1.7. This type of layer
solidification is most probable when there is a large time gap between subsequent tapping
operations or the tapping pipe is put into operation after rattling. Thus the solidification of the
bath over the previous erosion zone is able to stop further material loss by flowing Al.
Conversely, the possibility of bath solidification is least in continuous tapping operations
because the pipes remain at high temperature and Al could be present in the liquid state at the
17
erosion zones. This can prevent bath solidification due to the absence of pipe surface at a low
temperature. Moreover, localized pipe wall thinning may cause a localized flow turbulence
leading to a lower possibility of bath solidification.
After removing the solidified bath a top tapping pipe section was pickled in 5% (Dcon-90®
) +
95% H2O solution for 24 hours. Dcon-90® is the registered trademark of Zinsser Analytic
GmbH, Germany. Figure 1.8 shows the pipe surface that was not corroded by liquid Al and
the erosion pits, which identify the initiation of erosion at random locations on the pipe
surface. Almost the entire pipe surface showed material loss by this type of pit patterns. This
type of interaction is possible when the liquid Al contacts the entire pipe surface and is most
likely to occur when a new pipe or existing tapping pipe is used for the first time after rattling
operation. As mentioned previously, in subsequent tapping operations, further Fe-Al
interaction could be stopped by the solidification of the bath over the reaction zone. Figure
1.9 shows a pickled pipe section near the failure zone; the pipe failure occurred through the
creation of the holes near the downside of the top flange. Figure 1.6(a) shows the cross-
sectional view of the pipe section close to the failure area.
Figure 1.7 - Solidification of the bath over the erosion zone in the ex-service top tapping pipe.
Solidified Al over the erosion zone Solidified bath

18
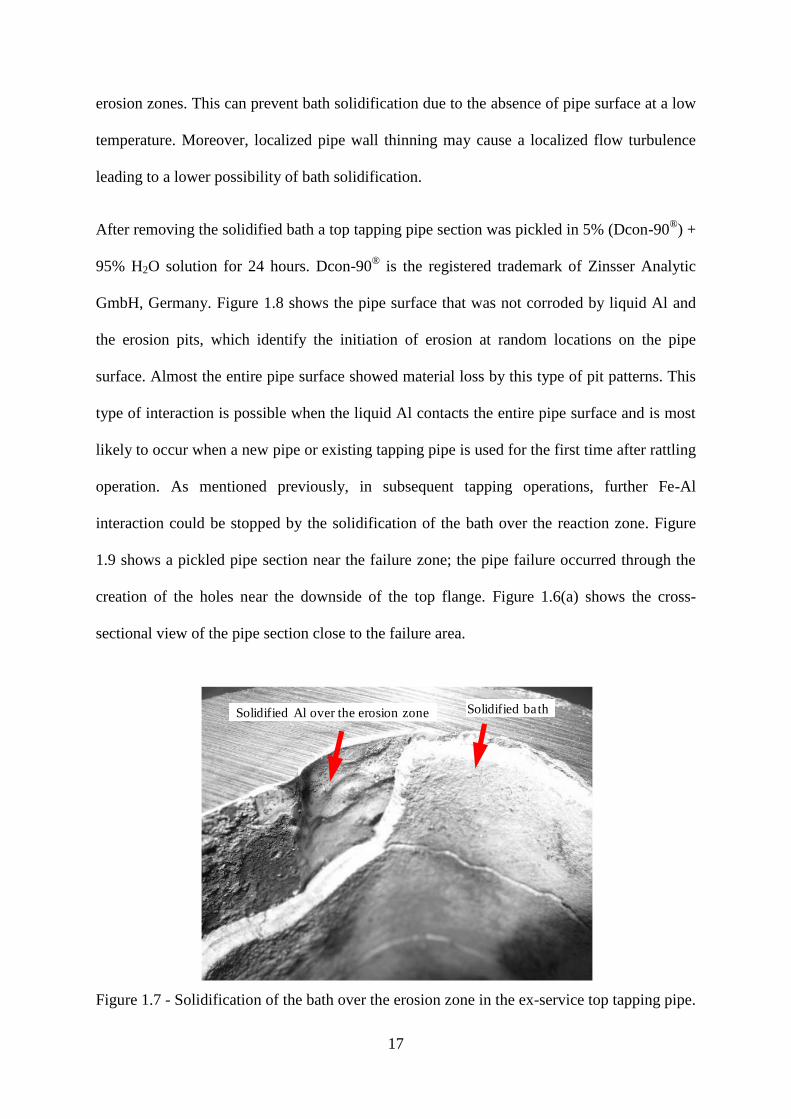
Figure 1.10 is an image of a specimen cross-section that was obtained from the steel pipe
adjacent to the failure zone. Liquid Al is known to be extremely active with ferrous alloys.
Immediately after contact with ferrous substrates it forms Fe-Al intermetallic compounds. A
continuous Fe-Al interaction layer was found on the surface of the after-service steel pipe.
Figure 1.8 - An example of erosion patterns on the entire inner surface of an ex-service top
tapping pipe.
Figure 1.9 - Erosion pits formed by accelerated material loss at the place of failure in ex-
service top tapping pipe.
20 mm
Non reacted pipe surface
Erosion pits
25 mm
Large erosion pits
Failure zone
19
Figure 1.10 - Continuous intermetallic layer at the surface of an ex-service steel tapping pipe
adjacent to the failure zone.
1.4.3.2 Bottom Tapping Pipe Failure Investigation
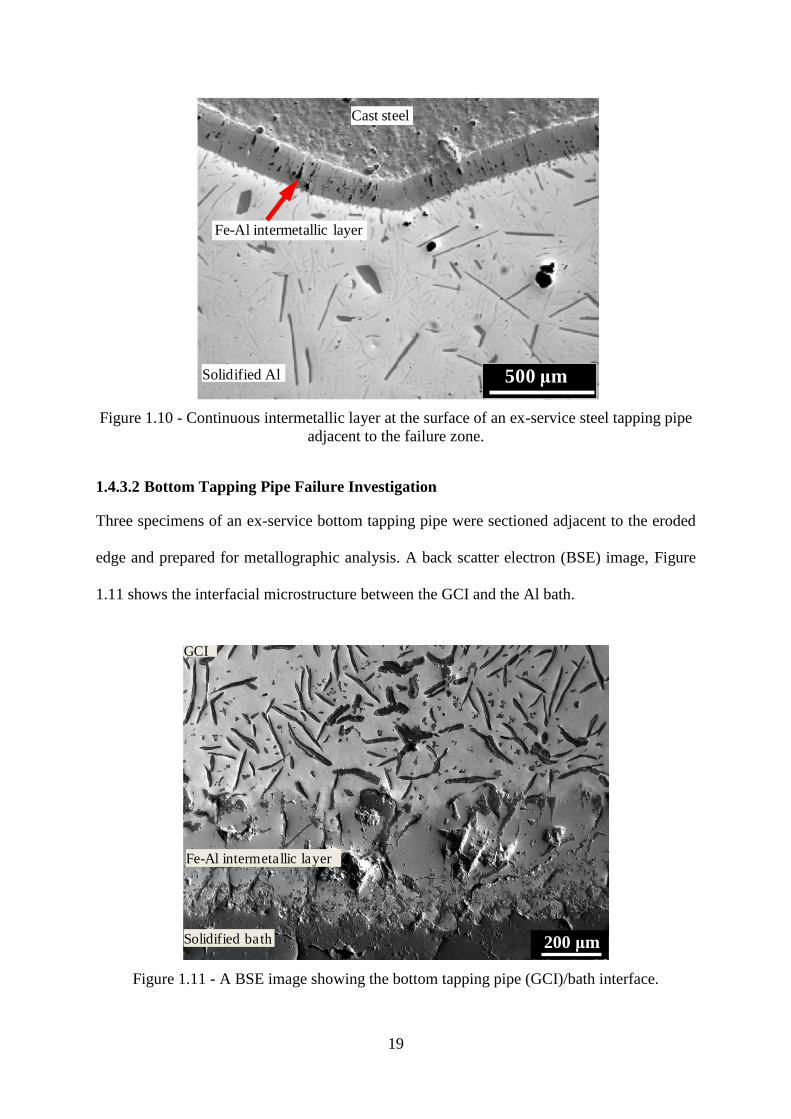
Three specimens of an ex-service bottom tapping pipe were sectioned adjacent to the eroded
edge and prepared for metallographic analysis. A back scatter electron (BSE) image, Figure
1.11 shows the interfacial microstructure between the GCI and the Al bath.
Figure 1.11 - A BSE image showing the bottom tapping pipe (GCI)/bath interface.
Cast steel
Fe-Al intermetallic layer
Solidified Al 500 μm
200 μm
Fe-Al intermetallic layer
Solidified bath
GCI
20
All specimens had a continuous Fe-Al intermetallic layer about 500 μm thick. This suggests
that the corrosion of the bottom tapping pipe occurs through alloy layer formation. No cracks
have been found in the GCI microstructure; however, a number of micro-cracks were found
in the Fe-Al intermetallic layer.
Considering the possible corrosion protection provided by the bath solidification inside the
top tapping pipes, the corrosion conditions for bottom tapping pipes are comparatively more
severe. The lower end of the bottom tapping pipes, where the bath solidification is not
possible, remains in contact with the flowing liquid Al during each tapping operation. This
induces excessive material loss at the pipe inlet and renders the pipe useless by shortening the
pipe length. The GCI substrate formed intermetallic compounds with Al, which are relatively
brittle [20] and can easily exfoliate with the swift flow of liquid metal. These findings
indicate that the principal mode of failure of bottom tapping pipes is also flow-assisted liquid
Al corrosion.
1.4.4 Material Properties
Temperature of liquid Al in tapping pipes should be close to the bath temperature, 960°C. For
tapping pipes, the thermal activation of corrosion is substantially higher owing to the very
high liquid Al temperature and is further assisted by the turbulent flow of Al. Liquid Al
corrosion of ferrous alloys was found to be a major factor causing the failure of tapping
pipes. However, thermal fatigue resistance is an important factor when considering cast irons
for replacing the existing steel and enhancing the service life of existing cast iron tapping
pipes. Overall, the cost of the improved material must not outweigh the benefit of enhanced
service life. Thus ceramics and other expensive coating options are not part of the present
research. Moreover, the periodic removal of the solidified bath imposes a practical constraint
21
on the use of ceramic coatings because these coatings are always brittle and will spall during
rattling operations.
Cast irons and steels are close competitors for tapping pipe applications because steels
possess higher mechanical strength and better resistance to cracking under thermal loading
[15], whereas cast irons are cheaper. It is surprising that there are very limited reports [10-11]
available on enhancing the liquid Al corrosion resistance of cast irons and no correlation has
been established between the corrosion resistance and chemical composition. Therefore, there
is a need to address the liquid Al corrosion resistance of cast irons and steels close to the
industrial service conditions of tapping pipes.
Chapter References
[1] ALCOA, available at : www.alcoa.com/global/en/about_alcoa/pdf/Smeltingpaper.pdf.
[2] M. Yan, Z. Fan, Journal of Materials Science, 36 (2001) 285-295.
[3] P.F. Tortorelli, J.H. Devan, Liquid Metal Corrosion Consideratios in Alloy
Developement, Metals and Ceramics Division, Oak Ridge National Laboratory, Tennesee,
USA.
[4] H. Mizuno, J. Kitamura, Journal of Thermal Spray Technology, 16 (2007) 404-413.
[5] M. Niinomi, Y. Ueda, M. Sano, Transactions of the Japan Institute of Metals, 23 (1982)
780-787.
[6] V. N. Eremenko, V. R. Ryabov, Materials Science, 4 (1968) 286-290.
[7] N. Tunca, G. Delamore, R. Smith, Metallurgical and Materials Transactions A, 21 (1990)
2919-2928.
[8] K. Barmak, V.I. Dybkov, Journal of Materials Science, 39 (2004) 4219-4230.
[9] M. Niinomi, Y. Suzuki, Y. Ueda, Transactions of the Japan Institute of Metals, 25 (1984)
429-439.
[10] F.A. Mountford, T.J. Glover, Foundry Trade Journal, 120 (1966) 849-852.
[11] D. Balloy, J.C. Tissier, M.L. Giorgi, M. Briant, Metallurgical and Materials Transactions
A, 41 (2010) 2366-2376.
[12] S.H. Hwang, J.H. Song, Y.S. Kim, Materials Science and Engineering A, 390 (2005)
437-443.
[13] J.R. Davis, ASM Speciality Handbook-Cast Irons, ASM International, Materials Park,
Ohio, 1996.
22
[14] M. Blair, T.L. Steven, Steel Castings Handbook, ASM International, Materials Park,
Ohio, 1995.
[15] M.M. Shea, American Foundry Society Transactions, 04 (1978) 23-30.
[16] D.A. Weirauch Jr, Current Opinion in Solid State and Materials Science, 9 (2005) 230-
240.
[17] M.L. Walker, Visualization of tapping flows, Light Metals, TMS Annual Meeting,
Orlando, (1997) 215-219.
[18] V.A. Khokhlov, E.S. Filatov, A. Solheim, J. Thonstad, Thermal conductivity in cryolitic
melts - new data and its influence on heat transfer in aluminum cells, TMS Annual Meeting,
San Antonio, (1998) 501-506.
[19] I.E. Veneraki, A.D. Panasyuk, V.I. Deshko, Ukr Khim Zh, 42 (1976) 291-298.
[20] H.R. Shahverdi, M.R. Ghomashchi, S. Shabestari, J. Hejazi, Journal of Materials
Processing Technology, 124 (2002) 345-352.
23
CHAPTER 2 : LITERATURE REVIEW
Introduction
The review of the literature pertaining to this thesis is divided into three sections. This
chapter starts with an overview of cast irons by briefly discussing their mechanical properties
and effect of alloying elements. Second part of this chapter introduces the formation and
growth of various intermetallic compounds in Fe-Al interaction. In the third part, the basics
of dissolution and the dissolution apparatuses used in the literature are discussed. Finally, the
previous studies on liquid Al corrosion resistance of ferrous alloys are described.
2.1 Cast Irons
Cast irons consist of graphite inclusions of various shapes embedded in a Fe matrix and form
a complex metallurgical system compared to steels. To optimize the liquid Al corrosion
resistance of cast irons, it is crucial to understand the effect of compositional constituents on
the microstructures of these alloys.
In general, the higher carbon content differentiates the cast irons from steels. Figure 2.1
shows the iron-iron carbide binary phase diagram, the Fe-C alloys up to 2 wt.% C are
classified as steels, while the alloys with higher C contents are defined as cast irons. The
amount of alloying elements present in most grades of steels is low; therefore, these can be
considered as binary Fe-C alloys. However, cast irons contain appreciable amounts of Si in
addition to higher C contents, so they must be considered as ternary Fe-C-Si alloys. When Fe
is alloyed with Si and C in amounts of about 2 wt.%, the carbide in the Fe-C system becomes
unstable. During solidification, Si causes the C to rapidly come out of the solution as graphite
leaving a matrix of relatively soft Fe [1].
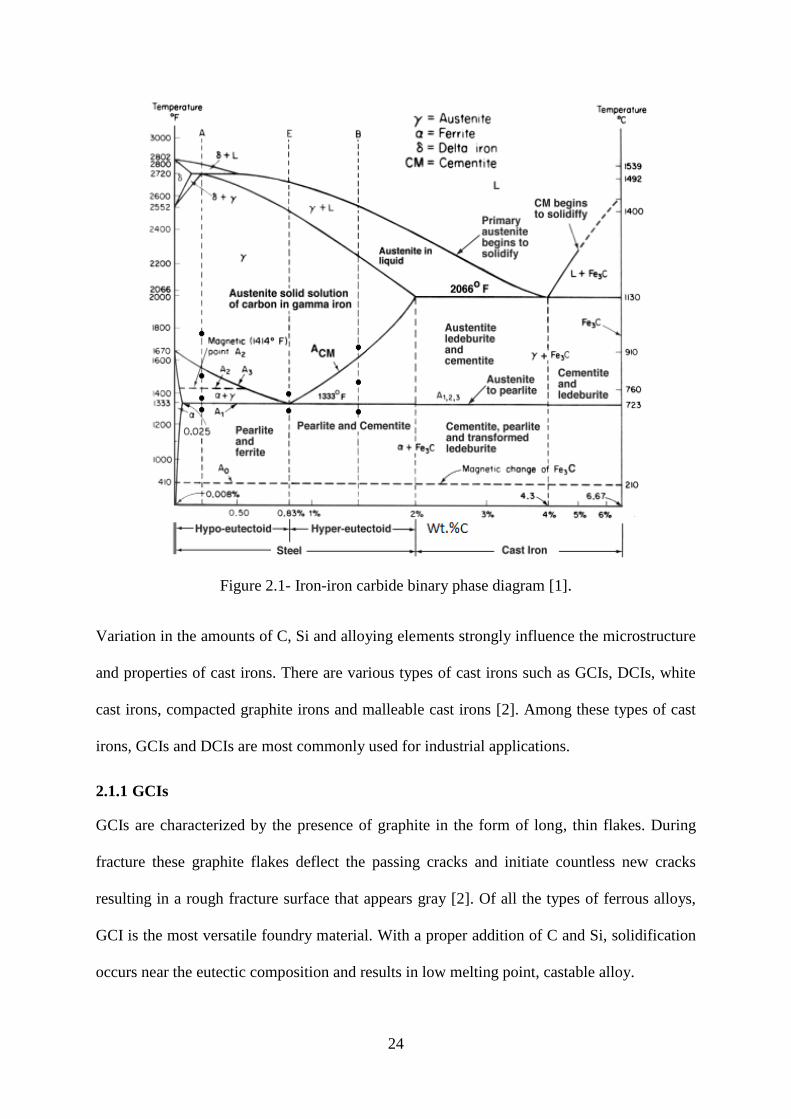
24
Figure 2.1- Iron-iron carbide binary phase diagram [1].
Variation in the amounts of C, Si and alloying elements strongly influence the microstructure
and properties of cast irons. There are various types of cast irons such as GCIs, DCIs, white
cast irons, compacted graphite irons and malleable cast irons [2]. Among these types of cast
irons, GCIs and DCIs are most commonly used for industrial applications.
2.1.1 GCIs
GCIs are characterized by the presence of graphite in the form of long, thin flakes. During
fracture these graphite flakes deflect the passing cracks and initiate countless new cracks
resulting in a rough fracture surface that appears gray [2]. Of all the types of ferrous alloys,
GCI is the most versatile foundry material. With a proper addition of C and Si, solidification
occurs near the eutectic composition and results in low melting point, castable alloy.
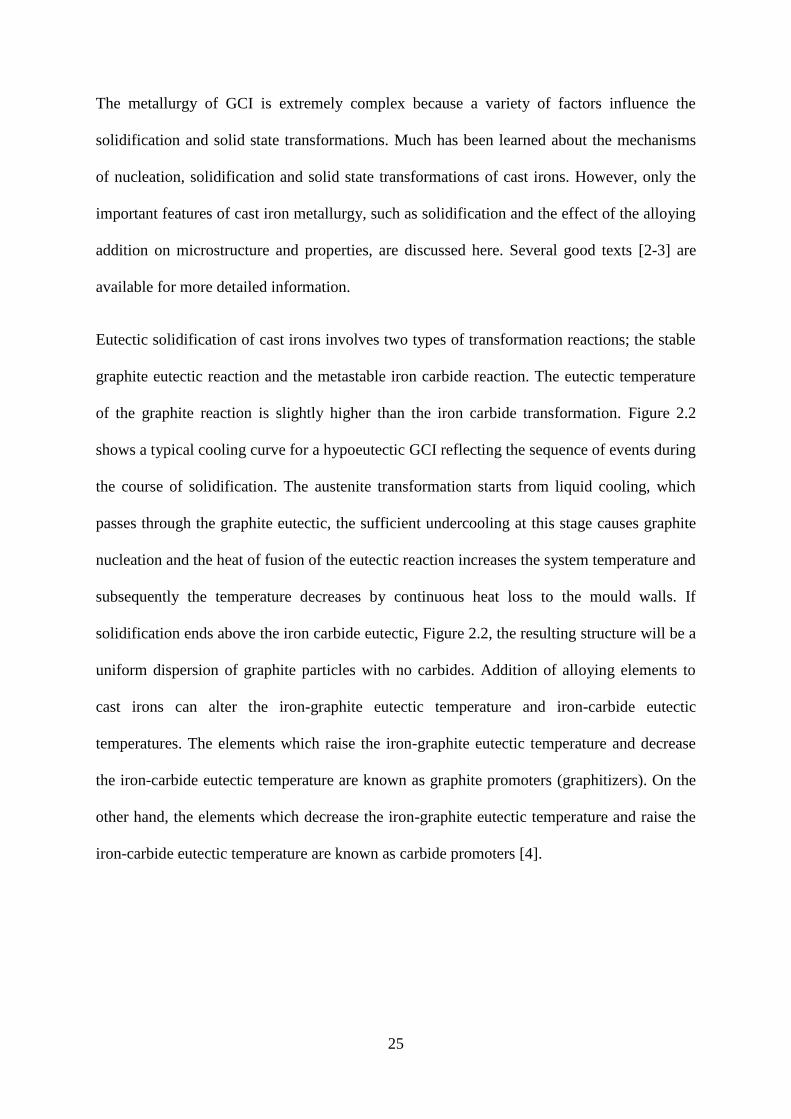
25
The metallurgy of GCI is extremely complex because a variety of factors influence the
solidification and solid state transformations. Much has been learned about the mechanisms
of nucleation, solidification and solid state transformations of cast irons. However, only the
important features of cast iron metallurgy, such as solidification and the effect of the alloying
addition on microstructure and properties, are discussed here. Several good texts [2-3] are
available for more detailed information.
Eutectic solidification of cast irons involves two types of transformation reactions; the stable
graphite eutectic reaction and the metastable iron carbide reaction. The eutectic temperature
of the graphite reaction is slightly higher than the iron carbide transformation. Figure 2.2
shows a typical cooling curve for a hypoeutectic GCI reflecting the sequence of events during
the course of solidification. The austenite transformation starts from liquid cooling, which
passes through the graphite eutectic, the sufficient undercooling at this stage causes graphite
nucleation and the heat of fusion of the eutectic reaction increases the system temperature and
subsequently the temperature decreases by continuous heat loss to the mould walls. If
solidification ends above the iron carbide eutectic, Figure 2.2, the resulting structure will be a
uniform dispersion of graphite particles with no carbides. Addition of alloying elements to
cast irons can alter the iron-graphite eutectic temperature and iron-carbide eutectic
temperatures. The elements which raise the iron-graphite eutectic temperature and decrease
the iron-carbide eutectic temperature are known as graphite promoters (graphitizers). On the
other hand, the elements which decrease the iron-graphite eutectic temperature and raise the
iron-carbide eutectic temperature are known as carbide promoters [4].
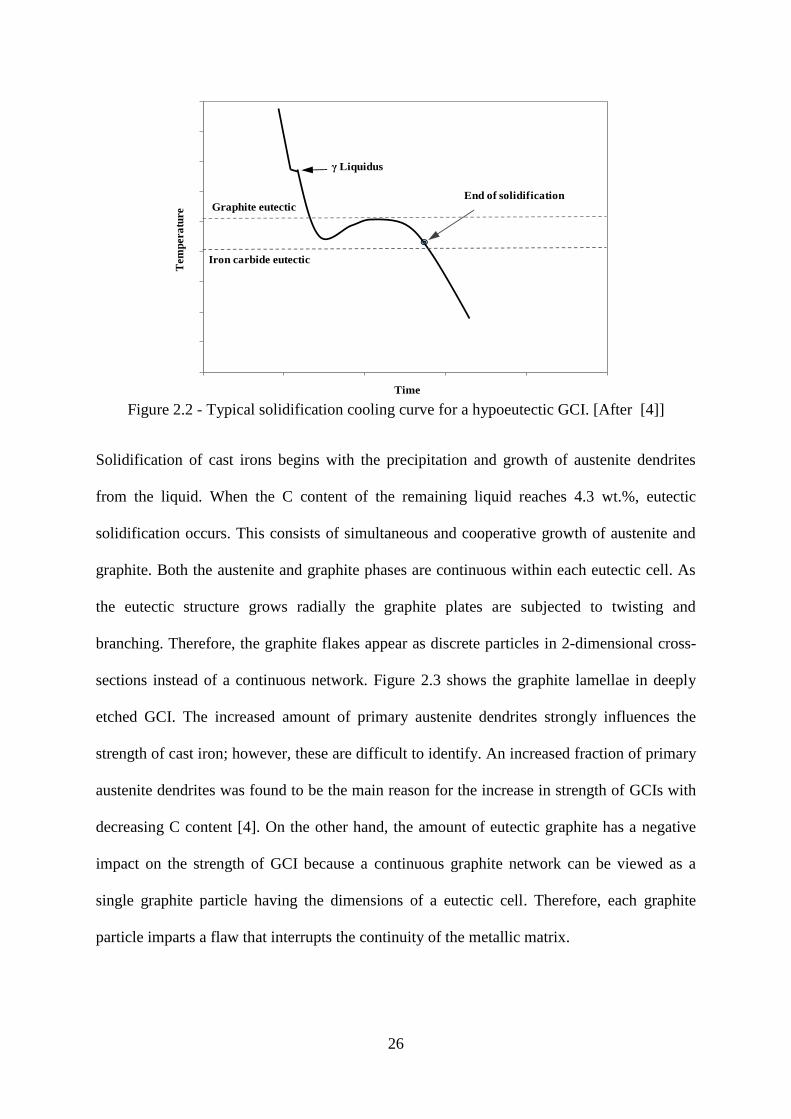
26
Figure 2.2 - Typical solidification cooling curve for a hypoeutectic GCI. [After [4]]
Solidification of cast irons begins with the precipitation and growth of austenite dendrites
from the liquid. When the C content of the remaining liquid reaches 4.3 wt.%, eutectic
solidification occurs. This consists of simultaneous and cooperative growth of austenite and
graphite. Both the austenite and graphite phases are continuous within each eutectic cell. As
the eutectic structure grows radially the graphite plates are subjected to twisting and
branching. Therefore, the graphite flakes appear as discrete particles in 2-dimensional cross-
sections instead of a continuous network. Figure 2.3 shows the graphite lamellae in deeply
etched GCI. The increased amount of primary austenite dendrites strongly influences the
strength of cast iron; however, these are difficult to identify. An increased fraction of primary
austenite dendrites was found to be the main reason for the increase in strength of GCIs with
decreasing C content [4]. On the other hand, the amount of eutectic graphite has a negative
impact on the strength of GCI because a continuous graphite network can be viewed as a
single graphite particle having the dimensions of a eutectic cell. Therefore, each graphite
particle imparts a flaw that interrupts the continuity of the metallic matrix.
Tem
per
atu
re
Time
γ Liquidus
End of solidificationGraphite eutectic
Iron carbide eutectic
27
Figure 2.3 - Graphite flakes in GCI (deep-etched in 50% HNO3).
Most of the alloying additions can change the eutectic C content thus changing the amounts
of eutectic austenite and graphite. The type, size and distribution of graphite flakes are a
function of solidification temperature and the rate at which solidification occurs, details are in
[2]. Type A graphite is most desirable and is a random distribution of graphite flakes. This
structure is normally obtained when the eutectic reaction begins and grows near the eutectic
temperature. Both Si and P reduce the eutectic C content. The C equivalent (CE) with the
addition of Si and phosphorus can be calculated by the relation:
CE = %C + 1/3(%Si + %P) (2.1)
This signifies that the Si and P are the substitutes for C. Therefore, addition of these elements
imparts a similar effect as C. Since pearlite is stronger than ferrite, a higher strength GCI can
be produced by increasing the pearlite content with the elimination of ferrite. Further,
strengthening can be achieved by refining the pearlite, which is related to a lower pearlite
reaction temperature that can be achieved by the following:
a) Rapid cooling that forces the transformations to occur at lower temperatures producing a
finer pearlitic structure.
28
b) Alloying additions that delay the initiation and growth of the pearlitic reaction [4].
2.1.1.1 Alloying Elements and GCI Microstructure
The desired mechanical properties for a particular service application can be achieved by the
addition of suitable alloying elements to cast irons. Some alloying elements segregate into the
liquid phase and lower the solidification temperature, which helps to retard the eutectic cell
growth. Elements such as V, Cr, Mo, P and Bi are known to increase the eutectic cell count.
Some alloying elements are very effective in imparting the finer pearlitic microstructure, but
have detrimental effects on the solidification process resulting in chill or carbides. Chill
means the undercooling of the melt to the temperatures below the iron-carbide eutectic
temperature, under such conditions C precipitates as carbide rather than graphite. Iron-carbide
raises hardness and drastically reduces the machinability and decreases the impact strength of
cast irons. These factors place foundry metallurgists in a quandary. For instance, Cr is very
effective in imparting pearlitic structures in thick sections. However, it may cause carbides in
thinner sections. Si can be added to balance the effect of chill and carbides. Nevertheless, it
reduces the strength of the casting by promoting ferrite in thick sections [4]. The effect of
various compositional constituents that were used in the current work is discussed in the
following section.
2.1.1.1.1 Si
Si addition reduces carbides; on the other hand, it reduces the strength of GCI because in
addition to raising CE, it promotes ferrite. It is also believed that Si has a negative effect on
pearlite strengthening because it raises A1 (eutectoid) temperature and temperature of pearlite
formation thus promoting coarse pearlite. Si depletes C from the cast iron matrix by ferrite
formation and this C adds to the graphite volume, which results in inferior mechanical
strength [4].
29
2.1.1.1.2 Mn
Mn reduces the amount of ferrite and moderately refines pearlite. It is required in excess to
combine with the sulphur present in the raw materials for producing GCI. Mn strongly
promotes pearlite because it stabilizes austenite by increasing the C solubility in austenite.
Large additions of Mn can alter the state of nucleation resulting in lower eutectic cell count
and coarse or undercooled graphite [4].
2.1.1.1.3 Cu
Cu is of dual character, it promotes the pearlite and also increases the amount of graphite.
The dispersity and stability of eutectoid pearlite can also be improved by the addition of Cu.
It also acts as a hardenability agent and the micro hardness of Cu alloyed pearlite can reach
600-700 HV or higher, though the mechanism by which it increases the hardenability is still
not known [5]. Cu weakly refines pearlite, nevertheless, in conjunction with other alloying
elements (such as Mo) Cu has a greater hardenability effect [4]. The maximum effect of Cu
on the degree of pearlitization of the structure occurs when it is contained in an amount of 1
wt.%. When the Cu concentration is high, it forms an insoluble phase. In copper bearing
pearlite, thin layers (about 3 nm) of a Cu-rich phase lie between the cementite and ferrite
lamellae. The thin layers of the Cu-rich phase were believed to play an important role in the
stabilization of pearlite due to low diffusivity of C atoms in this phase even at high
temperatures. For this reason, the Cu bearing pearlite is quite stable at high temperatures and
its decomposition by graphitization occurs very slowly [5]. Because of the graphitization
character of Cu, it can be used in partial substitution for Si to offset the chilling tendency
without promoting free ferrite [4].
2.1.1.1.4 Cr
Cr promotes pearlite because it increases the C solubility in austenite and inhibits the
nucleation of ferrite. It also promotes carbides and chill during solidification. While Si and

30
inoculation are effective in reducing chill caused by Cr, these are not effective in reducing the
interdendritic carbides [4].
2.1.1.1.5 Mo
Mo behaves in an unusual manner because it has a powerful retarding effect on the pearlitic
transformation, but a minimal effect on the ferrite formation. Mo additions delay the pearlite
reaction and allow more time for C diffusion leading to ferrite formation. Consequently,
adding Mo to an unalloyed iron may increase the ferrite in heavier sections. Therefore, Mo is
generally used in conjunction with pearlite promoting elements [4].
2.1.2 DCIs
In DCIs, the eutectic graphite separates from the molten iron during solidification in a similar
manner to GCIs. However, because of the addition of Mg or Ce (known as nodulizing
treatment) the graphite grows as spheres rather than flakes in GCIs [2]. Figure 2.4 shows the
dispersion of spheroidal or nodular graphite particles in a DCI matrix.
Figure 2.4 - Dispersion of graphite spheroids in a ferritic DCI (deep-etched with 50% HNO3).
31
Spheroidal graphite cast iron does not impart discontinuities in the metallic matrix as lamellar
graphite does. Therefore, the relatively high strength and toughness of DCI give an advantage
over GCI in several structural applications. On the other hand, the raw materials used for
DCIs must be of high purity. The presence of impurity elements such as sulphur must be
below specified limits to impart an effective nodulizing treatment. Moreover, DCI castings
need relatively large risers because of their increased tendency for shrinkage compared to
GCIs. These factors lead to the increased cost of DCI castings compared to GCI. The
mechanical properties of the DCIs with perfect spheroidal shape were found to be superior to
the shapes intermediate between true nodular form and flake form. The size and uniformity of
the distribution of graphite nodules also influence the properties, but to a lesser degree than
the shape. Small and numerous nodules usually give higher tensile properties and tend to
reduce the formation of chills in thin sections or edges [2].
2.1.2.1 Effect of Alloying in DCIs
The basic metallurgy of DCIs is similar to GCIs. However, as mentioned before, greater
metallurgical and process control is required in the production of DCIs. Mg imparts the
nodular shape to graphite, Mn and Cu serves the same purpose as in GCIs. A brief summary
of the effects of C and Si is as follows:
2.1.2.1.1 C
C influences the fluidity of molten iron and shrinkage characteristics during solidification. An
excess C in suspension instead of solution reduces fluidity. The volume of spheroidal
graphite is approximately 3.5 times the volume of iron. As DCI solidifies, excess C in
solution precipitates out and causes the expansion, which can offset the shrinkage of the DCIs
to some extent. Excess C can lead to a decrease of tensile strength and fatigue resistance of
DCIs. The size and number of graphite nodules formed are also influenced by the amount of
C [2].
32
2.1.2.1.2 Si
Si is a strong graphite promoter for both GCIs and DCIs. In addition to promoting ferrite,
increasing Si content contributes to solution strengthening and hardness of ferrite. High Si
DCIs have proved to be best suited for elevated temperature service [4].
2.1.3 Elevated Temperature Properties of Gray and Ductile Cast Irons
Scientifically, the maximum service temperatures of unalloyed or low alloy GCIs should be
in the 500-600°C range because, at higher temperatures, microstructural transformations can
lead to deterioration of mechanical properties [2]. DCIs are suitable for higher temperatures
because they possess higher strength and greater oxidation resistance than GCIs. Since GCIs
and DCIs are cheaper than steels, they are commonly employed in the temperature range of
700-1000°C [6]. Typical examples of high temperature applications are brake drums, hot mill
rollers, moulds for Al, Cu and pig iron casting, and tapping pipes.
The selection of cast irons for high temperature applications is difficult because it depends
upon balancing a number of material properties such as, dimensional stability, resistance to
oxidation, creep resistance and high temperature strength. Moreover, there is a lack of data on
the elevated temperature properties of cast irons, especially for service conditions involving
temperatures higher than 600°C [2].
The selection process is further complicated when the service conditions involve frequent
temperature variations because the material performance under such conditions depends upon
several factors such as thermal conductivity, elastic modulus, high temperature strength and
creep resistance. The repeated heating and cooling induces thermal fatigue. Higher elastic
modulus induces stresses of higher magnitude for the same temperature difference. Higher
thermal conductivity helps to distribute heat within the material more uniformly reducing the
temperature gradients within a component. Compared to DCIs, GCIs have inferior

33
mechanical strength; however, they exhibit low elastic modulus and higher thermal
conductivity. Thus all the required properties for the components under thermal fatigue
cannot be satisfactorily met by a single class of cast irons [7]. More details on the thermal
fatigue properties of cast irons are described in Appendix A. Elevated temperature properties
of gray and DCIs are briefly discussed in the following sections and more information can be
found in [2-3].
2.1.3.1 Growth and Oxidation
When cast irons are subjected to elevated temperatures of a continuous or interrupted heating
and cooling service, they have a tendency to grow in size (swell) and exhibit oxidation at the
surface. This may occur from one or more of the following factors [2]:
a) Decomposition of carbides.
b) The structural breakdown of the pearlite to ferrite, which is accompanied by the increased
volume of graphite particles.
c) Internal cracking owing to cyclic heating. Formation of these fine cracks accelerates the
oxidation. This internal oxidation contributes to the growth of GCI [7].
Growth in GCIs occurs more rapidly than DCIs. Growth was found to be more rapid in GCIs
with higher C contents. The resistance to growth can be enhanced by either producing a
ferritic matrix with no pearlite to decompose at elevated temperatures or stabilizing the
carbides so that their breakdown into ferrite or graphite can be prevented [2]. The most
effective growth reduction in GCIs can be achieved with strong carbide stabilizers such as Cr
and Mn. Moderate alloying additions of Cr, Cr+Mo and Cr+Mo+Ni decrease the amount of
growth in GCIs up to 500°C. The Cr+Mo combination was found to induce a dramatic effect
in reducing the growth of GCIs [2].
34
Unlike GCIs that experience growth by both graphitization and oxidation, the growth in DCIs
occurs from graphitization only. Annealed ferritic DCIs are free from growth up to 815°C,
while pearlitic cast irons begin to grow above 538°C owing to the decomposition of pearlite
to ferrite. Both ferritic and pearlitic DCIs show larger amounts of growth above 815°C, with
pearlitic irons growing more than the ferritic grades. Higher addition of Si alone or combined
with Mo stabilizes the ferritic matrix, and a Si-rich oxide layer at the surface inhibits further
oxidation [2].
2.1.3.2 Elevated Temperature Strength
In terms of elevated temperature strength, GCIs were found to be inferior to DCIs. However,
the strength of both types of cast irons can be enhanced by the addition of suitable alloying
elements. Increasing C content in GCIs adversely affects the high temperature strength.
Unalloyed GCIs exhibit small changes up to 400°C, while above this temperature the tensile
strength decreases quite rapidly. The Mo alloyed cast irons show greater resistance to plastic
deformation at temperatures above 400°C [8].
Turnbull and Wallace [9] also studied the elevated temperature strength of GCIs alloyed with
Mo and Cr in the temperature range of 427°C-650°C. The tensile strength was found to
increase with increasing the Mo content from 1.4-1.9 wt.% in both plain and Cr alloyed
GCIs. The tensile strength of unalloyed pearlitic DCIs decreases continuously with increasing
temperature. At about 400°C, it retains about two thirds of its room temperature strength,
whereas ferritic DCIs retain approximately 75% [2].
2.1.3.3 Creep Properties
A number of researchers studied the influence of alloying elements on the creep and stress
rupture properties of GCIs. Turnbull and Wallace [9] demonstrated the beneficial effects of
Cr and Mo additions on the stress rupture properties of GCIs in the temperature range of

35
400°C-650°C. The addition of Mo up to 2 wt.% to an unalloyed GCI continuously raised the
stress to rupture at all the temperatures. Additions of both Cr and Mo showed a substantial
increase in the creep and stress rupture properties of GCIs. Similarly, Gundlach [10] found
that the Cr and Mo additions improved the creep properties at 540°C, while the combined
addition of these alloying elements imparted synergetic effects to enhance the creep
properties.
The creep resistance of ferritic DCI is comparable to that of annealed low C steel up to 650°C
and improvement in creep strength can be achieved by alloying with Mo or Cu. The addition
of Mo up to 2 wt.% to high Si (4 wt.%) DCIs raises the rupture strength [2].
2.2 Formation and Growth Kinetics of Fe-Al Intermetallics
Liquid Al is extremely reactive to ferrous alloys. Fe-Al intermetallic compounds form
instantly on the surface of ferrous alloys when these are immersed in liquid Al [11-13] and
simultaneously the Fe substrate starts to dissolve into the melt. It is crucial to understand the
dissolution process of ferrous alloys in order to enhance their resistance against liquid Al
corrosion, which further requires an investigation of the chemical composition and growth of
the Fe-Al intermetallic compounds. A major portion of the present research is dedicated to
the characterization and determination of the growth kinetics of the intermetallic compounds
formed during the interaction between cast irons and liquid Al. Therefore, a review of the
previous investigations and the basics of Fe-Al interaction are presented in this section.
2.2.1 Fe-Al Binary System
The Fe-Al binary system can be described as an Fe based solid solution and six intermediate
non-stoichiometric intermetallic compounds, β1-Fe3Al, β2-FeAl, δ-FeAl2, ε-Fe2Al3, ε-Fe2Al5
and ζ-FeAl3. Figure 2.5 shows the Fe-Al binary phase diagram. Table 2.1 summarizes the
crystal structures and compositional stability ranges of the Fe-Al intermetallic compounds,
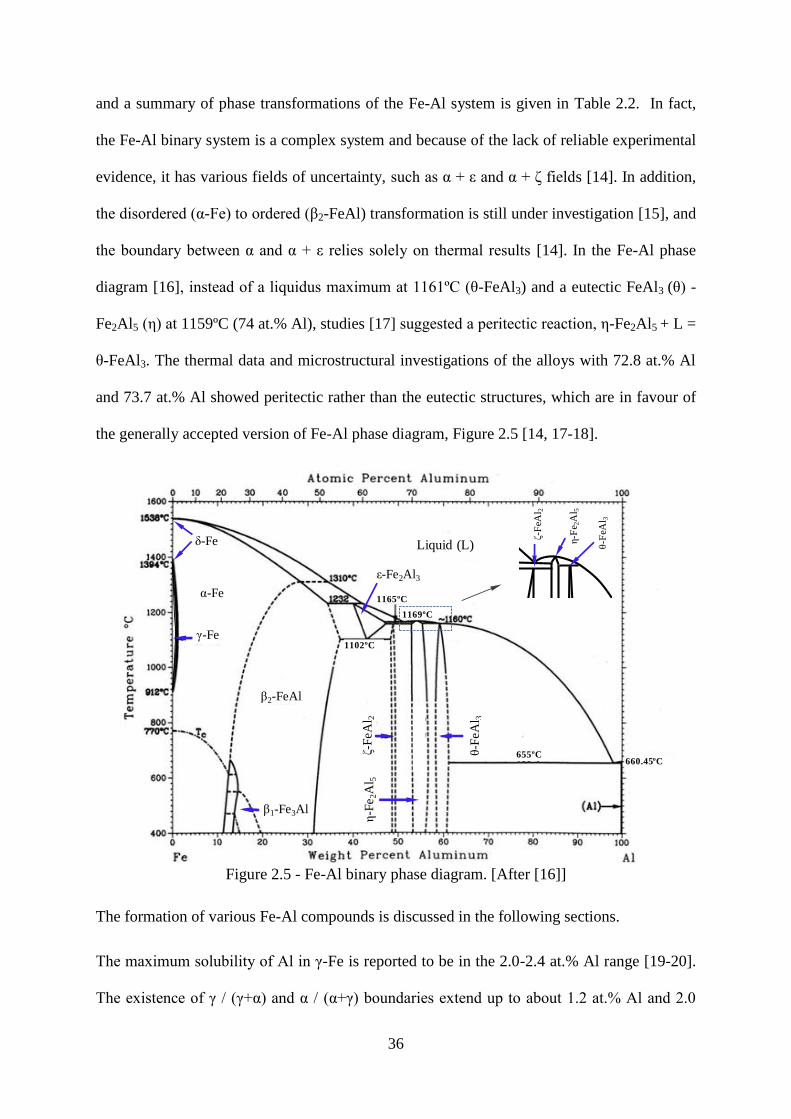
36
and a summary of phase transformations of the Fe-Al system is given in Table 2.2. In fact,
the Fe-Al binary system is a complex system and because of the lack of reliable experimental
evidence, it has various fields of uncertainty, such as α + ε and α + δ fields [14]. In addition,
the disordered (α-Fe) to ordered (β2-FeAl) transformation is still under investigation [15], and
the boundary between α and α + ε relies solely on thermal results [14]. In the Fe-Al phase
diagram [16], instead of a liquidus maximum at 1161ºC (ζ-FeAl3) and a eutectic FeAl3 (ζ) -
Fe2Al5 (ε) at 1159ºC (74 at.% Al), studies [17] suggested a peritectic reaction, ε-Fe2Al5 + L =
ζ-FeAl3. The thermal data and microstructural investigations of the alloys with 72.8 at.% Al
and 73.7 at.% Al showed peritectic rather than the eutectic structures, which are in favour of
the generally accepted version of Fe-Al phase diagram, Figure 2.5 [14, 17-18].
Figure 2.5 - Fe-Al binary phase diagram. [After [16]]
The formation of various Fe-Al compounds is discussed in the following sections.
The maximum solubility of Al in γ-Fe is reported to be in the 2.0-2.4 at.% Al range [19-20].
The existence of γ / (γ+α) and α / (α+γ) boundaries extend up to about 1.2 at.% Al and 2.0
γ-Fe
δ-Fe
δ-F
eA
l 2
α-Fe
β1-Fe3Al
ε-F
e2A
l 5
ζ-F
eA
l 3
β2-FeAl
ε-Fe2Al3
655ºC660.45ºC
1165ºC
1102ºC
1169ºC
ε-F
e 2A
l 5
δ-F
eAl 2
ζ-F
eAl 3
Liquid (L)
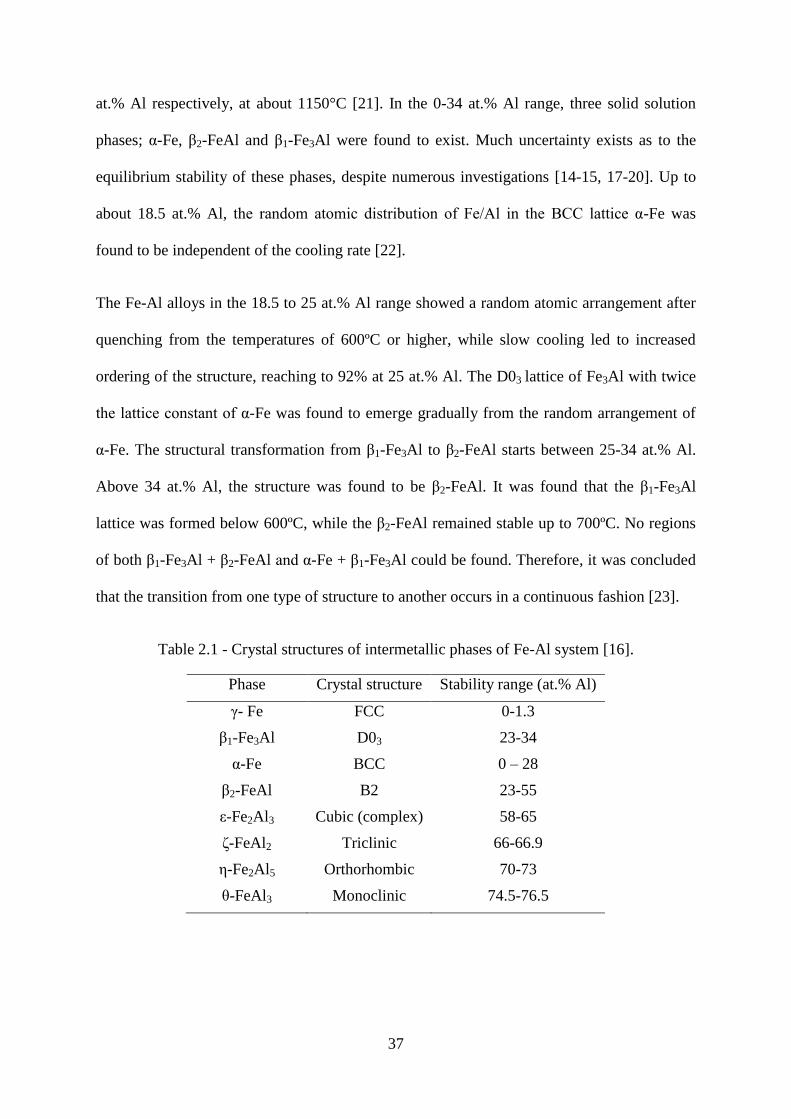
37
at.% Al respectively, at about 1150°C [21]. In the 0-34 at.% Al range, three solid solution
phases; α-Fe, β2-FeAl and β1-Fe3Al were found to exist. Much uncertainty exists as to the
equilibrium stability of these phases, despite numerous investigations [14-15, 17-20]. Up to
about 18.5 at.% Al, the random atomic distribution of Fe/Al in the BCC lattice α-Fe was
found to be independent of the cooling rate [22].
The Fe-Al alloys in the 18.5 to 25 at.% Al range showed a random atomic arrangement after
quenching from the temperatures of 600ºC or higher, while slow cooling led to increased
ordering of the structure, reaching to 92% at 25 at.% Al. The D03 lattice of Fe3Al with twice
the lattice constant of α-Fe was found to emerge gradually from the random arrangement of
α-Fe. The structural transformation from β1-Fe3Al to β2-FeAl starts between 25-34 at.% Al.
Above 34 at.% Al, the structure was found to be β2-FeAl. It was found that the β1-Fe3Al
lattice was formed below 600ºC, while the β2-FeAl remained stable up to 700ºC. No regions
of both β1-Fe3Al + β2-FeAl and α-Fe + β1-Fe3Al could be found. Therefore, it was concluded
that the transition from one type of structure to another occurs in a continuous fashion [23].
Table 2.1 - Crystal structures of intermetallic phases of Fe-Al system [16].
Phase Crystal structure Stability range (at.% Al)
γ- Fe FCC 0-1.3
β1-Fe3Al D03 23-34
α-Fe BCC 0 – 28
β2-FeAl B2 23-55
ε-Fe2Al3 Cubic (complex) 58-65
δ-FeAl2 Triclinic 66-66.9
ε-Fe2Al5 Orthorhombic 70-73
ζ-FeAl3 Monoclinic 74.5-76.5
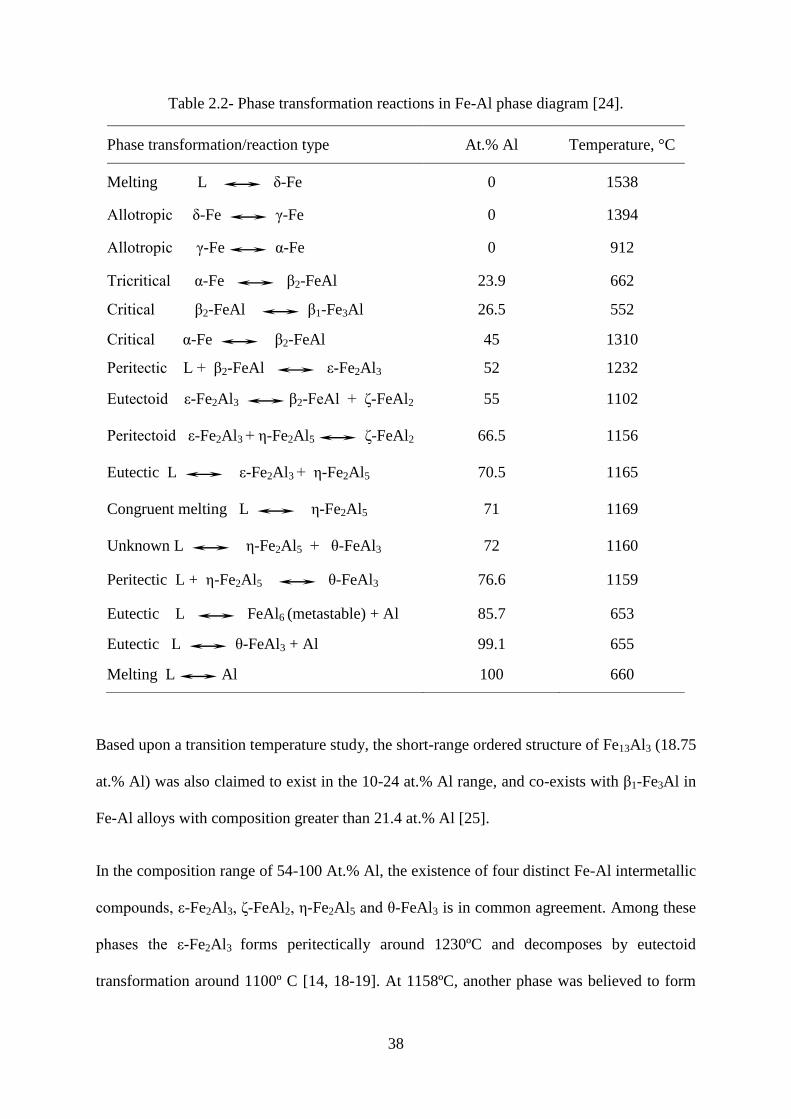
38
Table 2.2- Phase transformation reactions in Fe-Al phase diagram [24].
Based upon a transition temperature study, the short-range ordered structure of Fe13Al3 (18.75
at.% Al) was also claimed to exist in the 10-24 at.% Al range, and co-exists with β1-Fe3Al in
Fe-Al alloys with composition greater than 21.4 at.% Al [25].
In the composition range of 54-100 At.% Al, the existence of four distinct Fe-Al intermetallic
compounds, ε-Fe2Al3, δ-FeAl2, ε-Fe2Al5 and ζ-FeAl3 is in common agreement. Among these
phases the ε-Fe2Al3 forms peritectically around 1230ºC and decomposes by eutectoid
transformation around 1100º C [14, 18-19]. At 1158ºC, another phase was believed to form
Phase transformation/reaction type At.% Al Temperature, °C
Melting L δ-Fe 0 1538
Allotropic δ-Fe γ-Fe 0 1394
Allotropic γ-Fe α-Fe 0 912
Tricritical α-Fe β2-FeAl 23.9 662
Critical β2-FeAl β1-Fe3Al 26.5 552
Critical α-Fe β2-FeAl 45 1310
Peritectic L + β2-FeAl ε-Fe2Al3 52 1232
Eutectoid ε-Fe2Al3 β2-FeAl + δ-FeAl2 55 1102
Peritectoid ε-Fe2Al3 + ε-Fe2Al5 δ-FeAl2 66.5 1156
Eutectic L ε-Fe2Al3 + ε-Fe2Al5 70.5 1165
Congruent melting L ε-Fe2Al5 71 1169
Unknown L ε-Fe2Al5 + ζ-FeAl3 72 1160
Peritectic L + ε-Fe2Al5 ζ-FeAl3 76.6 1159
Eutectic L FeAl6 (metastable) + Al 85.7 653
Eutectic L ζ-FeAl3 + Al 99.1 655
Melting L Al 100 660
39
by peritectoid transformation in the composition range of 65-70 at.% Al [14]. This phase was
named as δ, and shown to be formed by ε + ε → δ peritectoid transformation reaction. Owing
to the rapid cooling and insufficient annealing, no single phase alloy could be obtained in this
range. Later the δ phase was shown to contain about 65 at.% Al and was consistent with δ-
FeAl2 [24]. The ε-Fe2Al5 phase forms by congruent melting reaction at about 1169°C and 71
at.% Al. At about 1159°C and 76.6 at.% Al, a peritectic reaction between the melt and ε-
Fe2Al5 produces ζ-FeAl3 [14, 17-18].
The existence of ζ-FeAl3 as a stable intermetallic compound is widely accepted; however, X-
ray studies [18] indicated the decomposition of ζ-FeAl3 into ε-Fe2Al5 and Fe2Al7 below
600ºC. The stability range of Fe2Al7 was found to be 77.5 to 78.6 at.% Al. The X-ray
diffraction (XRD) pattern of Fe2Al7 differed only slightly from that of ζ-FeAl3. In another
investigation [26], there was no difference in the XRD patterns of the alloys containing 76.4-
76.8 at.% Al, quenched from 900ºC or subjected to long term anneal at 470ºC. Therefore, it
was suggested that the ζ-FeAl3 does not decompose into ε-Fe2Al5 and /or Fe2Al7. Additional
work may be required to clarify these and other findings. There is also agreement on the
existence of the FeAl6 phase [16] (which is known to be metastable) and the ε-Fe2Al3 phase
exists above 1092°C. These phases are not relevant to the corrosion studies in Al melts.
Therefore, the formation of only the five phases, β1-Fe3Al, β2-FeAl, δ-FeAl2, ε-Fe2Al5 and ζ-
FeAl3, is of interest to the present study.
2.2.2 Intermetallic Compounds of Fe-Al Interaction
Several researchers have reported the formation of intermetallic compounds formed by liquid
Al interacting with pure Fe and steels [11-13, 27-34]. The formation of all the possible
intermetallic compounds shown by the Fe-Al equilibrium phase diagram, Figure 2.5, has
been discovered in Fe-liquid/solid Al interaction. However, these studies do not necessarily
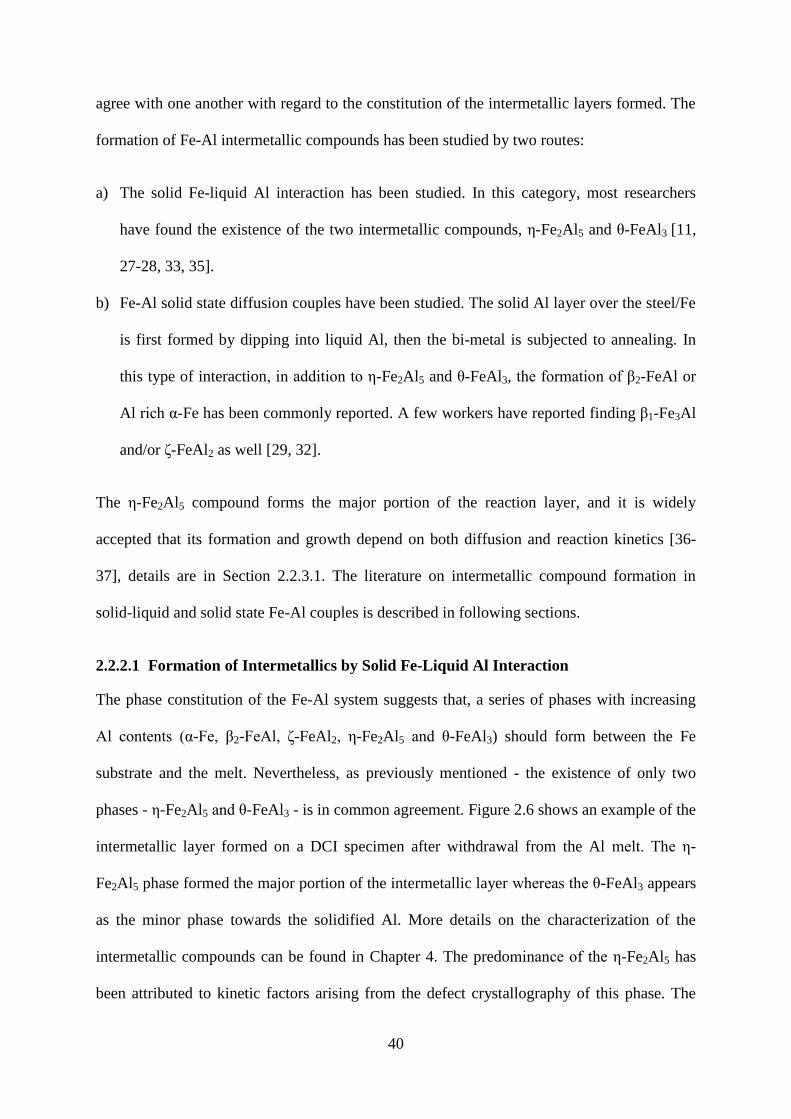
40
agree with one another with regard to the constitution of the intermetallic layers formed. The
formation of Fe-Al intermetallic compounds has been studied by two routes:
a) The solid Fe-liquid Al interaction has been studied. In this category, most researchers
have found the existence of the two intermetallic compounds, ε-Fe2Al5 and ζ-FeAl3 [11,
27-28, 33, 35].
b) Fe-Al solid state diffusion couples have been studied. The solid Al layer over the steel/Fe
is first formed by dipping into liquid Al, then the bi-metal is subjected to annealing. In
this type of interaction, in addition to ε-Fe2Al5 and ζ-FeAl3, the formation of β2-FeAl or
Al rich α-Fe has been commonly reported. A few workers have reported finding β1-Fe3Al
and/or δ-FeAl2 as well [29, 32].
The ε-Fe2Al5 compound forms the major portion of the reaction layer, and it is widely
accepted that its formation and growth depend on both diffusion and reaction kinetics [36-
37], details are in Section 2.2.3.1. The literature on intermetallic compound formation in
solid-liquid and solid state Fe-Al couples is described in following sections.
2.2.2.1 Formation of Intermetallics by Solid Fe-Liquid Al Interaction
The phase constitution of the Fe-Al system suggests that, a series of phases with increasing
Al contents (α-Fe, β2-FeAl, δ-FeAl2, ε-Fe2Al5 and ζ-FeAl3) should form between the Fe
substrate and the melt. Nevertheless, as previously mentioned - the existence of only two
phases - ε-Fe2Al5 and ζ-FeAl3 - is in common agreement. Figure 2.6 shows an example of the
intermetallic layer formed on a DCI specimen after withdrawal from the Al melt. The ε-
Fe2Al5 phase formed the major portion of the intermetallic layer whereas the ζ-FeAl3 appears
as the minor phase towards the solidified Al. More details on the characterization of the
intermetallic compounds can be found in Chapter 4. The predominance of the ε-Fe2Al5 has
been attributed to kinetic factors arising from the defect crystallography of this phase. The
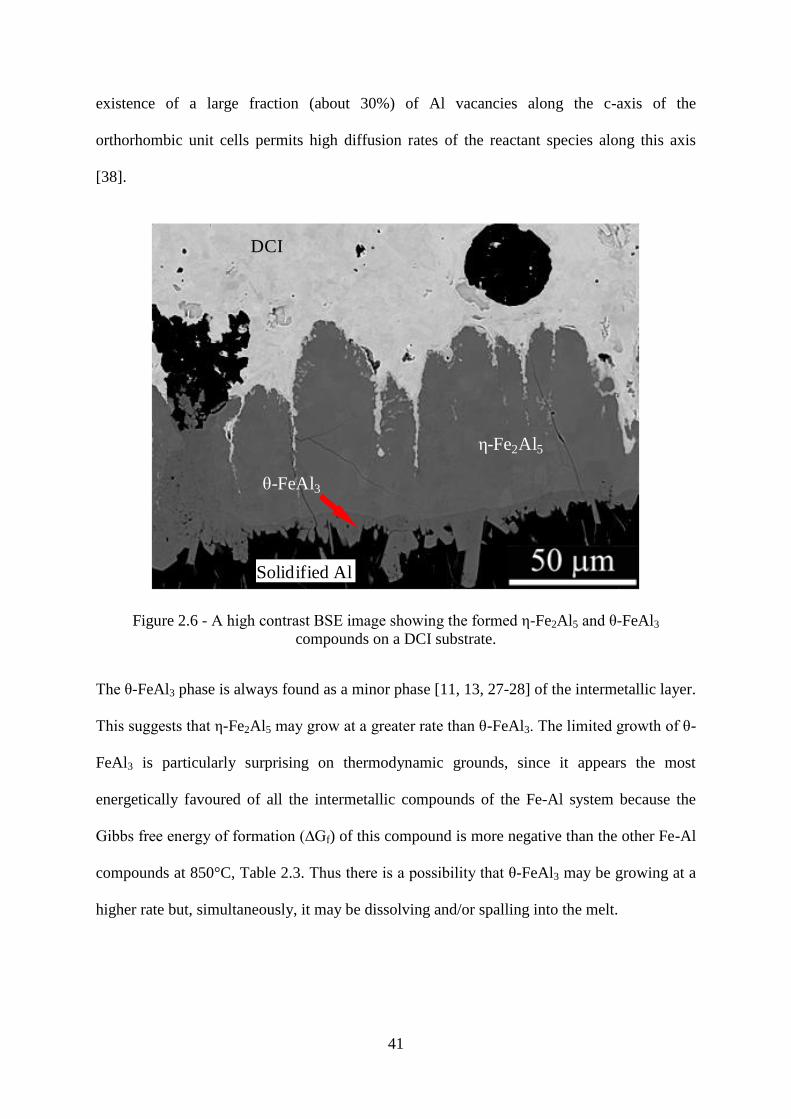
41
existence of a large fraction (about 30%) of Al vacancies along the c-axis of the
orthorhombic unit cells permits high diffusion rates of the reactant species along this axis
[38].
Figure 2.6 - A high contrast BSE image showing the formed ε-Fe2Al5 and ζ-FeAl3
compounds on a DCI substrate.
The ζ-FeAl3 phase is always found as a minor phase [11, 13, 27-28] of the intermetallic layer.
This suggests that ε-Fe2Al5 may grow at a greater rate than ζ-FeAl3. The limited growth of ζ-
FeAl3 is particularly surprising on thermodynamic grounds, since it appears the most
energetically favoured of all the intermetallic compounds of the Fe-Al system because the
Gibbs free energy of formation (∆Gf) of this compound is more negative than the other Fe-Al
compounds at 850°C, Table 2.3. Thus there is a possibility that ζ-FeAl3 may be growing at a
higher rate but, simultaneously, it may be dissolving and/or spalling into the melt.
DCI
ε-Fe2Al5
ζ-FeAl3
Solidified Al
42
Table 2.3 Gibbs free energy of the formation of various Fe-Al compounds at 850°C [39].
Phase Free energy of formation
∆G850°C (J mol-1
)
β1-Fe3Al 34269
β2-FeAl - 48747
δ-FeAl2 - 69108
ε-Fe2Al5 - 95707
ζ-FeAl3 - 102980
Jones and Denner [40] suggested that the formation of ζ-FeAl3 as a reaction product at the ε-
Fe2Al5 surface is difficult to establish. This conclusion was put forward because Al dissolves
about 2.5 at.% Fe at 700°C. Cooling to 655ºC (eutectic) initiates the separation of ζ-FeAl3 at
approximately at 1 at.% Fe, then it may grow on the ε-Fe2Al5 surface or within the melt
solidifying at the outer surface of the intermetallic layer. Furthermore, a mechanism to
account for the absence or limited growth of the ζ-FeAl3 phase was proposed, which involves
the stresses generated from the growth of this phase. These growth stresses within the layer
prevent further compound formation and then the formation and spallation of ζ-FeAl3
repeatedly occurs. The same authors [41] also observed the ζ-FeAl3 layer for interaction
times of less than 15s and revealed inclusions of ζ-FeAl3 particles within the ε-Fe2Al5 phase
layer. So there is a basis for hypothesizing that these two intermetallics can form and grow
simultaneously. The absence of the ζ-FeAl3 layer at longer immersion times was reported and
attributed to its dissolution and rapid conversion to ε-Fe2Al5 [41]. These authors described
the both type of possibilities of formation of ζ-FeAl3. However, it remains unclear that these
particles grow during ongoing Fe-liquid Al interaction and/or during solidification of Al
around the sample.
In the literature, there is uncertainty as to the identification of the particles found in the outer
solidified Al. Some studies [42-43] claimed ζ-FeAl3, while another [27] suggested these
43
phases were of several compositions such as ε-Fe2Al5, δ-FeAl2 and ζ-FeAl3. It is to be noted
that these particles were identified on the basis of EDS, no precise characterization was made.
In 1994, Richards et al. [13] published an extensive review on the metallurgy of hot dip
aluminizing that included a number of previous reports on the formation of intermetallic
compounds by Fe-Al interaction. Therefore, only a few of the latest investigations are
discussed here.
Bouche et al. [28] studied the interaction between Armco Fe (99.78 wt.%) and high purity
liquid Al in the temperature range of 700°C-800°C. EDS analysis indicated the presence of ε-
Fe2Al5 (adjacent to Fe) and ζ-FeAl3 adjacent to Al. XRD patterns were consistently indexed
as orthorhombic structure of ε-Fe2Al5 (a = 0.7675 nm, b = 0.6403 nm, c = 0.4203 nm) and a
monoclinic structure of ζ-FeAl3 (a = 1.5489 nm, b = 0.8083 nm, c = 1.2476 nm). To evaluate
the Fe/Al interdiffusion coefficients, these authors [28] assumed that that ζ-FeAl3 layer
adjacent to ε-Fe2Al5 grows during ongoing liquid Al corrosion and the ζ-FeAl3 particles grow
during solidification. However, it is difficult to consider and analyse the ζ-FeAl3 intermetallic
layer separately to the ζ-FeAl3 particles, Figure 2.6 shows an example.
Bouayad et al. [27] also found the existence of only two intermetallic compounds (ε-Fe2Al5
and ζ-FeAl3) formed during the interaction of solid Fe and liquid Al in the temperature range
of 700°C-800°C. The origin of the columnar morphology of ε-Fe2Al5, similar to that shown
in, Figure 2.6 remains unexplained, although, the anisotropic diffusion owing to the high
vacancy concentration along the c-axis of the ε-Fe2Al5 structure [38] could be a possible
explanation.
Shahverdi et al. [11] studied the interaction between pure Fe and liquid Al maintained at
800°C. Rectangular coupons, 60 mm x 20 mm x 17 mm, were ground and polished using 0.5
μm diamond paste and immersed into liquid Al for 90-3000s. By using EDS and XRD, the
44
intermetallic compounds were identified as ε-Fe2Al5 (about 200 μm thick) and ζ-FeAl3 with
the latter being the minor phase (10 μm thick). The microhardness (Hv) of ε-Fe2Al5 was
found to be in the range of 700-800, whereas ζ-FeAl3 exhibited relatively higher hardness
with a value of 900-1000 Hv. The solidified Al layer was found to contain needle shaped
particles, which were not identified and it was suggested that these may have resulted from
the mixing of Fe within the melt. Furthermore, owing to the higher hardness of the ζ-FeAl3
phase it was suggested that cracking of this layer is easier than the ε-Fe2Al5 owing to the
stresses generated during the intermetallic reaction. It was further suggested that it is possible
to miss the existence of ζ-FeAl3 because of the following:
a) The small quantity of ζ-FeAl3 owing to its slower growth than the ε-Fe2Al5
b) the similarity between the XRD patterns of ε-Fe2Al5 and ζ-FeAl3
c) the spalling, subsequent remelting and dissolution of ζ-FeAl3.
Shih and Tu [34] performed hot dipping experiments using 1020 (0.2 wt.% C) and 1040 (0.4
wt.% C) steel bars (d = 16 mm and l = 50 mm) that were immersed into commercial purity Al
and Al-7 wt.% Si alloy melts at 700°C for time periods varying between 3-60 minutes. They
apparently found only the ε-Fe2Al5 phase because nothing was mentioned about the ζ-FeAl3
phase. The ε-Fe2Al5 intermetallic layer morphology of 1040 steel was found to grow over
time from a columnar structure to a planner interlayer and finally become ragged following
the increased dipping time in pure Al melt. The columnar morphology was found to be much
more apparent for the 1020 steel than for the 1040 steel.
In comparison with the pure Al melt, the reactive layer in Al-7 wt.% Si alloy melt was found
to be thinner, which was attributed to the presence of Si in the reaction layer leading to the
slower interdiffusion rates of Fe and Al atoms. However, the dissolution of the intermetallic
layer was not considered. C diffusion to the ferrite boundaries and to the interface between

45
the steel surface and the intermetallic phase was also reported, which suggested the
enrichment of C along the growing projections of ε-Fe2Al5. Moreover, the C entrapped in the
ε-Fe2Al5 layer in the form of so-called “white spots” was believed to contain aluminium
carbide (Al4C3) particles [34]. Before the report of [34], in high carbon steels a thin C
enrichment zone has also been suggested to form ahead of the ε-Fe2Al5 projections [44].
However, owing to the lack of experimental verification, Richards et al. [13] disregarded the
formation of such a zone and suggested this as the α-Fe solid solution. Research needs to
address the confirmation of such a zone if it forms under some specific material and liquid Al
exposure conditions.
Shih and Tu [34] also suggested an oxide film based mechanism to account for the columnar
structure of ε-Fe2Al5. When a ferrous alloy comes into contact with liquid Al, the air trapped
in the surface notches would react with liquid Al to form Al2O3, then the oxide particles form
and/or the oxide film fractures, which provide specific sites for nucleation and subsequent
growth of ε-Fe2Al5. The columnar (ε-Fe2Al5) growth proceeds preferentially in a direction
perpendicular to the steel substrate and also towards the parallel sides, afterwards the side
growth stops due to the impingement of side walls of growing columns [34].
Niinomi and Ueda [12] published the results of their study on several ferrous alloys including
pure Fe, Fe-C, Fe-Si, Fe-Mn, Fe-Ni, Fe-Cu and Fe-Cr, the alloying contents in these materials
were 2 wt.% and 3 wt.%. These alloys were dipped into liquid Al at 700°C, 750°C and 800°C
for various time periods. Irrespective of the chemical composition of the alloys under
investigation, only the two phases, ε-Fe2Al5 and ζ-FeAl3 were found in the reaction layers.
Cementite was found to remain in the intermetallic layer of Fe-3 wt.% C alloy formed at
700°C; however, it was not observed at 750°C and 850°C. The presence of cementite was not
observed on Fe-2 wt.% C alloy intermetallic layer at any temperature. In Fe-3 wt.% Si alloy,
46
the Si enrichment at the interface of the substrate/intermetallic layer was found; however, the
existence of any Fe-Al-Si compound was not clarified. Moreover, an Al-rich α-Fe was found
to exist between the Fe-substrate and projections of ε-Fe2Al5 phase in most of the ferrous
alloys except the Fe-C and Fe-Cu combinations. These alloying elements are commonly (Si,
C, Mn, Cu, Cr and Mo) added to cast irons, it would be interesting to know their effect on
compound formation and liquid Al corrosion mechanisms.
In a recent (2010) publication, Balloy et al. [45] presented the results of a study on
intermetallic compound formation by the interaction of GCIs and steel with saturated (4 wt.%
Fe) liquid Al melt. Two GCIs, one ferritic (3.5 wt.% C, 4.50 wt.% Si, 0.22 wt.% Mn), the
other pearlitic (3.7 wt.% C, 1.76 wt.% Si, 0.68 wt.% Mn, 1.1 wt.% Cr, 1.9 wt.% Al, 0.37
wt.% P) and AISI 1030 steel (0.37 wt.% C) were immersed into Al melt at 690°C for time
periods of 2, 8 and 72 hours. After 72 hours of interaction, in addition to ε-Fe2Al5 and ζ-
FeAl3, the steel substrate was found to form a solid solution with Al (α-Fe) and a layer
composed of δ-FeAl2. These results were based upon the EDS analysis of the intermetallic
layers, no precise confirmation was made. In addition, the precipitation of needle shape
particles (a few microns long) was also found towards the steel substrate. These particles
were not characterized but were suggested to be graphite or Al4C3. In cast irons specimens, Si
enrichment was found between the cast iron substrate and ε-Fe2Al5 projections. However, no
δ-FeAl2 phase layer was detected in the case of cast irons.
Komatsu et al.[30] studied the effect of Si on the intermetallic layer composition by
subjecting various alloys to pure Al and Al-Fe-Si alloy melts in the 700°C-770°C temperature
range. When Si was added to Fe or liquid Al, two intermetallic layers were always present in
the reaction zone: The one closest to the Fe matrix was composed of ε-Fe2Al5 and the other
47
closest to Al was composed of a mixture of ζ-FeAl3 and Al. The solubility of Si in the
columnar layer (ε-Fe2Al5) was determined to be 2-3 wt.% by EDS.
2.2.2.2 Intermetallic Compounds in Solid Fe-Al Couples Subjected to Annealing
Cheng et al. [46] investigated the intermetallic compounds formed on commercial steel with
composition 0.14 C, 0.48 Si, 0.34 Mn, 5.25 Cr and 0.55 Mo (in wt.%). Rectangular
specimens of the dimensions 20 mm x 8 mm x 1 mm were aluminized in a molten Al bath at
700°C for 180s. After the hot dip treatment, the specimens were exposed to a temperature of
750°C for times varying between 8 minutes to 72 hours. After 15 minutes of diffusion
treatment, the ζ-FeAl3 phase and solidified Al layer disappeared and only the single phase ε-
Fe2Al5 was found. After 1 hour interaction, two new phases, δ-FeAl2 and β2-FeAl were found
between ε-Fe2Al5 and the steel substrate. Only the β2-FeAl and δ-FeAl2 phases were found
after 72 hours of diffusion. It was found difficult to clearly characterize the β2-FeAl phase
with EBSD because of the similar body centred structures of β2-FeAl and α-Fe. However,
EDS revealed a uniform layer of similar composition of β2-FeAl phase. From the Fe-Al
binary phase diagram, at 750ºC the solubility of Fe in Al and Al in Fe is about 2 at.% and 24
at.%, respectively. On the basis of this fact, it was suggested that the precipitation of Fe-Al
intermetallic compounds is easier on the Al-rich side than the Fe-rich side [46].
Kobayashi and Yakou [29] published their research on aluminized specimens of structural
steel (0.44 C, 0.21 Si and 0.82 Mn, in wt.%). The steel specimens were aluminized in
commercial grade Al (99.7 wt.% Al) maintained at 700°C-900°C. Afterwards, the aluminized
specimens were subjected to diffusion treatments at the temperatures of 600°C, 800°C,
1000°C and 1100°C for 20-60 minutes. The reaction products were analyzed using XRD. The
coating layers of all the aluminized specimens exhibited only the two phases, ε-Fe2Al5 and ζ-
FeAl3. For diffusion temperatures lower than 1000°C, a single phase (ε-Fe2Al5) intermetallic
48
layer was found, while the Fe rich intermetallic compounds β2-FeAl and β1-Fe3Al were found
to evolve at temperatures higher than 1000°C.
Murakami et al. [32] developed a new method of aluminizing the surface of iron and steel
utilizing a powder liquid coating method. Discs of high purity Fe (99.9 wt.%) were used as
specimens. A paste of Al and Ti powders mixed with ethylene glycol was applied to the
specimens. Subsequently these were dried at 200°C for 1 hour. Afterwards, the specimens
were annealed at 900°C and 1000°C under a vacuum of 1.3 x 10⁻³
Pa. XRD, EDS and Auger
electron spectrometry (AES) were used to characterize the intermetallic compounds. Two
types of heat treatments were applied. In both type of heat treatments, the specimens were
heated at a rate of 1.33°C/s. In the first type, immediately after attaining the set temperature
the specimens were quenched in nitrogen gas flow. In the second type, before quenching, the
specimens were isothermally annealed at a fixed temperature for predetermined times. In the
specimens of first type of treatment, ε-Fe2Al5 was found to be the major phase of the
intermetallic layer. No clear δ-FeAl2 layer was formed in the specimen quenched from 900°C,
whereas a 10 μm thick layer of δ-FeAl2 was observed by EDS in the specimens quenched
from 1000°C. In the isothermally annealed specimens at 1000°C for 1080s, the ε-Fe2Al5 and
δ-FeAl2 compound layers were no longer apparent, and the entire layer consisted of α-Fe.
This phase was suggested as α-Fe instead of β2-FeAl, which was attributed to the broad solid
solubility of Al in α-Fe, therefore, all the Al at the surface can be involved in the α-Fe phase.
From these studies it is clear that that when there is not enough Al to form ε-Fe2Al5 or ζ-
FeAl3, the formation of Fe-rich phases overrides the strong growth kinetics of the former
phases. In other words, the Fe rich phases grow at a slower rate than ε-Fe2Al5. As a general
consideration, with the ongoing interaction of Fe-Al, the Al in the outer layer gets consumed
with time and in the shortage of Al the Fe-rich Fe-Al compounds tend to grow.

49
Maitra and Gupta [31] studied the pure Fe and a high purity Al-Si melt interaction in the
temperature range of 600°C-900°C. ε-Fe2Al5 was the only intermetallic phase at 600°C, but
the β2-FeAl and ε-Fe2Al5 phases were observed at 800°C. The solubility of Si was found to
be small in the 1-7 at.% range in ζ-FeAl3, ε-Fe2Al5 and ζ-FeAl3, but relatively high (17 at.%)
in the β2-FeAl phase.
2.2.3 Growth Kinetics of Fe-Al Intermetallic Compounds
The growth of intermetallic compound layers that initially evolve by subjecting the ferrous
alloys to liquid Al depends upon several factors, such as melt temperature and composition,
time of interaction, and constitution of the Fe substrate [27-28, 33, 47]. The control of
intermetallic layers is considered important in many manufacturing processes such as
diffusion bonding, hot dip aluminizing and Fe-Al composites. Therefore, the growth kinetics
of intermetallic compounds in Fe-Al systems has been extensively studied for improving the
interfacial strength between ferrous substrates and Al [13, 32, 48]. The intermetallic layer
growth kinetics are also important to understand the process of dissolution of ferrous alloys
into liquid Al melts [37]. However, there are very few systematic studies that considered the
dissolution while investigating the Fe-Al intermetallic layer growth kinetics. The literature
presented in this section will provide some insight into the kinetics of intermetallic layer
growth in solid Fe-liquid Al systems.
2.2.3.1 Reaction-Diffusion Mechanism of Compound Formation
When ferrous substrates are subjected to liquid Al, the alloy layer formation occurs by a
mechanism known as reaction-diffusion. As the name implies, it is a mechanism of
compound formation governed principally by a combination of reaction and diffusion within
the solid product or intermetallic compound. Many excellent textbooks are available detailing
the theory of diffusion. Nevertheless, there are only a few theoretical descriptions [36-37] of
solid-solid and solid-liquid interaction phenomena, especially where the formation of

50
intermetallic compounds is involved. In bi-metal systems, the term reaction-diffusion [36]
implies that the intermetallic compound formation progresses by the two processes:
a) Diffusion of the atoms of the two components in opposite directions across the
intermetallic compound.
b) Chemical reaction taking place at the compound/substrate interfaces with the involvement
of the diffusing atoms of one component and the surface atoms of the other component.
Figure 2.7 shows a schematic of the compound formation between two pure solids A and B.
Figure 2.7 - A schematic of the reaction-diffusion mechanism of compound formation
between two solids. [After [36]]
In the initial period of interaction between two substances, when there is no compound layer,
the two substances can react directly at a common interface. This stage includes the
nucleation of the compound ApBq at the A-B interface. In Fe-liquid Al systems, the initial
layer thickness was found to be small, and it forms in less than a minute - a small fraction of
the total interaction time. However, in this time period the growth kinetics were found to be
fast as compared to the subsequent time period of interaction [36]. In the initial time period
the supply of A and B atoms at the respective surfaces Surface-B and Surface-A is almost
Conce
ntr
atio
n o
f B
Distance x
Solid BSolid A Compound ApBq
Surface A Surface B
Conce
ntr
atio
nof
A
Component A
Component B

51
instantaneous because of the short diffusion paths. This regime is known as a kinetic regime
in which the compound grows at the highest possible rate under the given conditions, also
known as reaction controlled growth.
At longer interaction times, the compound growth is diffusion controlled; indeed the growing
layer continuously complicates the supply of atoms at the respective surfaces. Therefore, with
the passage of time, the total rate of formation of the intermetallic layer becomes more and
more dependent on diffusion, whereas the effect of the rate of chemical transformations
gradually decreases and becomes insignificant. Considering the compound layer formation
due to the diffusion of atoms of solid A and solid B, a generalized relationship was derived
by [36]:
x2 = 2 k1t (2.2)
where k1 is the diffusional constant of A and B atoms in ApBq
More commonly [13, 29, 33] diffusion controlled growth is represented by a parabolic rate
equation of the form:
x2
= k t (2.3)
where k is the growth rate constant having units m2s
-1.
or
x = k′ t1/2
(2.4)
where k′ = k1/2
.
In solid bi-metal couples, the applicability of the parabolic growth is well established [29,
36]. However, in solid-liquid systems [33, 47], intermetallic layer growth showed deviations
from the parabolic law of compound growth.
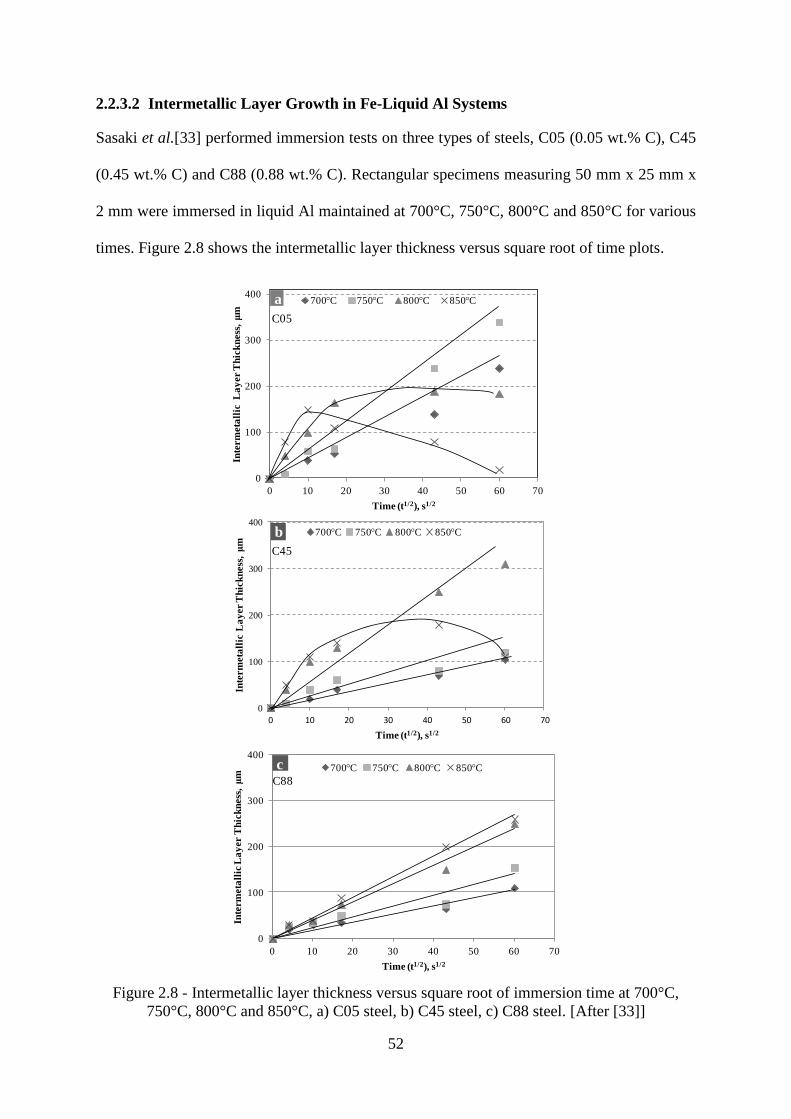
52
2.2.3.2 Intermetallic Layer Growth in Fe-Liquid Al Systems
Sasaki et al.[33] performed immersion tests on three types of steels, C05 (0.05 wt.% C), C45
(0.45 wt.% C) and C88 (0.88 wt.% C). Rectangular specimens measuring 50 mm x 25 mm x
2 mm were immersed in liquid Al maintained at 700°C, 750°C, 800°C and 850°C for various
times. Figure 2.8 shows the intermetallic layer thickness versus square root of time plots.
Figure 2.8 - Intermetallic layer thickness versus square root of immersion time at 700°C,
750°C, 800°C and 850°C, a) C05 steel, b) C45 steel, c) C88 steel. [After [33]]
0
100
200
300
400
0 10 20 30 40 50 60 70
Inte
rm
eta
llic
L
ay
er T
hic
kn
ess
, μ
m
Time (t1/2), s1/2
700°C 750°C 800°C 850°Ca
0
100
200
300
400
0 10 20 30 40 50 60 70
Inte
rm
eta
llic
La
yer T
hic
kn
ess
, μ
m
Time (t1/2), s1/2
700°C 750°C 800°C 850°Cc
0
100
200
300
400
0 10 20 30 40 50 60 70
Inte
rm
eta
llic
La
yer T
hic
kn
ess
, μ
m
Time (t1/2), s1/2
700°C 750°C 800°C 850°Cb
C05
C45
C88
53
In the case of the C05 steel, the alloy layer thickness at temperatures lower than 800°C
increased linearly with increasing time (t1/2
). However, at temperatures of 800°C or higher the
intermetallic layer thickness showed a maxima and then decreased with increasing t1/2
. This
tendency, wherein intermetallic layer thickness decreases, was most remarkable at 850°C.
The C88 steel, behaved differently from the steels with lower carbon contents: at all the
temperatures the intermetallic growth followed a parabolic relationship. It was conjectured
that the dissolution of all the steels occurs at a higher rate when the temperature is raised,
which could lead to the thinning of the intermetallic layer; however, no dissolution analysis
was made. The reasons behind the consistent increase in intermetallic thickness with the rise
in temperature of the high carbon steel (C88) were not analyzed in Sasaki et al.‟s work.
Bouche et al. [28] investigated the growth kinetics of intermetallic layers on pure Fe
specimens immersed into the liquid Al at 700°C, 800°C and 900°C. The electrolytically
polished rectangular specimens, 35 mm x 5 mm x 3 mm, were immersed into liquid Al for
various time periods between 30s to 45 minutes. The growth of intermetallic layers was
measured from the initial solid (Fe-substrate)-liquid boundary. Depending upon the
immersion time, different behaviours of intermetallic growth were observed. For 30s, the
solid-liquid boundary moved towards liquid at all temperatures. For longer immersion time
(900s), there was an increase in thickness at 700°C and loss of thickness at higher
temperatures (800°C and 900°C). In the case of movement of solid-liquid boundary towards
solid, Bouche et al. [28] concluded that dissolution has mainly taken place and on the
contrary a growth towards liquid shows the predominance of the growth. Based upon these
observations, it was suggested that more than one mechanism was involved during the solid-
liquid interaction. However, no further details were found on the effect of dissolution on the
intermetallic layer growth.
54
Shahverdi et al. [47] performed a series of experiments to investigate the kinetics of
intermetallic layer growth in solid Fe and liquid Al couple. Rectangular, 60 mm x 20 mm x
1.7 mm, Fe coupons (0.1 wt.% C, 0.34 wt.% Mn, 0.1 wt.% Si) were immersed into liquid Al
at 700°C, 800°C and 900°C for various time periods. At 700°C and 800°C, the thickness of
the intermetallic layer increased monotonically with immersion time. However, in the case of
900°C the thickness of the intermetallic layer reached a maximum at about 400s and
decreased afterwards.
After dipping tests, the total dimensions of each specimen were also noted; it was found that
for 700°C and 800°C specimen thickness including the intermetallic layer increased up to
1500s and 750s, respectively. At 900°C, the initial thickness of the Fe coupon decreased
continuously from 185s and at 3000s, the Fe specimen was completely dissolved into liquid
Al. They [47] suggested that the dissolution of Fe specimens was started at about 1500s, 750s
and 185s for 700, 800 and 950°C respectively. To demonstrate the effect of dissolution on the
parabolic growth, two types of trend lines showing the intermetallic layer growth were
plotted; Figure 2.9 shows an example at 800°C.
Figure 2.9 - Square of intermetallic thickness plotted against time for 800ºC. [After [47]]
0
10000
20000
30000
40000
0 500 1000 1500 2000 2500 3000 3500
(In
term
eta
llic
La
yer T
hic
kn
ess
)2,
μm
2
Time, s
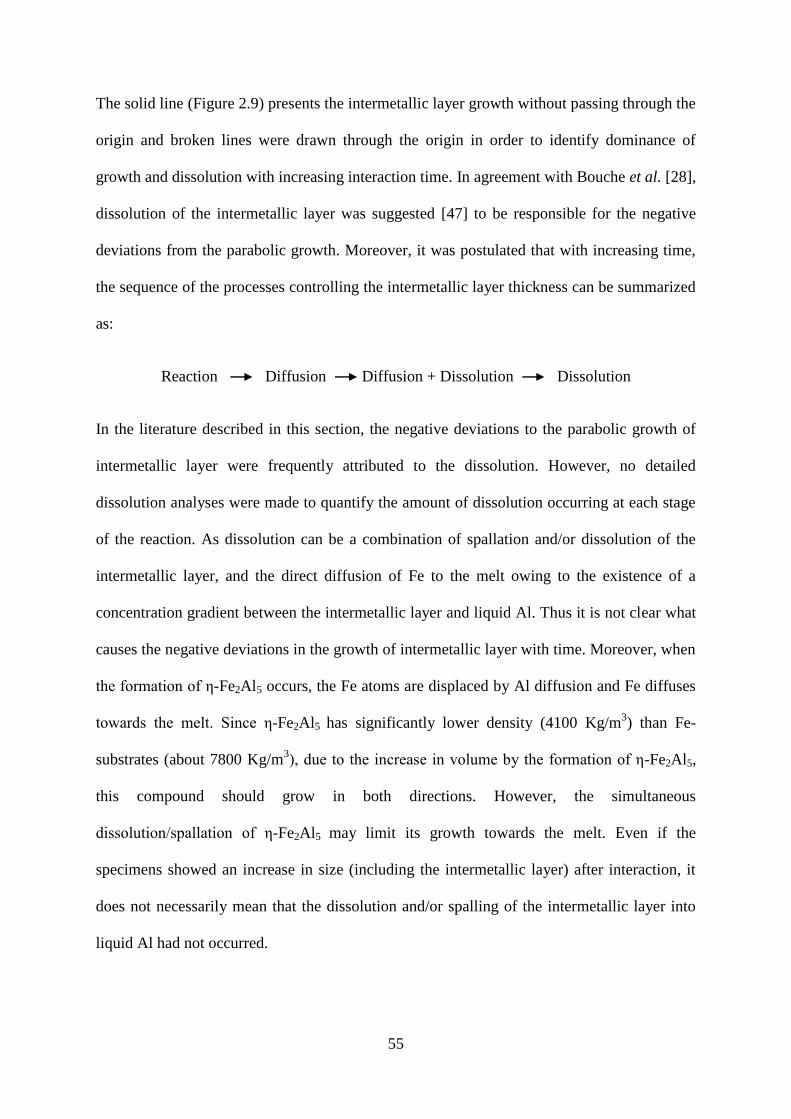
55
The solid line (Figure 2.9) presents the intermetallic layer growth without passing through the
origin and broken lines were drawn through the origin in order to identify dominance of
growth and dissolution with increasing interaction time. In agreement with Bouche et al. [28],
dissolution of the intermetallic layer was suggested [47] to be responsible for the negative
deviations from the parabolic growth. Moreover, it was postulated that with increasing time,
the sequence of the processes controlling the intermetallic layer thickness can be summarized
as:
Reaction Diffusion Diffusion + Dissolution Dissolution
In the literature described in this section, the negative deviations to the parabolic growth of
intermetallic layer were frequently attributed to the dissolution. However, no detailed
dissolution analyses were made to quantify the amount of dissolution occurring at each stage
of the reaction. As dissolution can be a combination of spallation and/or dissolution of the
intermetallic layer, and the direct diffusion of Fe to the melt owing to the existence of a
concentration gradient between the intermetallic layer and liquid Al. Thus it is not clear what
causes the negative deviations in the growth of intermetallic layer with time. Moreover, when
the formation of ε-Fe2Al5 occurs, the Fe atoms are displaced by Al diffusion and Fe diffuses
towards the melt. Since ε-Fe2Al5 has significantly lower density (4100 Kg/m3) than Fe-
substrates (about 7800 Kg/m3), due to the increase in volume by the formation of ε-Fe2Al5,
this compound should grow in both directions. However, the simultaneous
dissolution/spallation of ε-Fe2Al5 may limit its growth towards the melt. Even if the
specimens showed an increase in size (including the intermetallic layer) after interaction, it
does not necessarily mean that the dissolution and/or spalling of the intermetallic layer into
liquid Al had not occurred.
56
2.2.3.3 Effect of Alloying Elements on the Growth of the Intermetallic Layer
The present research is focused upon the minimization of liquid Al corrosion by modifying
the substrate composition of cast iron and steel alloys. Si and C are the major constituents of
the cast irons. Therefore, it is crucial to understand the effect of these alloying elements on
the properties of the intermetallic layer. Moreover, the other alloying additions such as Mn,
Cu, Cr and Mo could also influence the formed intermetallic layer. However, there are very
limited reports on the intermetallic layer growth that focused on the mechanism or the effect
of adding Si (or other alloying elements) to Fe substrates. These investigations are discussed
in the following sections.
The presence of alloying elements in liquid Al and substrate materials was found to affect the
growth of the intermetallic layer. Most of the studies are related to the addition of alloying
elements to liquid Al because of their potential application in hot dip aluminizing. In
aluminizing, an efficient control of the intermetallic layer thickness is required, since a very
thick intermetallic layer leads to cracking and delamination of the Al coating upon
subsequent fabrication [13]. An extensive review of the effect of liquid Al alloying additions
on the intermetallic layer thickness has been described in [42]. Of various alloying elements,
Si is the most important element added to liquid Al because it strongly reduces the
intermetallic layer thickness. However, little is known about the mechanism by which Si
reduces the intermetallic layer thickness, and the available literature contains controversial
reports.
Komatsu et al. [30] performed a series of experiments to determine the effect of Si present in
the ferrous substrate and in the Al melts. Various ferrous alloys having different Si and C
contents were immersed in pure liquid Al and Al-12.4 wt.% Si alloy melt in the 700°C-770°C
range. Table 2.4 shows the chemical compositions of the ferrous alloys.
57
Table 2.4 - Chemical compositions of the ferrous alloys [30].
Ferrous alloys C Si Mn *
Low carbon steel (S15C) 0.16 0.24 0.48
Medium carbon steel (S40C) 0.39 0.25 --
High carbon steel (SK3) 1.09 0.35 0.38
GCI 3.47 2.23 0.54
Fe-1%Si alloy -- 0.95 --
Fe-3%Si alloy -- 2.94 --
Fe-5%Si alloy -- 4.84 --
Fe-8%Si alloy -- 8.10 --
*Balance Fe
When the Fe-Si alloys were tested in pure liquid Al at 770°C for 2 hours, the intermetallic
layer thickness exhibited a sharp decrease from 1-3 wt.% Si. Material loss was increased by
approximately 15 percent for 1 and 3 wt.% Si additions. The cast iron specimens were
immersed into pure liquid Al and Al-12.4 wt.% Si alloy melts for 4 hours at 770°C. The
presence of Si (12.4 wt.%) in the Al melt decreased the intermetallic layer thickness,
concurrently, the dissolution of the cast iron substrate was found to increase significantly.
The carbon steels also showed similar trends to those of the GCI. On the basis of these
results, Komatsu et al. suggested that Si in liquid Al did not inhibit the growth of a reaction
layer, but accelerated its dissolution into liquid Al [30].
Eggeler et al. [49] also investigated the effect of Si addition to Al melts. A low alloyed steel
(0.16 wt.% C, 0.34 wt.% Si, 0.51 wt.% Mn, 0.97 wt.% Cr, 0.45 wt.% Mo) was immersed into
pure Al melt and Al-2 wt.% Si melt at 780°C and 792°C, respectively. The alloy layer growth
was measured for immersion periods up to about 900s. Steel in pure Al melt exhibited
parabolic growth, whereas in Al-2 wt.% Si melt intermetallic layer was significantly thinner
than the former and showed no significant change with increasing exposure time.
The weight loss measurements were also made in both the cases of pure Al and Al-2 wt.% Si
melt by determining the Fe concentration in the melt using a chemical titration method. It was
58
found that the Fe enrichment remained the same in both cases. From these results, it was
suggested that the Si acts on the solid state side to reduce the alloy layer thickness. This
supports the suggestion of Nicholls [50] that Si changes the diffusion conditions by
occupying the structural vacancies of the ε-Fe2Al5 phase resulting in a slower growth rate.
Eggeler et al. [49] dismissed the conclusion of Komatsu and co-workers [30]] that Si
accelerates the rate of Fe enrichment in Al melt. However, Komatsu and co-workers [30]
measured the weight loss and intermetallic layer thickness for longer times (2-8 hours),
whereas Eggeler et al. studied them for only 15 minutes considering the practical aluminizing
conditions accompanied by the indirect measurement of weight loss of the steel substrate.
Moreover, the Si content in the melt used by Komatsu et al. was substantially higher than that
used by Eggeler and co-workers. The effects of Si may be dissimilar for different Si
concentrations and exposure times. Thus it remains controversial that how Si affects the
intermetallic layer thickness and dissolution. These authors [30, 49] suggested two types of
possible effects of Si. However, the mechanisms explaining the effects of Si on the
intermetallic layer growth and/or dissolution of Fe-substrates remain unclear.
Niinomi and Ueda [12] studied the alloy layer growth of several ferrous alloys including pure
Fe, Fe-C, Fe-Si, Fe-Mn, Fe-Ni, Fe-Cu and Fe-Cr, with alloying element contents in these
materials varying from 2 wt.% and 3 wt.%. The alloys were dipped into liquid Al at 700°C,
750°C and 800°C for various times. The addition of each alloying element (C, Si, Cu, Ni, Mn
and Cr) to Fe substrate was found to reduce the thickness of the intermetallic layers compared
to pure Fe. Si, Ni and Cu had the greatest effect. However, the mechanism by which these
alloying elements affect the thickness of intermetallic layer remains unexplained.
Hwang et al. [51] studied the corrosion kinetics of three steels designated as SM20C, SM45C
and STC3 (Table 2.5). Pure Al and an Al alloy containing 9.08 wt.% Si and 0.98 wt.% Fe
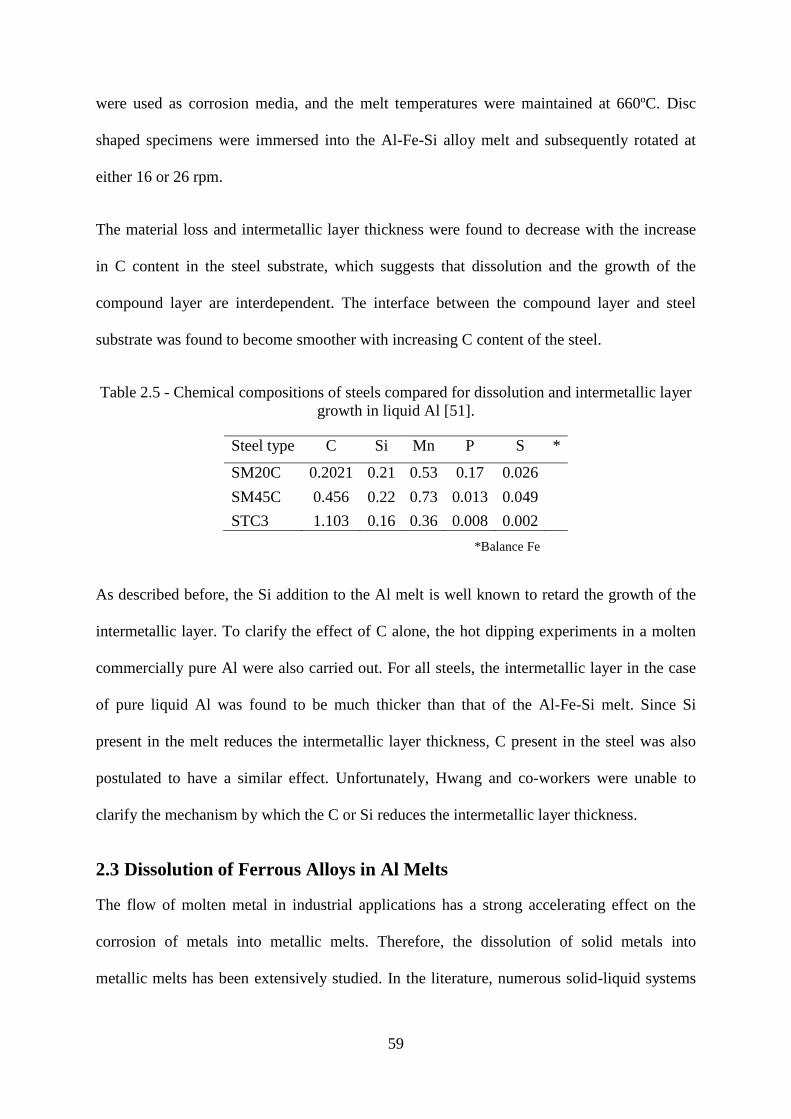
59
were used as corrosion media, and the melt temperatures were maintained at 660ºC. Disc
shaped specimens were immersed into the Al-Fe-Si alloy melt and subsequently rotated at
either 16 or 26 rpm.
The material loss and intermetallic layer thickness were found to decrease with the increase
in C content in the steel substrate, which suggests that dissolution and the growth of the
compound layer are interdependent. The interface between the compound layer and steel
substrate was found to become smoother with increasing C content of the steel.
Table 2.5 - Chemical compositions of steels compared for dissolution and intermetallic layer
growth in liquid Al [51].
Steel type C Si Mn P S *
SM20C 0.2021 0.21 0.53 0.17 0.026
SM45C 0.456 0.22 0.73 0.013 0.049
STC3 1.103 0.16 0.36 0.008 0.002
*Balance Fe
As described before, the Si addition to the Al melt is well known to retard the growth of the
intermetallic layer. To clarify the effect of C alone, the hot dipping experiments in a molten
commercially pure Al were also carried out. For all steels, the intermetallic layer in the case
of pure liquid Al was found to be much thicker than that of the Al-Fe-Si melt. Since Si
present in the melt reduces the intermetallic layer thickness, C present in the steel was also
postulated to have a similar effect. Unfortunately, Hwang and co-workers were unable to
clarify the mechanism by which the C or Si reduces the intermetallic layer thickness.
2.3 Dissolution of Ferrous Alloys in Al Melts
The flow of molten metal in industrial applications has a strong accelerating effect on the
corrosion of metals into metallic melts. Therefore, the dissolution of solid metals into
metallic melts has been extensively studied. In the literature, numerous solid-liquid systems
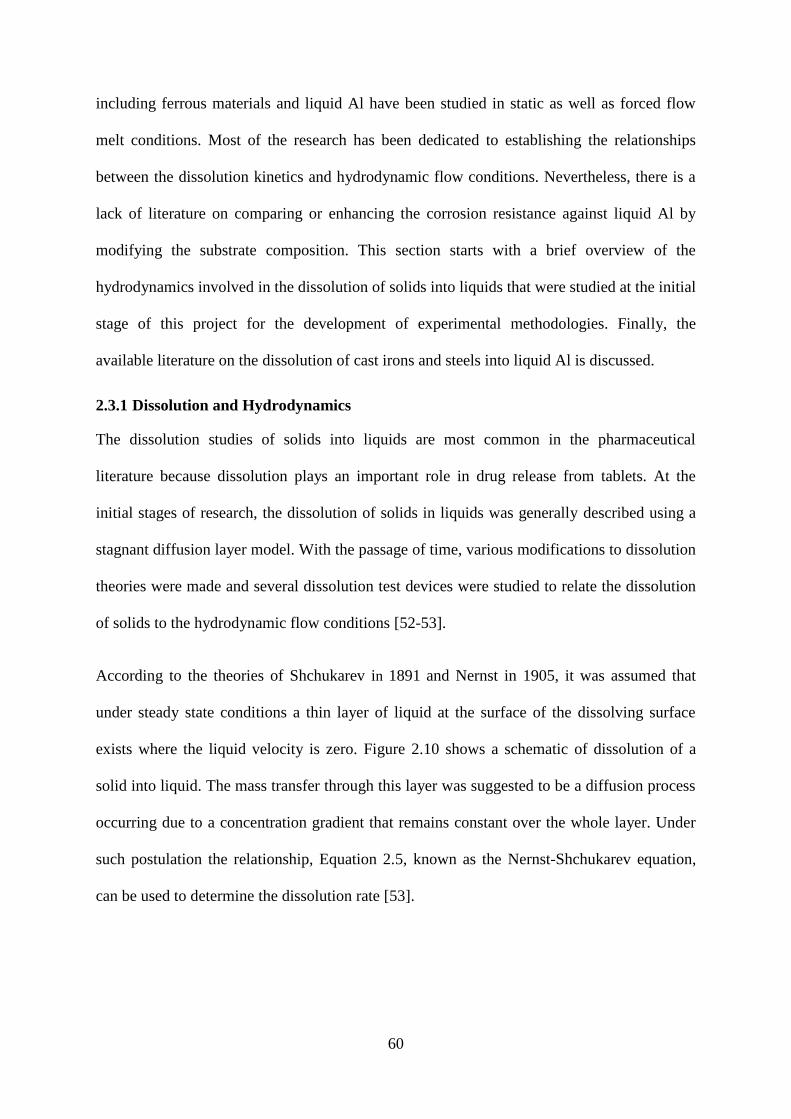
60
including ferrous materials and liquid Al have been studied in static as well as forced flow
melt conditions. Most of the research has been dedicated to establishing the relationships
between the dissolution kinetics and hydrodynamic flow conditions. Nevertheless, there is a
lack of literature on comparing or enhancing the corrosion resistance against liquid Al by
modifying the substrate composition. This section starts with a brief overview of the
hydrodynamics involved in the dissolution of solids into liquids that were studied at the initial
stage of this project for the development of experimental methodologies. Finally, the
available literature on the dissolution of cast irons and steels into liquid Al is discussed.
2.3.1 Dissolution and Hydrodynamics
The dissolution studies of solids into liquids are most common in the pharmaceutical
literature because dissolution plays an important role in drug release from tablets. At the
initial stages of research, the dissolution of solids in liquids was generally described using a
stagnant diffusion layer model. With the passage of time, various modifications to dissolution
theories were made and several dissolution test devices were studied to relate the dissolution
of solids to the hydrodynamic flow conditions [52-53].
According to the theories of Shchukarev in 1891 and Nernst in 1905, it was assumed that
under steady state conditions a thin layer of liquid at the surface of the dissolving surface
exists where the liquid velocity is zero. Figure 2.10 shows a schematic of dissolution of a
solid into liquid. The mass transfer through this layer was suggested to be a diffusion process
occurring due to a concentration gradient that remains constant over the whole layer. Under
such postulation the relationship, Equation 2.5, known as the Nernst-Shchukarev equation,
can be used to determine the dissolution rate [53].
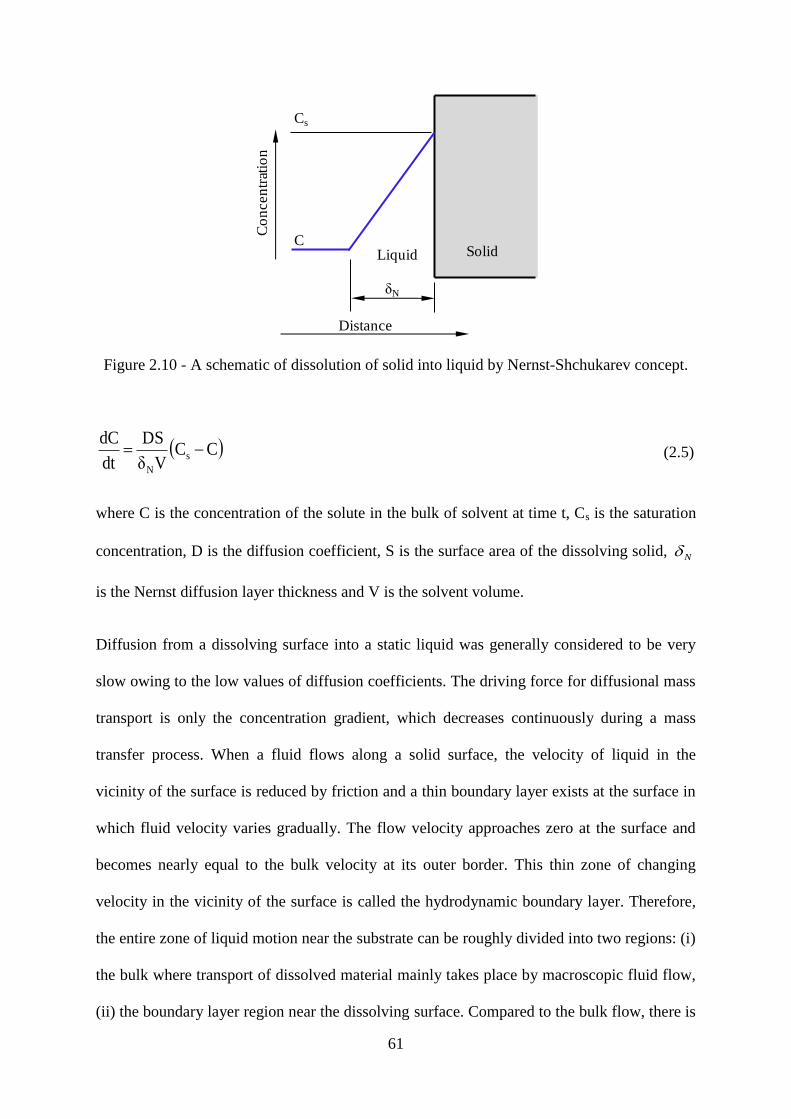
61
Figure 2.10 - A schematic of dissolution of solid into liquid by Nernst-Shchukarev concept.
CCVδ
DS
dt
dCs
N
(2.5)
where C is the concentration of the solute in the bulk of solvent at time t, Cs is the saturation
concentration, D is the diffusion coefficient, S is the surface area of the dissolving solid, N
is the Nernst diffusion layer thickness and V is the solvent volume.
Diffusion from a dissolving surface into a static liquid was generally considered to be very
slow owing to the low values of diffusion coefficients. The driving force for diffusional mass
transport is only the concentration gradient, which decreases continuously during a mass
transfer process. When a fluid flows along a solid surface, the velocity of liquid in the
vicinity of the surface is reduced by friction and a thin boundary layer exists at the surface in
which fluid velocity varies gradually. The flow velocity approaches zero at the surface and
becomes nearly equal to the bulk velocity at its outer border. This thin zone of changing
velocity in the vicinity of the surface is called the hydrodynamic boundary layer. Therefore,
the entire zone of liquid motion near the substrate can be roughly divided into two regions: (i)
the bulk where transport of dissolved material mainly takes place by macroscopic fluid flow,
(ii) the boundary layer region near the dissolving surface. Compared to the bulk flow, there is
Cs
C
δN
Liquid
Distance
Co
ncen
trat
ion
Solid

62
slower removal of dissolved matter by convection in the boundary zone. Thus near the
surface, a higher concentration of solute exists than in the bulk. This causes a net diffusion in
the perpendicular direction to the dissolving surface. Diffusion of dissolved solute through
the boundary layer into the bulk remains a process of short duration, since at a short distance
from the dissolved surface, convection dominates the mass transport by diffusion. Therefore,
in most of the solid-liquid systems, mass transport is not controlled by molecular diffusion
alone, but convective mass transfer also plays an important role. The contribution of each
mechanism to overall mass transfer depends upon the distance of the mainstream from the
dissolving surface and the hydrodynamic flow conditions [53-54].
It thus follows that the Nernst-Shchukarev dissolution model does not capture ordinary
mixing conditions where no stagnant layer exists as there is a change in velocity through the
hydrodynamic boundary layer [53].
Levich [54] modified the Nernst-Shchukarev equation by introducing the concept of effective
boundary layer δ based upon the actual hydrodynamics at the dissolving surface. The
diffusion coefficients of the liquids are so small that even at low flow velocities (Re ≤ 10),
the mass transport in the bulk of the solution was found to be totally convective. On the other
hand, in the immediate vicinity of the dissolving surface where the liquid motion is almost
absent, a region of rapidly changing concentration exists, where the diffusion must be taken
into account. The effective boundary layer model included both diffusion and convective
mass transfer. Levich determined the hydrodynamic boundary layer thickness (dh) at a semi
infinite plate surface as:
1/2
b
hU
νX 5.2d
(2.6)
where ν is the kinematic viscosity, X is the distance from the leading edge parallel to the flow
direction and Ub is the bulk velocity parallel to the plate surface.

63
The following equation can be used to calculate the thickness of an effective diffusion
boundary layer for a semi-infinite plate in laminar flow [54]:
h
1/3
1 dν
DKδ
(2.7)
K1 is found to be around 0.6, and
1/2
b
1/3
U
νX
ν
D 3δ
(2.8)
Using the effective diffusion boundary layer the Nernst-Shchukarev equation can be rewritten
as.
CCδV
DS
dt
dCs (2.9)
or
CCV
SK
dt
dCs (2.10)
where, δ
DK
K is known as the dissolution rate constant. In other words the D and δ vary in such a manner
that their ratio remains constant for the dissolution of pure solid into liquid [54], and the
modified Nernst-Shchukarev equation can be integrated to find c(t):
lnV
StK
CC
CC
s
os
(2.11)
where Co is the solute concentration at t = 0.
2.3.2 Dissolution Test Apparatuses
For the development of the experimental test method, the characteristics of established
dissolution test apparatuses were studied. Several dissolution devices were invented with two
main aims: (i) to relate the dissolution with hydrodynamic flow conditions, (ii) good
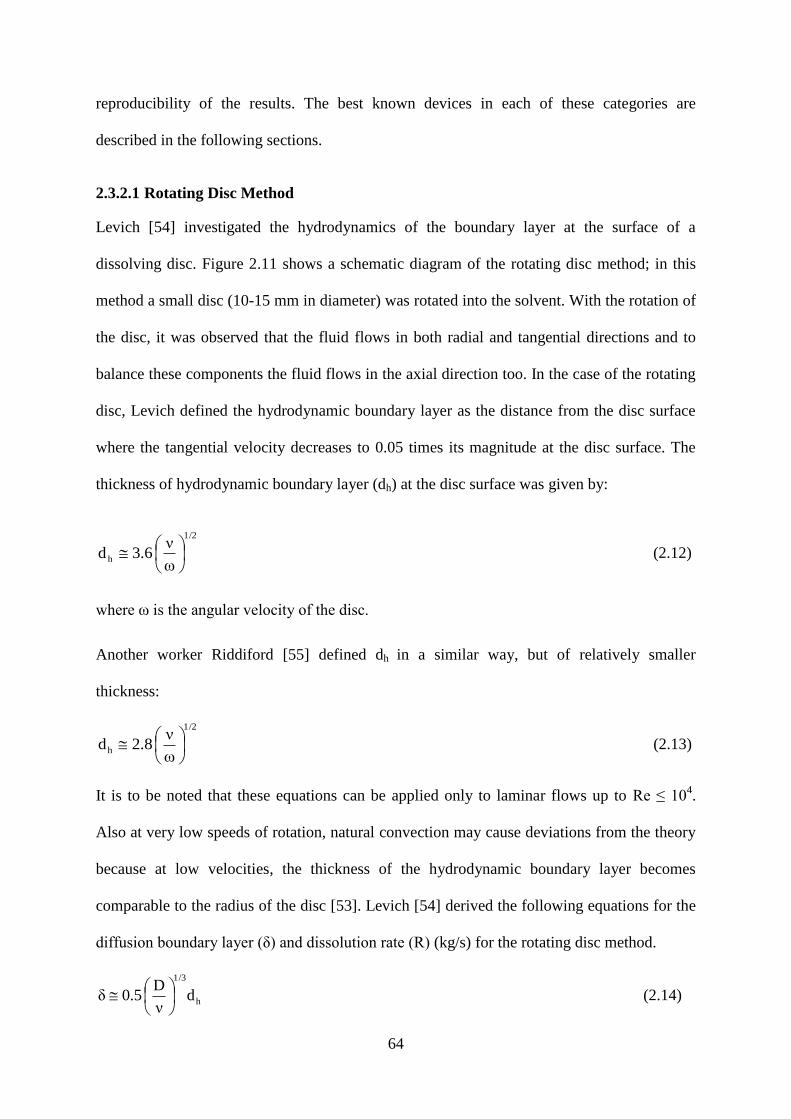
64
reproducibility of the results. The best known devices in each of these categories are
described in the following sections.
2.3.2.1 Rotating Disc Method
Levich [54] investigated the hydrodynamics of the boundary layer at the surface of a
dissolving disc. Figure 2.11 shows a schematic diagram of the rotating disc method; in this
method a small disc (10-15 mm in diameter) was rotated into the solvent. With the rotation of
the disc, it was observed that the fluid flows in both radial and tangential directions and to
balance these components the fluid flows in the axial direction too. In the case of the rotating
disc, Levich defined the hydrodynamic boundary layer as the distance from the disc surface
where the tangential velocity decreases to 0.05 times its magnitude at the disc surface. The
thickness of hydrodynamic boundary layer (dh) at the disc surface was given by:
1/2
hω
ν 3.6d
(2.12)
where ω is the angular velocity of the disc.
Another worker Riddiford [55] defined dh in a similar way, but of relatively smaller
thickness:
1/2
hω
ν 2.8d
(2.13)
It is to be noted that these equations can be applied only to laminar flows up to Re ≤ 104.
Also at very low speeds of rotation, natural convection may cause deviations from the theory
because at low velocities, the thickness of the hydrodynamic boundary layer becomes
comparable to the radius of the disc [53]. Levich [54] derived the following equations for the
diffusion boundary layer (δ) and dissolution rate (R) (kg/s) for the rotating disc method.
h
1/3
dν
D 0.5δ
(2.14)
65
21/21/62/3 r ΔCωνD 1.9R (2.15)
where ∆C = Cs-C and r is the radius of disc.
Figure 2.11 - A schematic of the rotating disc method.
The hydrodynamic boundary layer thickness is constant over the whole surface of the disc.
As a result the diffusion layer thickness is also constant at the disc surface, which is a very
interesting feature of the rotating disc system. The rotating disc method is known as the best
available method to relate the dissolution rate to the hydrodynamic conditions under laminar
flow (Re ≤ 104).
2.3.2.2 USP-II Apparatus
The USP-II (The United States Pharmacopoeial Convention) apparatus, shown in Figure
2.12(a), is most widely used in pharmaceutical research [52]. This apparatus consists of a
rotating impeller inside a solution and the tablet for dissolution studies is fixed at the bottom
Rotating shaft
Solvent
Sample holder
Solid sample
Container

66
of the container. For the USP-II apparatus, the material dissolution was found to increase
linearly with increasing time. Figure 2.12(b) shows the dissolution versus time relationship
for the USP-II apparatus.
Figure 2.12 - a) The USP-II apparatus for studying the dissolution of tablets under forced
convection, b) dissolution versus time for USP salicyclic acid calibrator tablets in a water-
sodium hydroxide solution at 100 rpm. [After [52]]
a
Rotating impeller
Tablet
Solution Glass container
0
3
6
9
12
0 5 10 15 20 25 30 35
Percen
t D
isso
lved
Time, min
b
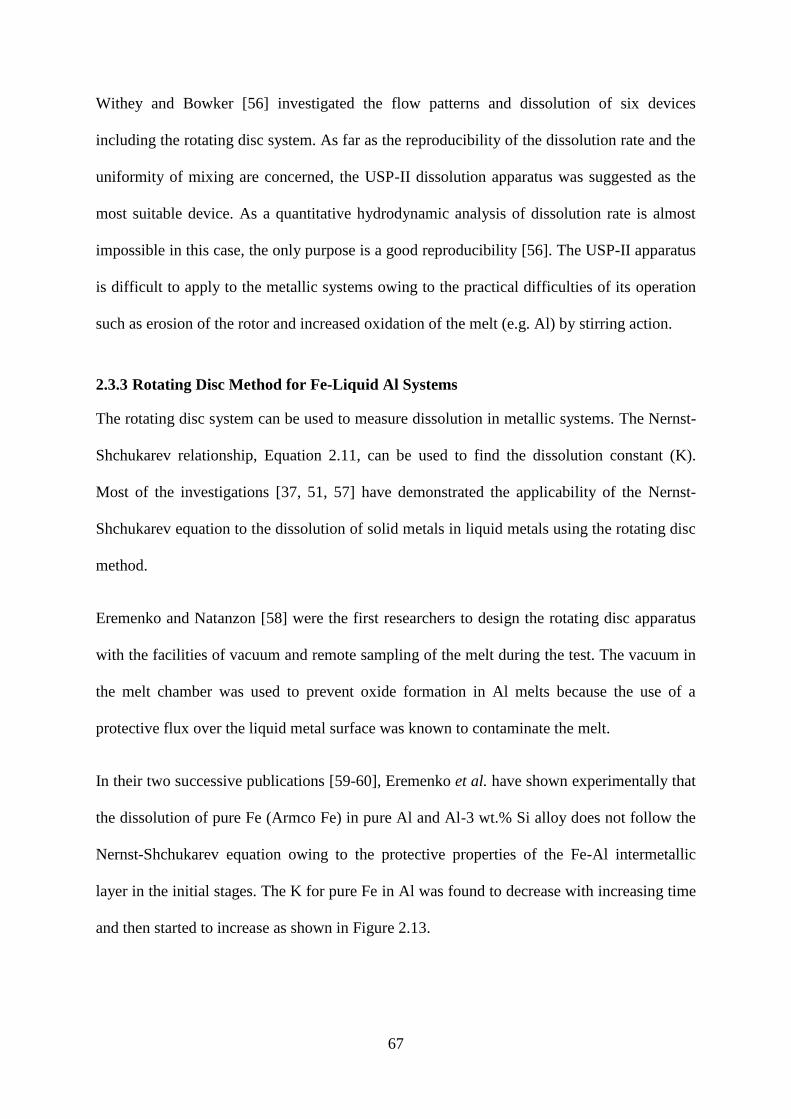
67
Withey and Bowker [56] investigated the flow patterns and dissolution of six devices
including the rotating disc system. As far as the reproducibility of the dissolution rate and the
uniformity of mixing are concerned, the USP-II dissolution apparatus was suggested as the
most suitable device. As a quantitative hydrodynamic analysis of dissolution rate is almost
impossible in this case, the only purpose is a good reproducibility [56]. The USP-II apparatus
is difficult to apply to the metallic systems owing to the practical difficulties of its operation
such as erosion of the rotor and increased oxidation of the melt (e.g. Al) by stirring action.
2.3.3 Rotating Disc Method for Fe-Liquid Al Systems
The rotating disc system can be used to measure dissolution in metallic systems. The Nernst-
Shchukarev relationship, Equation 2.11, can be used to find the dissolution constant (K).
Most of the investigations [37, 51, 57] have demonstrated the applicability of the Nernst-
Shchukarev equation to the dissolution of solid metals in liquid metals using the rotating disc
method.
Eremenko and Natanzon [58] were the first researchers to design the rotating disc apparatus
with the facilities of vacuum and remote sampling of the melt during the test. The vacuum in
the melt chamber was used to prevent oxide formation in Al melts because the use of a
protective flux over the liquid metal surface was known to contaminate the melt.
In their two successive publications [59-60], Eremenko et al. have shown experimentally that
the dissolution of pure Fe (Armco Fe) in pure Al and Al-3 wt.% Si alloy does not follow the
Nernst-Shchukarev equation owing to the protective properties of the Fe-Al intermetallic
layer in the initial stages. The K for pure Fe in Al was found to decrease with increasing time
and then started to increase as shown in Figure 2.13.
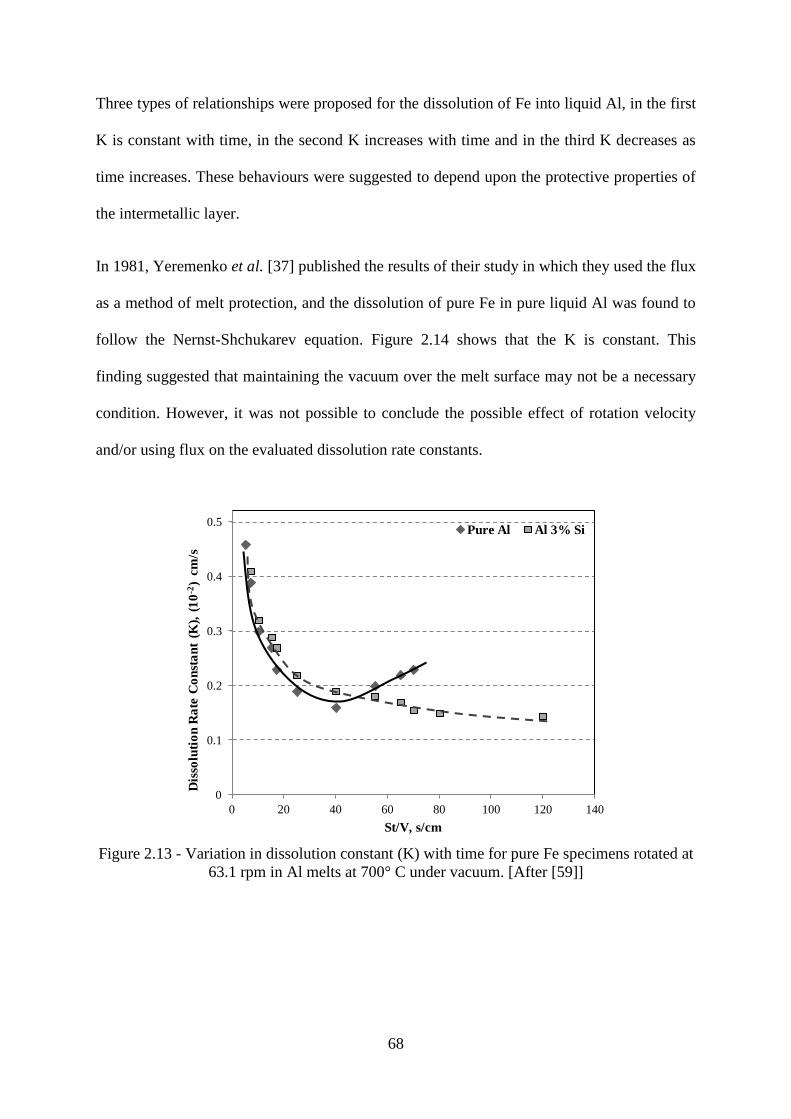
68
Three types of relationships were proposed for the dissolution of Fe into liquid Al, in the first
K is constant with time, in the second K increases with time and in the third K decreases as
time increases. These behaviours were suggested to depend upon the protective properties of
the intermetallic layer.
In 1981, Yeremenko et al. [37] published the results of their study in which they used the flux
as a method of melt protection, and the dissolution of pure Fe in pure liquid Al was found to
follow the Nernst-Shchukarev equation. Figure 2.14 shows that the K is constant. This
finding suggested that maintaining the vacuum over the melt surface may not be a necessary
condition. However, it was not possible to conclude the possible effect of rotation velocity
and/or using flux on the evaluated dissolution rate constants.
Figure 2.13 - Variation in dissolution constant (K) with time for pure Fe specimens rotated at
63.1 rpm in Al melts at 700° C under vacuum. [After [59]]
0
0.1
0.2
0.3
0.4
0.5
0 20 40 60 80 100 120 140
Dis
solu
tio
n R
ate
Co
nst
an
t (K
), (
10
-2)
cm
/s
St/V, s/cm
Pure Al Al 3% Si
69
Figure 2.14 - ln (CS-Co/CS-C) plotted against St/V for pure Fe in liquid Al at 700°C and at
about 229 rpm, flux was used to protect the melt against oxidation. [After [37]]
Yeremenko et al. [37] also discussed two important observations about the rotating disc
method. First was the deterioration of the results owing to the formation of an intermetallic
layer if the weight loss of the solid specimen is used to evaluate the dissolution process and
the duration of the experiment is short. In this case, the weight loss due to the dissolution and
the increase in the specimen weight due to the interlayer formation become of the same order
of magnitude. Using the specimen dimensions for dissolution measurement was also
suggested to have similar drawbacks. This was suggested to be one of the reasons for the
discrepancies in the results obtained before, for example [37]. Secondly, when the solute
concentration (C) approaches the saturation concentration (Cs), owing to the small value of
denominator (Cs-C) even a small error in the determination of the concentration could result
in a large error in evaluation of the dissolution rate constant. Therefore, arbitrary limits on the
solute concentrations for calculating K were suggested within 0.01< C/Cs <0.75. It was
further suggested that the evaluated K depends upon the accuracy with which the material
loss is determined.
0
0.03
0.06
0.09
0.12
0.15
0 5 10 15 20 25 30 35
ln ((C
s-C
o)/
(Cs-C
))
St/V, s/cm
70
During the dissolution of Fe in liquid Al, the Fe concentration in the melt is non-uniform and
can exceed the saturation limit in localized regions for a given temperature. This leads to the
formation of primary intermetallic compounds. As they remain for long durations in the melt
bulk, Fe containing intermetallic compounds grow in size and precipitate on the crucible
bottom since their density (3.42-4.02 gm/cm3) is almost double that of Al melt (2.1-2.4
gm/cm3) [61]. Therefore, it can be ascertained that in the case of the rotating disc method, the
collected melt samples for analysis may not represent the actual dissolution of Fe in Al. This
may also be the reason that the method of collecting melt samples during testing was found to
have poor reproducibility of results by [62].
Dybkov [57] conducted extensive experimentation on the dissolution of 18Cr-10Ni stainless
steel in liquid Al at 700°C. While earlier studies [37] had verified the applicability of the
Nernst-Shchukarev relationship for pure Fe, it was important to experimentally verify the
dissolution kinetics of a relatively complex system such as stainless steel. The experimental
results defined for the first time the interdependence of dissolution and alloying elements of a
high alloy content ferrous material. The saturation concentration of Fe (as in pure liquid melt)
was found to be the rate controlling factor and the other two elements were present in the
melt in the same ratios as in the substrate material.
Also Barmak and Dybkov [63], and Hwang et al. [51] verified the Nernst-Shchukarev
equation for the dissolution of stainless steels (10% Cr and 25% Cr), and carbon steels in
liquid Al, respectively. The values of the dissolution rate constants (K) obtained by various
researchers for different alloys are listed in Table 2.6.

71
Table 2.6 - Dissolution rate constants for various ferrous alloys by the rotating disc method.
As mentioned in Section 2.3.1, the dissolution of solids into liquid metals generally takes
place in two steps. In the first step, the atoms of solid pass into the melt and in the second the
mass transport of the dissolved material into the volume of the melt takes place. These were
more commonly referred to diffusion and kinetic regimes of the dissolution process. In a
review paper Eremenko and Natanzon [62] asserted that the dominance of each of these
processes depends upon the selection of the solid-liquid metal couple, and the dissolution
under kinetic conditions is not the characteristics of metals because the majority of the metals
were found to dissolve under diffusion conditions. The dissolution rate under diffusion
conditions was suggested to be controlled by D, δ and Cs. The dependence of D and δ values
(D ≈ 10-9
m2/s, δ ≈ 10
-5 m) on the individual properties of metals was found to be small.
Therefore, the Cs remained the main determinant of the dissolution rate under diffusion
conditions, which was suggested to constitute the principal criteria for the choice of a metal
compatible with any given melt [62].
Type of ferrous alloy/
Composition (wt.%)
Dissolution rate constant
(K), m/s (10-5
) Test conditions
Stainless steel
(72%Fe, 18%Cr, 10% Ni)
4.6 700ºC, pure Al, 229 rpm [57]
Stainless steel
(90%Fe, 10%Cr)
4.2 700ºC, pure Al, 229 rpm [57]
Stainless steel
(75%Fe 25% Cr)
3.0 As above
Pure Fe 3.8 700ºC, commercial pure Al, 229
rpm [37]
Carbon Steel (0.25%C) 0.22 Al alloy (9.08Si + 0.98 Fe)
660ºC, 16 rpm [51]
Carbon steel (0.45 %C) 0.13 As above
Steel (1.1 %C) 0.12 As above
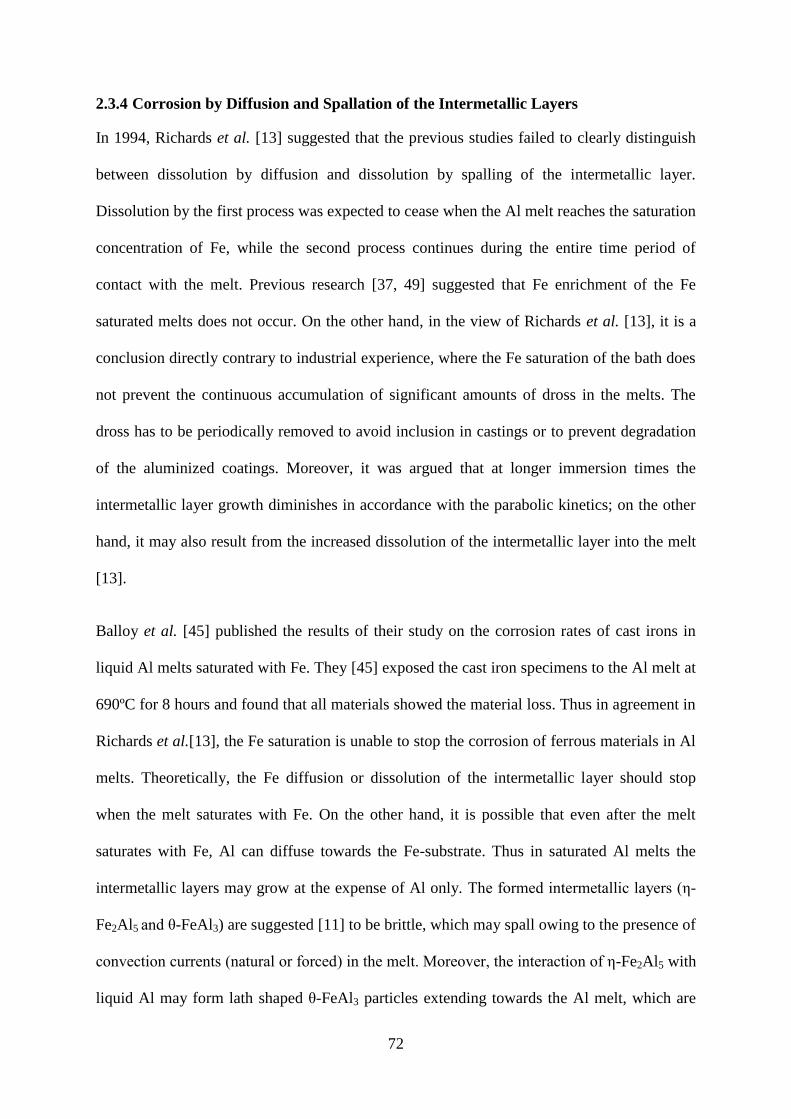
72
2.3.4 Corrosion by Diffusion and Spallation of the Intermetallic Layers
In 1994, Richards et al. [13] suggested that the previous studies failed to clearly distinguish
between dissolution by diffusion and dissolution by spalling of the intermetallic layer.
Dissolution by the first process was expected to cease when the Al melt reaches the saturation
concentration of Fe, while the second process continues during the entire time period of
contact with the melt. Previous research [37, 49] suggested that Fe enrichment of the Fe
saturated melts does not occur. On the other hand, in the view of Richards et al. [13], it is a
conclusion directly contrary to industrial experience, where the Fe saturation of the bath does
not prevent the continuous accumulation of significant amounts of dross in the melts. The
dross has to be periodically removed to avoid inclusion in castings or to prevent degradation
of the aluminized coatings. Moreover, it was argued that at longer immersion times the
intermetallic layer growth diminishes in accordance with the parabolic kinetics; on the other
hand, it may also result from the increased dissolution of the intermetallic layer into the melt
[13].
Balloy et al. [45] published the results of their study on the corrosion rates of cast irons in
liquid Al melts saturated with Fe. They [45] exposed the cast iron specimens to the Al melt at
690ºC for 8 hours and found that all materials showed the material loss. Thus in agreement in
Richards et al.[13], the Fe saturation is unable to stop the corrosion of ferrous materials in Al
melts. Theoretically, the Fe diffusion or dissolution of the intermetallic layer should stop
when the melt saturates with Fe. On the other hand, it is possible that even after the melt
saturates with Fe, Al can diffuse towards the Fe-substrate. Thus in saturated Al melts the
intermetallic layers may grow at the expense of Al only. The formed intermetallic layers (ε-
Fe2Al5 and ζ-FeAl3) are suggested [11] to be brittle, which may spall owing to the presence of
convection currents (natural or forced) in the melt. Moreover, the interaction of ε-Fe2Al5 with
liquid Al may form lath shaped ζ-FeAl3 particles extending towards the Al melt, which are
73
relatively easy so spall. Thus the formation and simultaneous spallation of ε-Fe2Al5 and ζ-
FeAl3 may continue at the expense of Al diffusion, leading to the material loss even in the
melts saturated with Fe.
From this point of view, performing the dissolution tests in molten Al and measuring the melt
concentration/mass loss over a time period does not provide a complete identification as to
the mechanisms that produce the material loss in liquid Al melts. Therefore, more detailed
analysis must be employed if a better understanding of the degradation progression of ferrous
substrates in liquid Al melts is to be accomplished.
2.3.5 Comparing the Liquid Al Corrosion Resistance of Ferrous Alloys
There are limited studies comparing or modifying the ferrous substrates against the liquid Al
corrosion. These are presented in the following sections.
In 1966, a publication [64] by Mountford and Glover cited the work done by the investigators
of the British Cast Iron Research Association (BCIRA) and the British Non-Ferrous Research
Association (BNFRA) in a joint program in the 1920s. Several compositions of GCIs
including pure Fe, high Cr iron and an Fe-Al alloy (Cralfer) were tested at 800ºC and 900ºC
for 6 hours. However, the detailed experimental conditions such as the specimen size, number
of specimens and surface condition were not known. These alloys were tested in both as-cast
and in annealed condition (6 days at 700ºC). The chemical compositions and comparative
dissolution results are given in Table 2.7 and Figure 2.15, respectively.
Based upon these results, Mountford and Glover [64] suggested that the high-phosphorus
GCI and Cralfer offered the best resistance to liquid Al corrosion. However, the presented
results were slightly overlooked by [64] because unalloyed GCI-16 showed a slightly better
performance than these two alloys. Moreover, the corrosion resistance of GCI-2 is also
similar to Cralfer and high P cast irons.

74
Table 2.7 - Material compositions tested by BCIRA/BNFRA [64].
* Balance Fe
All the annealed cast irons showed an increase in dissolution compared to the as-cast
condition. Even though a large number of alloys were tested, no clear correlation between the
composition and liquid Al corrosion resistance could be established. Alloying additions such
as Ni, Cu and Cr showed no beneficial effect.
Cast Irons C Si P Mn Ni Cr Other
GCI-1 3.47 2.42 -- 0.6 -- 0.69 --
GCI-2 3.67 1.48 -- 0.8 -- 0.74 0.12Ti
Cralfer 3.0 0.98 -- 0.7 -- 0.73 7.4Al
GCI-3 3.73 1.47 0.55 0.8 -- -- --
GCI-4 3.47 1.55 0.8 --- --- ---
GCI-17 3.09 1.43 0.2 0.9 1.39 0.65 --
GCI-5 3.48 1.24 1.0 0.7 -- -- --
GCI-6 3.5 2.45 -- 0.8 -- -- --
GCI-7 2.41 1.8 -- 0.63 13.7 3.37 6.41Cu
GCI-8 3.6 2.3 -- 0.6 -- -- --
GCI-9 3.02 2.03 -- 0.42 1.0 -- --
GCI-10 3.37 2.67 1.1 0.8 -- -- 0.36Ti
GCI-11 3.61 1.48 -- 0.8 -- 0.74 --
GCI-12 3.26 2.42 -- 0.6 -- 0.69 --
GCI-13 2.42 4.75 -- 0.85 -- -- --
High- chromium
iron 0.88 -- -- 0.12 0.26 30 --
GCI-14 2.11 4.91 -- 0.9 19 2.31 --
GCI-15 3.63 1.48 -- 0.8 -- -- --
Armco iron -- -- -- -- -- -- --
GCI-16 3.67 1.44 0.82
GCI-17 3.09 1.43 0.2 0.9 1.39 0.65 --
*
75
Figure 2.15 - Weight loss of specimens of several ferrous materials in liquid Al melts at
800ºC and 900ºC tested by BCIRA/BNFRA (# annealed condition). [After [64]]
Further investigation was carried out by Mountford and Glover [64] under industrial
conditions. They used the downspouts of a continuous-casting machine as test specimens,
which had a conical shape with a central hole. Four as-cast downspouts were fixed to the
bottom of a large tray to which 280 pounds of liquid Al were poured in each cycle. After a
0 20 40 60 80 100
GCI-1
GCI-2
Cralfer
GCI-3
GCI-4
GCI-5
GCI-6
GCI-7
GCI-8
GCI-9
GCI-10
GCI-11
GCI-12
GCI-13
High- Cr iron
GCI-14
GCI-15
Armco iron
GCI -16
GCI -17
Percent Weight Loss
Ma
teria
ls
900°C-6 hour 800°C-6 hour # 800°C-6 hour
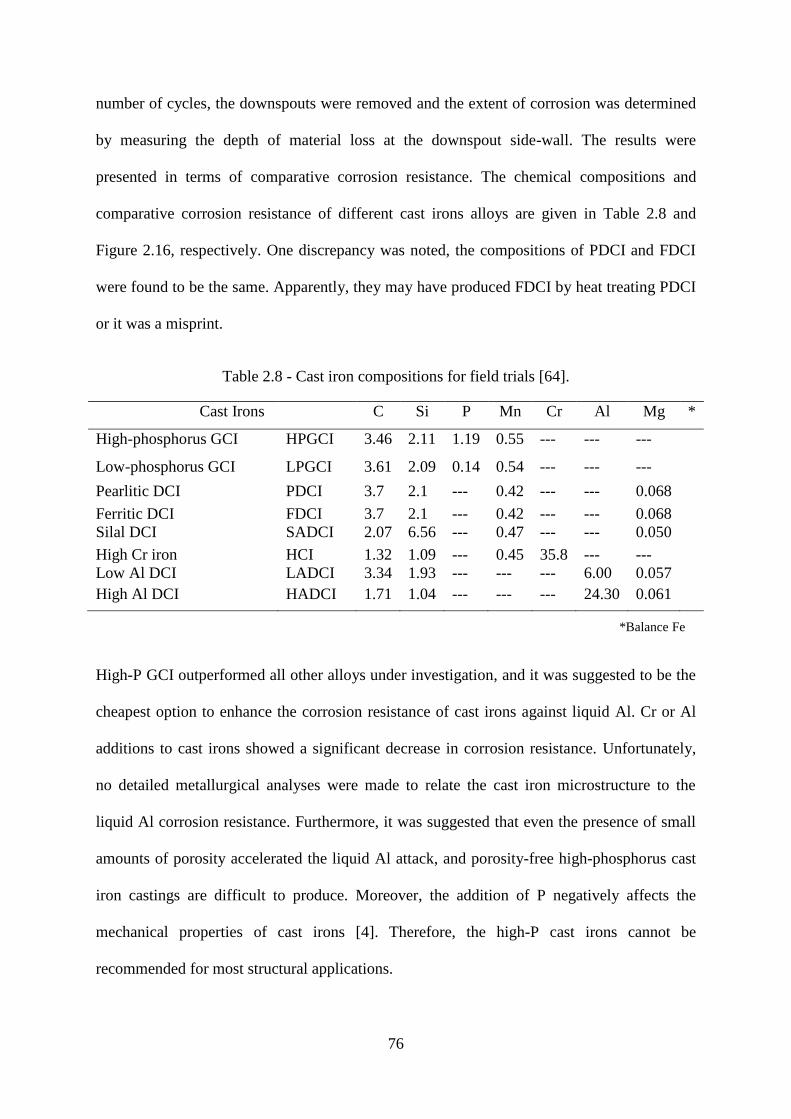
76
number of cycles, the downspouts were removed and the extent of corrosion was determined
by measuring the depth of material loss at the downspout side-wall. The results were
presented in terms of comparative corrosion resistance. The chemical compositions and
comparative corrosion resistance of different cast irons alloys are given in Table 2.8 and
Figure 2.16, respectively. One discrepancy was noted, the compositions of PDCI and FDCI
were found to be the same. Apparently, they may have produced FDCI by heat treating PDCI
or it was a misprint.
Table 2.8 - Cast iron compositions for field trials [64].
Cast Irons C Si P Mn Cr Al Mg *
High-phosphorus GCI HPGCI 3.46 2.11 1.19 0.55 --- --- ---
Low-phosphorus GCI LPGCI 3.61 2.09 0.14 0.54 --- --- ---
Pearlitic DCI PDCI 3.7 2.1 --- 0.42 --- --- 0.068
Ferritic DCI FDCI 3.7 2.1 --- 0.42 --- --- 0.068
Silal DCI SADCI 2.07 6.56 --- 0.47 --- --- 0.050
High Cr iron HCI 1.32 1.09 --- 0.45 35.8 --- ---
Low Al DCI LADCI 3.34 1.93 --- --- --- 6.00 0.057
High Al DCI HADCI 1.71 1.04 --- --- --- 24.30 0.061
*Balance Fe
High-P GCI outperformed all other alloys under investigation, and it was suggested to be the
cheapest option to enhance the corrosion resistance of cast irons against liquid Al. Cr or Al
additions to cast irons showed a significant decrease in corrosion resistance. Unfortunately,
no detailed metallurgical analyses were made to relate the cast iron microstructure to the
liquid Al corrosion resistance. Furthermore, it was suggested that even the presence of small
amounts of porosity accelerated the liquid Al attack, and porosity-free high-phosphorus cast
iron castings are difficult to produce. Moreover, the addition of P negatively affects the
mechanical properties of cast irons [4]. Therefore, the high-P cast irons cannot be
recommended for most structural applications.
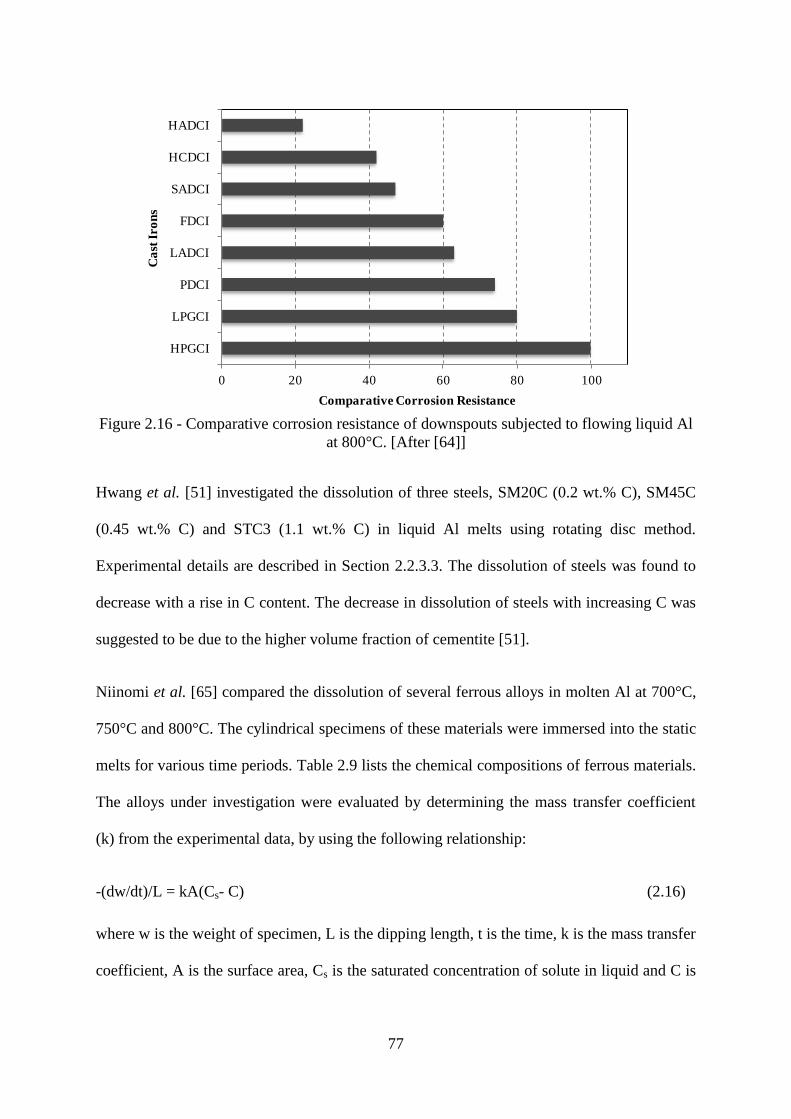
77
Figure 2.16 - Comparative corrosion resistance of downspouts subjected to flowing liquid Al
at 800°C. [After [64]]
Hwang et al. [51] investigated the dissolution of three steels, SM20C (0.2 wt.% C), SM45C
(0.45 wt.% C) and STC3 (1.1 wt.% C) in liquid Al melts using rotating disc method.
Experimental details are described in Section 2.2.3.3. The dissolution of steels was found to
decrease with a rise in C content. The decrease in dissolution of steels with increasing C was
suggested to be due to the higher volume fraction of cementite [51].
Niinomi et al. [65] compared the dissolution of several ferrous alloys in molten Al at 700°C,
750°C and 800°C. The cylindrical specimens of these materials were immersed into the static
melts for various time periods. Table 2.9 lists the chemical compositions of ferrous materials.
The alloys under investigation were evaluated by determining the mass transfer coefficient
(k) from the experimental data, by using the following relationship:
-(dw/dt)/L = kA(Cs- C) (2.16)
where w is the weight of specimen, L is the dipping length, t is the time, k is the mass transfer
coefficient, A is the surface area, Cs is the saturated concentration of solute in liquid and C is
0 20 40 60 80 100
HPGCI
LPGCI
PDCI
LADCI
FDCI
SADCI
HCDCI
HADCI
Comparative Corrosion Resistance
Ca
st I
ro
ns

78
the concentration of solute in liquid after time t. Figure 2.17 shows the mass transfer
coefficients (k) of various ferrous alloys.
Table 2.9 - Chemical compositions of materials [65].
Material C Si Mn Cr Cu Ni *
Fe-3C 2.94 0.24 0.23 -- 0.05 --
Fe-3Mn -- 0.01 3.16 0.06 -- 0.01
Fe-2Mn -- 2.85 2.36 -- -- --
Fe-3Ni -- 0.09 0.12 0.06 -- 3.00
Fe-3Cu -- 0.11 0.19 0.15 2.97 0.02
Fe-3Cr 0.009 0.15 0.18 2.94 -- 0.02
Fe-3Si 0.033 2.91 0.22 -- -- 0.01
Pure Fe 0.01 0.2 0.22 -- -- --
* Balance Fe
Figure 2.17 - Mass transfer coefficients (k) of various ferrous alloys subjected to static liquid
Al. [After [65]]
The Fe-3C alloy was the most resistant to liquid Al corrosion whereas the Fe-3Si exhibited
the highest dissolution rate. The addition of 2 wt.% Mn was found to slow down the
corrosion; however, 3 wt.% Mn to pure Fe did not show improvement in the corrosion
0 20 40 60 80 100 120 140
Pure iron
Fe-3Si
Fe-3Cr
Fe-3Cu
Fe-3Ni
Fe-2Mn
Fe-3Mn
Fe-3C
Mass Transfer Coefficient (k), ms-1 x 10⁻³
Ferro
us
All
oy
s
800ºC
750ºC
700ºC
79
resistance. The alloys with Cu, Cr and Ni dissolved at a faster rate than the pure Fe; however,
all of these alloys exhibited similar mass transfer rates.
In a recent publication, Balloy et al. [45] cited a few rarely avialable studies on liquid Al
corrosion of cast irons. Based upon these studies they [45] concluded that there is no
corelation between cast iron composition and liquid Al corrosion resistance. They [45]
investigated the corrosion of three ferrous alloys, plain carbon steel (C38), pearlitic gray cast
iron (PCI) and ferritic gray cast iron (FCI). These materials were exposed to liquid Al
(saturated with Fe) at 690°C for 8 hours. The chemical composition of these alloys is listed in
Table 2.10.
Table 2.10 - The chemical compositions of cast irons and carbon steel [45].
Material C Si Mn Cr Al P *
C38 0.37 0.25 0.8 0.043 0.03 0.02
FCI 3.5 4.5 0.22 --- --- ---
PCI 3.71 1.76 0.68 1.14 1.93 0.37
* Balance Fe
PCI with Al, Cr and P alloying elements showed three times less dissolution than C38 steel
and eight times less than FCI. Presence of cementite particles in PCI was suggested to slow
down the dissolution of PCI as cementite dissolved more slowly than pearlite and ferrite.
Furthermore, it was concluded that the presence of the phosphorus-eutectic also helped to
retard the material loss of PCI. The effect of Al and Si addition on liquid Al corrosion
resistance was not analyzed in Balloy et al.‟s work.
2.3.6 Boronizing Surface Treatment
Boronizing is a thermo-chemical process similar to carburizing or nitriding, which involves
diffusion of boron into a base metal at a high temperature. Boronizing is commonly applied
to steels. When boron atoms diffuse into the surface zone of a ferrous work piece, a

80
compound layer is formed that consists of either one iron boride (Fe2B) or two iron borides
(FeB+Fe2B). The formed boride layers are very hard (1400-1700 HV), which can be used in
wear-resistant applications. Boride layers were also found to be resistant against liquid Al
corrosion. There is a large difference between the thermal expansion coefficients of the
duplex phases (Fe2B and FeB), which makes the FeB layer very likely to be exfoliated when
the component is cooled from the treatment temperature. As a consequence, efforts are
generally made to impart a single layer of Fe2B, although Fe2B is relatively lower in hardness
than FeB [66].
Lou et al. [67] investigated liquid Al corrosion of 22Cr-5Ni duplex stainless steel (DSS), hot
work tool steel (AISI H13), a DCI and a γ-TiAl intermetallic. Boronizing surface treatment
was used as a method of protection against liquid Al corrosion. The chemical compositions of
the ferrous materials are given in Table 2.11. γ-TiAl was used as reference material because it
has a high liquid Al corrosion resistance. The DSS and tool steel were boronized at 1025°C,
while the DCI specimens subjected to 850°C for 5 hours. The as-received and boronized
rectangular coupons with dimensions 10 mm x 10 mm x 15 mm were immersed in molten
6080 Al alloy at 680°C for 4 hours.
Table 2.11 - Chemical compositions of the substrate materials [67].
Alloys C Si Mn Mo Mg Cr V Ni *
DSS 0.03 1.0 2.0 3.0 --- 22 -- 5.5
H13 0.38 1.0 0.4 13 0.02 5.3 0.9 0.05
DCI 4.0 3.0 0.13 --- --- --- --- ---
*Balance Fe
The material loss of DSS was approximately half that of H13, while it is slightly more
resistant than DCI to liquid Al attack. The boronizing surface treatment reduced the
dissolution of DSS and DCI by a factor of 16 and 20 respectively. The corrosion rate of H13
81
steel was only reduced by a factor of 3, which was attributed to the porosity present in the
boride layer on this alloy [67].
Tsipas et al. [68] published the degradation behaviour of boronized plain
carbon steel in molten Al. Disc shaped specimens (40 mm diameter x 3 mm) were machined
from plain carbon steel (0.2 wt.%). The specimens were boronized at 900°C for 4 hours. The
boronized steel showed about 7 times lower weight loss compared to the as-received
condition. A discrepancy was noted, the bath temperature of Al was stated to be 630°C,
which indicates that they may have used an Al alloy since pure liquid Al melts at 660°C.
2.4 Concluding Remarks
The prime consideration for a suitable material for tapping pipes is enhanced liquid Al
corrosion resistance. Since the service application also involves temperature cycling, a
material employed for tapping pipes should also possess good thermal fatigue resistance.
Considering the benefits in achieving good elevated temperature properties, only Cr, Cu
and Mo were considered as alloy additions to cast irons under the current investigation.
Formation of all possible intermetallic compounds of the Fe-Al binary phase diagram
have been found in solid Fe-Al couples at different conditions of liquid Al exposure.
However, in Fe-liquid Al interaction only two phases, ε-Fe2Al5 and ζ-FeAl3, phases were
commonly found to exist. It was found that Fe-rich compounds such as β2-FeAl and β1-
Fe3Al form when Al is not abundantly available, as in solid state Fe-Al couples.
With increasing immersion times of steel alloys into liquid Al, Fe-Al intermetallic layer
growth showed negative deviations from the parabolic law of growth. In the literature,
these deviations were frequently attributed to the dissolution of the intermetallic layer.
82
However, the dissolution behaviour with respect to intermetallic layer growth was not
studied in sufficient detail. The dissolution can be considered to result from the spallation
(and/or dissolution) of the intermetallic layer and the direct diffusion of Fe into the melt.
Thus even comparing the time dependent intermetallic layer growth and dissolution of a
single alloy would not be conclusive. To investigate this phenomenon various ferrous
alloys need to be compared in terms of intermetallic layer growth and dissolution.
The addition of Si to the ferrous alloy substrates and in the melt was found to reduce the
intermetallic layer thickness; however, the mechanism by which it diminishes the
intermetallic layer growth is not completely understood and remains controversial. Si and
C are primary compositional constituents of cast irons thus it would be interesting to
investigate the mechanisms by which these elements affect the corrosion rates and growth
of the intermetallic compounds. Moreover, Si enrichment of the Fe-substrates has been
reported in Fe-Si alloys and cast irons exposed to liquid Al. It is important to reveal the
effect of Si on the corrosion resistance of cast irons and mechanisms of liquid Al
corrosion.
In the literature, the predominant appearance of ε-Fe2Al5 was attributed to the high
diffusion rate of Al along the c-axis of ε-Fe2Al5 unit cell. On the other hand, ζ-FeAl3
formation was not studied in detail. Most studies proposed that ζ-FeAl3 grow during
solidification of Al around the corroded specimen, on the other hand, a few studies
suggested that it can grow during ongoing liquid Al corrosion. While others believed that
ζ-FeAl3 in the form of layer grows during Fe/liquid Al interaction and ζ-FeAl3 particles
grow after the solidification of Al. Moreover, the growth of ζ-FeAl3 in the form of lath
shaped particles remains unclear. Thus to better understand the process of liquid Al
corrosion, it is important to reveal the formation and growth characteristics of ζ-FeAl3.

83
In the rotating disc method the saturation concentration was found to be the principal
factor upon which the calculated dissolution rate constant depends and it must be known
for each solid-liquid metal system under comparison. Moreover, the determined
dissolution rate constant chiefly depends upon the accuracy by which the melt
concentration or material loss is measured. Moreover, there is disagreement whether the
dissolution of ferrous alloys stops when the Fe concentration in Al melt reaches saturation.
When the melt saturates with Fe, the liquid Al corrosion may be occurring due to the
diffusion of Al only. Therefore, comparing the dissolution rates with measures of melt
chemistry may be problematic. Moreover, during flowing through of tapping pipes, the
liquid Al never reaches the saturation concentration of Fe. Thus in the present work, the
corrosion resistance of candidate materials should be compared in under saturated melts.
In the literature, it was found difficult to establish a relationship between the chemical
composition and liquid Al corrosion resistance of cast irons. It is to be noted that in the
literature, the microstructures of cast irons were not considered while comparing the liquid
Al corrosion resistance. As the microstructure of cast irons is strongly dependent upon
chemical composition it is thus necessary to consider the microstructures while analysing
the corrosion rates. Moreover, all of those investigations were carried out using static
melts. Considering the service conditions of tapping pipes and to magnify the relative
difference between the corrosion rates of different compositions of cast irons, a new
apparatus is needed.
Dissolution studies on cast irons showed that P addition enhances the corrosion resistance
of GCIs. However, in industrial practice, the concentration of elements such as P and S is
kept as low as possible due to their harmful effects on mechanical properties of cast irons.
84
Thus while preparing the alloys for the current work, these elements should be kept below
the specified compositional limits.
Increasing C content was found to enhance the corrosion resistance of steels, which was
attributed to a higher amount of cementite. However, how cementite or high C in ferrous
alloys raises the liquid Al corrosion resistance is not completely understood. Thus research
needs to explore the mechanism by which C enhances the liquid Al corrosion resistance of
ferrous alloys.
Chapter References
[1] H. Pollack, Material Science and Metallurgy, 4th Ed., Prentice-Hall, 1988.
[2] J.R. Davis, ASM Speciality Handbook-Cast Irons, ASM International, Materials Park,
Ohio, 1996.
[3] H.T. Angus, Cast Irons-Physical and Engineering Properties, Buttersworth, 1976.
[4] J.F. Janowak, R.B. Gundlach, American Foundry Society Transactions, 90 (1982) 847-
863.
[5] G. Silman, V. Kamynin, V. Goncharov, Metal Science and Heat Treatment, 49 (2007)
387-393.
[6] J.M. Chou, J.L. Lee, Y.C. Ko, Journal of Materials Science, 25 (1990) 2971-2974.
[7] K. Roehrig, American Foundry Society Transactions, 86 (1978) 75-88.
[8] G.J.N. Gilbert, British Cast Iron Research Association Journal, 7 (1959) 478-566.
[9] G.K. Turnbull, J.F. Wallace, American Foundry Society Transactions, 67 (1959) 35-46.
[10] R.B. Gundlach, International Cast Metals Journal, 4 (1979) 11-20.
[11] H.R. Shahverdi, M.R. Ghomashchi, S. Shabestari, J. Hejazi, Journal of Materials
Processing Technology, 124 (2002) 345-352.
[12] M. Niinomi, Y. Ueda, Transactions of the Japan Institute of Metals, 23 (1982) 709-717.
[13] R.W. Richards, R.D. Jones, P.D. Clements, H. Clarke, International Materials Reviews,
39 (1994) 191-212.
[14] A.C.G. Gwyer, H.W.L. Philips, in: M. Hansen (Ed.), Constitution of Binary Alloys,
McGraw-Hill Book Company, New York, 1958.
[15] F. Stein, M. Palm, International Journal of Materials Research, 98 (2007) 580-588.
[16] H. Baker, ASM Handbook-Alloy Phase Diagrams, ASM International, Materials Park,
Ohio, 1992.
[17] N.W. Ageew, O.I. Vher, in: M. Hansen (Ed.), Constitution of Binary Alloys, McGraw-
Hill Book Company, New York, 1958.
85
[18] N.S. Kurnakow, G. Urasow, A. Grigorjew, in: M. Hansen (Ed.), Constitution of Binary
Alloys, McGraw-Hill Book Company, New York, 1958.
[19] M. Isawa, T. Murakami, in: M. Hansen (Ed.), Constitution of Binary Alloys, McGraw-
Hill Book Company, New York, 1958.
[20] F. Wever, A. Muller, in: M. Hansen (Ed.), Constitution of Binary Alloys, McGraw-Hill
Book Company, New York, 1958.
[21] W. Olesen, in: M. Hansen (Ed.), Constitution of Binary Alloys, McGraw-Hill Book
Company, New York, 1958.
[22] A.J. Bradley, A.H. Jay, in: M. Hansen (Ed.), Constitution of Binary Alloys, McGraw-
Hill Book Company, New York, 1958.
[23] A.J. Bradley, A. Taylor, in: M. Hansen (Ed.), Constitution of Binary Alloys, McGraw-
Hill Book Company, New York, 1958.
[24] Bulletin of Binary Phase Diagrams, ASM International, 1994.
[25] H. Saito, in: M. Hansen (Ed.), Constitution of Binary Alloys, McGraw-Hill Book
Company, New York, 1958.
[26] G.V. Raynor, C.R. Faulkner, J.D. Noden, A.R. Harding, in: M. Hansen (Ed.),
Constitution of Binary Alloys, McGraw-Hill Book Company, New York, 1958.
[27] A. Bouayad, C. Gerometta, A. Belkebir, A. Ambari, Materials Science Engineering A,
A363 (2003) 53-61.
[28] K. Bouche, F. Barbier, A. Coulet, Materials Science and Engineering A, A249 (1998)
167-175.
[29] S. Kobayashi, T. Yakou, Materials Science and Engineering A, 338 (2002) 44-53.
[30] N. Komatsu, M. Nakamura, H. Fujita, Journal of Japan Institute of Metals, 18 (1968)
474-482.
[31] T. Maitra, S.P. Gupta, Materials Characterization, 49 (2003) 293-311.
[32] K. Murakami, N. Nishida, K. Osamura, Y. Tomota, T. Suzuki, Acta Materialia, 52
(2004) 2173-2184.
[33] T. Sasaki, T. Yakou, K. Mochiduki, K. Ichinose, The Iron and Steel Institute of Japan
International, 45 (2005) 1887-1892.
[34] T.S. Shih, S.H. Tu, Materials Science Engineering A, 454-455 (2007) 349-356.
[35] M. Niinomi, Y. Suzuki, Y. Ueda, Transactions of the Japan Institute of Metals, 25
(1984) 429-439.
[36] V.I. Dybkov, Reaction Diffusion and Solid State Chemical Kinetics, The IPMS
Publications, Kyiv, 2002.
[37] V.N. Yeremenko, Y.V. Natanzon, V.I. Dybkov, Journal of Materials Science, 16 (1981)
1748-1756.
[38] T. Heumann, S. Dittrich, Zeitschrift Fuer Metallkunde, 50 (1959) 617-625.
[39] E.G. Ivanov, Metal Science and Heat Treatment, 21 (1979) 449-452.
[40] R.D. Jones, S.G. Denner, 10th World Congress on Metal Finishing, Matel Finishing
Society of Japan, Tokyo, (1980) 371-375.
86
[41] S.G. Denner, R.D. Jones, Metals Technology, 4 (3) (1977) 167-174.
[42] S.G. Denner, R.D. Jones, R.J. Thomas, Iron and Steel International, 48 (1975) 241-252.
[43] D.R. Gabe, Reviews on High Temperature Materials, 1 (2) (1972) 157-163.
[44] N.W. Ageew, O.I. Vher, Institute of Metals - Advance Papers, Institute of Metals
Meeting, London, 44 (2) (1930) 83-95.
[45] D. Balloy, J.C. Tissier, M.L. Giorgi, M. Briant, Metallurgical and Materials Transactions
A, 41 (2010) 2366-2376.
[46] W.J. Cheng, Y.Y. Chang, C.J. Wang, Surface & Coatings Technology, 203 (2008) 401-
406.
[47] H.R. Shahverdi, M.R. Ghomashchi, S. Shabestari, J. Hejazi, Journal of Materials
Science, 37 (2002) 1061-1066.
[48] S. Shankar, D. Apelian, Metallurgical and Materials Transactions B, 33 (2002) 465-476.
[49] G. Eggeler, W. Auer, H. Kaesche, Journal of Materials Science, 21 (1986) 3348-3350.
[50] J.E. Nicholls, Corrosion Technology, 11 (1964) 16-21.
[51] S.H. Hwang, J.H. Song, Y.S. Kim, Materials Science and Engineering A, 390 (2005)
437-443.
[52] J. Mauger, J. Ballard, R. Brockson, Dissolution Technologies, 8 (2003) 6-14.
[53] H. Grijseels, D. Crommelin, C. Blaey, Pharmaceutisch Weekblad Scientific Edition, 3
(1981) 1005-1020.
[54] V.G. Levich, Physiocochemical Hydrodynamics, Prentice-Hall, New Jersey, 1962.
[55] A.C. Riddiford, in: P. Delahay (Ed.), Advances in Electrochemistry and Electrochemical
Engineering, Interscience, New York, 1966.
[56] R.J. Withey, A.J. Bowker, Jounal of Pharmacy and Pharmacology, 24 (1972) 345-351.
[57] V.I. Dybkov, Journal of Materials Science, 25 (1990) 3615-3633.
[58] V.N. Eremenko, Y.V. Natanzon, Soviet Materials Science, 2 (5) (1968) 411-413.
[59] V.N. Eremenko, Y.V. Natanzon, V.R. Ryabov, Soviet Materials Science, 4 (6) (1972)
486-490.
[60] V.N. Eremenko, Y.V. Natanzon, V.R. Ryabov, Soviet Materials Science, 4 (3) (1968)
209-212.
[61] V. Sharshin, S. Skitovich, V. Kechin, D. Subbotin, Russian Journal of Non-Ferrous
Metals, 48 (2007) 341-346.
[62] V.N. Eremenko, Y.V. Natanzon, Powder Metallurgy and Metal Ceramics, 9 (1970) 645-
658.
[63] K. Barmak, V.I. Dybkov, Journal of Materials Science, 39 (2004) 4219-4230.
[64] F.A. Mountford, T.J. Glover, Foundry Trade Journal, 120 (1966) 849-852.
[65] M. Niinomi, Y. Ueda, M. Sano, Transactions of the Japan Institute of Metals, 23 (1982)
780-787.
[66] S. Sen, U. Sen, C. Bindal, Vacuum, 77 (2005) 195-202.
87
[67] D. Lou, O.M. Akselsen, M.I. Onsien, J.K. Solberg, J. Berget, Surface and Coatings
Technology, 200 (2006) 5282-5288.
[68] D.N. Tsipas, G.K. Triantafyllidis, J.K. Kiplagat, P. Psillaki, Materials Letters, 37 (1998)
128-131.
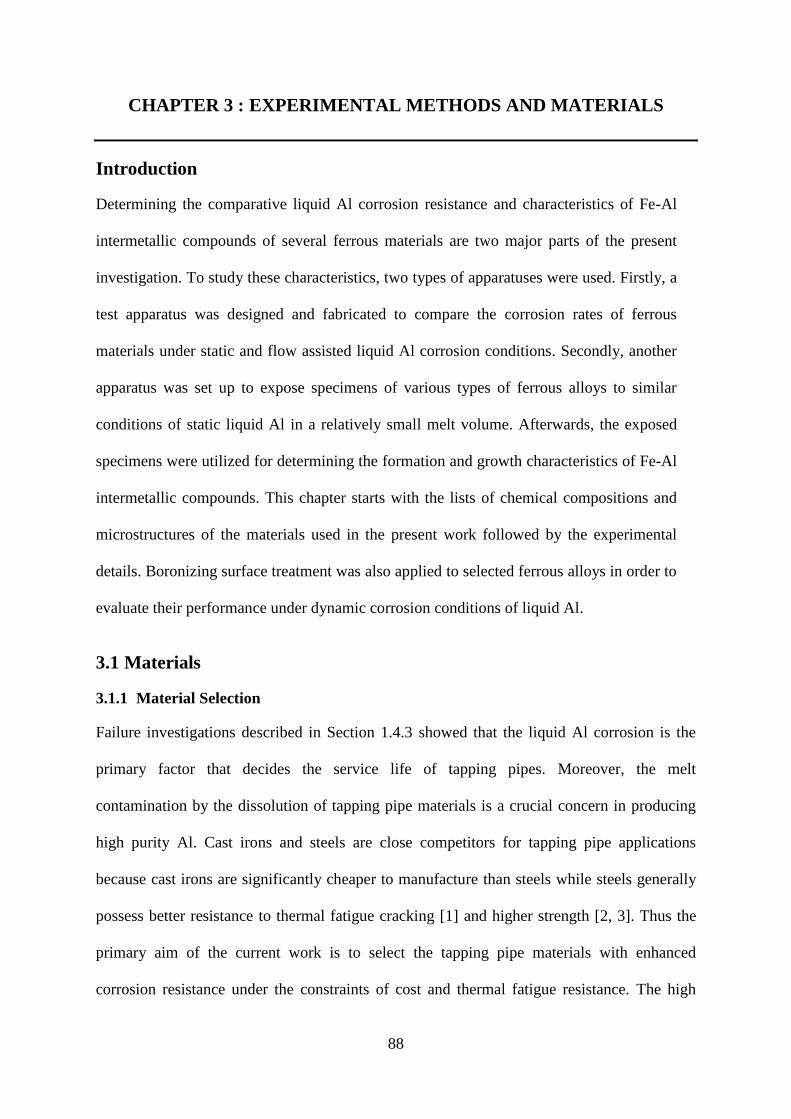
88
CHAPTER 3 : EXPERIMENTAL METHODS AND MATERIALS
Introduction
Determining the comparative liquid Al corrosion resistance and characteristics of Fe-Al
intermetallic compounds of several ferrous materials are two major parts of the present
investigation. To study these characteristics, two types of apparatuses were used. Firstly, a
test apparatus was designed and fabricated to compare the corrosion rates of ferrous
materials under static and flow assisted liquid Al corrosion conditions. Secondly, another
apparatus was set up to expose specimens of various types of ferrous alloys to similar
conditions of static liquid Al in a relatively small melt volume. Afterwards, the exposed
specimens were utilized for determining the formation and growth characteristics of Fe-Al
intermetallic compounds. This chapter starts with the lists of chemical compositions and
microstructures of the materials used in the present work followed by the experimental
details. Boronizing surface treatment was also applied to selected ferrous alloys in order to
evaluate their performance under dynamic corrosion conditions of liquid Al.
3.1 Materials
3.1.1 Material Selection
Failure investigations described in Section 1.4.3 showed that the liquid Al corrosion is the
primary factor that decides the service life of tapping pipes. Moreover, the melt
contamination by the dissolution of tapping pipe materials is a crucial concern in producing
high purity Al. Cast irons and steels are close competitors for tapping pipe applications
because cast irons are significantly cheaper to manufacture than steels while steels generally
possess better resistance to thermal fatigue cracking [1] and higher strength [2, 3]. Thus the
primary aim of the current work is to select the tapping pipe materials with enhanced
corrosion resistance under the constraints of cost and thermal fatigue resistance. The high
89
temperature properties of ferrous materials can be improved by alloy additions (Section
2.1.3); on the other hand, there are no comprehensive reports (Section 2.3.5) that can be
utilized to improve their liquid Al corrosion resistance. Thus there is a need to determine the
comparative liquid Al corrosion resistance of various alloys of GCIs, DCIs and steels.
It is well established that the controlled addition of Cr, Cu and Mo improves the elevated
temperature properties of cast irons (Section 2.1.3). Thus besides C, Si and Mn - the cast
irons were alloyed with only Cr, Cu and Mo to maintain the high temperature properties. The
pipe alloys currently employed in service were selected as benchmarks for comparison with
the candidate alloys. There were two sets of ferrous materials that were tested to determine
their liquid Al corrosion resistance. The preliminary test materials were designated Series-I
and the second Series-II materials. Chemical compositions of the Series-II materials were
determined from the results of the corrosion resistance investigation on Series-I materials.
To investigate the effect of fractions of different phases (ferrite, pearlite, cementite and
graphite) on corrosion resistance, Series-I GCIs were cast with different C and Si contents.
DCIs were cast with high Si contents because Si enhances the high temperature properties of
DCIs [2]. Moreover, it was considered important to reveal the effect of varying Si content on
liquid Al corrosion and thermal fatigue resistance of DCIs.
Series-II GCIs were designed aiming at the material replacement for bottom tapping pipes,
and in this case, a high corrosion resistance is of prime importance. The existing steel pipes
fail by liquid Al corrosion while the predominant mode of failure of DCI pipes is by the
occurrence of thermal fatigue cracks. Thus a steel alloy with enhanced liquid Al corrosion
resistance could be a potential material to replace the existing steel and DCI alloys because
the literature [1] suggested that steels generally possess a higher thermal fatigue resistance
90
than cast irons. For this reason, two steel alloys were selected for comparing their liquid Al
corrosion resistance with the existing steel and DCI alloys.
3.1.2 Compositions and Microstructures
Several compositions of GCIs and DCIs were prepared in a 200 kg induction furnace by The
Casting Shop and cast in sand moulds. Optical Emission Spectroscopy (OES) was used to
determine the chemical compositions of ferrous alloys.
3.1.2.1 Specimen Preparation for Optical Microscopy
Rectangular specimen blocks of 20 mm x 20 mm x 15 mm were sectioned from the as-cast
blocks (45 mm x 45 mm x 160 mm) of cast irons using an Buehler Delta®
Abrasimet abrasive
cutter. First, the rectangular as-cast blocks were cut into two halves then the rectangular
specimen blocks of about 20 mm x 20 mm x 15 mm were removed leaving 15-20 mm from
the as-cast surfaces. The specimens were polished manually using a LECO AP-60® polisher,
including the following grinding and polishing steps:
a) Successive grinding steps of 240 and 600 grit SiC papers were performed using water as
the lubricant at a wheel rotation speed of 220 rpm. During grinding and polishing, the
specimens were rotated in the opposite direction to the wheel rotation. The usual time for
each step was 2-5 minutes. This was primarily determined by the substrate material and
the surface condition.
b) Sequential polishing was carried out using Buehler MetaDi 9 μm diamond polishing
compound on Buehler Trident® cloth, followed by the final polishing step using Buehler
MasterMet®
0.06 μm colloidal silica suspension. A turntable speed of 100 rpm was used
for both of the polishing operations.
91
Ferrous alloy specimens were etched with 2% Nital (2 ml HNO3 + 98 ml ethanol). Optical
microscopy was used to reveal the microstructures of cast irons and steels. Leica DM-
Inverted Research Microscope was used to capture the images.
3.1.2.2 Determining Phase Fraction
LECO M-400-HI Microhardness Tester was used to differentiate between ferrite and
cementite phases present in the cast iron microstructures, since cementite has higher hardness
(500-600 Hv) compared to ferrite (200-300 Hv). Etching by alkaline sodium picrate (25 gm
sodium hydroxide, 2 gm picric acid and 100 ml water, 60s at 60°C) was also performed to
confirm the ferrite and cementite phases. After etching the cementite present in cast iron
microstructure appears dark brown when viewed under the optical microscope. Figure 3.1
shows an example of the etched microstructure of GCI-S. For each alloy the average graphite
fraction was determined from two optical images at 100x using Image-J analysis software.
The average fraction of ferrite, pearlite and cementite was evaluated from two optical images
at 200x magnification.
Figure 3.1 - Optical image of GCI-S etched with alkaline sodium picrate, cementite appears
brown.
40 μm
Cementite
Pearlite
Graphite
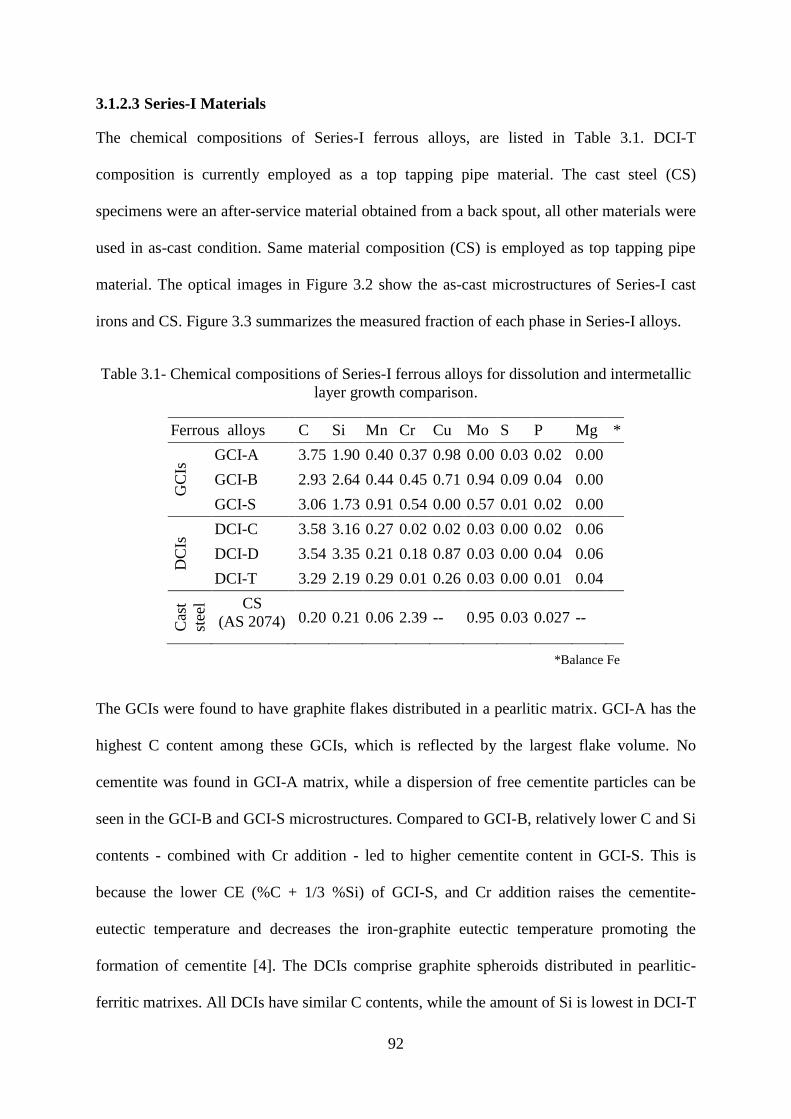
92
3.1.2.3 Series-I Materials
The chemical compositions of Series-I ferrous alloys, are listed in Table 3.1. DCI-T
composition is currently employed as a top tapping pipe material. The cast steel (CS)
specimens were an after-service material obtained from a back spout, all other materials were
used in as-cast condition. Same material composition (CS) is employed as top tapping pipe
material. The optical images in Figure 3.2 show the as-cast microstructures of Series-I cast
irons and CS. Figure 3.3 summarizes the measured fraction of each phase in Series-I alloys.
Table 3.1- Chemical compositions of Series-I ferrous alloys for dissolution and intermetallic
layer growth comparison.
Ferrous alloys C Si Mn Cr Cu Mo S P Mg *
GC
Is GCI-A 3.75 1.90 0.40 0.37 0.98 0.00 0.03 0.02 0.00
GCI-B 2.93 2.64 0.44 0.45 0.71 0.94 0.09 0.04 0.00
GCI-S 3.06 1.73 0.91 0.54 0.00 0.57 0.01 0.02 0.00
DC
Is DCI-C 3.58 3.16 0.27 0.02 0.02 0.03 0.00 0.02 0.06
DCI-D 3.54 3.35 0.21 0.18 0.87 0.03 0.00 0.04 0.06
DCI-T 3.29 2.19 0.29 0.01 0.26 0.03 0.00 0.01 0.04
Cas
t
stee
l
CS
(AS 2074)
0.20 0.21 0.06 2.39 -- 0.95 0.03 0.027 --
*Balance Fe
The GCIs were found to have graphite flakes distributed in a pearlitic matrix. GCI-A has the
highest C content among these GCIs, which is reflected by the largest flake volume. No
cementite was found in GCI-A matrix, while a dispersion of free cementite particles can be
seen in the GCI-B and GCI-S microstructures. Compared to GCI-B, relatively lower C and Si
contents - combined with Cr addition - led to higher cementite content in GCI-S. This is
because the lower CE (%C + 1/3 %Si) of GCI-S, and Cr addition raises the cementite-
eutectic temperature and decreases the iron-graphite eutectic temperature promoting the
formation of cementite [4]. The DCIs comprise graphite spheroids distributed in pearlitic-
ferritic matrixes. All DCIs have similar C contents, while the amount of Si is lowest in DCI-T
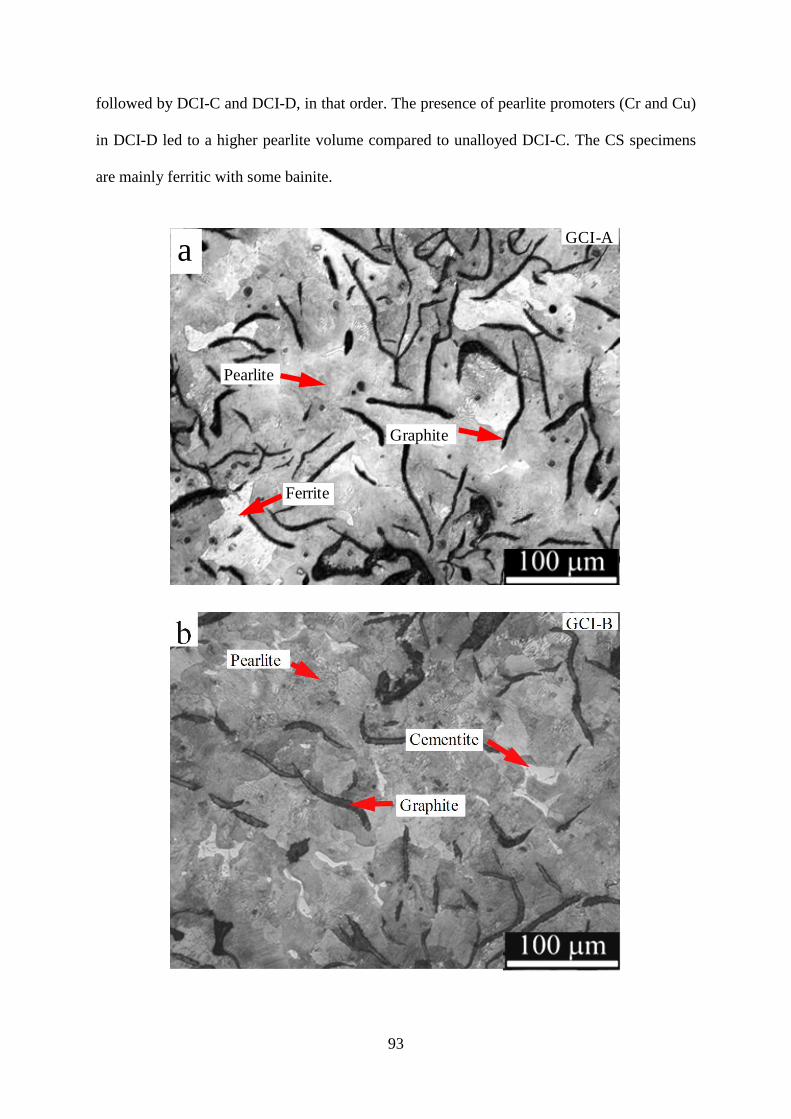
93
followed by DCI-C and DCI-D, in that order. The presence of pearlite promoters (Cr and Cu)
in DCI-D led to a higher pearlite volume compared to unalloyed DCI-C. The CS specimens
are mainly ferritic with some bainite.
a
Ferrite
Pearlite
Graphite
GCI-A
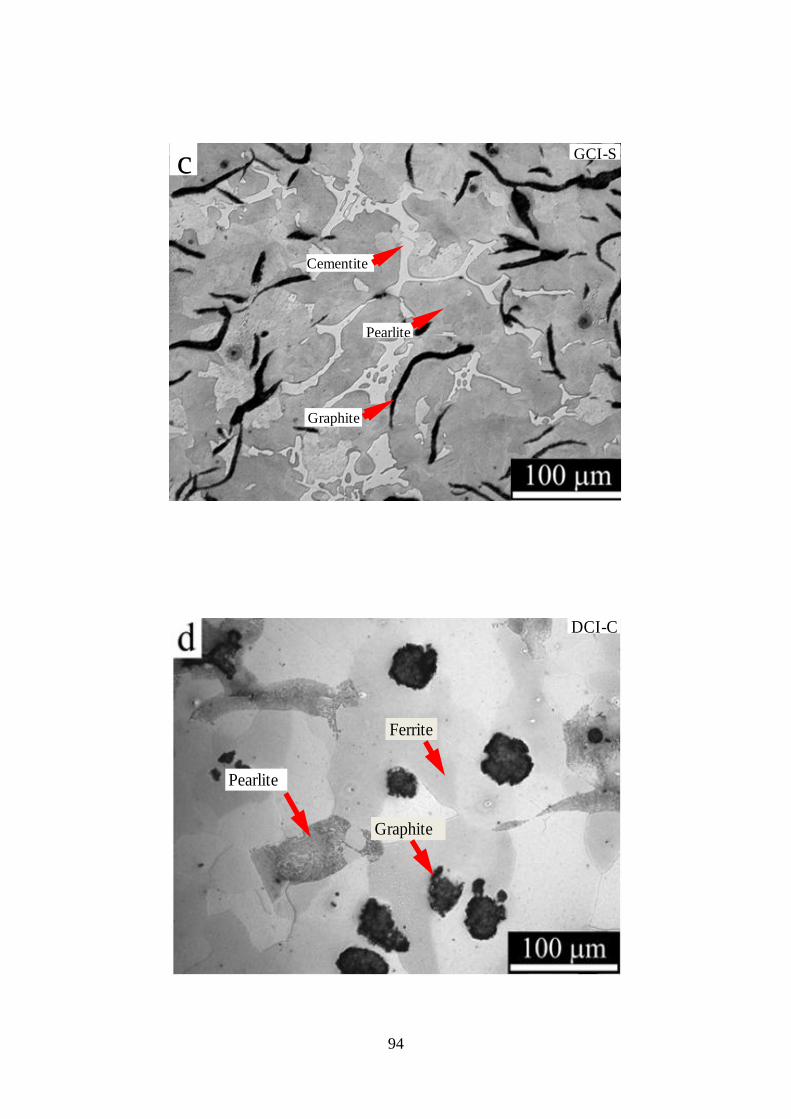
94
Cementite
Pearlite
Graphite
GCI-S
Graphite
Cementite
Pearlite
c GCI-S
Ferrite
Pearlite
Graphite
DCI-C

95
e
Pearlite
Ferrite
Graphite
DCI-D
f
Graphite
FerritePearlite
DCI-T
96
Figure 3.2 - Optical images of Series-I cast irons, a) GCI-A, b) GCI-B, c) GCI-S, d) DCI-C,
e) DCI-D, f) DCI-T. B) CS (etched with 2% Nital).
Figure 3.3 - Phase fractions of ferrite, cementite, graphite in Series-I cast iron alloys.
g
Bainite
Ferrite
CS
6.5
18
13
35
10.6
8.19.3 9.6 9.3 9.1
6.3
2.2
0
12
24
36
GCI-A GCI-S GCI-B DCI-T DCI-D DCI-C
Ph
ase
Fra
cti
on
, A
rea
%
Cast Irons
Ferrite Graphite Cementite Balance Pearlite
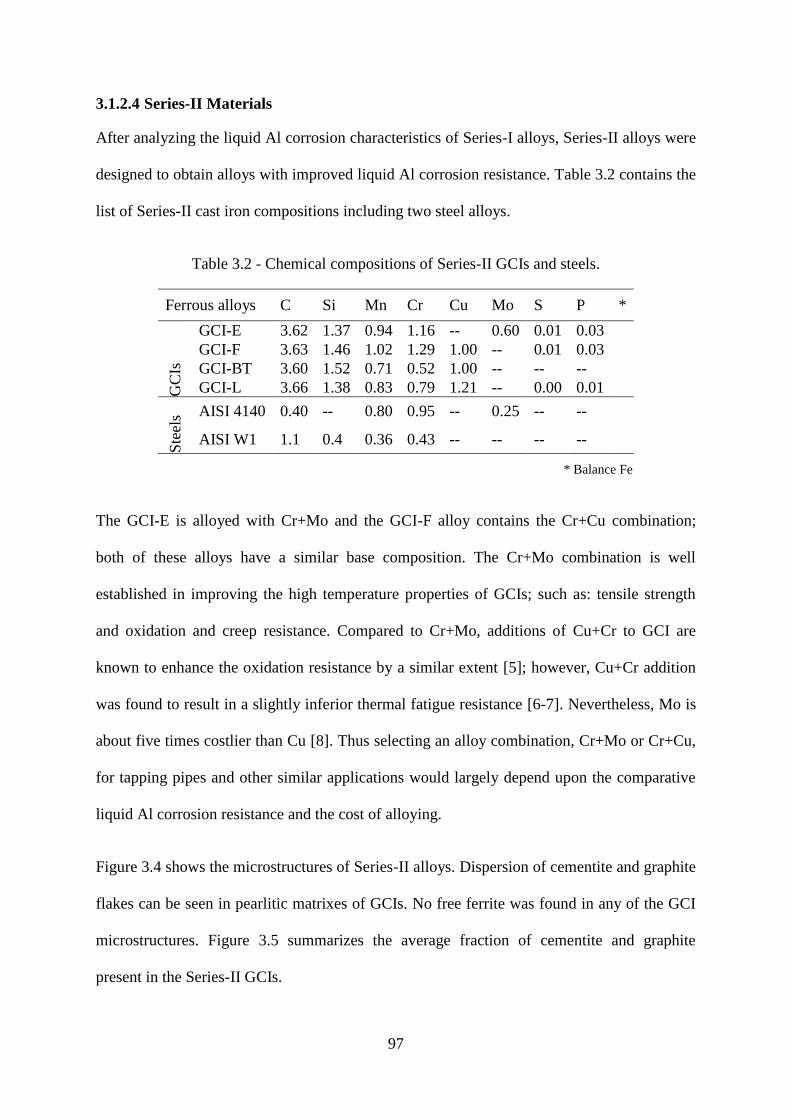
97
3.1.2.4 Series-II Materials
After analyzing the liquid Al corrosion characteristics of Series-I alloys, Series-II alloys were
designed to obtain alloys with improved liquid Al corrosion resistance. Table 3.2 contains the
list of Series-II cast iron compositions including two steel alloys.
Table 3.2 - Chemical compositions of Series-II GCIs and steels.
Ferrous alloys C Si Mn Cr Cu Mo S P *
GC
Is
GCI-E 3.62 1.37 0.94 1.16 -- 0.60 0.01 0.03
GCI-F 3.63 1.46 1.02 1.29 1.00 -- 0.01 0.03
GCI-BT 3.60 1.52 0.71 0.52 1.00 -- -- --
GCI-L 3.66 1.38 0.83 0.79 1.21 -- 0.00 0.01
Ste
els AISI 4140 0.40 -- 0.80 0.95 -- 0.25 -- --
AISI W1 1.1 0.4 0.36 0.43 -- -- -- --
* Balance Fe
The GCI-E is alloyed with Cr+Mo and the GCI-F alloy contains the Cr+Cu combination;
both of these alloys have a similar base composition. The Cr+Mo combination is well
established in improving the high temperature properties of GCIs; such as: tensile strength
and oxidation and creep resistance. Compared to Cr+Mo, additions of Cu+Cr to GCI are
known to enhance the oxidation resistance by a similar extent [5]; however, Cu+Cr addition
was found to result in a slightly inferior thermal fatigue resistance [6-7]. Nevertheless, Mo is
about five times costlier than Cu [8]. Thus selecting an alloy combination, Cr+Mo or Cr+Cu,
for tapping pipes and other similar applications would largely depend upon the comparative
liquid Al corrosion resistance and the cost of alloying.
Figure 3.4 shows the microstructures of Series-II alloys. Dispersion of cementite and graphite
flakes can be seen in pearlitic matrixes of GCIs. No free ferrite was found in any of the GCI
microstructures. Figure 3.5 summarizes the average fraction of cementite and graphite
present in the Series-II GCIs.

98
aCementite
Pearlite
Graphite
GCI-E
bCementite
Pearlite
Graphite
GCI-F

99
c
Cementite
Coarse pearlite
Graphite
PearliteGCI-BT
d
Cementite
Pearlite
Graphite
GCI-L
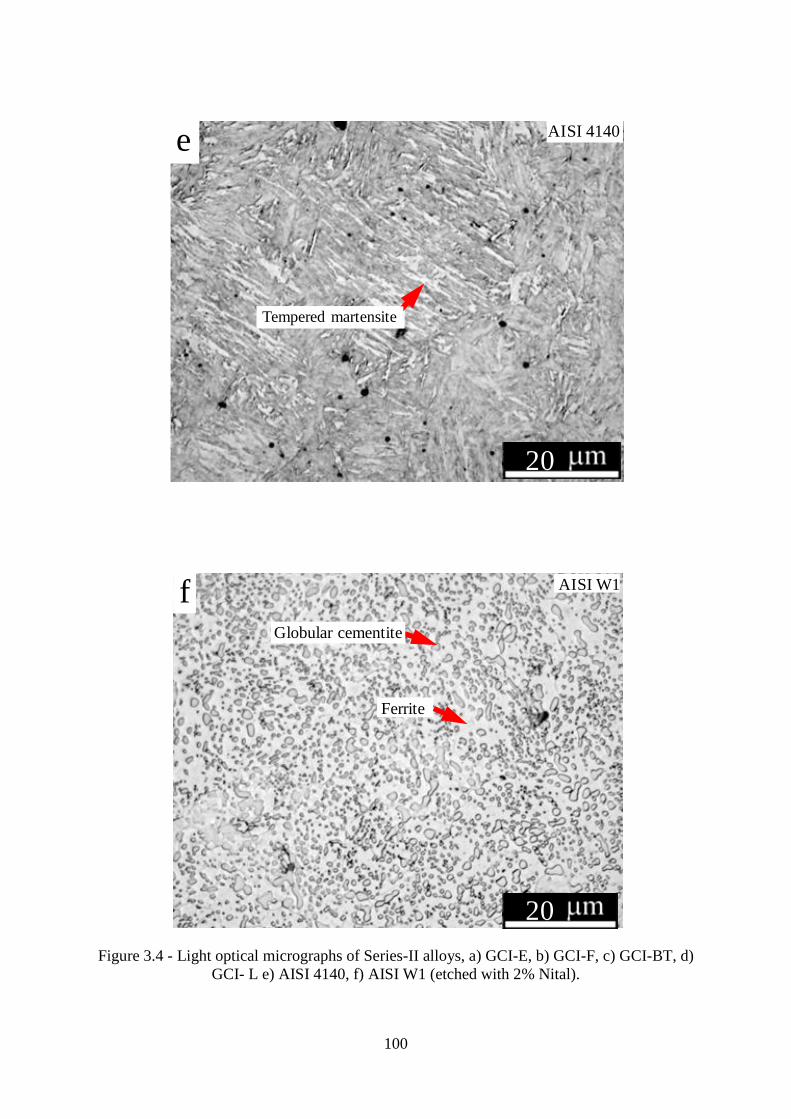
100
Figure 3.4 - Light optical micrographs of Series-II alloys, a) GCI-E, b) GCI-F, c) GCI-BT, d)
GCI- L e) AISI 4140, f) AISI W1 (etched with 2% Nital).
e
20
Tempered martinsite
AISI 4140
Tempered martensite
f
20
Globular cementite
Ferrite
AISI W1
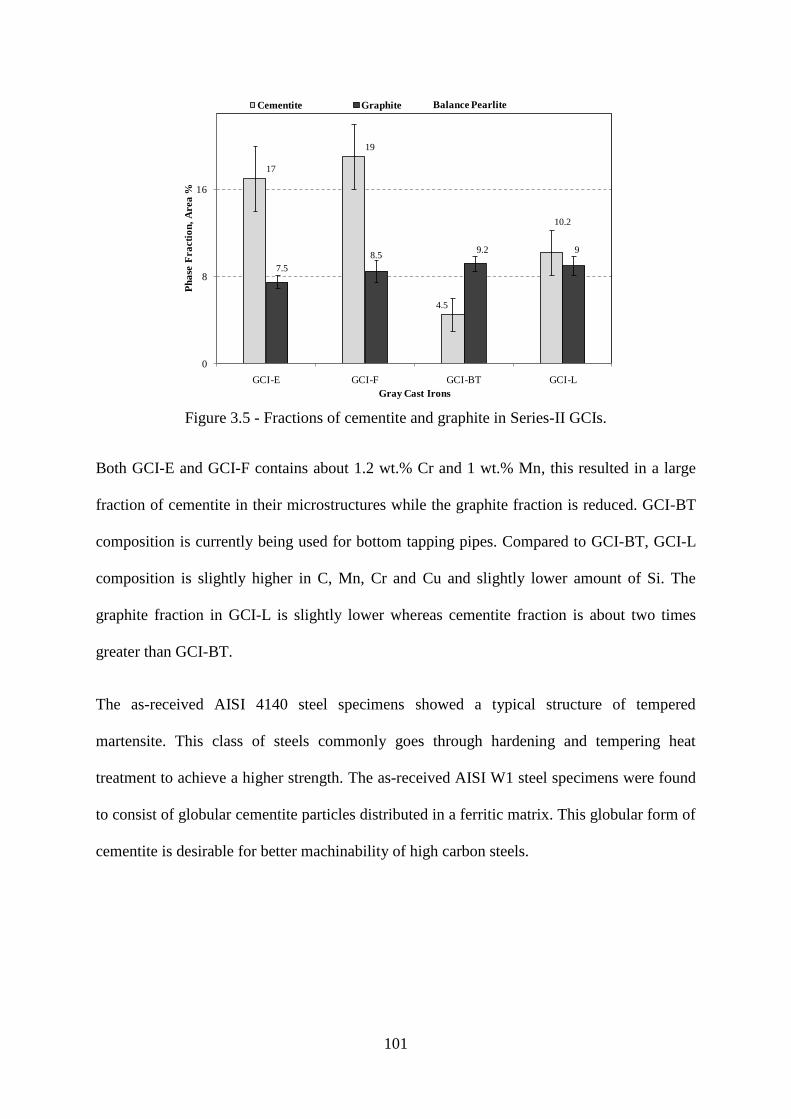
101
Figure 3.5 - Fractions of cementite and graphite in Series-II GCIs.
Both GCI-E and GCI-F contains about 1.2 wt.% Cr and 1 wt.% Mn, this resulted in a large
fraction of cementite in their microstructures while the graphite fraction is reduced. GCI-BT
composition is currently being used for bottom tapping pipes. Compared to GCI-BT, GCI-L
composition is slightly higher in C, Mn, Cr and Cu and slightly lower amount of Si. The
graphite fraction in GCI-L is slightly lower whereas cementite fraction is about two times
greater than GCI-BT.
The as-received AISI 4140 steel specimens showed a typical structure of tempered
martensite. This class of steels commonly goes through hardening and tempering heat
treatment to achieve a higher strength. The as-received AISI W1 steel specimens were found
to consist of globular cementite particles distributed in a ferritic matrix. This globular form of
cementite is desirable for better machinability of high carbon steels.
17
19
4.5
10.2
7.5
8.59.2 9
0
8
16
GCI-E GCI-F GCI-BT GCI-L
Ph
ase
Fra
cti
on
, A
rea
%
Gray Cast Irons
Cementite Graphite Balance Pearlite

102
3.2 Experimental Methods
3.2.1 Dynamic Corrosion Test Apparatus (Method-I)
The rotating disc method [9] is known to be the best available method to relate the
hydrodynamic conditions to the dissolution rate under laminar flows. In this method, a solid
disc shape specimen rotates into the melt and the solute concentration in the melt or mass loss
is measured to determine the dissolution. However, this method was found to have a few
limitations as described in Section 2.3.3.
Mountford and Glover [10] published the results of mass loss of 17 alloys of GCIs that were
subjected to static Al melt at 800°C and 900°C. A link between the chemical composition and
the liquid Al corrosion resistance of GCIs could be established, and no microstructural
analyses were carried out [10]. Present research also involves a number of cast iron alloys to
be compared for liquid Al corrosion resistance. Using the rotating disc method, it was
anticipated that there could be difficulties in ranking the corrosion resistance of cast iron
alloys. Moreover, the liquid Al in industrial application never reaches the saturation
concentration (of Fe) thus the laboratory tests should be conducted in well undersaturated
melts. Therefore, a new apparatus was needed. Figure 3.6 shows a schematic of the corrosion
test apparatus that was designed to subject specimens of candidate materials to forced flow
conditions of Al melt. The present apparatus has the following distinguishable features:
a) Highly dynamic forced flow conditions to compare the ferrous alloys for tapping pipe
applications.
b) Parallelization of experiments as six specimens can be tested at a time.
c) Bulk liquid composition and temperature remains same for all specimens.
103
Figure 3.6 - A schematic of test apparatus for determining the corrosion resistance of
ferrous alloys under forced flow.
A graphite disc (dimensions d = 100 mm, t = 20 mm) was used to hold specimens, so that
they could be immersed and rotated within the Al melt at the required speed. The rotation
speed of specimens was controlled within ± 0.02 m/s of the required speed. An electric
resistance furnace of 5.5 kW capacity was used for melting and holding the Al at required
temperature. A clay-graphite crucible was used to contain the liquid Al. Two K-type
thermocouples were used: thermocouple-I for controlling the furnace temperature and
thermocouple-II to indicate the actual melt temperature. The shaft connecting the motor and
Graphite disc
BNL coated stainless-steel tube
Shaft
Speed controller
Specimen
Motor
60
mm
11
0m
m
Thermocouple-II
Liquid Al level
Thermocouple-I
Heating element
Crucible
Frame
Bearing-II
Bearing-I

104
disc was safeguarded against molten Al by a sacrificial Boron Nitride Lubricoat® (ZYP
Coatings, USA) coated stainless steel tube, which was recoated before each test.
A large quantity (4 kg) of commercially pure (99.97%) Al was used for each test so that the
concentration of Fe remains well below its saturation concentration. The cylindrical test
specimens were threaded so they could be screwed to the lower surface of the graphite disc.
Figure 3.7 shows a photograph of the cylindrical test specimens. The cylindrical (d = 11 mm,
h = 15 mm) test specimens were machined from the as-cast blocks (45 mm x 45 mm x 160
mm) of cast irons. CS specimens were machined from approximately 40 mm x 50 mm x 200
mm section of an after-service back spout, while for AISI 4140 and AISI W1 steels, 14 mm
diameter rods were used. At the initial stage of dissolution testing, the as-machined
specimens with one circular face in as-cast condition were utilized. However, owing to the
difficulties in ranking the corrosion resistance of cast irons (Appendix B), specimens with all
finished surfaces were used for subsequent testing.
Figure 3.7 - Photograph of cast iron specimens for corrosion testing under forced flow.
The experimental procedure for the dissolution testing included the following steps.
a) The specimens were finished with 220 grit and 600 grit SiC papers and ultrasonically
cleaned in ethanol. Two specimens of each alloy were compared at each set of time and
Specimen collar
Exposed length
105
temperature. Before testing, the mass of each specimen was measured using an electronic
weighing balance with a standard accuracy of ± 0.0001 g.
b) 25 kg Al billets obtained from NZAS were cut into small pieces (60 mm x 80 mm x 80
mm approx.) using a band saw. Al pieces were melted and maintained at the required
temperature.
c) For each test, the graphite disc with six specimens screwed at a fixed radius (38 mm) was
preheated to 110°C and subsequently immersed into liquid Al. Attack of liquid Al on
specimen collars was found to cause difficulties in unscrewing the specimens after test.
Therefore, the successive coatings of FIBERFRAX® (UNIFRAX, USA) and Boron
Nitride Lubricoat®
were applied to protect the specimen collars.
d) The test temperatures were kept at 850 ± 5°C and 950 ± 5°C, and the total exposure time
varied between 1200s and 4500s. The melt was superheated by 20-25°C above the test
temperature and the mass loss during the temperature stabilization period was excluded
from the total mass lost. For evaluating the mass loss during the temperature stabilization
period, separate dissolution tests were performed for a period of 600s. In dynamic
corrosion tests the speed of rotation was kept at 0.48 m/s because at this speed oxide
formation at the melt surface was equivalent to the static melt conditions. The amount of
oxide was determined from the amount of Al recovered after each test.
e) The loose solidified Al from the specimens was first removed mechanically (by pulling
apart). Afterwards, the specimens were immersed in 10 % NaOH solution for at least 3
hours and this step was repeated a few times to ensure the complete removal of Al.
f) The specimens were ultrasonically cleaned in acetone and dried. The mass of each
specimen was measured.
106
In order to achieve similar melt conditions for cast irons, it was considered important to test
these simultaneously, thus one specimen of each alloy was tested at a time. Two specimens of
each alloy were utilized for each set of time and temperature. Wherever required the dummy
specimens of cast irons were used because the experimental set up takes six specimens at a
time.
Considering the available literature [11], relating the dissolution rate to the hydrodynamic
parameters is difficult in this case. The expected outcome therefore was the ranking of cast
iron and steel alloys according to their corrosion resistance.
3.2.2 Method for Characterizing Formation and Growth of Intermetallic Compounds
(Method-II)
In order to investigate the Fe-Al intermetallic compound growth and dissolution
characteristics, cast iron and steel alloys were subjected to static Al melts. In addition to
recording the intermetallic layer thickness, dissolution in-terms of specimen dimensions
was also noted.
To determine the intermetallic layer growth kinetics of several ferrous alloys at various
temperatures, a large number of specimens were required. In consideration of the
dissolution test apparatus (Method-I), machining a large number of cylindrical specimens
of cast irons with threaded ends was not convenient. Moreover, a large quantity (4 kg) of
Al was required for each test, which involves a considerable amount of time in cutting the
Al billets into small pieces.
Furthermore, there may be a correlation between the intermetallic layer growth in a small
melt volume and the dissolution in a large melt volume comprising the dynamic corrosion
conditions. Such a link would be useful to predict the relative liquid Al corrosion
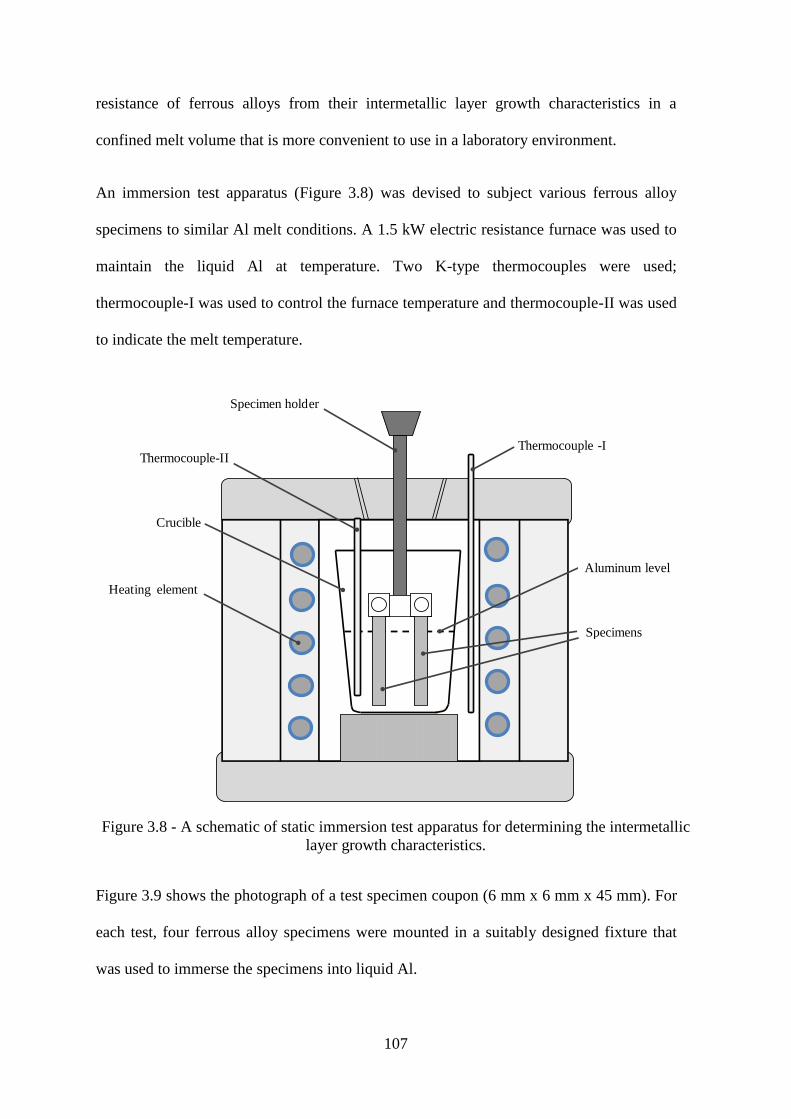
107
resistance of ferrous alloys from their intermetallic layer growth characteristics in a
confined melt volume that is more convenient to use in a laboratory environment.
An immersion test apparatus (Figure 3.8) was devised to subject various ferrous alloy
specimens to similar Al melt conditions. A 1.5 kW electric resistance furnace was used to
maintain the liquid Al at temperature. Two K-type thermocouples were used;
thermocouple-I was used to control the furnace temperature and thermocouple-II was used
to indicate the melt temperature.
Figure 3.8 - A schematic of static immersion test apparatus for determining the intermetallic
layer growth characteristics.
Figure 3.9 shows the photograph of a test specimen coupon (6 mm x 6 mm x 45 mm). For
each test, four ferrous alloy specimens were mounted in a suitably designed fixture that
was used to immerse the specimens into liquid Al.
Specimen holder
Crucible
Specimens
Heating element
Thermocouple-IIThermocouple -I
Aluminum level

108
Figure 3.9 - Photograph of the specimen for the formation and growth analysis of the
intermetallic compounds.
The test procedure included the following steps.
a) For each test, 0.25 kg of commercially pure Al obtained from NZAS was melted in a
Boron Nitride Lubricoat® coated clay-graphite crucible. Prior to melting, the oxide layer
on the Al pieces was removed by dipping in 10 % NaOH solution for 1200s, followed by
washing in a detergent and ethanol rinse.
b) All lateral surfaces of the machined specimens were finished with 600 grit SiC paper and
subsequently ultrasonically cleaned in ethanol. The specimens were preheated to 110°C
before immersion. Before immersing the specimens into melt, the Al oxide layer from the
melt surface was skimmed off.
c) To compensate for the heat lost during immersion, the melt was superheated by 30°C,
40°C and 55°C for the respective test temperatures of 750°C, 850°C and 950°C. The
temperature was controlled within ± 5°C except the initial immersion time (0-180s);
immediately after immersing the specimens into the melt - the temperature was recorded at
5-12°C lower than the test temperatures.
d) Generally, the test time varied between 60s and 2400s; for specific tests, the specimens
were also tested for 7200s. After each test, the specimens were slowly removed from the
melt and allowed to air cool.
45 mm
109
3.2.2.1 Specimen Preparation and Electron Microscopy Techniques
After the immersion test, specimens were cut perpendicular to their longitudinal axis 10 mm
from the lower end to examine the intermetallic compounds. The cutting plane was
maintained perpendicular to the longitudinal axis of specimen. The 10 mm sections of the test
specimens were mounted in Buehler Probemet®
conductive mounting compound and polished
using LECO AP-60® automatic polisher following the steps described in Section 3.1.2.1. The
specimens were further polished with 50 nm and 20 nm size colloidal silica suspension
(MasterMet®) using a Buehler Minimet-II
® automatic polisher.
The polished immersion test specimens were examined by optical and scanning electron
microscopy techniques. A JEOL JSM 6100 SEM and a JEOL 7000F field emission SEM
were used for the identification and growth analysis of intermetallic compounds. The JEOL
EX-2300 BU Energy Dispersive X-ray Analyzer fitted on JEOL 7000F SEM was used for the
compositional analysis of the formed intermetallic layers. For enhanced phase contrast, the
BSE mode was used to capture the images of the intermetallic layers. Afterwards, these
photomicrographs were used to record the growth of intermetallic compounds. A
magnification of 200x was used for evaluating the intermetallic layer thickness of ε-Fe2Al5.
The crystal structures of the intermetallic compounds were characterized using the HKL
Technology Nordlys II EBSD system mounted on a JEOL - 6100 SEM. The specimen holder
was tilted at 70° with respect to the incident beam. An accelerating voltage of 20 kV and
working distance of 30 mm was used. The BSE (Back Scattered Electrons) from the
crystallographic planes of specimen surface cast a unique crystallographic diffraction pattern
known as “Kikuchi pattern”, which indicates the phase present and the crystallographic
orientation. The obtained electron back scatter patterns were compared with the possible
intermetallic compounds entered and stored in HKL Technology‟s Flamenco software. In
110
addition to the characterization of the intermetallic compounds, EBSD was also utilized to
reveal the crystallographic growth direction of ε-Fe2Al5 and ζ-FeAl3.
The specimen dimensions before and after the test were measured using the digital
micrometer on LECO M-400-HI Microhardness Tester with a cumulative measurement
accuracy of ± 5 μm.
3.3 Boronizing
To address the feasibility of a boronizing treatment for tapping pipe applications, selected
ferrous alloys (DCI-T, GCI-S and CS) were boronized for comparing their corrosion rates
under flow assisted liquid Al corrosion.
Three cylindrical specimens of each alloy were boronized: two for corrosion resistance
comparison and the third for determining the morphology of Fe-B intermetallic layers. A
layer of Ekabor® (BorTec GmbH, Germany) boronizing paste of 4-6 mm thickness was
applied to the cylindrical specimens with finished surfaces. The pasted specimens were dried
in hot air and then placed in a cylindrical steel container that was filled with sand to minimize
the possible oxidation during heat treating. The steel container containing the specimens was
heat treated at 950°C for 4 hours. The formed boride layers are discussed in Appendix D.
Chapter References
[1] M.M. Shea, American Foundry Society Transactions, 04 (1978) 23-30.
[2] J. Janowak, J.D. Crawford, K. Roehrig, Casting Engineering, 14 (1982) 31-41.
[3] M. Blair, T.L. Steven, Steel Castings Handbook, ASM International, Materials Park,
Ohio, 1995.
[4] J.F. Janowak, R.B. Gundlach, American Foundry Society Transactions, 90 (1982) 847-
863.
[5] J.R. Davis, ASM Speciality Handbook-Cast Irons, ASM International, Materials Park,
Ohio, 1996.
[6] M.C. Rukadikar, G.P. Reddy, International Journal of Fatigue, 9 (1987) 25-34.

111
[7] K. Roehrig, American Foundry Society Transactions, 86 (1978) 75-88.
[8] www.internationalpbx.com/pdfs/PBX-Brochure.pdf.
[9] V.N. Eremenko, Y.V. Natanzon, Materials Science, 2 (1968) 411-413.
[10] F.A. Mountford, T.J. Glover, Foundry Trade Journal, 120 (1966) 849-852.
[11] H. Grijseels, D. Crommelin, C. Blaey, Pharmaceutisch Weekblad Scientific Edition, 3
(1981) 1005-1020.
112
CHAPTER 4 : RESULTS
Introduction
This chapter starts with a comparison of the performance of cast iron and steel alloys under
static and flow assisted liquid Al corrosion. When a cast iron is exposed to liquid Al, the Fe-
Al reaction phases form and grow, and simultaneously, the Fe-substrate starts to dissolve into
the melt. The liquid Al corrosion rate of ferrous alloys was believed to depend upon the
advance of intermetallic layer towards the substrate, and its dissolution and/or spallation into
the melt. To understand these two types of phenomenon, the substrate/intermetallic layer
interfaces of various ferrous alloys were investigated and growth of the intermetallic layers
was compared with the corrosion rates.
4.1 Characteristics of the Dynamic Corrosion Test Apparatus
The newly designed dynamic corrosion test apparatus (Section 3.2.1) was successfully used
to compare the corrosion rates of various ferrous alloys. From the initial test runs, it was clear
that all seven ferrous alloys were corroded aggressively by liquid Al. Two methods were
employed to determine the dissolution-time relationship of ferrous alloys using the dynamic
corrosion test apparatus: i) mass dissolution and, ii) semi-instantaneous dissolution.
Mass dissolution was determined by mass lost per unit time. Semi-instantaneous dissolution
considered the decreasing area of specimen to calculate volume loss per unit time and per
unit area. For details see Appendix C. In both types of analysis, at 850°C, the dissolution and
time relationship was found to be linear. However, at 950°C, the initial corrosion rates (at
600s) of the majority of alloys were found to be significantly higher than the subsequent
periods of exposure. These results identified that the new apparatus with dynamic corrosion
conditions can be used to obtain a linear rate constant from a set of dissolution-time data
obtained after an initial exposure time (600s). Relatively lower corrosion rate after the initial

113
time period may be related to factors such as changing hydrodynamic conditions, phase
transformations in the substrate materials and formation of Al oxide within the melt. These
effects were not investigated in the current work.
The feature of providing dynamic corrosion conditions depicted a clear picture of the
corrosion resistance of various alloys of GCI, DCI and steel. Under flow assisted corrosion
conditions, material loss occurred at an enhanced rate, which magnified the relative
differences between the dissolution rates of cast irons. Moreover, this apparatus provided the
increased uniformity in bulk melt composition and temperature for the alloys under
comparison.
4.2 Comparative Liquid Al Corrosion Resistance
The dynamic corrosion test apparatus was used to compare the corrosion rates of ferrous
alloys under static and forced flow conditions of liquid Al. As mentioned in Section 4.1, with
respect to the exposure time, two different regimes of material loss were identified. To
simplify the data analysis, the comparative corrosion resistance of ferrous alloys was
determined in terms of the mass dissolution rate over a single time period. Static tests were
also performed on Series-I alloys. Two samples of each material were used for each set of
conditions. The mass dissolution rate (R′) can be given by:
R′ = t
m
(4.1)
where m′ is the mass dissolution over a single test period (t′). Table 4.1 lists t′ for different
conditions of flow and temperature.
Table 4.1 - Test times (t′) for calculating R′ of ferrous alloys.
Test 850°C-static 850°C-0.48 m/s 950°C-static 950°C-0.48 m/s
t′(s) 2400 3900 2400 3000*
*For Steels t′ = 600s

114
4.2.1 GCIs
The corrosion resistance of Series-I GCIs was investigated under different conditions of
temperature and liquid Al flow, Figure 4.1 shows the obtained R′ of GCIs. It is clear that
GCI-A has a higher corrosion resistance than GCI-S, and GCI-B showed the highest material
loss at each set of conditions. Under static melt conditions at 850°C, GCI-B and GCI-S
dissolved more slowly than GCI-A. Also, a large difference in the dissolution rates of two
specimens for each alloy is apparent in this case - shown by error bars. Under static melt
conditions, this difference was within ±10 to ±26 % of the mean value while under forced
flow it varied between ±2 to ±6 %.
Figure 4.1 - Mass dissolution rate (R′) of Series-I GCIs under static and forced flow (0.48
m/s) melt conditions at 850°C and 950°C.
At 850°C, with the change in melt condition from static to forced, a slightly increased
dissolution rate of GCI-A is apparent, while GCI-S and GCI-B dissolved at a higher (> 2.5
times) rate. As expected, the dissolution of all materials was more rapid at 950°C than at
850°C. Under static and forced flow conditions at 950°C, GCI-S dissolved at a rate
0.240.17
0.190.28
0.470.53
0.39 0.420.52
1.07
1.19
1.52
0
0.4
0.8
1.2
1.6
GCI-A GCI-S GCI-B
Ma
ss D
isso
luti
on
Ra
te (
R′)
, g
/s (
10
-3)
Static-850°C Forced Flow (0.48 m/s)-850°C
Static-950°C Forced Flow (0.48 m/s)-950°C

115
approximately 1.1 times higher than GCI-A. However, under forced flow at 850°C, this ratio
was 1.7. Under forced flow conditions at 850°C, GCI-B dissolved approximately 2 times
faster than GCI-A. While under forced flow at 950°C, this ratio was decreased to 1.4.
From the analysis of corrosion rates of Series-I alloys, Series-II alloys were prepared to
further investigate the effect of composition and microstructure on liquid Al corrosion. Figure
4.2 shows a comparison of R′ of Series-I and Series-II GCI alloys. Series-II alloys dissolved
more slowly than Series-I alloys. The dissolution rate of GCI-BT was about 17% slower than
that of GCI-A. GCI-BT composition is currently used for bottom tapping pipes. GCI-E and
GCI-F were corroded at similar rates (differed only by 4%). GCI-F exhibited about
approximately 12 % higher dissolution rate than GCI-BT. Alloy GCI-L outperformed all the
GCIs under investigation, which showed a dissolution rate of approximately 20 % lower than
GCI-BT.
Figure 4.2 - Mass dissolution rates (R′) of Series-I and Series-II GCIs under forced flow
(0.48m/s) at 950°C.
0.72
0.891.00 1.04 1.07
1.19
1.52
0
0.3
0.6
0.9
1.2
1.5
1.8
Ma
ss D
isso
luti
on
Ra
te (
R′)
, g
/s (
10
-3)
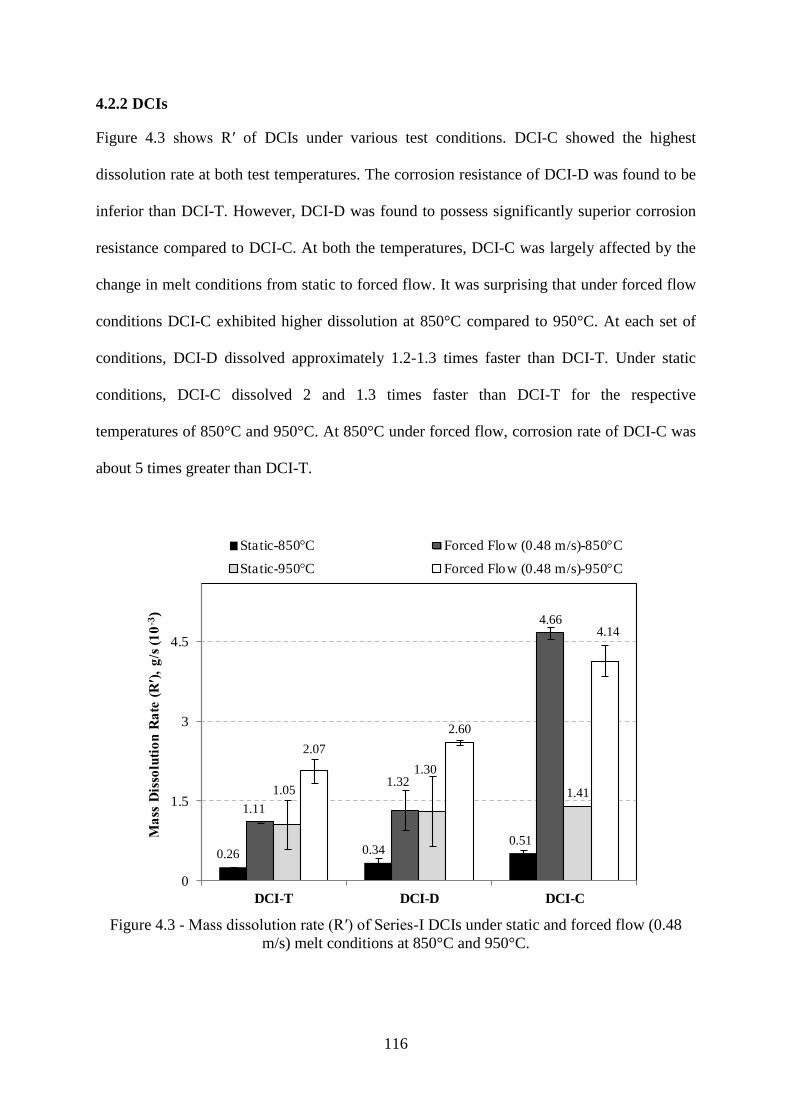
116
4.2.2 DCIs
Figure 4.3 shows R′ of DCIs under various test conditions. DCI-C showed the highest
dissolution rate at both test temperatures. The corrosion resistance of DCI-D was found to be
inferior than DCI-T. However, DCI-D was found to possess significantly superior corrosion
resistance compared to DCI-C. At both the temperatures, DCI-C was largely affected by the
change in melt conditions from static to forced flow. It was surprising that under forced flow
conditions DCI-C exhibited higher dissolution at 850°C compared to 950°C. At each set of
conditions, DCI-D dissolved approximately 1.2-1.3 times faster than DCI-T. Under static
conditions, DCI-C dissolved 2 and 1.3 times faster than DCI-T for the respective
temperatures of 850°C and 950°C. At 850°C under forced flow, corrosion rate of DCI-C was
about 5 times greater than DCI-T.
Figure 4.3 - Mass dissolution rate (R′) of Series-I DCIs under static and forced flow (0.48
m/s) melt conditions at 850°C and 950°C.
0.26 0.340.51
1.11
1.32
4.66
1.05
1.30
1.41
2.07
2.60
4.14
0
1.5
3
4.5
DCI-T DCI-D DCI-C
Ma
ss D
isso
luti
on
Ra
te (
R′)
, g
/s (
10
-3)
Static-850°C Forced Flow (0.48 m/s)-850°C
Static-950°C Forced Flow (0.48 m/s)-950°C

117
4.2.3 Steels
Corrosion rates of CS were investigated at various conditions of flow and temperature. Figure
4.4 shows the R′ of CS under various exposure conditions. At 850°C, with a change in melt
conditions from static to forced, the corrosion rate of CS was increased about 12 times. Under
static melt conditions, CS dissolved about 6 times faster at 950°C than 850°C. Under the
forced flow at 950°C, CS samples dissolved completely thus their actual rate is expected to
be higher than the recorded value.
Series-II steels were tested at 950°C-0.48 m/s, Figure 4.5 shows the calculated R′ of CS, AISI
4140 and AISI W1 steels. The steels with higher C contents (AISI 4140 and AISI W1)
performed exceptionally well compared to the low C (CS). A significant decrease of
corrosion rate (~12 times) was found with increase in C content from 0.2 (CS) to 0.4 wt.%
(AISI 4140). However, a further increase to 1.1 wt.% C (AISI W1) exhibited a slight
decrease in the corrosion rate.
Figure 4.4 - Mass dissolution rate (R′) of CS under static and forced flow (0.48 m/s) melt
conditions at 850°C and 950°C.
1.15
10.51
7.43
14.75
0
3
6
9
12
15
Static-850°C Forced Flow
(0.48 m/s)-850°C
Static-950°C Forced Flow
(0.48 m/s)-950°C
Ma
ss D
isso
luti
on
Ra
te (
R′)
, g
/s (
10
-3)
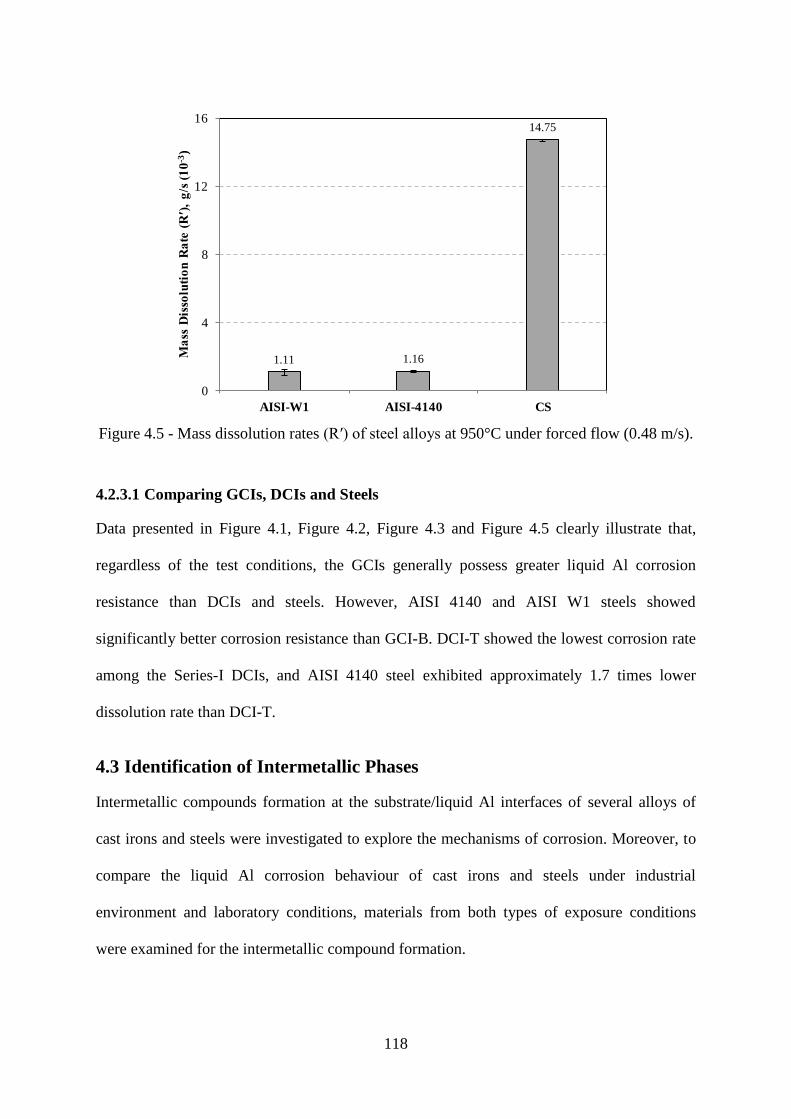
118
Figure 4.5 - Mass dissolution rates (R′) of steel alloys at 950°C under forced flow (0.48 m/s).
4.2.3.1 Comparing GCIs, DCIs and Steels
Data presented in Figure 4.1, Figure 4.2, Figure 4.3 and Figure 4.5 clearly illustrate that,
regardless of the test conditions, the GCIs generally possess greater liquid Al corrosion
resistance than DCIs and steels. However, AISI 4140 and AISI W1 steels showed
significantly better corrosion resistance than GCI-B. DCI-T showed the lowest corrosion rate
among the Series-I DCIs, and AISI 4140 steel exhibited approximately 1.7 times lower
dissolution rate than DCI-T.
4.3 Identification of Intermetallic Phases
Intermetallic compounds formation at the substrate/liquid Al interfaces of several alloys of
cast irons and steels were investigated to explore the mechanisms of corrosion. Moreover, to
compare the liquid Al corrosion behaviour of cast irons and steels under industrial
environment and laboratory conditions, materials from both types of exposure conditions
were examined for the intermetallic compound formation.
1.11 1.16
14.75
0
4
8
12
16
AISI-W1 AISI-4140 CS
Ma
ss D
isso
luti
on
Ra
te (
R′)
, g
/s (
10
-3)
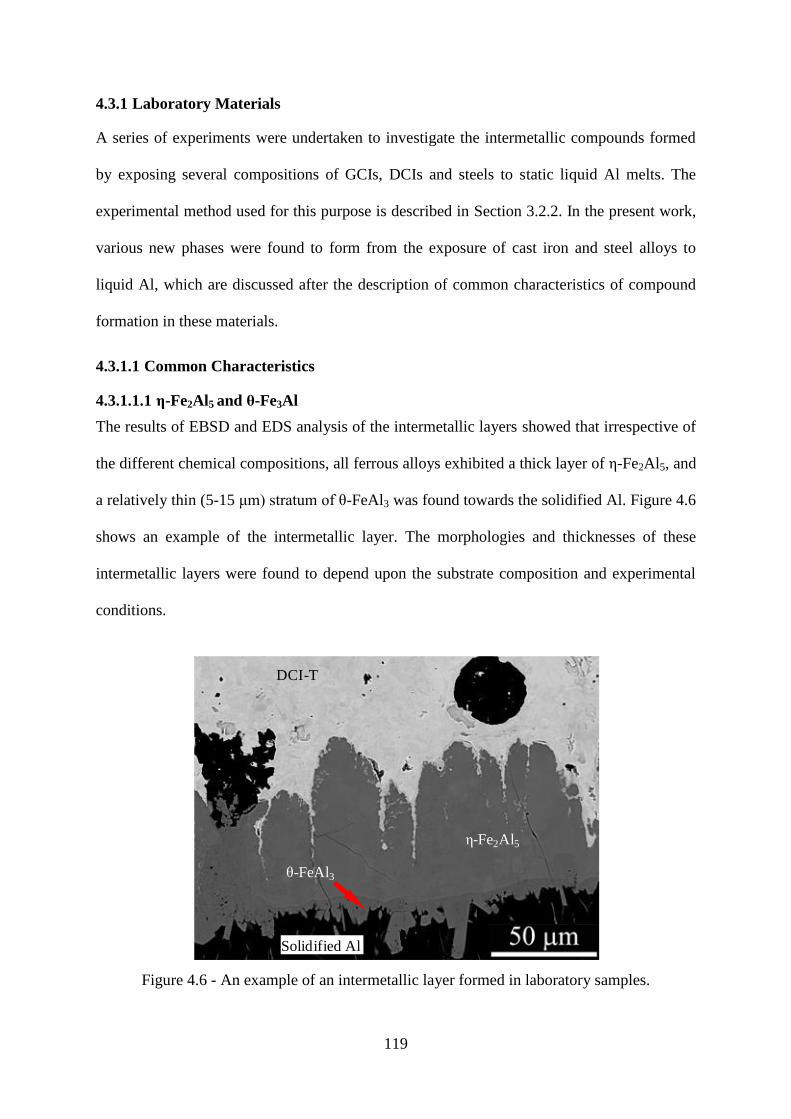
119
4.3.1 Laboratory Materials
A series of experiments were undertaken to investigate the intermetallic compounds formed
by exposing several compositions of GCIs, DCIs and steels to static liquid Al melts. The
experimental method used for this purpose is described in Section 3.2.2. In the present work,
various new phases were found to form from the exposure of cast iron and steel alloys to
liquid Al, which are discussed after the description of common characteristics of compound
formation in these materials.
4.3.1.1 Common Characteristics
4.3.1.1.1 ε-Fe2Al5 and ζ-Fe3Al
The results of EBSD and EDS analysis of the intermetallic layers showed that irrespective of
the different chemical compositions, all ferrous alloys exhibited a thick layer of ε-Fe2Al5, and
a relatively thin (5-15 μm) stratum of ζ-FeAl3 was found towards the solidified Al. Figure 4.6
shows an example of the intermetallic layer. The morphologies and thicknesses of these
intermetallic layers were found to depend upon the substrate composition and experimental
conditions.
Figure 4.6 - An example of an intermetallic layer formed in laboratory samples.
DCI-T
ε-Fe2Al5
ζ-FeAl3
Solidified Al
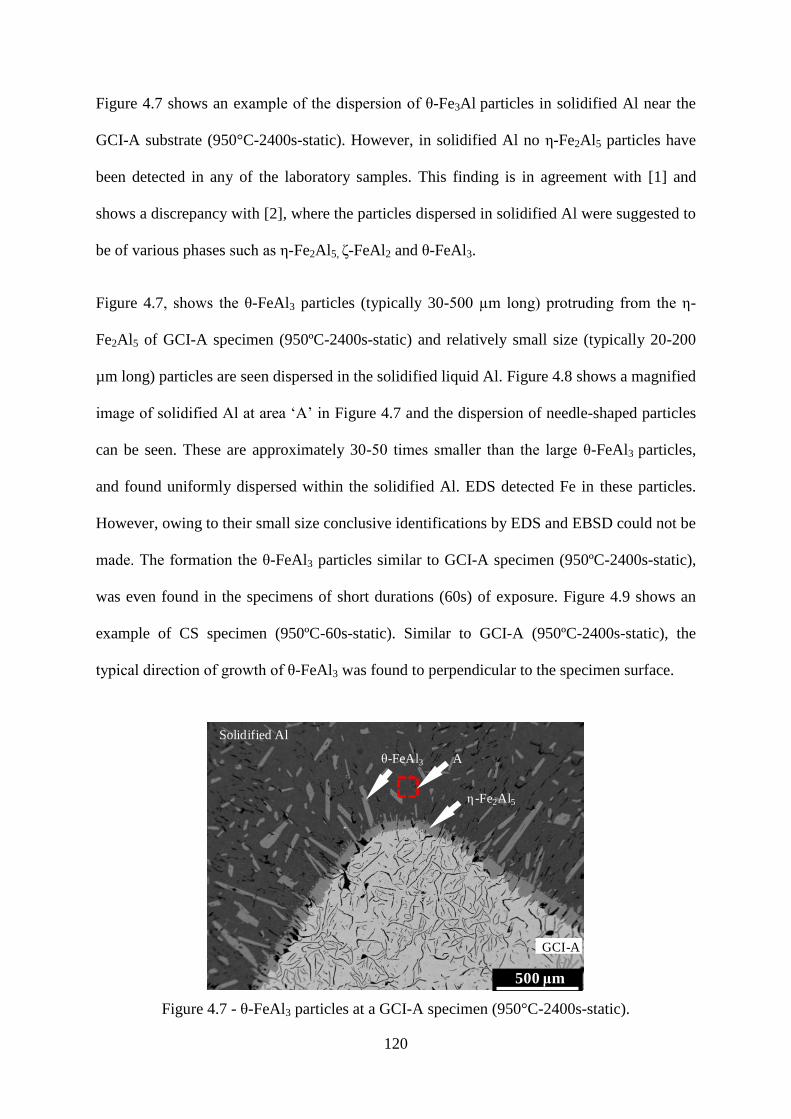
120
Figure 4.7 shows an example of the dispersion of ζ-Fe3Al particles in solidified Al near the
GCI-A substrate (950°C-2400s-static). However, in solidified Al no ε-Fe2Al5 particles have
been detected in any of the laboratory samples. This finding is in agreement with [1] and
shows a discrepancy with [2], where the particles dispersed in solidified Al were suggested to
be of various phases such as ε-Fe2Al5, δ-FeAl2 and ζ-FeAl3.
Figure 4.7, shows the ζ-FeAl3 particles (typically 30-500 µm long) protruding from the ε-
Fe2Al5 of GCI-A specimen (950ºC-2400s-static) and relatively small size (typically 20-200
µm long) particles are seen dispersed in the solidified liquid Al. Figure 4.8 shows a magnified
image of solidified Al at area „A‟ in Figure 4.7 and the dispersion of needle-shaped particles
can be seen. These are approximately 30-50 times smaller than the large ζ-FeAl3 particles,
and found uniformly dispersed within the solidified Al. EDS detected Fe in these particles.
However, owing to their small size conclusive identifications by EDS and EBSD could not be
made. The formation the ζ-FeAl3 particles similar to GCI-A specimen (950ºC-2400s-static),
was even found in the specimens of short durations (60s) of exposure. Figure 4.9 shows an
example of CS specimen (950ºC-60s-static). Similar to GCI-A (950ºC-2400s-static), the
typical direction of growth of ζ-FeAl3 was found to perpendicular to the specimen surface.
Figure 4.7 - ζ-FeAl3 particles at a GCI-A specimen (950°C-2400s-static).
500 μm
ζ-FeAl3
GCI-A
ε -Fe2Al5
Solidified Al
A
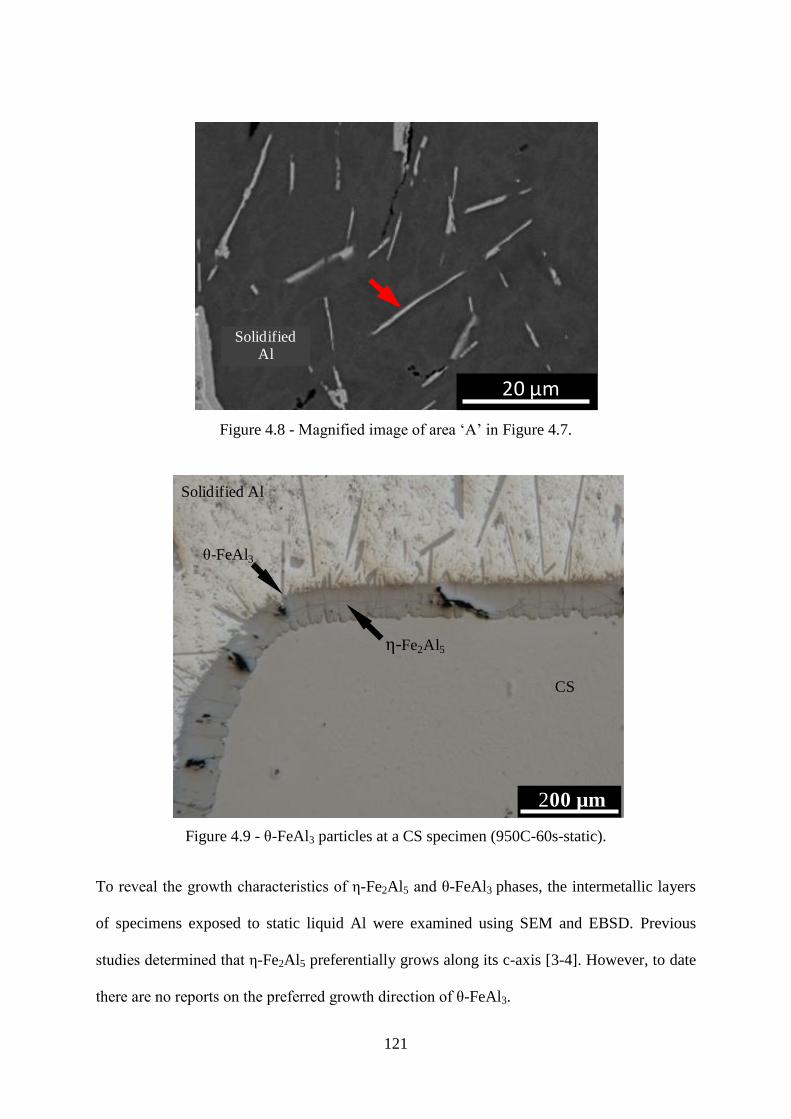
121
Figure 4.8 - Magnified image of area „A‟ in Figure 4.7.
Figure 4.9 - ζ-FeAl3 particles at a CS specimen (950C-60s-static).
To reveal the growth characteristics of ε-Fe2Al5 and ζ-FeAl3 phases, the intermetallic layers
of specimens exposed to static liquid Al were examined using SEM and EBSD. Previous
studies determined that ε-Fe2Al5 preferentially grows along its c-axis [3-4]. However, to date
there are no reports on the preferred growth direction of ζ-FeAl3.
20 μm
Solidified alumimnum
Solidified Al
ε-Fe2Al5
CS
Solidified Al
ζ-FeAl3
200 µm
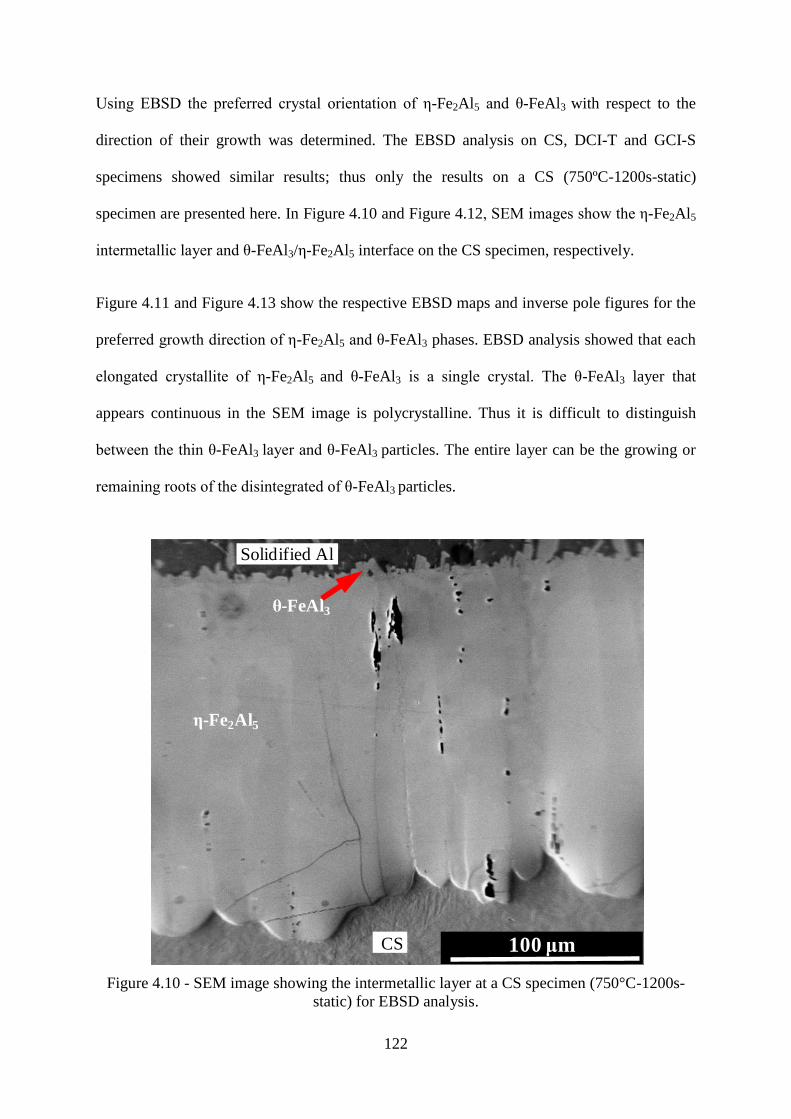
122
Using EBSD the preferred crystal orientation of ε-Fe2Al5 and ζ-FeAl3 with respect to the
direction of their growth was determined. The EBSD analysis on CS, DCI-T and GCI-S
specimens showed similar results; thus only the results on a CS (750ºC-1200s-static)
specimen are presented here. In Figure 4.10 and Figure 4.12, SEM images show the ε-Fe2Al5
intermetallic layer and ζ-FeAl3/ε-Fe2Al5 interface on the CS specimen, respectively.
Figure 4.11 and Figure 4.13 show the respective EBSD maps and inverse pole figures for the
preferred growth direction of ε-Fe2Al5 and ζ-FeAl3 phases. EBSD analysis showed that each
elongated crystallite of ε-Fe2Al5 and ζ-FeAl3 is a single crystal. The ζ-FeAl3 layer that
appears continuous in the SEM image is polycrystalline. Thus it is difficult to distinguish
between the thin ζ-FeAl3 layer and ζ-FeAl3 particles. The entire layer can be the growing or
remaining roots of the disintegrated of ζ-FeAl3 particles.
Figure 4.10 - SEM image showing the intermetallic layer at a CS specimen (750°C-1200s-
static) for EBSD analysis.
100 μm
ζ-FeAl3
ε-Fe2Al5
CS
Solidified Al

123
The inverse pole figures were used to represent the relative alignment of the unit cells on the
specimen surface with respect to a known axis. The Y0 axis in inverse pole figures represents
the observed growth direction of ε-Fe2Al5 and ζ-FeAl3, which is perpendicular to the
specimen surface in contact with the liquid Al. In agreement with the literature, the
orthorhombic crystals of ε-Fe2Al5 were found to grow preferentially in the [001] direction,
which is the shortest axis of the ε-Fe2Al5 unit cell. Current work found for the first time that
ζ-FeAl3 crystals preferentially grow in the [010] direction.
Figure 4.11 - CS specimen (750°C-1200s-static), a) EBSD map of ε-Fe2Al5, b) inverse pole
figures for ε-Fe2Al5. Reference data source [5]
z
x
y
a = 7.68 Aº, b = 6.40 Aº, c = 4.20 Aº
α = β = γ =90º
ε-Fe2Al5
ζ-FeAl3
CS substrate
a
b
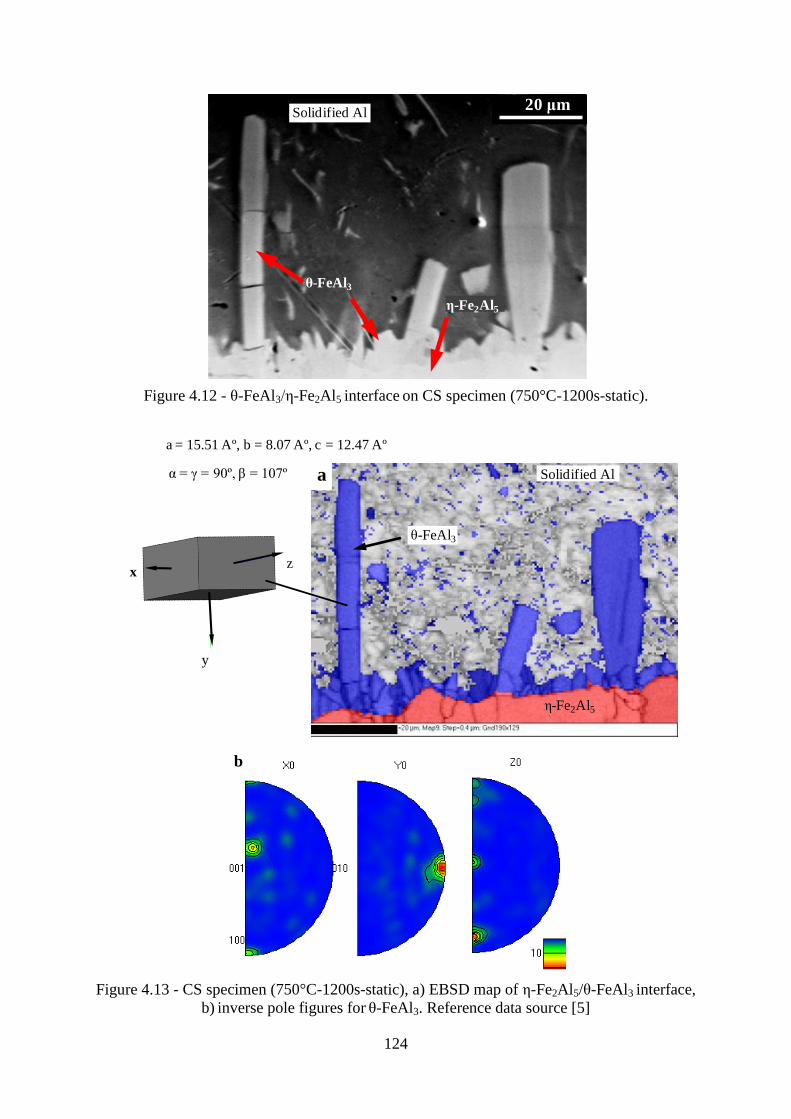
124
Figure 4.12 - ζ-FeAl3/ε-Fe2Al5 interface on CS specimen (750°C-1200s-static).
Figure 4.13 - CS specimen (750°C-1200s-static), a) EBSD map of ε-Fe2Al5/ζ-FeAl3 interface,
b) inverse pole figures for ζ-FeAl3. Reference data source [5]
20 μm
ε-Fe2Al5
ζ-FeAl3
Solidified Al
a = 15.51 Aº, b = 8.07 Aº, c = 12.47 Aº
α = γ = 90º, β = 107º
z
y
x
ε-Fe2Al5
ζ-FeAl3
a Solidified Al
b
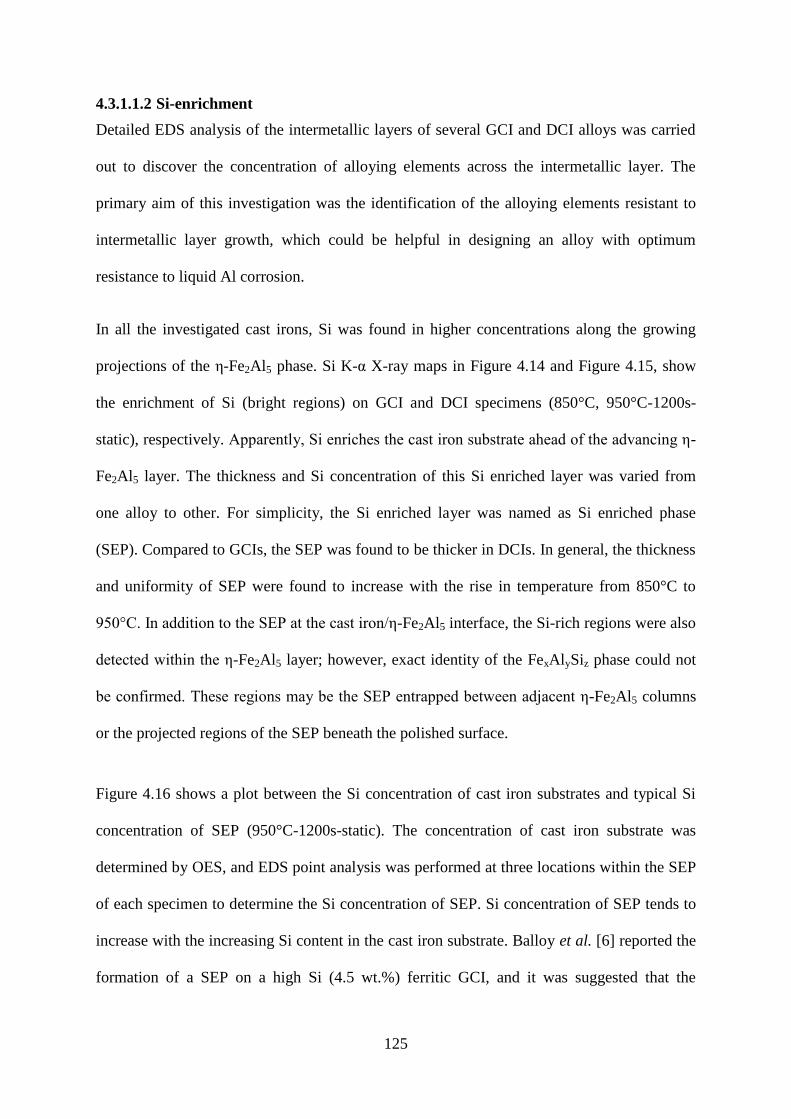
125
4.3.1.1.2 Si-enrichment
Detailed EDS analysis of the intermetallic layers of several GCI and DCI alloys was carried
out to discover the concentration of alloying elements across the intermetallic layer. The
primary aim of this investigation was the identification of the alloying elements resistant to
intermetallic layer growth, which could be helpful in designing an alloy with optimum
resistance to liquid Al corrosion.
In all the investigated cast irons, Si was found in higher concentrations along the growing
projections of the ε-Fe2Al5 phase. Si K-α X-ray maps in Figure 4.14 and Figure 4.15, show
the enrichment of Si (bright regions) on GCI and DCI specimens (850°C, 950°C-1200s-
static), respectively. Apparently, Si enriches the cast iron substrate ahead of the advancing ε-
Fe2Al5 layer. The thickness and Si concentration of this Si enriched layer was varied from
one alloy to other. For simplicity, the Si enriched layer was named as Si enriched phase
(SEP). Compared to GCIs, the SEP was found to be thicker in DCIs. In general, the thickness
and uniformity of SEP were found to increase with the rise in temperature from 850°C to
950°C. In addition to the SEP at the cast iron/ε-Fe2Al5 interface, the Si-rich regions were also
detected within the ε-Fe2Al5 layer; however, exact identity of the FexAlySiz phase could not
be confirmed. These regions may be the SEP entrapped between adjacent ε-Fe2Al5 columns
or the projected regions of the SEP beneath the polished surface.
Figure 4.16 shows a plot between the Si concentration of cast iron substrates and typical Si
concentration of SEP (950°C-1200s-static). The concentration of cast iron substrate was
determined by OES, and EDS point analysis was performed at three locations within the SEP
of each specimen to determine the Si concentration of SEP. Si concentration of SEP tends to
increase with the increasing Si content in the cast iron substrate. Balloy et al. [6] reported the
formation of a SEP on a high Si (4.5 wt.%) ferritic GCI, and it was suggested that the
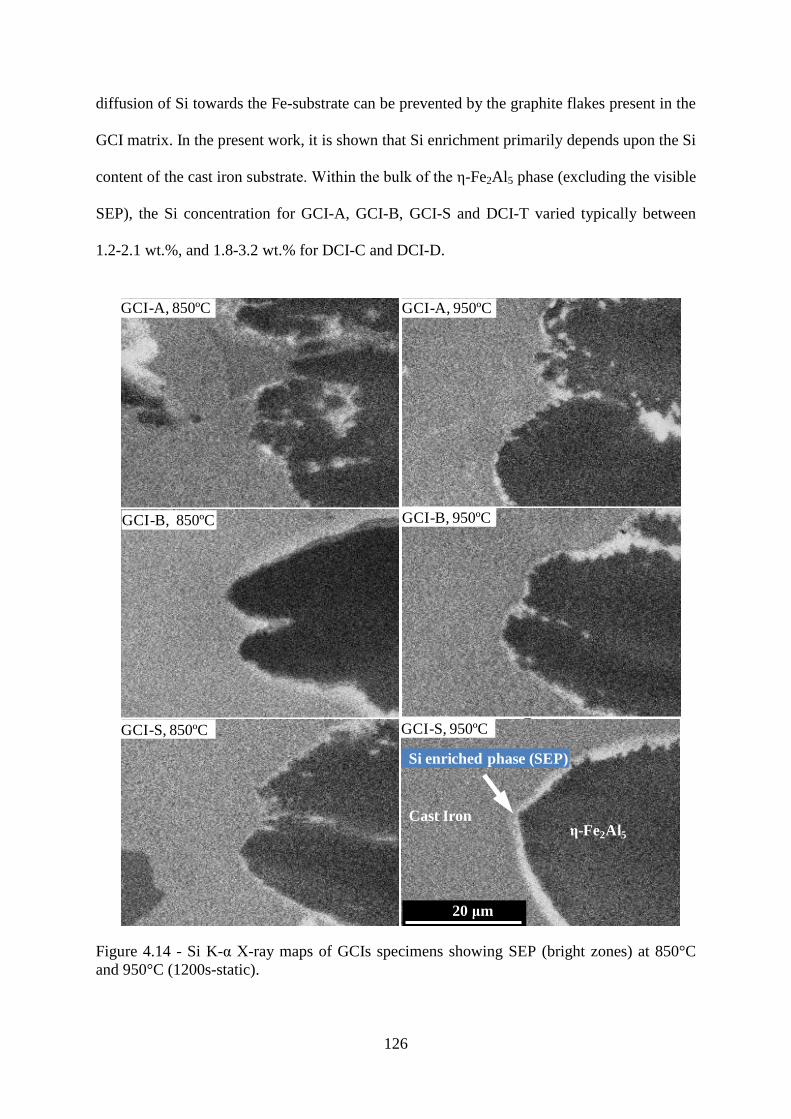
126
diffusion of Si towards the Fe-substrate can be prevented by the graphite flakes present in the
GCI matrix. In the present work, it is shown that Si enrichment primarily depends upon the Si
content of the cast iron substrate. Within the bulk of the ε-Fe2Al5 phase (excluding the visible
SEP), the Si concentration for GCI-A, GCI-B, GCI-S and DCI-T varied typically between
1.2-2.1 wt.%, and 1.8-3.2 wt.% for DCI-C and DCI-D.
Figure 4.14 - Si K-α X-ray maps of GCIs specimens showing SEP (bright zones) at 850°C
and 950°C (1200s-static).
20 μm
Si enriched phase (SEP)
ε-Fe2Al5
Cast Iron
GCI-A, 850ºC
GCI-B, 950ºCGCI-B, 850ºC
GCI-A, 950ºC
GCI-S, 950ºCGCI-S, 850ºC

127
Figure 4.15 - Si K-α X-ray maps of DCIs showing SEP (bright zones) at 850°C and 950°C
(1200s-static).
Figure 4.16 - Si content of the cast iron matrix versus Si concentration of the SEP (950°C-
1200s-static).
20 μm
Si enriched phase (SEP)
ε-Fe2Al5
Cast Iron
DCI-C, 950ºCDCI-C, 850ºC
DCI-D, 950ºCDCI-D, 850ºC
DCI-T, 950ºCDCI-T, 850ºC
1.5
3.5
5.5
7.5
9.5
11.5
13.5
1.5 2 2.5 3 3.5
Si C
on
cen
tra
tio
n o
f S
EZ
, W
t.%
Si Content of Cast Iron Matrix, Wt.%1.5
4
6.5
9
11.5
14
1.5 2 2.5 3 3.5
Si C
on
cen
tra
tio
n o
f S
EZ
, W
t.%
Si Content of Cast Iron Matrix, Wt.%
0
50
100
150
200
250
300
350
400
450
500
1 2
GCI-A GCI-S GCI-B DCI-T DCI-D DCI-C
0
50
100
150
200
250
300
350
400
450
500
1 2
GCI-A GCI-S GCI-B DCI-T DCI-D DCI-C
0
50
100
150
200
250
300
350
400
450
500
1 2
GCI-A GCI-S GCI-B DCI-T DCI-D DCI-C
SE
P
wt.%
wt.
%

128
4.3.1.1.3 Concentration Distribution of Alloying Elements
Figure 4.17 show an example of the variation in the concentration of alloying elements in the
intermetallic layers of GCIs (GCI-S, 950°C-1200s-static). Unlike Si, no segregation of other
alloying elements (Cr, Mo, Mn) was detected at the interface between the base alloy and the
intermetallic layer. However, a decrease in the concentration of Cr, Mo and Mn is evident
while moving from the cast iron substrate to the ε-Fe2Al5 phase. K-α X-ray intensity maps,
Figure 4.18, show the distribution of various elements across the DCI-C/ε-Fe2Al5 interface.
The other cast iron alloys also exhibited similar trends of variation in the concentration of
alloying elements. The CS composition used in the present work has only two major alloying
elements, Cr and Mo, which followed a similar trend of elemental concentration to cast irons;
the concentration of Mo and Cr decreased while moving from substrate to ε-Fe2Al5, Figure
4.19.
Figure 4.17 - EDS profiles of various alloying elements across the GCI-S/ε-Fe2Al5 interface
(950°C-1200s-static).
Distance0.00 48.00 µm
Inte
ns
ity
01
2
Mn CrSi CMo
10 μm
ε-Fe2Al5
GCI-S
Sca
nn
ed
are
a
129
Figure 4.18 - K-α X-ray intensity maps of showing distribution of various elements across the
DCI-C/ε-Fe2Al5 interface (950°C-1200s-static), a) BSE image b) Fe, c) Al, d) Si, e) Mn.
(Brighter the colour higher the concentration)
10 μm
SEZ
DCI-C
ε-Fe2Al5
a
b c
ed
SEP
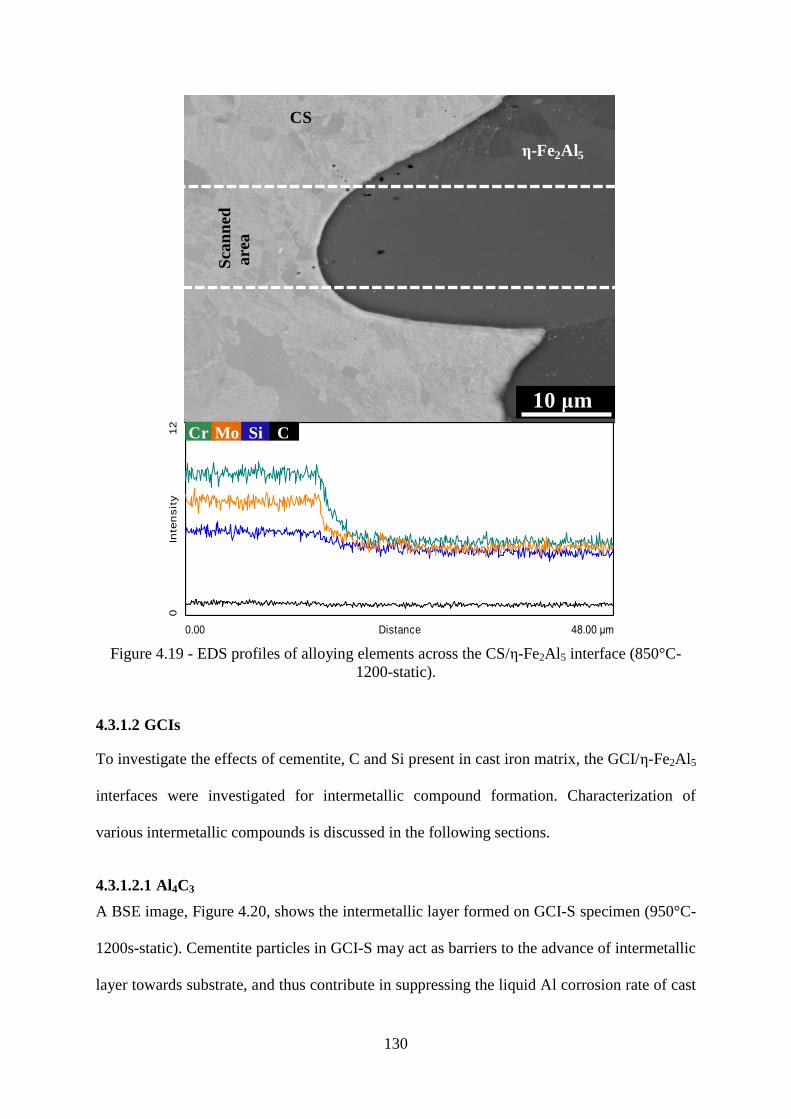
130
Figure 4.19 - EDS profiles of alloying elements across the CS/ε-Fe2Al5 interface (850°C-
1200-static).
4.3.1.2 GCIs
To investigate the effects of cementite, C and Si present in cast iron matrix, the GCI/ε-Fe2Al5
interfaces were investigated for intermetallic compound formation. Characterization of
various intermetallic compounds is discussed in the following sections.
4.3.1.2.1 Al4C3
A BSE image, Figure 4.20, shows the intermetallic layer formed on GCI-S specimen (950°C-
1200s-static). Cementite particles in GCI-S may act as barriers to the advance of intermetallic
layer towards substrate, and thus contribute in suppressing the liquid Al corrosion rate of cast
Distance0.00 48.00 µm
Inte
ns
ity
01
2
Sca
nn
ed
are
a
Cr Si CMo
CS
ε-Fe2Al5
10 μm

131
irons. Figure 4.21 also shows needle-shaped particles of a new phase extending from the
cementite present in the GCI-S matrix, and also found dispersed within the ε-Fe2Al5 phase.
Figure 4.20 - BSE image of the intermetallic layer between GCI-S and Al (950°C-1200s-
static).
In laboratory specimens of GCI-S, the formation this new phase was also found at 750°C and
850°C. EDS detected C and Al in these particles; however, conclusive identification using
EDS or EBSD could not be made owing to their small size (1-5 μm long and 0.1-0.5 μm
thick). The size of the needle-shaped particles was found to increase with increasing
temperature and liquid Al exposure time. To obtain a sufficiently large particle size for phase
identification using EBSD and EDS, the GCI specimens were exposed to static liquid Al at
950°C for 7200s. For this extended time period, there was a significant increase in the size of
these particles, Figure 4.22. The EBSD patterns of these particles were consistently matched
with Al4C3 (Figure 4.23), and the chemical composition detected by EDS was close to Al4C3
(Figure 4.24). In addition to Al4C3, other phases (labelled „A‟, „B‟ and „C‟) in Figure 4.22 -
were detected and characterization of these compounds is discussed in the next section.
(GCI-S)
Solidified Al
ε-Fe2Al5
ζ-FeAl3
Cementite

132
Figure 4.21 - An image of the cementite/ε-Fe2Al5 interface in Figure 4.20 showing the
needle-shaped particles (Al4C3).
Figure 4.22 - Al4C3 particles in the GCI-S specimen (950°C-7200s-static).
ε-Fe2Al5
Needle-shaped particles
Cementite
ε-Fe2Al5
A
B
C
Al4C3
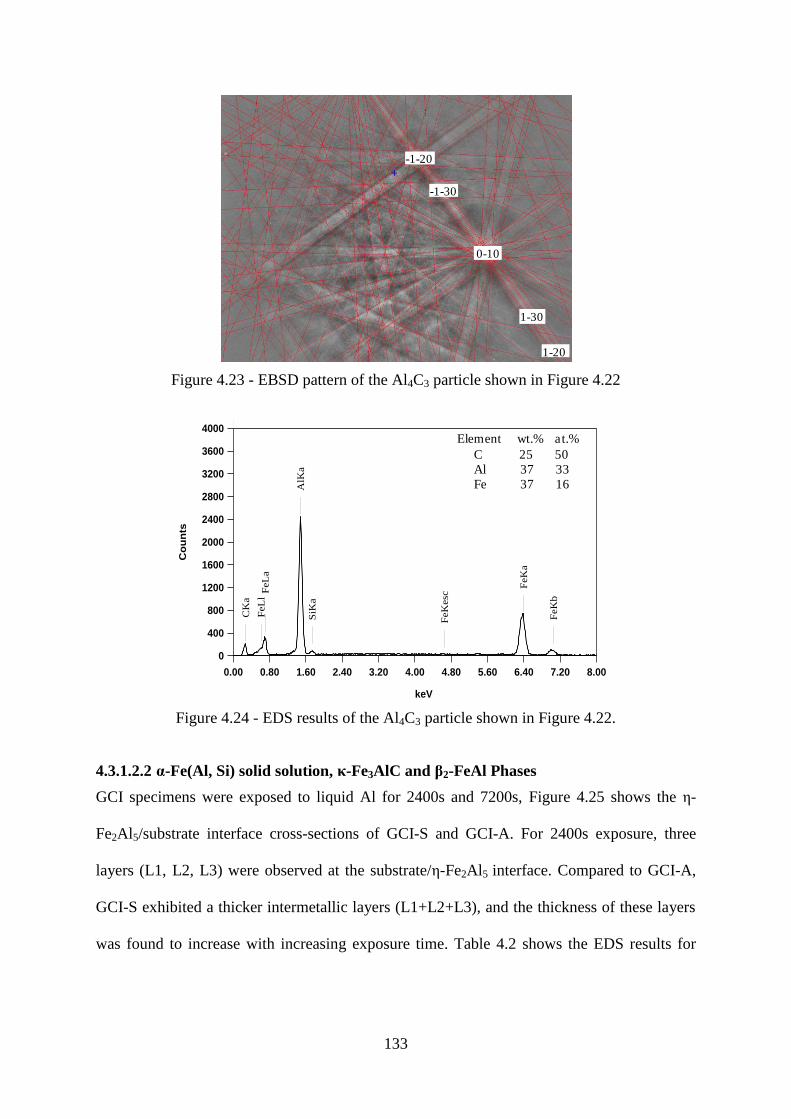
133
Figure 4.23 - EBSD pattern of the Al4C3 particle shown in Figure 4.22
Figure 4.24 - EDS results of the Al4C3 particle shown in Figure 4.22.
4.3.1.2.2 α-Fe(Al, Si) solid solution, κ-Fe3AlC and β2-FeAl Phases
GCI specimens were exposed to liquid Al for 2400s and 7200s, Figure 4.25 shows the ε-
Fe2Al5/substrate interface cross-sections of GCI-S and GCI-A. For 2400s exposure, three
layers (L1, L2, L3) were observed at the substrate/ε-Fe2Al5 interface. Compared to GCI-A,
GCI-S exhibited a thicker intermetallic layers (L1+L2+L3), and the thickness of these layers
was found to increase with increasing exposure time. Table 4.2 shows the EDS results for
-1-20
-1-30
0-10
1-30
1-20
0.00 0.80 1.60 2.40 3.20 4.00 4.80 5.60 6.40 7.20 8.00
keV
079
0
400
800
1200
1600
2000
2400
2800
3200
3600
4000
Co
un
ts
CK
a
AlK
a
SiK
a
FeL
lF
eL
a
FeK
esc
FeK
a
FeK
b
Element wt.% at.%
C 25 50
Al 37 33
Fe 37 16
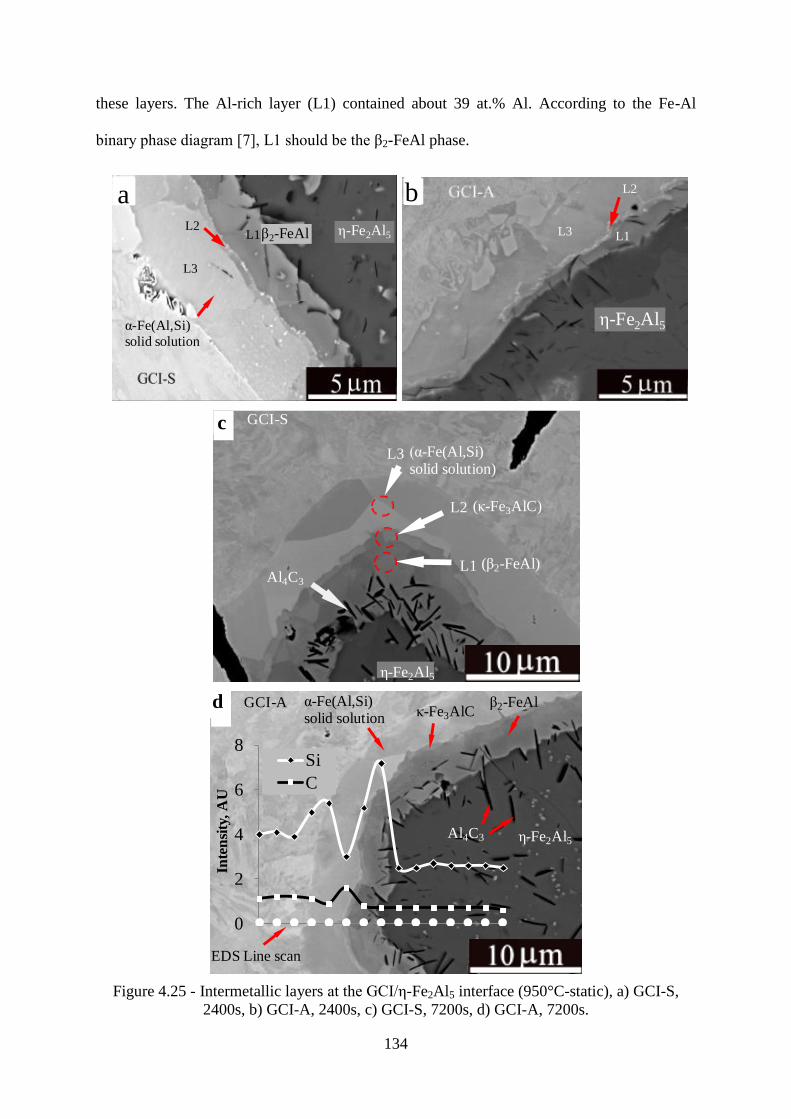
134
these layers. The Al-rich layer (L1) contained about 39 at.% Al. According to the Fe-Al
binary phase diagram [7], L1 should be the β2-FeAl phase.
Figure 4.25 - Intermetallic layers at the GCI/ε-Fe2Al5 interface (950°C-static), a) GCI-S,
2400s, b) GCI-A, 2400s, c) GCI-S, 7200s, d) GCI-A, 7200s.
L3
L2
L1
ε-Fe2Al5
b
L3
L2L1 ε-Fe2Al5β2-FeAl
a
L3
L2L1
L3
L2L1
α-Fe(Al,Si)
solid solution
L1
L2
L3
cGCI-Sc
ε-Fe2Al5
Al4C3
(α-Fe(Al,Si)solid solution)
(κ-Fe3AlC)
(β2-FeAl)
0
2
4
6
8
Inte
nsi
ty,
AU
Si
C
α-Fe(Al,Si)solid solution
β2-FeAl
ε-Fe2Al5
GCI-A
Al4C3
d
EDS Line scan
κ-Fe3AlC
d
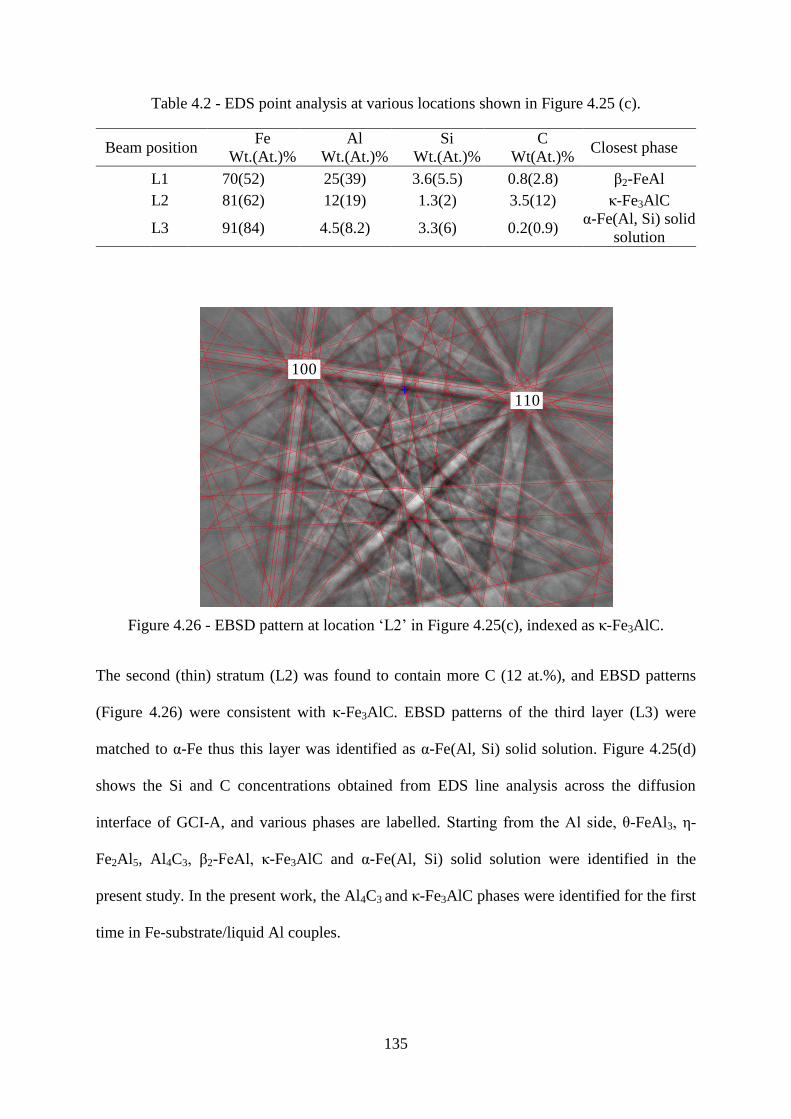
135
Table 4.2 - EDS point analysis at various locations shown in Figure 4.25 (c).
Beam position Fe
Wt.(At.)%
Al
Wt.(At.)%
Si
Wt.(At.)%
C
Wt(At.)% Closest phase
L1 70(52) 25(39) 3.6(5.5) 0.8(2.8) β2-FeAl
L2 81(62) 12(19) 1.3(2) 3.5(12) κ-Fe3AlC
L3 91(84) 4.5(8.2) 3.3(6) 0.2(0.9) α-Fe(Al, Si) solid
solution
Figure 4.26 - EBSD pattern at location „L2‟ in Figure 4.25(c), indexed as κ-Fe3AlC.
The second (thin) stratum (L2) was found to contain more C (12 at.%), and EBSD patterns
(Figure 4.26) were consistent with κ-Fe3AlC. EBSD patterns of the third layer (L3) were
matched to α-Fe thus this layer was identified as α-Fe(Al, Si) solid solution. Figure 4.25(d)
shows the Si and C concentrations obtained from EDS line analysis across the diffusion
interface of GCI-A, and various phases are labelled. Starting from the Al side, ζ-FeAl3, ε-
Fe2Al5, Al4C3, β2-FeAl, κ-Fe3AlC and α-Fe(Al, Si) solid solution were identified in the
present study. In the present work, the Al4C3 and κ-Fe3AlC phases were identified for the first
time in Fe-substrate/liquid Al couples.
100
110
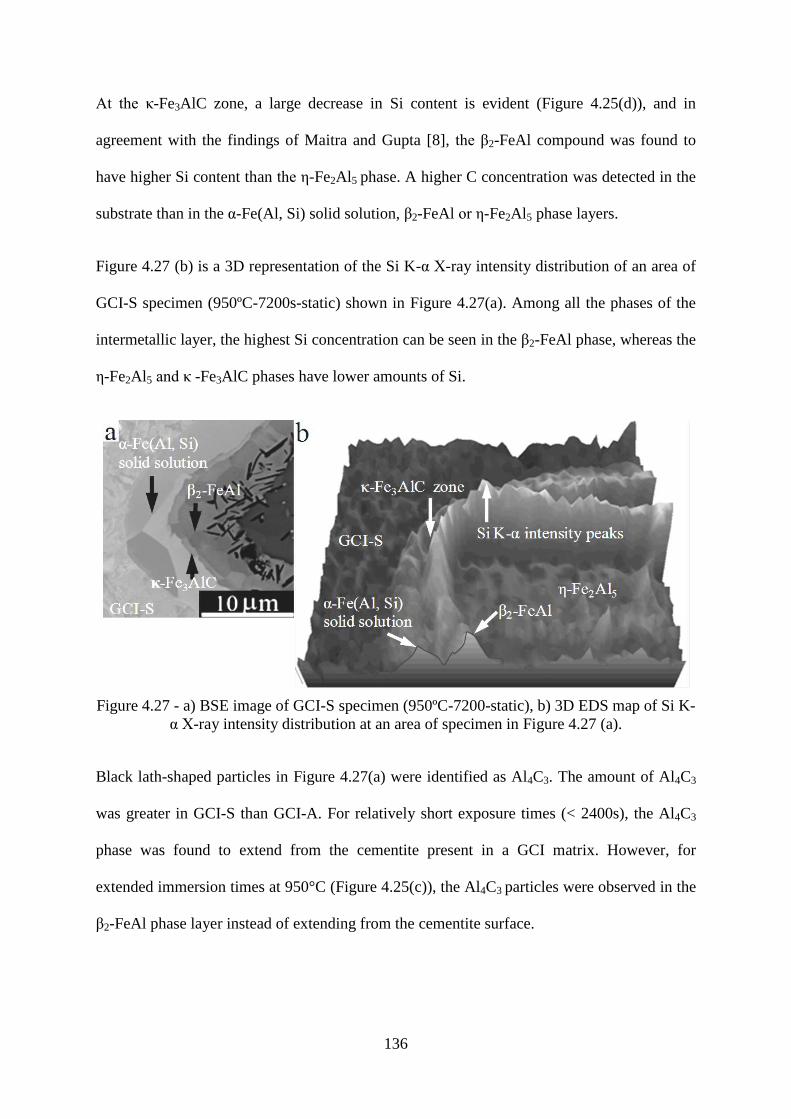
136
At the κ-Fe3AlC zone, a large decrease in Si content is evident (Figure 4.25(d)), and in
agreement with the findings of Maitra and Gupta [8], the β2-FeAl compound was found to
have higher Si content than the ε-Fe2Al5 phase. A higher C concentration was detected in the
substrate than in the α-Fe(Al, Si) solid solution, β2-FeAl or ε-Fe2Al5 phase layers.
Figure 4.27 (b) is a 3D representation of the Si K-α X-ray intensity distribution of an area of
GCI-S specimen (950ºC-7200s-static) shown in Figure 4.27(a). Among all the phases of the
intermetallic layer, the highest Si concentration can be seen in the β2-FeAl phase, whereas the
ε-Fe2Al5 and κ -Fe3AlC phases have lower amounts of Si.
Figure 4.27 - a) BSE image of GCI-S specimen (950ºC-7200-static), b) 3D EDS map of Si K-
α X-ray intensity distribution at an area of specimen in Figure 4.27 (a).
Black lath-shaped particles in Figure 4.27(a) were identified as Al4C3. The amount of Al4C3
was greater in GCI-S than GCI-A. For relatively short exposure times (< 2400s), the Al4C3
phase was found to extend from the cementite present in a GCI matrix. However, for
extended immersion times at 950°C (Figure 4.25(c)), the Al4C3 particles were observed in the
β2-FeAl phase layer instead of extending from the cementite surface.
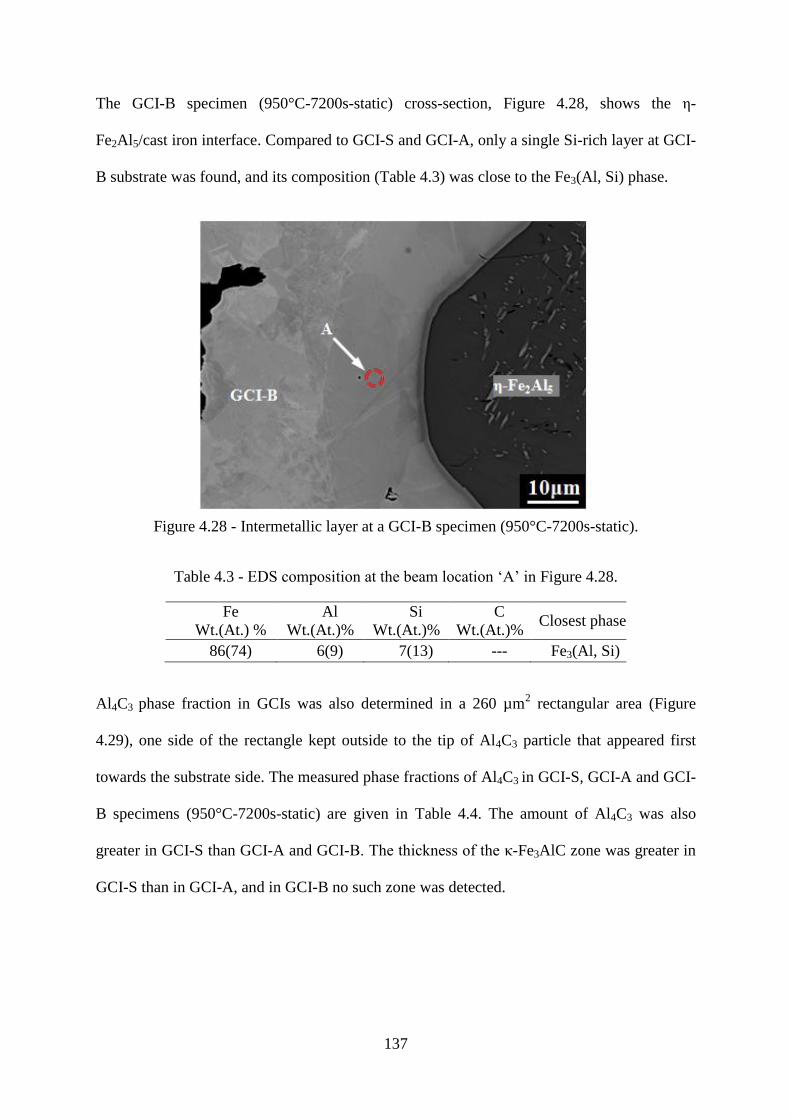
137
The GCI-B specimen (950°C-7200s-static) cross-section, Figure 4.28, shows the ε-
Fe2Al5/cast iron interface. Compared to GCI-S and GCI-A, only a single Si-rich layer at GCI-
B substrate was found, and its composition (Table 4.3) was close to the Fe3(Al, Si) phase.
Figure 4.28 - Intermetallic layer at a GCI-B specimen (950°C-7200s-static).
Table 4.3 - EDS composition at the beam location „A‟ in Figure 4.28.
Fe
Wt.(At.) %
Al
Wt.(At.)%
Si
Wt.(At.)%
C
Wt.(At.)% Closest phase
86(74) 6(9) 7(13) --- Fe3(Al, Si)
Al4C3 phase fraction in GCIs was also determined in a 260 µm2 rectangular area (Figure
4.29), one side of the rectangle kept outside to the tip of Al4C3 particle that appeared first
towards the substrate side. The measured phase fractions of Al4C3 in GCI-S, GCI-A and GCI-
B specimens (950°C-7200s-static) are given in Table 4.4. The amount of Al4C3 was also
greater in GCI-S than GCI-A and GCI-B. The thickness of the κ-Fe3AlC zone was greater in
GCI-S than in GCI-A, and in GCI-B no such zone was detected.
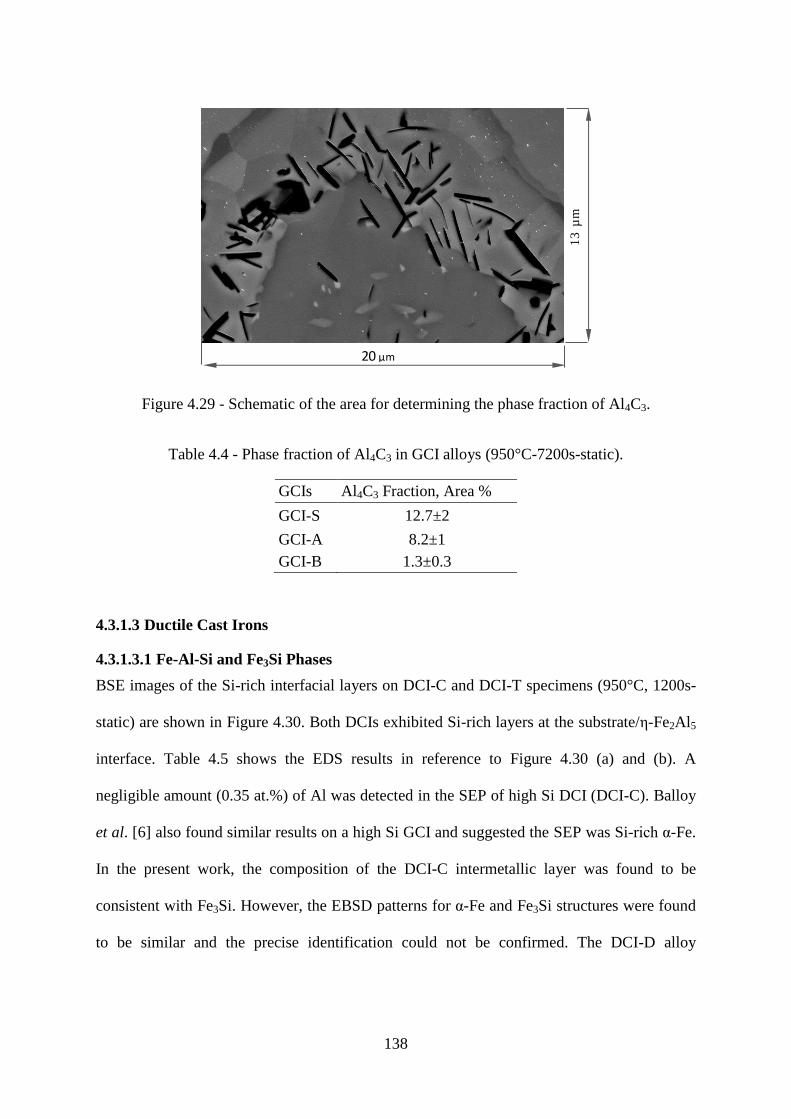
138
Figure 4.29 - Schematic of the area for determining the phase fraction of Al4C3.
Table 4.4 - Phase fraction of Al4C3 in GCI alloys (950°C-7200s-static).
GCIs Al4C3 Fraction, Area %
GCI-S 12.7±2
GCI-A 8.2±1
GCI-B 1.3±0.3
4.3.1.3 Ductile Cast Irons
4.3.1.3.1 Fe-Al-Si and Fe3Si Phases
BSE images of the Si-rich interfacial layers on DCI-C and DCI-T specimens (950°C, 1200s-
static) are shown in Figure 4.30. Both DCIs exhibited Si-rich layers at the substrate/ε-Fe2Al5
interface. Table 4.5 shows the EDS results in reference to Figure 4.30 (a) and (b). A
negligible amount (0.35 at.%) of Al was detected in the SEP of high Si DCI (DCI-C). Balloy
et al. [6] also found similar results on a high Si GCI and suggested the SEP was Si-rich α-Fe.
In the present work, the composition of the DCI-C intermetallic layer was found to be
consistent with Fe3Si. However, the EBSD patterns for α-Fe and Fe3Si structures were found
to be similar and the precise identification could not be confirmed. The DCI-D alloy
13
µm
20 µm
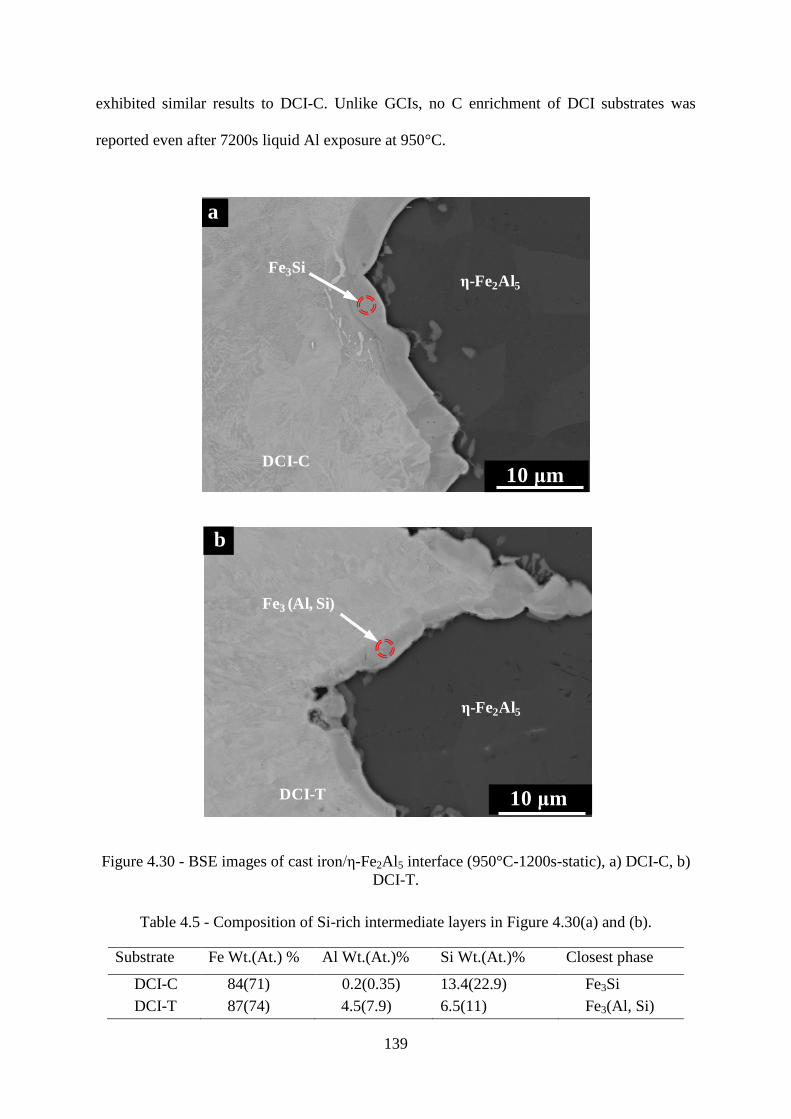
139
exhibited similar results to DCI-C. Unlike GCIs, no C enrichment of DCI substrates was
reported even after 7200s liquid Al exposure at 950°C.
Figure 4.30 - BSE images of cast iron/ε-Fe2Al5 interface (950°C-1200s-static), a) DCI-C, b)
DCI-T.
Table 4.5 - Composition of Si-rich intermediate layers in Figure 4.30(a) and (b).
Substrate Fe Wt.(At.) % Al Wt.(At.)% Si Wt.(At.)% Closest phase
DCI-C 84(71) 0.2(0.35) 13.4(22.9) Fe3Si
DCI-T 87(74) 4.5(7.9) 6.5(11) Fe3(Al, Si)
10 μm
Fe3Si
DCI-C
ε-Fe2Al5
a
10 μm
Fe3 (Al, Si)
DCI-T
b
ε-Fe2Al5
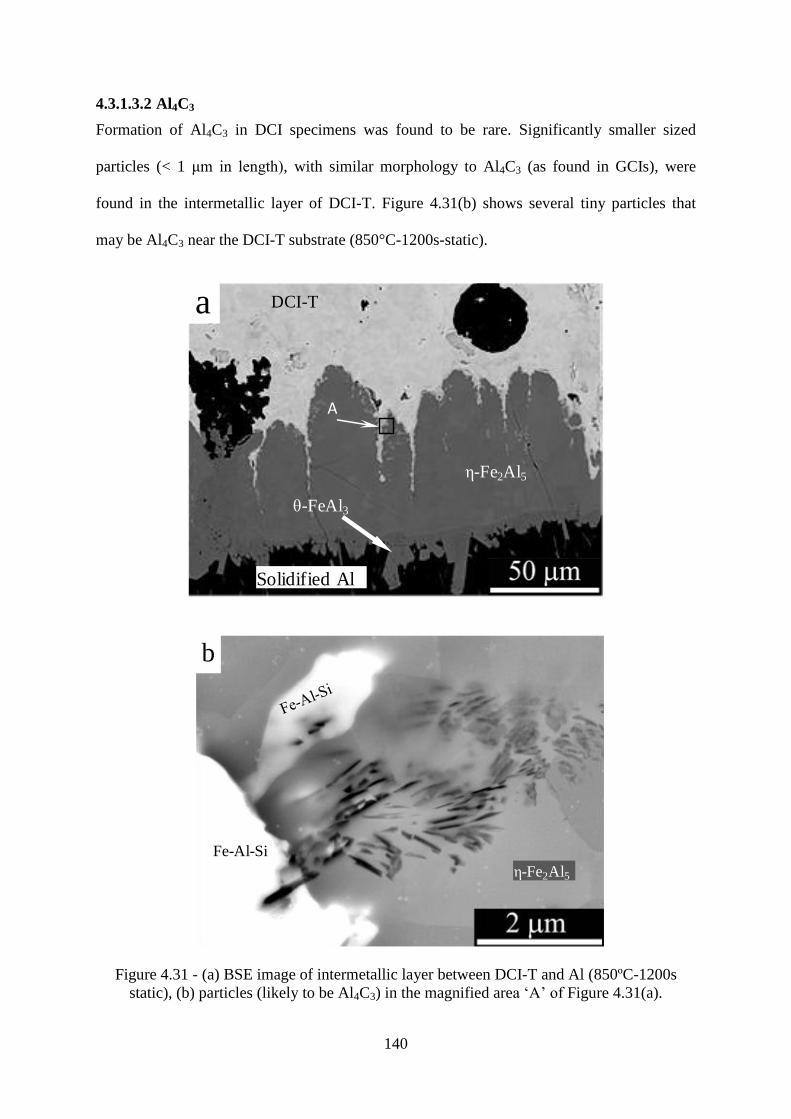
140
4.3.1.3.2 Al4C3
Formation of Al4C3 in DCI specimens was found to be rare. Significantly smaller sized
particles (< 1 μm in length), with similar morphology to Al4C3 (as found in GCIs), were
found in the intermetallic layer of DCI-T. Figure 4.31(b) shows several tiny particles that
may be Al4C3 near the DCI-T substrate (850°C-1200s-static).
Figure 4.31 - (a) BSE image of intermetallic layer between DCI-T and Al (850ºC-1200s
static), (b) particles (likely to be Al4C3) in the magnified area „A‟ of Figure 4.31(a).
A
a DCI-T
ε-Fe2Al5
ζ-FeAl3
Solidified Al
a
b
Fe-Al-Si
ε-Fe2Al5
b
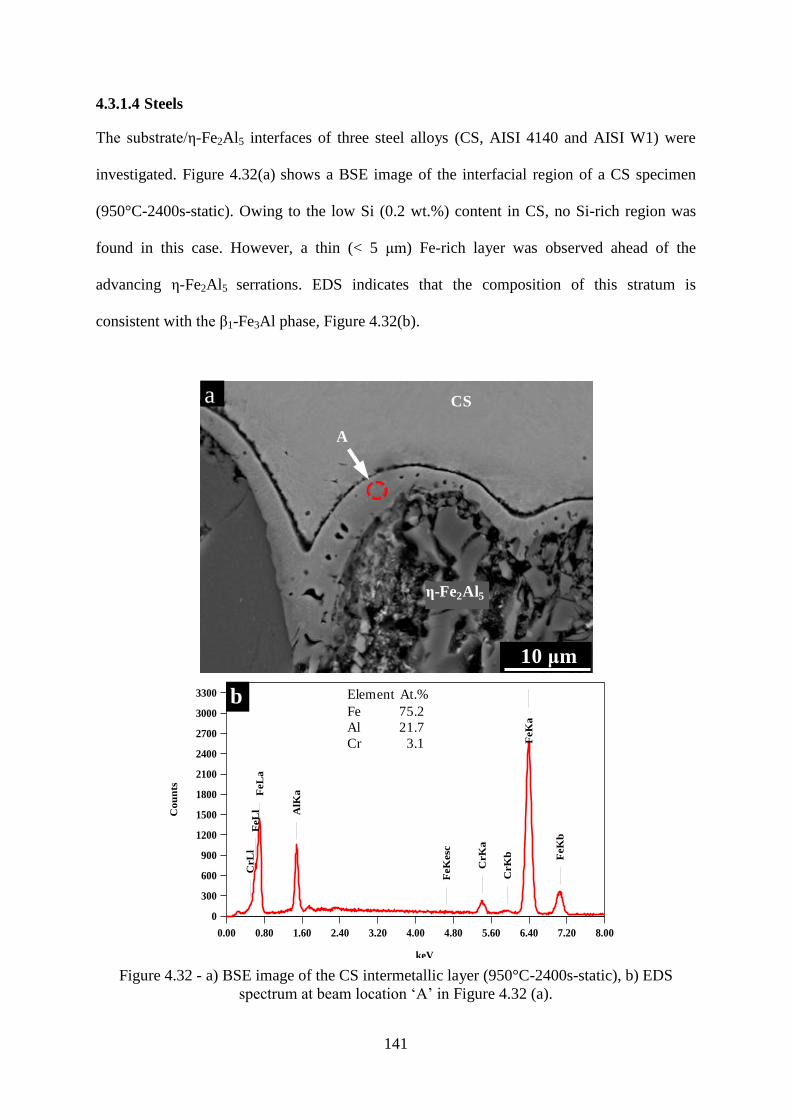
141
4.3.1.4 Steels
The substrate/ε-Fe2Al5 interfaces of three steel alloys (CS, AISI 4140 and AISI W1) were
investigated. Figure 4.32(a) shows a BSE image of the interfacial region of a CS specimen
(950°C-2400s-static). Owing to the low Si (0.2 wt.%) content in CS, no Si-rich region was
found in this case. However, a thin (< 5 μm) Fe-rich layer was observed ahead of the
advancing ε-Fe2Al5 serrations. EDS indicates that the composition of this stratum is
consistent with the β1-Fe3Al phase, Figure 4.32(b).
Figure 4.32 - a) BSE image of the CS intermetallic layer (950°C-2400s-static), b) EDS
spectrum at beam location „A‟ in Figure 4.32 (a).
A
CS
ε-Fe2Al5
10 μm
a
0.00 0.80 1.60 2.40 3.20 4.00 4.80 5.60 6.40 7.20 8.00
keV
0
300
600
900
1200
1500
1800
2100
2400
2700
3000
3300
Cou
nts
AlK
a
CrL
l
CrK
a
CrK
b
FeL
lF
eL
a
FeK
esc
FeK
a
FeK
b
Element At.%
Fe 75.2
Al 21.7
Cr 3.1
b
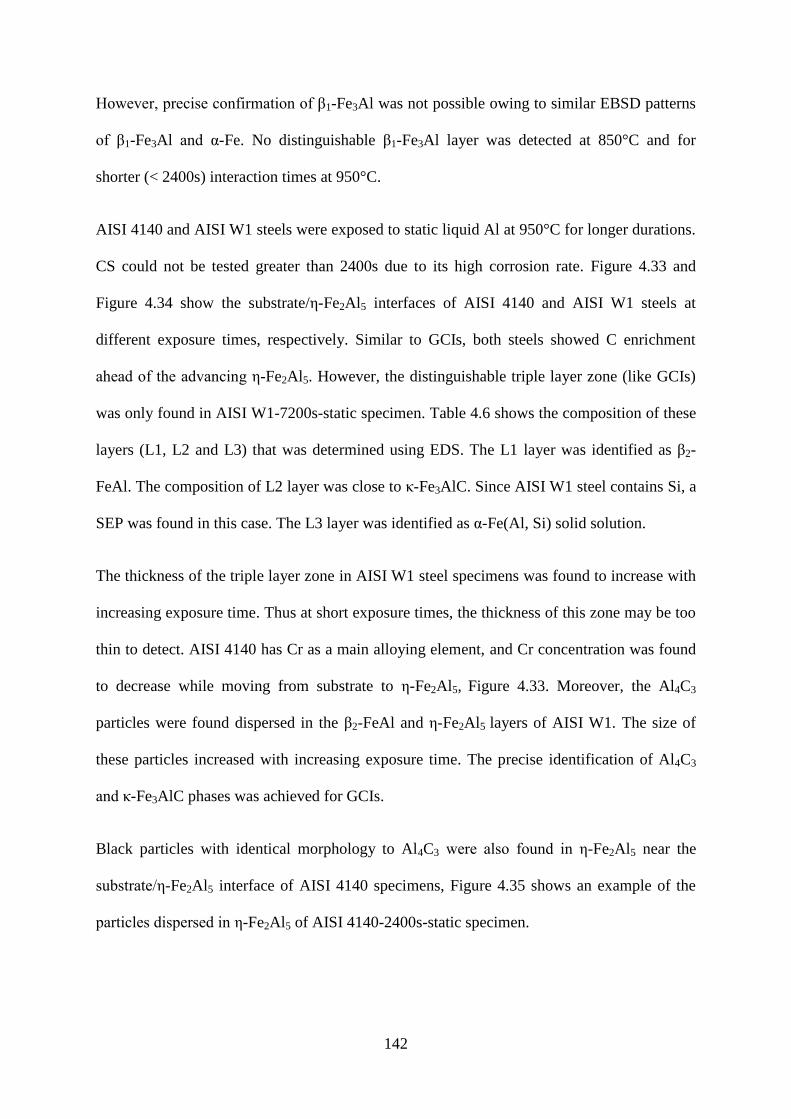
142
However, precise confirmation of β1-Fe3Al was not possible owing to similar EBSD patterns
of β1-Fe3Al and α-Fe. No distinguishable β1-Fe3Al layer was detected at 850°C and for
shorter (< 2400s) interaction times at 950°C.
AISI 4140 and AISI W1 steels were exposed to static liquid Al at 950°C for longer durations.
CS could not be tested greater than 2400s due to its high corrosion rate. Figure 4.33 and
Figure 4.34 show the substrate/ε-Fe2Al5 interfaces of AISI 4140 and AISI W1 steels at
different exposure times, respectively. Similar to GCIs, both steels showed C enrichment
ahead of the advancing ε-Fe2Al5. However, the distinguishable triple layer zone (like GCIs)
was only found in AISI W1-7200s-static specimen. Table 4.6 shows the composition of these
layers (L1, L2 and L3) that was determined using EDS. The L1 layer was identified as β2-
FeAl. The composition of L2 layer was close to κ-Fe3AlC. Since AISI W1 steel contains Si, a
SEP was found in this case. The L3 layer was identified as α-Fe(Al, Si) solid solution.
The thickness of the triple layer zone in AISI W1 steel specimens was found to increase with
increasing exposure time. Thus at short exposure times, the thickness of this zone may be too
thin to detect. AISI 4140 has Cr as a main alloying element, and Cr concentration was found
to decrease while moving from substrate to ε-Fe2Al5, Figure 4.33. Moreover, the Al4C3
particles were found dispersed in the β2-FeAl and ε-Fe2Al5 layers of AISI W1. The size of
these particles increased with increasing exposure time. The precise identification of Al4C3
and κ-Fe3AlC phases was achieved for GCIs.
Black particles with identical morphology to Al4C3 were also found in ε-Fe2Al5 near the
substrate/ε-Fe2Al5 interface of AISI 4140 specimens, Figure 4.35 shows an example of the
particles dispersed in ε-Fe2Al5 of AISI 4140-2400s-static specimen.
143
Figure 4.33 - BSE images showing EDS scan locations on substrate/ε-Fe2Al5 interfaces of
AISI-4140 specimens, a) 950°C-2400s-static and b) 950°C-7200s-static.
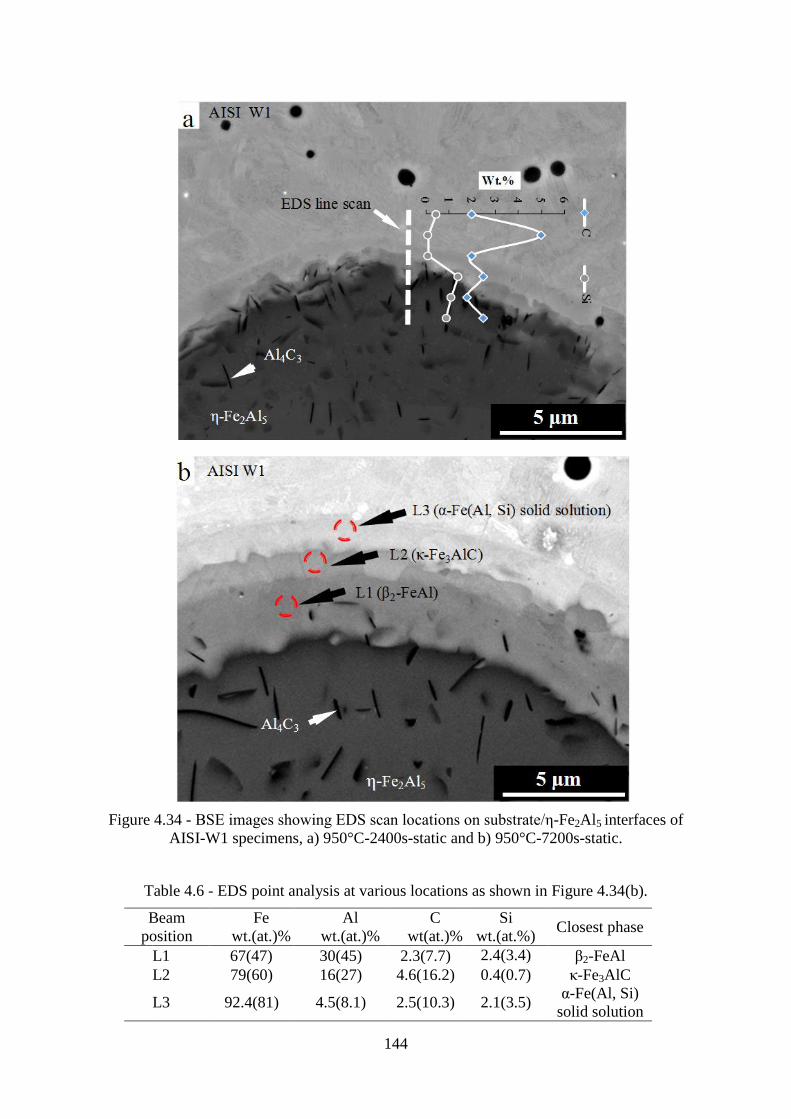
144
Figure 4.34 - BSE images showing EDS scan locations on substrate/ε-Fe2Al5 interfaces of
AISI-W1 specimens, a) 950°C-2400s-static and b) 950°C-7200s-static.
Table 4.6 - EDS point analysis at various locations as shown in Figure 4.34(b).
Beam
position
Fe
wt.(at.)%
Al
wt.(at.)%
C
wt(at.)%
Si
wt.(at.%) Closest phase
L1 67(47) 30(45) 2.3(7.7) 2.4(3.4) β2-FeAl
L2 79(60) 16(27) 4.6(16.2) 0.4(0.7) κ-Fe3AlC
L3 92.4(81) 4.5(8.1) 2.5(10.3) 2.1(3.5) α-Fe(Al, Si)
solid solution
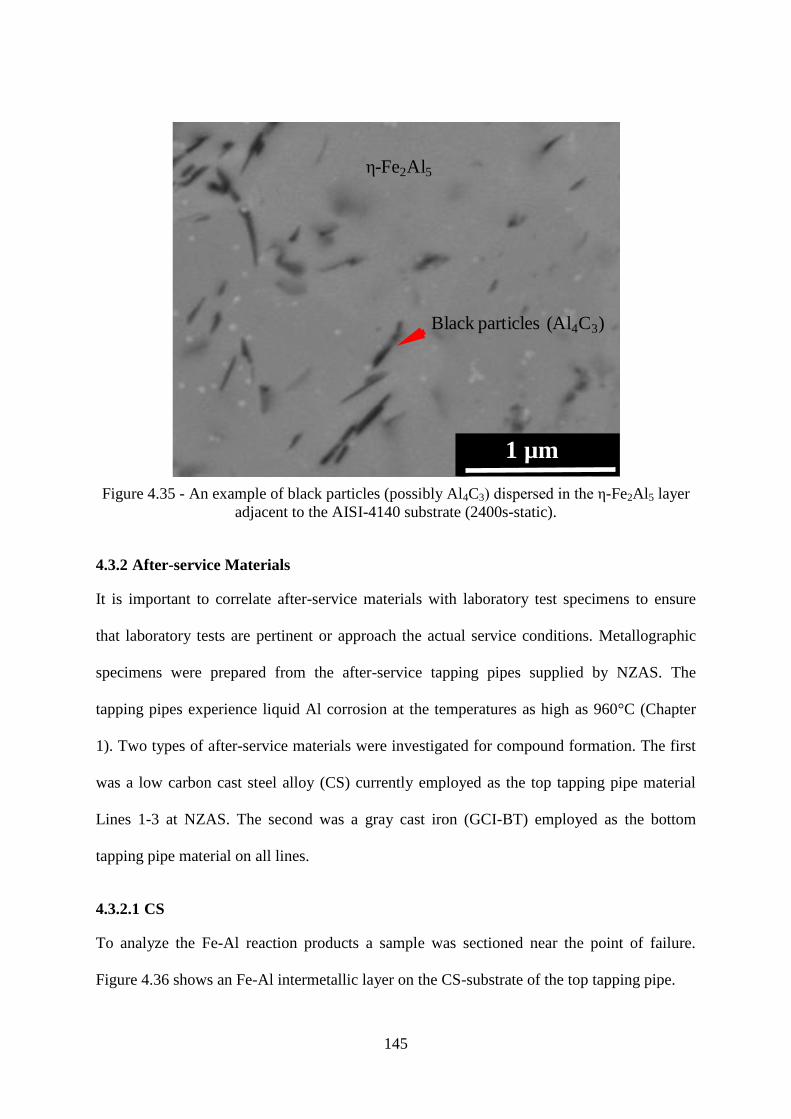
145
Figure 4.35 - An example of black particles (possibly Al4C3) dispersed in the ε-Fe2Al5 layer
adjacent to the AISI-4140 substrate (2400s-static).
4.3.2 After-service Materials
It is important to correlate after-service materials with laboratory test specimens to ensure
that laboratory tests are pertinent or approach the actual service conditions. Metallographic
specimens were prepared from the after-service tapping pipes supplied by NZAS. The
tapping pipes experience liquid Al corrosion at the temperatures as high as 960°C (Chapter
1). Two types of after-service materials were investigated for compound formation. The first
was a low carbon cast steel alloy (CS) currently employed as the top tapping pipe material
Lines 1-3 at NZAS. The second was a gray cast iron (GCI-BT) employed as the bottom
tapping pipe material on all lines.
4.3.2.1 CS
To analyze the Fe-Al reaction products a sample was sectioned near the point of failure.
Figure 4.36 shows an Fe-Al intermetallic layer on the CS-substrate of the top tapping pipe.
1 µm
ε-Fe2Al5
Black particles (Al4C3)
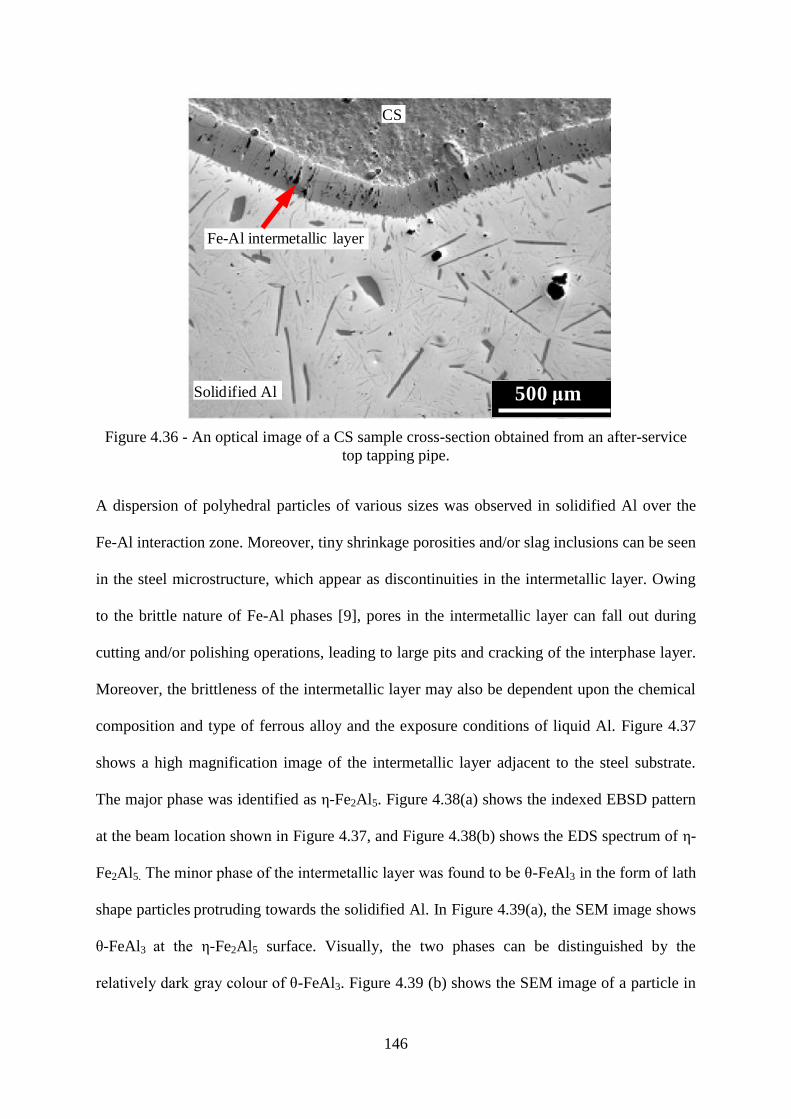
146
Figure 4.36 - An optical image of a CS sample cross-section obtained from an after-service
top tapping pipe.
A dispersion of polyhedral particles of various sizes was observed in solidified Al over the
Fe-Al interaction zone. Moreover, tiny shrinkage porosities and/or slag inclusions can be seen
in the steel microstructure, which appear as discontinuities in the intermetallic layer. Owing
to the brittle nature of Fe-Al phases [9], pores in the intermetallic layer can fall out during
cutting and/or polishing operations, leading to large pits and cracking of the interphase layer.
Moreover, the brittleness of the intermetallic layer may also be dependent upon the chemical
composition and type of ferrous alloy and the exposure conditions of liquid Al. Figure 4.37
shows a high magnification image of the intermetallic layer adjacent to the steel substrate.
The major phase was identified as ε-Fe2Al5. Figure 4.38(a) shows the indexed EBSD pattern
at the beam location shown in Figure 4.37, and Figure 4.38(b) shows the EDS spectrum of ε-
Fe2Al5. The minor phase of the intermetallic layer was found to be ζ-FeAl3 in the form of lath
shape particles protruding towards the solidified Al. In Figure 4.39(a), the SEM image shows
ζ-FeAl3 at the ε-Fe2Al5 surface. Visually, the two phases can be distinguished by the
relatively dark gray colour of ζ-FeAl3. Figure 4.39 (b) shows the SEM image of a particle in
CS
Fe-Al intermetallic layer
Solidified Al 500 μm
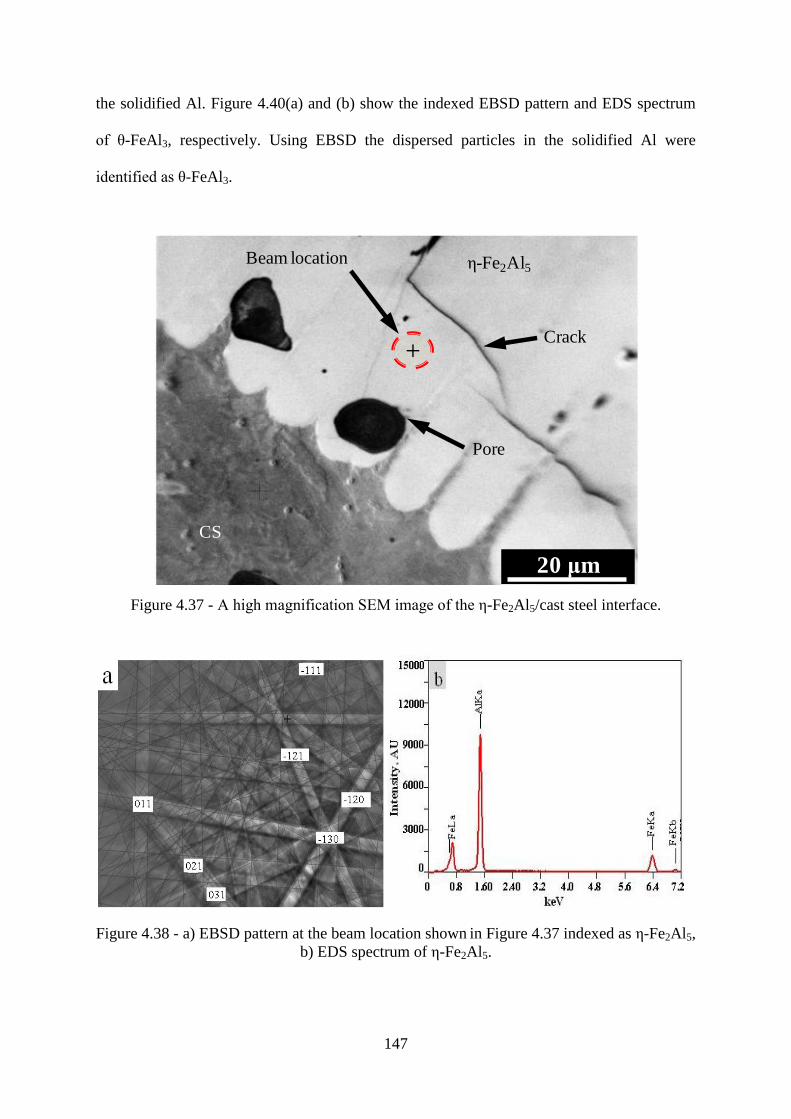
147
the solidified Al. Figure 4.40(a) and (b) show the indexed EBSD pattern and EDS spectrum
of ζ-FeAl3, respectively. Using EBSD the dispersed particles in the solidified Al were
identified as ζ-FeAl3.
Figure 4.37 - A high magnification SEM image of the ε-Fe2Al5/cast steel interface.
Figure 4.38 - a) EBSD pattern at the beam location shown in Figure 4.37 indexed as ε-Fe2Al5, b) EDS spectrum of ε-Fe2Al5.
20 μm
ε-Fe2Al5
CS
Pore
Beam location
Crack+
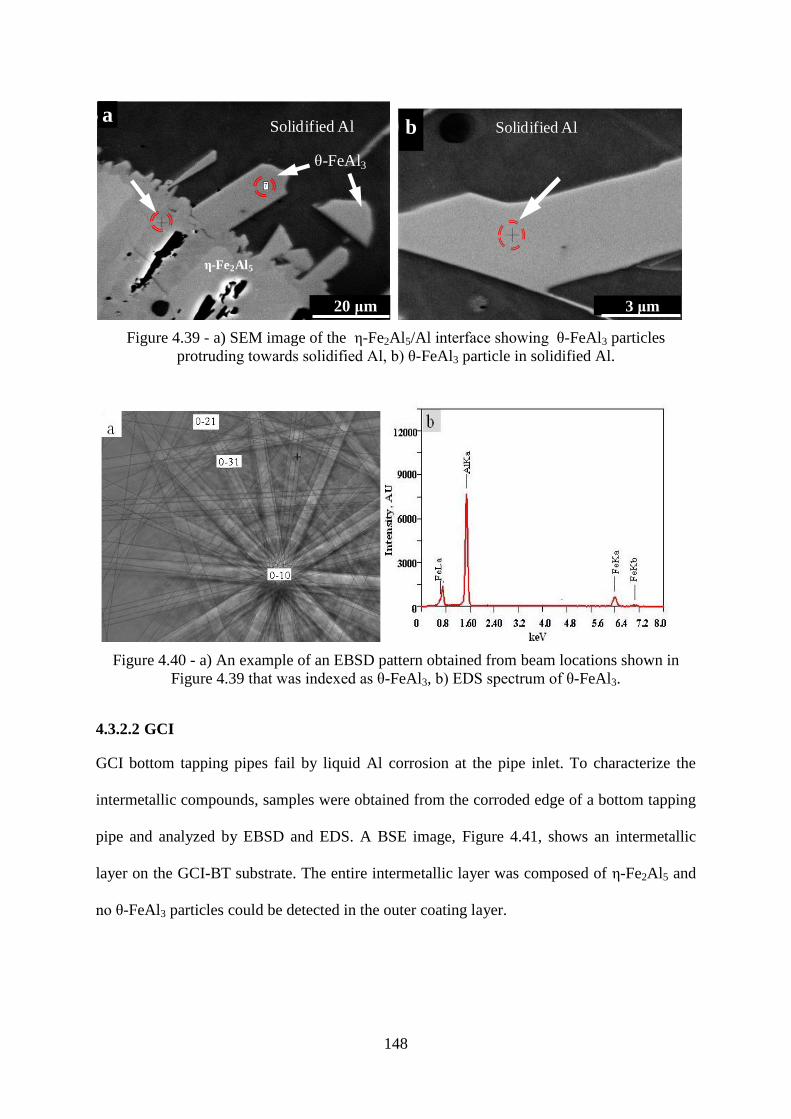
148
Figure 4.39 - a) SEM image of the ε-Fe2Al5/Al interface showing ζ-FeAl3 particles
protruding towards solidified Al, b) ζ-FeAl3 particle in solidified Al.
Figure 4.40 - a) An example of an EBSD pattern obtained from beam locations shown in
Figure 4.39 that was indexed as ζ-FeAl3, b) EDS spectrum of ζ-FeAl3.
4.3.2.2 GCI
GCI bottom tapping pipes fail by liquid Al corrosion at the pipe inlet. To characterize the
intermetallic compounds, samples were obtained from the corroded edge of a bottom tapping
pipe and analyzed by EBSD and EDS. A BSE image, Figure 4.41, shows an intermetallic
layer on the GCI-BT substrate. The entire intermetallic layer was composed of ε-Fe2Al5 and
no ζ-FeAl3 particles could be detected in the outer coating layer.
20 μm
a
ε-Fe2Al5
ζ-FeAl3
Solidified Al
20 μm
ab Solidified Al
3 μm

149
Figure 4.41 - BSE image of the region of interaction between GCI-BT and the liquid Al bath.
Figure 4.42(a) shows an optical image of the GCI-BT/ε-Fe2Al5 interface. A distinguishable
thin (approximately 8 μm) layer was found ahead of the ε-Fe2Al5 columns. Tiny black lath-
shaped particles were also found dispersed in this thin layer with maximum dimensions of 10
µm by 1.5 µm. EDS detected (Figure 4.43) about 40 at.% Al in the thin layer comprising the
lath shape particles. According to the Fe-Al binary phase diagram [7], this phase should be
the β2-FeAl phase. The EBSD patterns of β2-FeAl and α-Fe were found to be identical.
Therefore, on the basis of compositional analysis this layer was characterized as β2-FeAl.
Small gray regions having composition close to β2-FeAl were also found within the ε-Fe2Al5
phase, Figure 4.42(a). The lath-shaped black particles in the β2-FeAl layer were characterized
by EBSD and EDS as Al4C3. Figure 4.42(b) shows the morphology of an Al4C3 particle and
the EBSD and EDS results are given in Figure 4.44. The crystallographic data of Al4C3 for
EBSD characterization was taken from [5].
200 μm
ε-Fe2Al5
Solidified bath
Gray cast iron

150
Figure 4.42 - a) An optical image of GCI-BT/ε-Fe2Al5 interface, b) SEM image of a lath-
shaped particle in a matrix of β2-FeAl.
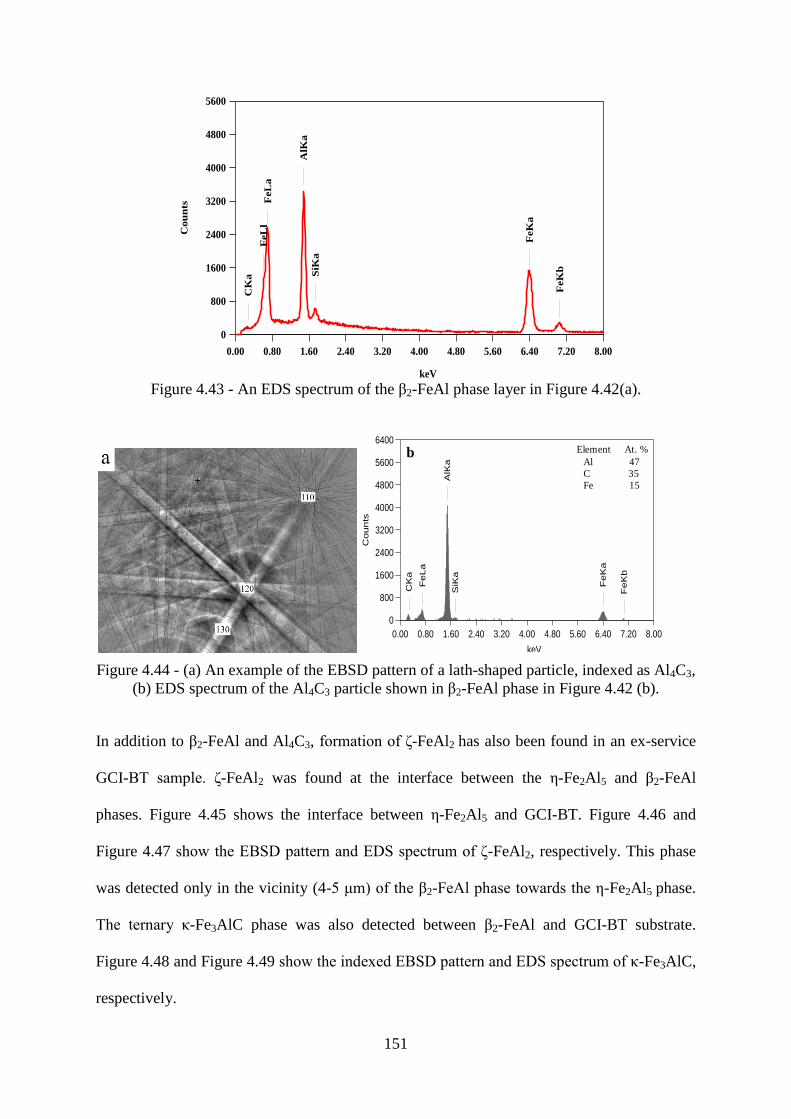
151
Figure 4.43 - An EDS spectrum of the β2-FeAl phase layer in Figure 4.42(a).
Figure 4.44 - (a) An example of the EBSD pattern of a lath-shaped particle, indexed as Al4C3,
(b) EDS spectrum of the Al4C3 particle shown in β2-FeAl phase in Figure 4.42 (b).
In addition to β2-FeAl and Al4C3, formation of δ-FeAl2 has also been found in an ex-service
GCI-BT sample. δ-FeAl2 was found at the interface between the ε-Fe2Al5 and β2-FeAl
phases. Figure 4.45 shows the interface between ε-Fe2Al5 and GCI-BT. Figure 4.46 and
Figure 4.47 show the EBSD pattern and EDS spectrum of δ-FeAl2, respectively. This phase
was detected only in the vicinity (4-5 μm) of the β2-FeAl phase towards the ε-Fe2Al5 phase.
The ternary κ-Fe3AlC phase was also detected between β2-FeAl and GCI-BT substrate.
Figure 4.48 and Figure 4.49 show the indexed EBSD pattern and EDS spectrum of κ-Fe3AlC,
respectively.
0.00 0.80 1.60 2.40 3.20 4.00 4.80 5.60 6.40 7.20 8.00
keV
0
800
1600
2400
3200
4000
4800
5600
Cou
nts
CK
a
AlK
a
SiK
a
FeL
lF
eL
a
FeK
a
FeK
b
0.00 0.80 1.60 2.40 3.20 4.00 4.80 5.60 6.40 7.20 8.00
keV
0
800
1600
2400
3200
4000
4800
5600
6400
Counts
CK
a
AlK
aS
iKa
FeLa
FeK
a
FeK
b
Element At. %
Al 47
C 35
Fe 15
b
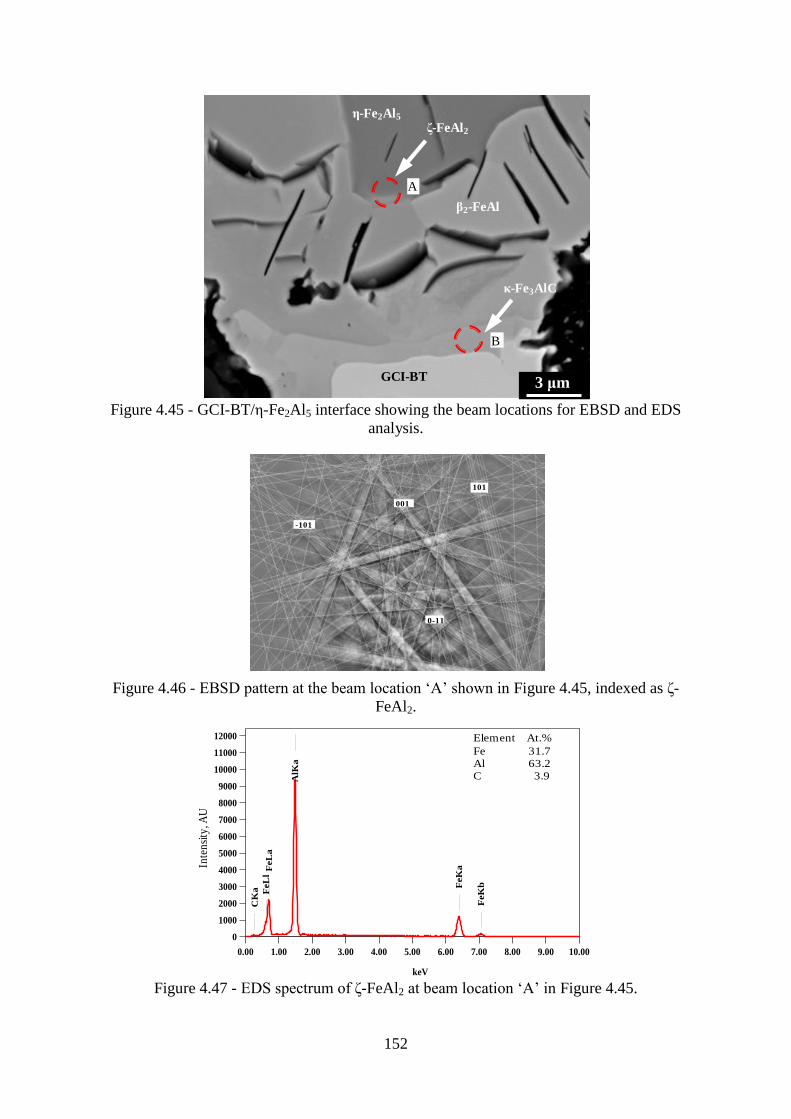
152
Figure 4.45 - GCI-BT/ε-Fe2Al5 interface showing the beam locations for EBSD and EDS
analysis.
Figure 4.46 - EBSD pattern at the beam location „A‟ shown in Figure 4.45, indexed as δ-
FeAl2.
Figure 4.47 - EDS spectrum of δ-FeAl2 at beam location „A‟ in Figure 4.45.
β2-FeAl
GCI-BT
δ-FeAl2
κ-Fe3AlC
3 μm
ε-Fe2Al5
A
B
001
101
-101
0-11
0.00 1.00 2.00 3.00 4.00 5.00 6.00 7.00 8.00 9.00 10.00
keV
0
1000
2000
3000
4000
5000
6000
7000
8000
9000
10000
11000
12000
Co
un
ts
CK
a
AlK
aS
iKa
FeL
lF
eL
a
FeK
a
FeK
b
c Element At.%
Fe 31.7
Al 63.2
C 3.9
Inte
nsi
ty, A
U
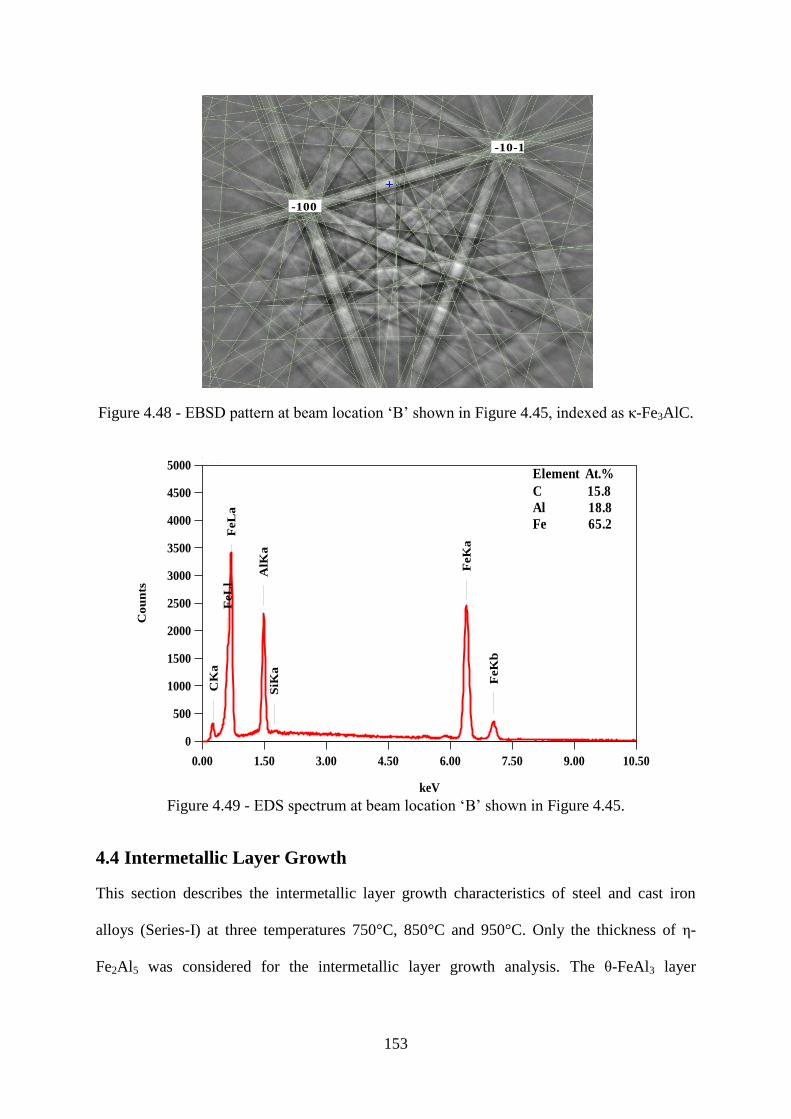
153
Figure 4.48 - EBSD pattern at beam location „B‟ shown in Figure 4.45, indexed as κ-Fe3AlC.
Figure 4.49 - EDS spectrum at beam location „B‟ shown in Figure 4.45.
4.4 Intermetallic Layer Growth
This section describes the intermetallic layer growth characteristics of steel and cast iron
alloys (Series-I) at three temperatures 750°C, 850°C and 950°C. Only the thickness of ε-
Fe2Al5 was considered for the intermetallic layer growth analysis. The ζ-FeAl3 layer
-100
-10-1
0.00 1.50 3.00 4.50 6.00 7.50 9.00 10.50
keV
006
0
500
1000
1500
2000
2500
3000
3500
4000
4500
5000
Co
un
ts
CK
a
AlK
aS
iKa
FeL
lF
eL
a
FeK
a
FeK
b
Element At.%
C 15.8
Al 18.8
Fe 65.2
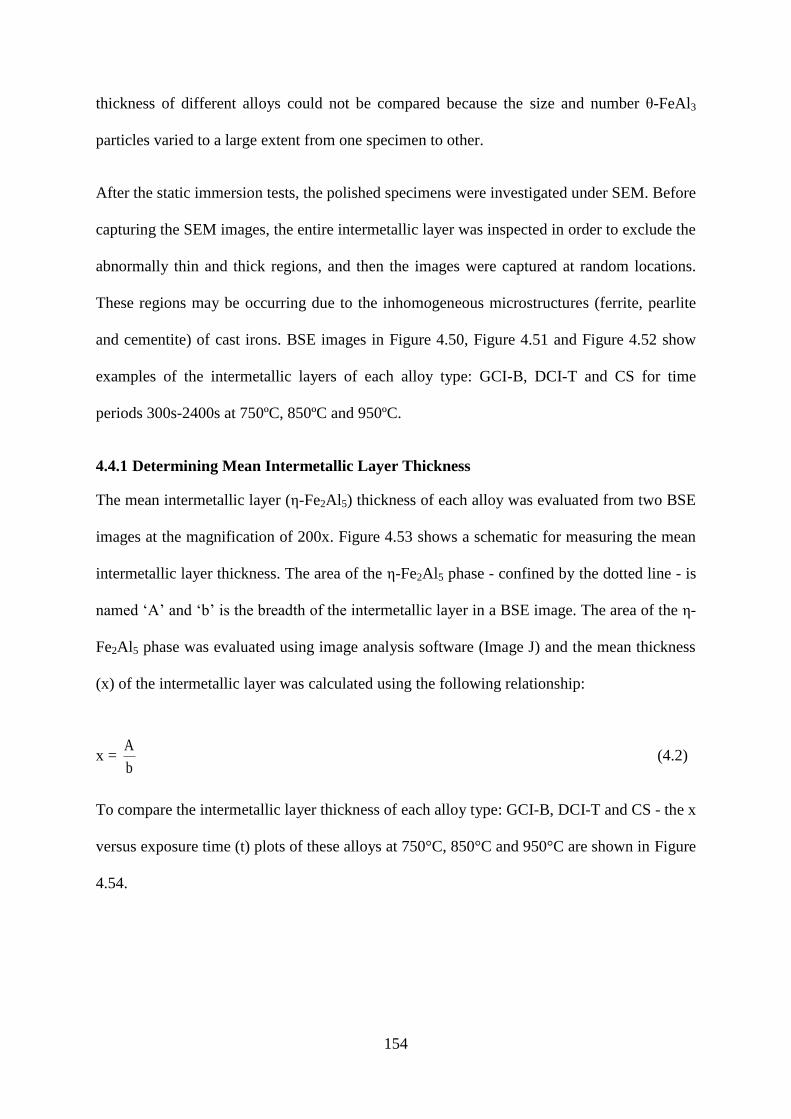
154
thickness of different alloys could not be compared because the size and number ζ-FeAl3
particles varied to a large extent from one specimen to other.
After the static immersion tests, the polished specimens were investigated under SEM. Before
capturing the SEM images, the entire intermetallic layer was inspected in order to exclude the
abnormally thin and thick regions, and then the images were captured at random locations.
These regions may be occurring due to the inhomogeneous microstructures (ferrite, pearlite
and cementite) of cast irons. BSE images in Figure 4.50, Figure 4.51 and Figure 4.52 show
examples of the intermetallic layers of each alloy type: GCI-B, DCI-T and CS for time
periods 300s-2400s at 750ºC, 850ºC and 950ºC.
4.4.1 Determining Mean Intermetallic Layer Thickness
The mean intermetallic layer (ε-Fe2Al5) thickness of each alloy was evaluated from two BSE
images at the magnification of 200x. Figure 4.53 shows a schematic for measuring the mean
intermetallic layer thickness. The area of the ε-Fe2Al5 phase - confined by the dotted line - is
named „A‟ and „b‟ is the breadth of the intermetallic layer in a BSE image. The area of the ε-
Fe2Al5 phase was evaluated using image analysis software (Image J) and the mean thickness
(x) of the intermetallic layer was calculated using the following relationship:
x = b
A (4.2)
To compare the intermetallic layer thickness of each alloy type: GCI-B, DCI-T and CS - the x
versus exposure time (t) plots of these alloys at 750°C, 850°C and 950°C are shown in Figure
4.54.
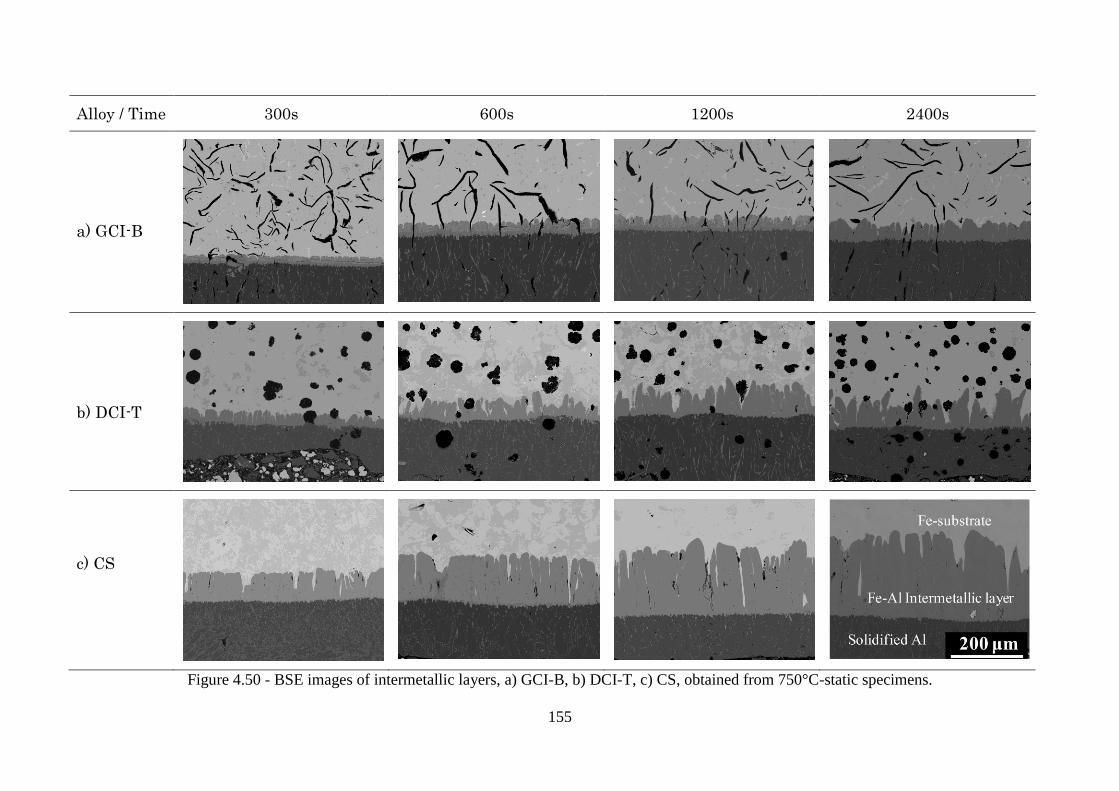
155
Alloy / Time 300s 600s 1200s 2400s
a) GCI-B
b) DCI-T
c) CS
Figure 4.50 - BSE images of intermetallic layers, a) GCI-B, b) DCI-T, c) CS, obtained from 750°C-static specimens.

156
Alloy / Time 300s 600s 1200s 2400s
a) GCI-B
b) DCI-T
c) CS
Figure 4.51 - BSE images of intermetallic layers, a) GCI-B, b) DCI-T, c) CS, obtained from 850°C-static specimens.
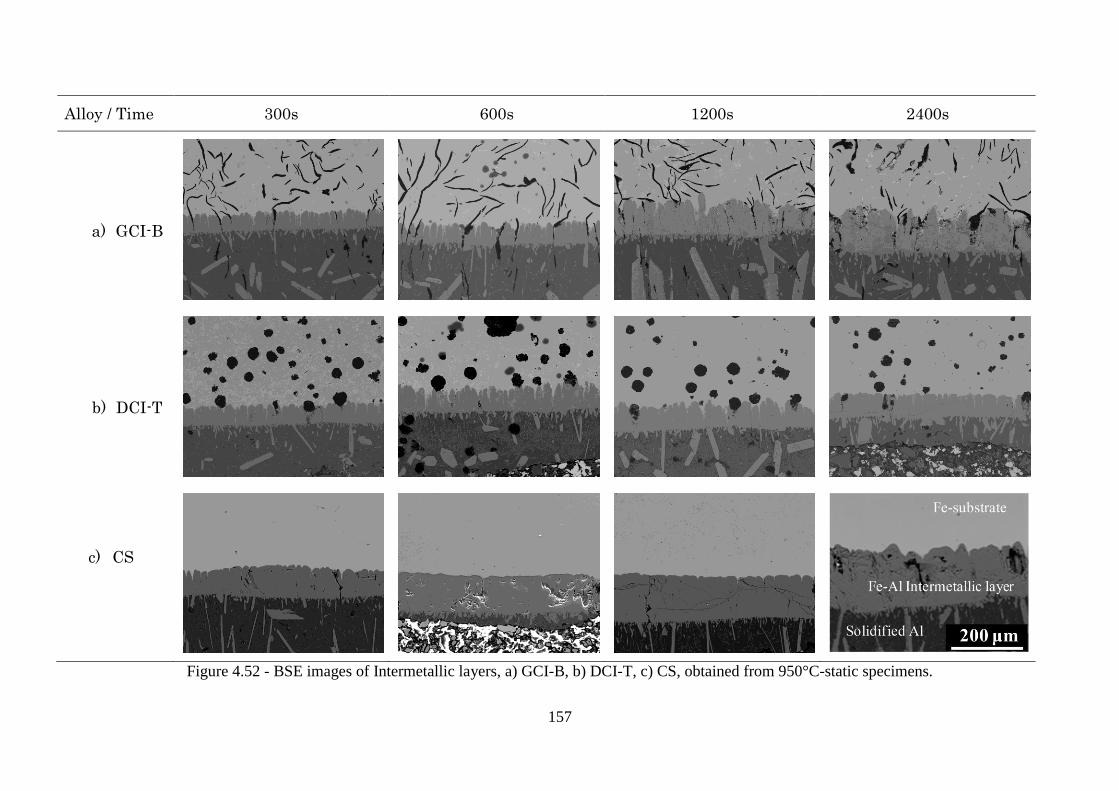
157
Alloy / Time 300s 600s 1200s 2400s
a) GCI-B
b) DCI-T
c) CS
Figure 4.52 - BSE images of Intermetallic layers, a) GCI-B, b) DCI-T, c) CS, obtained from 950°C-static specimens.
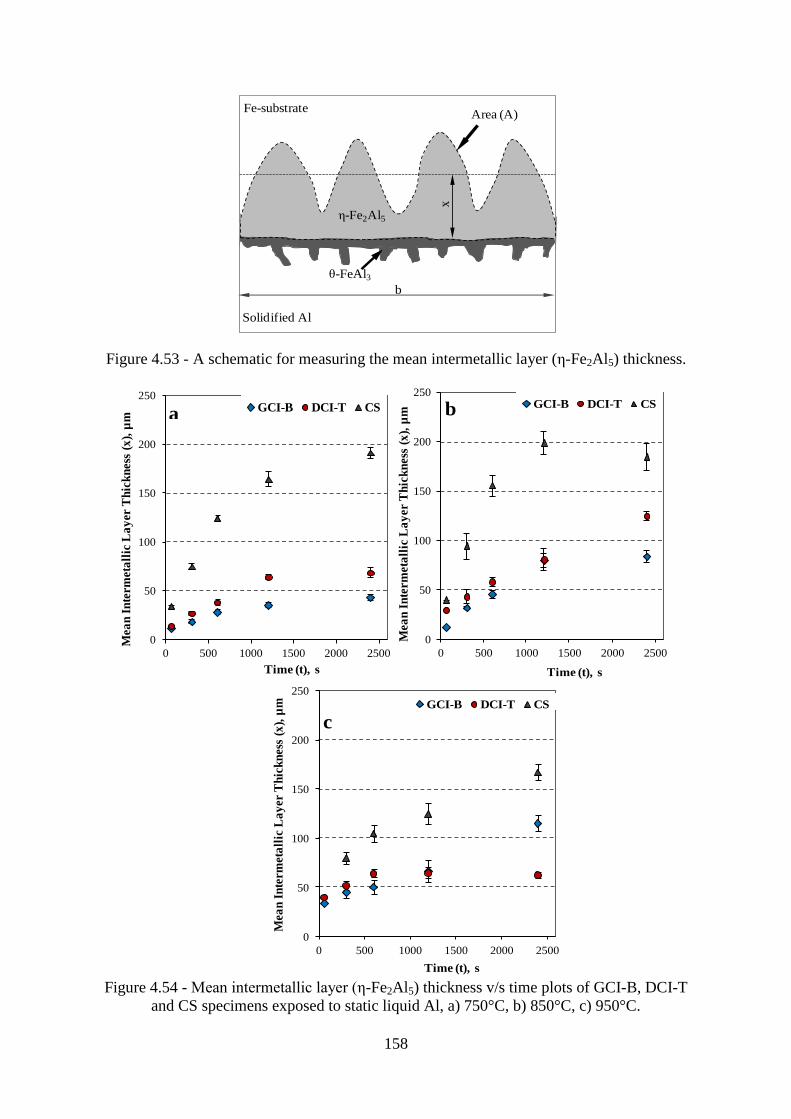
158
Figure 4.53 - A schematic for measuring the mean intermetallic layer (ε-Fe2Al5) thickness.
Figure 4.54 - Mean intermetallic layer (ε-Fe2Al5) thickness v/s time plots of GCI-B, DCI-T
and CS specimens exposed to static liquid Al, a) 750°C, b) 850°C, c) 950°C.
ε-Fe2Al5
ζ-FeAl3
Fe-substrate
Solidified Al
b
Area (A)
x
0
50
100
150
200
250
0 500 1000 1500 2000 2500
Mea
n I
nte
rmet
all
ic L
ay
er T
hic
kn
ess
(x),
µm
Time (t), s
0
50
100
150
200
250
0 500 1000 1500 2000 2500
Mea
n I
nte
rmet
all
ic L
ay
er T
hic
kn
ess
(x),
µm
Time (t), s
0
50
100
150
200
250
0 500 1000 1500 2000 2500
Mea
n I
nte
rmet
all
ic L
ay
er T
hic
kn
ess
(x),
µm
Time (t), s
c
0
20
40
60
80
100
120
0 50 100 150 200 250 300 350
GCI-B DCI-T CS
0
20
40
60
80
100
120
0 50 100 150 200 250 300 350
GCI-B DCI-T CS
0
20
40
60
80
100
120
0 50 100 150 200 250 300 350
GCI-B DCI-T CS
ba
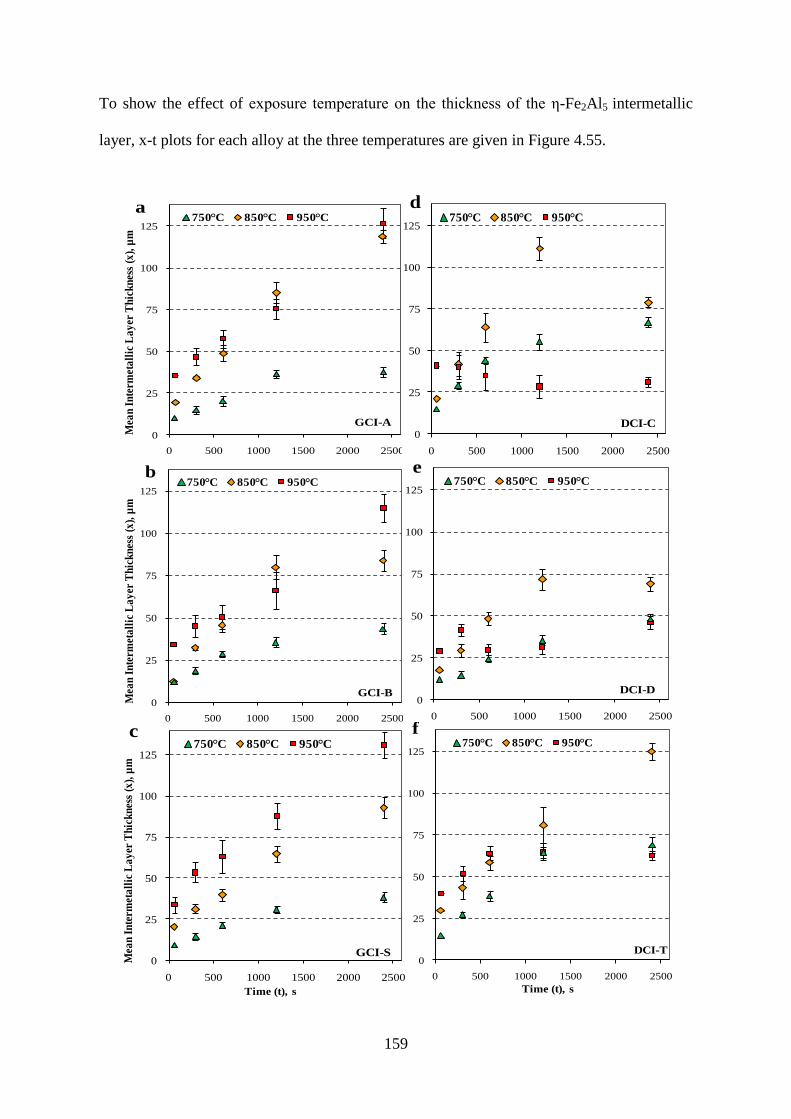
159
To show the effect of exposure temperature on the thickness of the ε-Fe2Al5 intermetallic
layer, x-t plots for each alloy at the three temperatures are given in Figure 4.55.
0
25
50
75
100
125
0 500 1000 1500 2000 2500
x, µ
m
t, s
e
DCI-D0
1
2
3
4
5
6
7
8
9
10
0 0.5 1 1.5 2 2.5
750°C 850°C 950°C
0
25
50
75
100
125
0 500 1000 1500 2000 2500
t, s
f
DCI-T
0
1
2
3
4
5
6
7
8
9
10
0 0.5 1 1.5 2 2.5
750°C 850°C 950°C
0
25
50
75
100
125
0 500 1000 1500 2000 2500
b
GCI-B
0
1
2
3
4
5
6
7
8
9
10
0 0.5 1 1.5 2 2.5
750°C 850°C 950°C
0
25
50
75
100
125
0 500 1000 1500 2000 2500
x, µ
m
a
GCI-A
0
1
2
3
4
5
6
7
8
9
10
0 0.5 1 1.5 2 2.5
750°C 850°C 950°C
0
25
50
75
100
125
0 500 1000 1500 2000 2500
x, µ
m
c
GCI-S0
1
2
3
4
5
6
7
8
9
10
0 0.5 1 1.5 2 2.5
750°C 850°C 950°C
0
25
50
75
100
125
0 500 1000 1500 2000 2500
d
DCI-C0
1
2
3
4
5
6
7
8
9
10
0 0.5 1 1.5 2 2.5
750°C 850°C 950°C
0
25
50
75
100
125
0 500 1000 1500 2000 2500
x, µ
m
t, s
e
DCI-D0
1
2
3
4
5
6
7
8
9
10
0 0.5 1 1.5 2 2.5
750°C 850°C 950°C
0
25
50
75
100
125
0 500 1000 1500 2000 2500t, s
e
DCI-D0
1
2
3
4
5
6
7
8
9
10
0 0.5 1 1.5 2 2.5
750°C 850°C 950°C
0
50
100
150
200
250
0 500 1000 1500 2000 2500
Mea
n I
nte
rmet
all
ic L
ay
er T
hic
kn
ess
(x),
µm
Time (t1/2), s1/2
d
CS
y = 2.349x
0
25
50
75
100
0 5 10 15 20 25 30 35 40
Tit
le
Title
750°C 850°C 950°C
0
50
100
150
200
250
0 500 1000 1500 2000 2500
Mea
n I
nte
rmet
all
ic L
ay
er T
hic
kn
ess
(x),
µm
Time (t1/2), s1/2
d
CS
y = 2.349x
0
25
50
75
100
0 5 10 15 20 25 30 35 40
Tit
le
Title
750°C 850°C 950°C
0
50
100
150
200
250
0 500 1000 1500 2000 2500
Mea
n I
nte
rmet
all
ic L
ay
er T
hic
kn
ess
(x),
µm
Time (t1/2), s1/2
d
CS
y = 2.349x
0
25
50
75
100
0 5 10 15 20 25 30 35 40
Tit
le
Title
750°C 850°C 950°C
Time (t), sTime (t), s
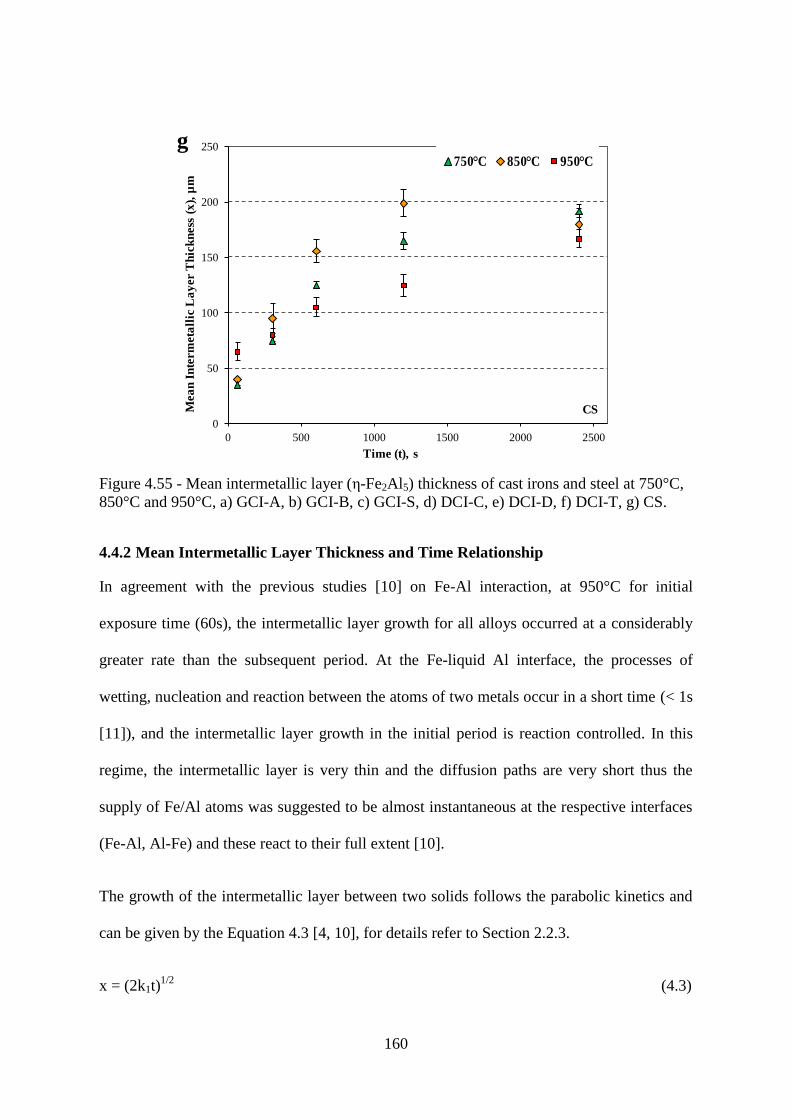
160
Figure 4.55 - Mean intermetallic layer (ε-Fe2Al5) thickness of cast irons and steel at 750°C,
850°C and 950°C, a) GCI-A, b) GCI-B, c) GCI-S, d) DCI-C, e) DCI-D, f) DCI-T, g) CS.
4.4.2 Mean Intermetallic Layer Thickness and Time Relationship
In agreement with the previous studies [10] on Fe-Al interaction, at 950°C for initial
exposure time (60s), the intermetallic layer growth for all alloys occurred at a considerably
greater rate than the subsequent period. At the Fe-liquid Al interface, the processes of
wetting, nucleation and reaction between the atoms of two metals occur in a short time (< 1s
[11]), and the intermetallic layer growth in the initial period is reaction controlled. In this
regime, the intermetallic layer is very thin and the diffusion paths are very short thus the
supply of Fe/Al atoms was suggested to be almost instantaneous at the respective interfaces
(Fe-Al, Al-Fe) and these react to their full extent [10].
The growth of the intermetallic layer between two solids follows the parabolic kinetics and
can be given by the Equation 4.3 [4, 10], for details refer to Section 2.2.3.
x = (2k1t)1/2
(4.3)
0
50
100
150
200
250
0 500 1000 1500 2000 2500
x, µ
m
t, s
g
CS0
1
2
3
4
5
6
7
8
9
10
0 0.5 1 1.5 2 2.5
750°C 850°C 950°C
0
50
100
150
200
250
0 500 1000 1500 2000 2500
Mea
n I
nte
rm
eta
llic
La
yer T
hic
kn
ess
(x
), µ
m
Time (t1/2), s1/2
d
CS
y = 2.349x
0
25
50
75
100
0 5 10 15 20 25 30 35 40
Tit
le
Title
750°C 850°C 950°C
Time (t), s
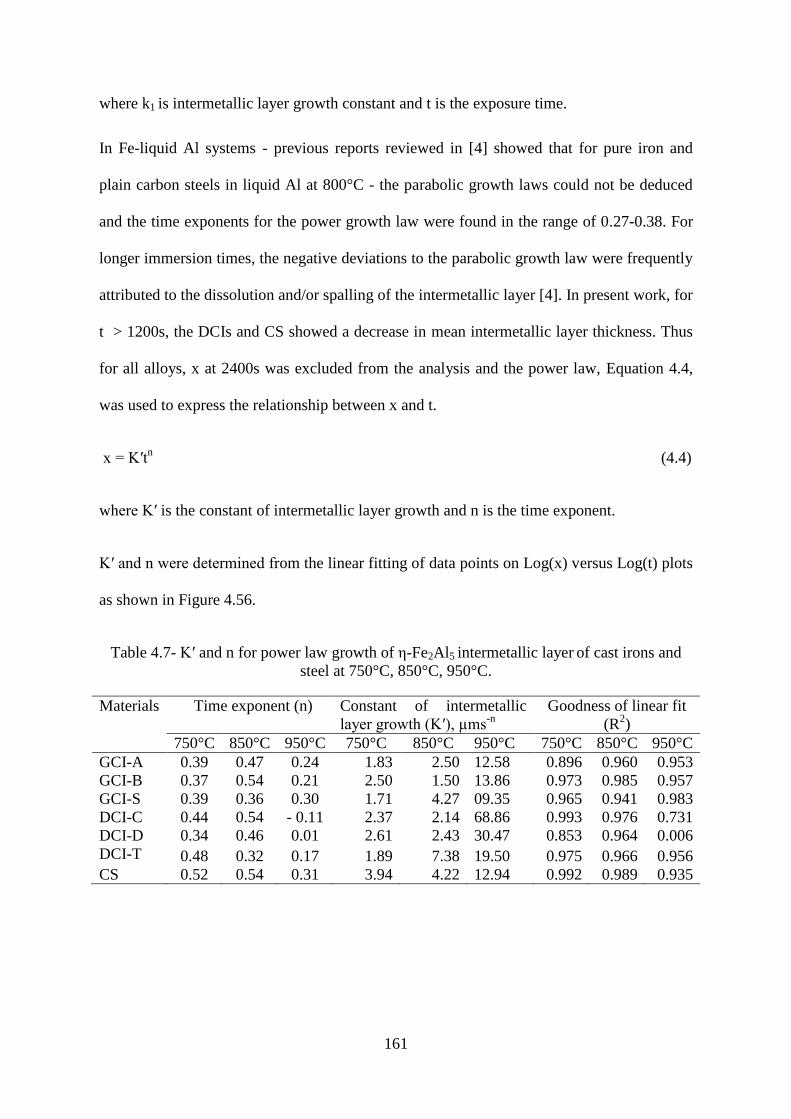
161
where k1 is intermetallic layer growth constant and t is the exposure time.
In Fe-liquid Al systems - previous reports reviewed in [4] showed that for pure iron and
plain carbon steels in liquid Al at 800°C - the parabolic growth laws could not be deduced
and the time exponents for the power growth law were found in the range of 0.27-0.38. For
longer immersion times, the negative deviations to the parabolic growth law were frequently
attributed to the dissolution and/or spalling of the intermetallic layer [4]. In present work, for
t > 1200s, the DCIs and CS showed a decrease in mean intermetallic layer thickness. Thus
for all alloys, x at 2400s was excluded from the analysis and the power law, Equation 4.4,
was used to express the relationship between x and t.
x = K′tn
(4.4)
where K′ is the constant of intermetallic layer growth and n is the time exponent.
K′ and n were determined from the linear fitting of data points on Log(x) versus Log(t) plots
as shown in Figure 4.56.
Table 4.7- K′ and n for power law growth of ε-Fe2Al5 intermetallic layer of cast irons and
steel at 750°C, 850°C, 950°C.
Materials Time exponent (n) Constant of intermetallic
layer growth (K′), µms-n
Goodness of linear fit
(R2)
750°C 850°C 950°C 750°C 850°C 950°C 750°C 850°C 950°C
GCI-A 0.39 0.47 0.24 1.83 2.50 12.58 0.896 0.960 0.953
GCI-B 0.37 0.54 0.21 2.50 1.50 13.86 0.973 0.985 0.957
GCI-S 0.39 0.36 0.30 1.71 4.27 09.35 0.965 0.941 0.983
DCI-C 0.44 0.54 - 0.11 2.37 2.14 68.86 0.993 0.976 0.731
DCI-D 0.34 0.46 0.01 2.61 2.43 30.47 0.853 0.964 0.006
DCI-T 0.48 0.32 0.17 1.89 7.38 19.50 0.975 0.966 0.956
CS 0.52 0.54 0.31 3.94 4.22 12.94 0.992 0.989 0.935
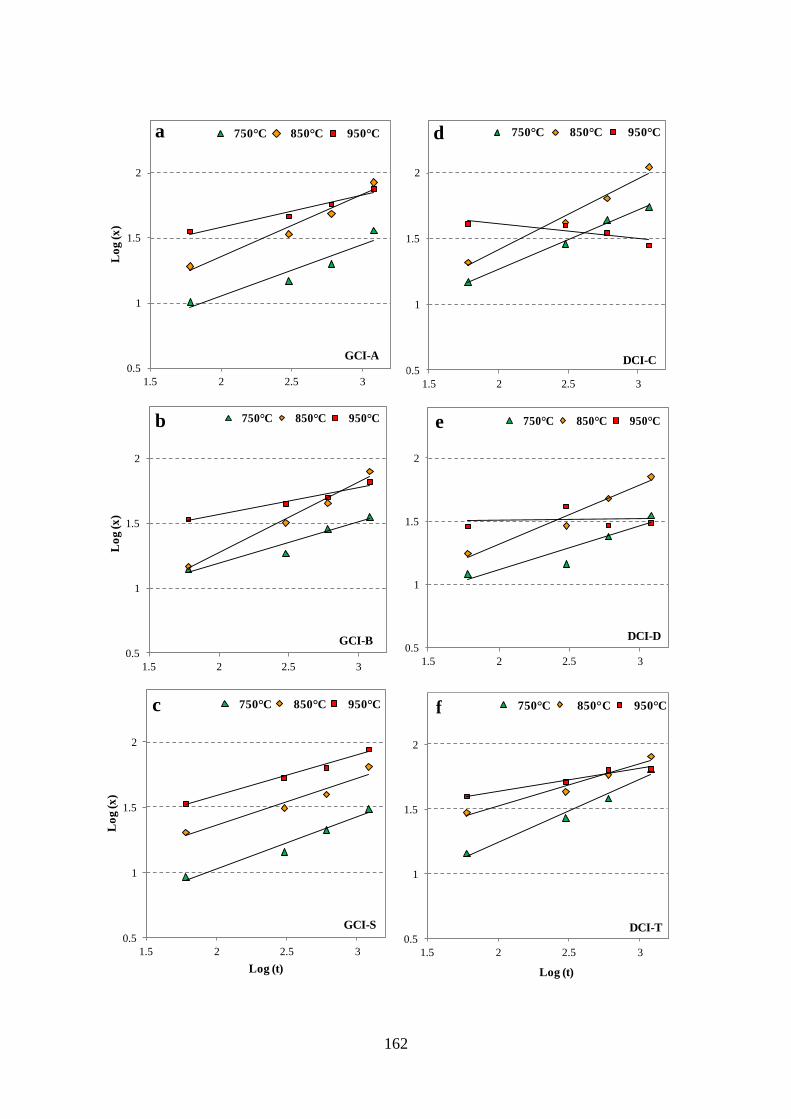
162
0.5
1
1.5
2
1.5 2 2.5 3
750°C 850°C 950°C
0.5
1
1.5
2
1.5 2 2.5 3
Lo
g (x
)
750°C 850°C 950°C
0.5
1
1.5
2
1.5 2 2.5 3
Lo
g (x
)
Log (t)
750°C 850°C 950°C
0.5
1
1.5
2
1.5 2 2.5 3
Log (t)
750°C 850°C 950°C
0.5
1
1.5
2
1.5 2 2.5 3
Lo
g (x
)
0.5
1
1.5
2
1.5 2 2.5 3
0
0.5
1
1.5
2
2.5
0 0.5 1 1.5 2 2.5 3 3.5
750°C 850°C 950°C
0
0.5
1
1.5
2
2.5
0 0.5 1 1.5 2 2.5 3 3.5
750°C 850°C 950°C
GCI-A
GCI-B
GCI-S DCI-T
DCI-C
a d
b e
c f
DCI-D
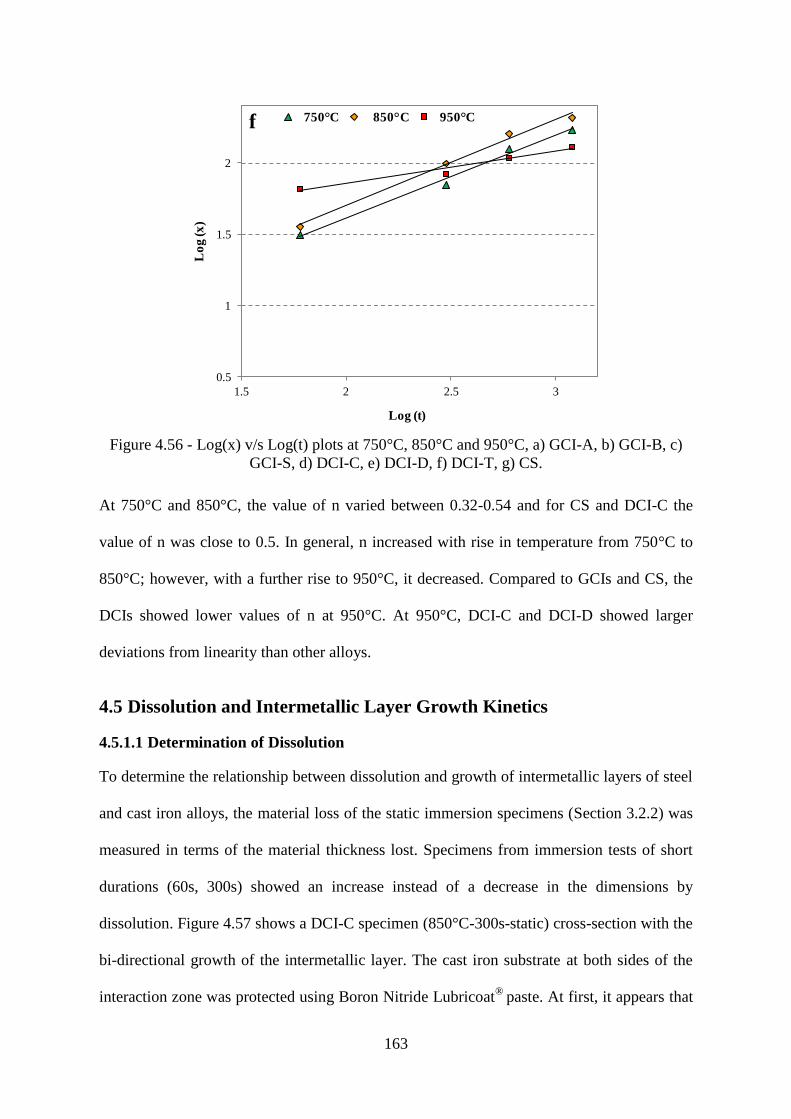
163
Figure 4.56 - Log(x) v/s Log(t) plots at 750°C, 850°C and 950°C, a) GCI-A, b) GCI-B, c)
GCI-S, d) DCI-C, e) DCI-D, f) DCI-T, g) CS.
At 750°C and 850°C, the value of n varied between 0.32-0.54 and for CS and DCI-C the
value of n was close to 0.5. In general, n increased with rise in temperature from 750°C to
850°C; however, with a further rise to 950°C, it decreased. Compared to GCIs and CS, the
DCIs showed lower values of n at 950°C. At 950°C, DCI-C and DCI-D showed larger
deviations from linearity than other alloys.
4.5 Dissolution and Intermetallic Layer Growth Kinetics
4.5.1.1 Determination of Dissolution
To determine the relationship between dissolution and growth of intermetallic layers of steel
and cast iron alloys, the material loss of the static immersion specimens (Section 3.2.2) was
measured in terms of the material thickness lost. Specimens from immersion tests of short
durations (60s, 300s) showed an increase instead of a decrease in the dimensions by
dissolution. Figure 4.57 shows a DCI-C specimen (850°C-300s-static) cross-section with the
bi-directional growth of the intermetallic layer. The cast iron substrate at both sides of the
interaction zone was protected using Boron Nitride Lubricoat®
paste. At first, it appears that
0.5
1
1.5
2
1.5 2 2.5 3
Lo
g (x
)
Log (t)
750°C 850°C 950°Cf
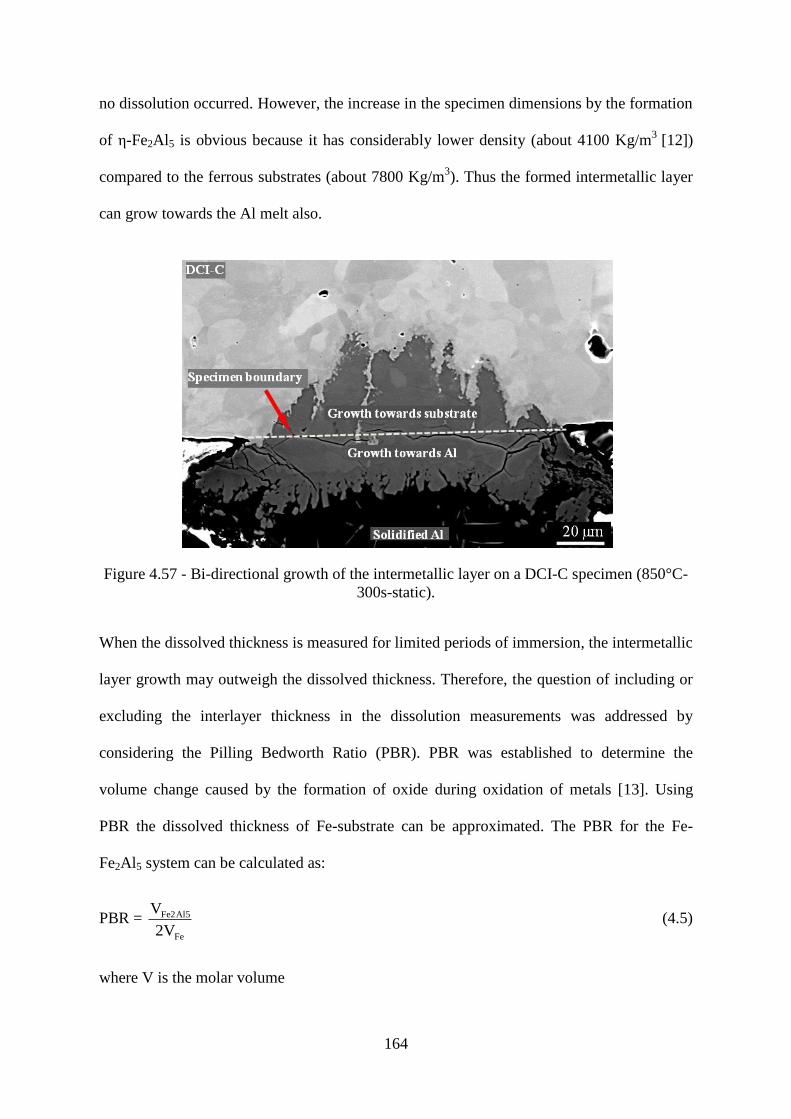
164
no dissolution occurred. However, the increase in the specimen dimensions by the formation
of ε-Fe2Al5 is obvious because it has considerably lower density (about 4100 Kg/m3
[12])
compared to the ferrous substrates (about 7800 Kg/m3). Thus the formed intermetallic layer
can grow towards the Al melt also.
Figure 4.57 - Bi-directional growth of the intermetallic layer on a DCI-C specimen (850°C-
300s-static).
When the dissolved thickness is measured for limited periods of immersion, the intermetallic
layer growth may outweigh the dissolved thickness. Therefore, the question of including or
excluding the interlayer thickness in the dissolution measurements was addressed by
considering the Pilling Bedworth Ratio (PBR). PBR was established to determine the
volume change caused by the formation of oxide during oxidation of metals [13]. Using
PBR the dissolved thickness of Fe-substrate can be approximated. The PBR for the Fe-
Fe2Al5 system can be calculated as:
PBR = Fe
Fe2Al5
2V
V (4.5)
where V is the molar volume
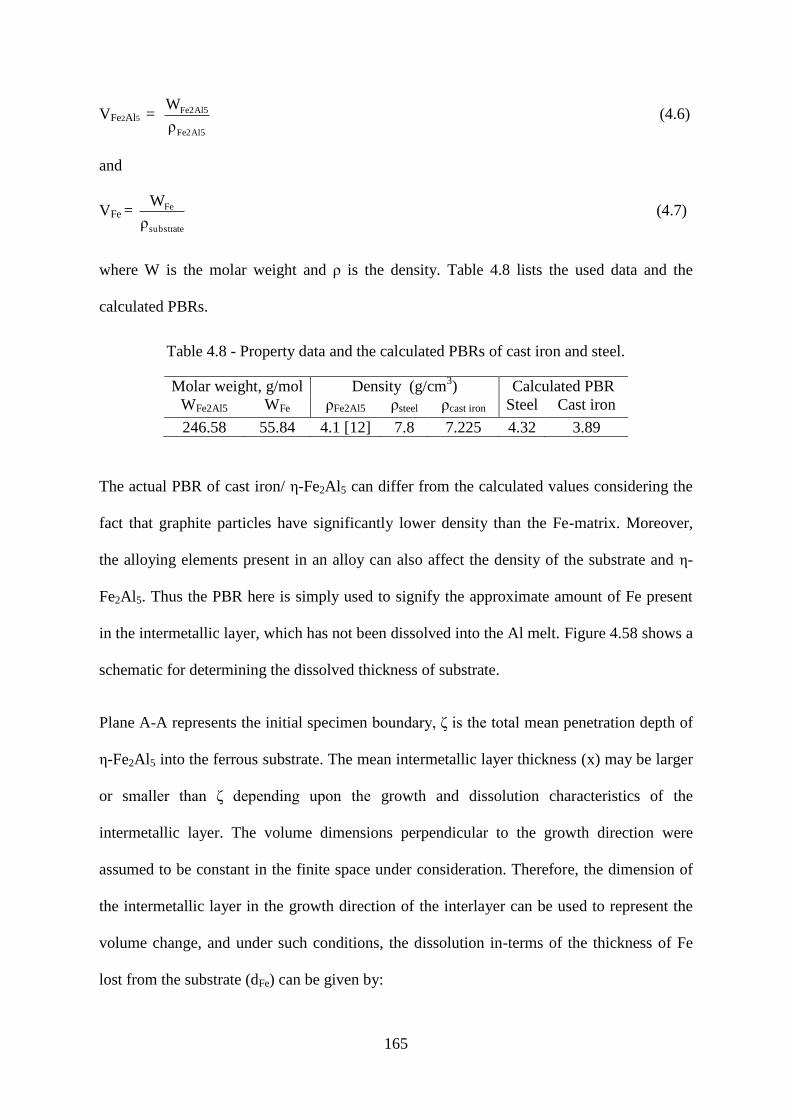
165
VFe2Al5 =
Fe2Al5
Fe2Al5
ρ
W (4.6)
and
VFe = substrate
Fe
ρ
W (4.7)
where W is the molar weight and ρ is the density. Table 4.8 lists the used data and the
calculated PBRs.
Table 4.8 - Property data and the calculated PBRs of cast iron and steel.
Molar weight, g/mol Density (g/cm3) Calculated PBR
WFe2Al5 WFe ρFe2Al5 ρsteel ρcast iron Steel Cast iron
246.58 55.84 4.1 [12] 7.8 7.225 4.32 3.89
The actual PBR of cast iron/ ε-Fe2Al5 can differ from the calculated values considering the
fact that graphite particles have significantly lower density than the Fe-matrix. Moreover,
the alloying elements present in an alloy can also affect the density of the substrate and ε-
Fe2Al5. Thus the PBR here is simply used to signify the approximate amount of Fe present
in the intermetallic layer, which has not been dissolved into the Al melt. Figure 4.58 shows a
schematic for determining the dissolved thickness of substrate.
Plane A-A represents the initial specimen boundary, δ is the total mean penetration depth of
ε-Fe2Al5 into the ferrous substrate. The mean intermetallic layer thickness (x) may be larger
or smaller than δ depending upon the growth and dissolution characteristics of the
intermetallic layer. The volume dimensions perpendicular to the growth direction were
assumed to be constant in the finite space under consideration. Therefore, the dimension of
the intermetallic layer in the growth direction of the interlayer can be used to represent the
volume change, and under such conditions, the dissolution in-terms of the thickness of Fe
lost from the substrate (dFe) can be given by:
166
dFe = δ - PBR
x (4.8)
and the amount of dissolution in terms of ε-Fe2Al5 thickness (dFe2Al5) can be given by:
dFe2Al5 = (PBR)dFe (4.9)
Figure 4.58 - A schematic for evaluating the dissolution of Fe-substrate in-terms of ε-Fe2Al5
thickness.
It is to be noted that dFe2Al5 represents only a scale not how the dissolution has occurred.
Dissolution of Fe-substrates can be a combination of dissolution and/or spallation of the
intermetallic layer, and the direct diffusion of Fe atoms to liquid Al.
4.5.1.2 Comparing Intermetallic Layer Growth and Dissolution
GCIs, DCIs and CS showed dissimilar characteristics of intermetallic layer growth and
dissolution. Figure 4.59 shows the x-t and dFe2Al5-t plots of cast iron alloys (950°C-static);
dFe2Al5 is presented on the negative scale and x is plotted as positive.
ε-Fe2Al5Fe substrate
So
lid
ifie
d A
l
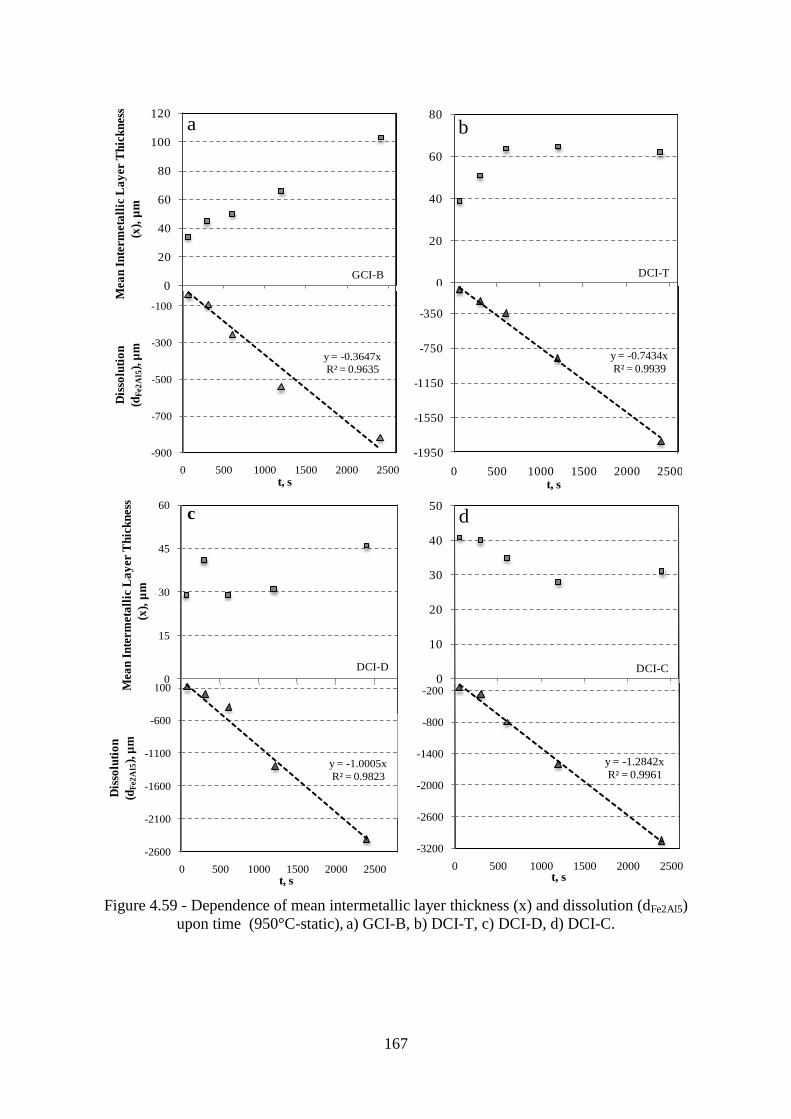
167
Figure 4.59 - Dependence of mean intermetallic layer thickness (x) and dissolution (dFe2Al5)
upon time (950°C-static), a) GCI-B, b) DCI-T, c) DCI-D, d) DCI-C.
y = -0.3647x
R² = 0.9635
-900
-700
-500
-300
-100
0 500 1000 1500 2000 2500
dF
e2A
l5, µ
m
t, s
0
20
40
60
80
100
120
0 500 1000 1500 2000 2500
x, μ
m
GCI-B
a
y = -0.7434x
R² = 0.9939
-1950
-1550
-1150
-750
-350
0 500 1000 1500 2000 2500
dF
e2A
l5, μ
m
t, s
0
20
40
60
80
0 500 1000 1500 2000 2500
x, μ
m
DCI-T
b
y = -1.2842x
R² = 0.9961
-3200
-2600
-2000
-1400
-800
-200
0 500 1000 1500 2000 2500
dF
e2A
l5, μ
m
t, s
0
10
20
30
40
50
0 500 1000 1500 2000 2500
x,
μm
t, s
d
DCI-C
y = -1.0005x
R² = 0.9823
-2600
-2100
-1600
-1100
-600
-100
0 500 1000 1500 2000 2500
dF
e2A
l5, μ
m
t, s
0
15
30
45
60
0 500 1000 1500 2000 2500
x, μ
m
Time, s
c
DCI-D
Dis
solu
tio
n
(dF
e2A
l5),
µm
Mea
n I
nte
rmet
all
ic L
ay
er T
hic
kn
ess
(x),
µm
Mea
n I
nte
rmet
all
ic L
ay
er T
hic
kn
ess
(x),
µm
Dis
solu
tio
n
(dF
e2A
l5),
µm

168
The dFe2Al5-t relationship was found to be linear for all alloys under investigation. GCIs
showed considerably lower dissolution rate than DCIs. Among DCIs, DCI-T exhibited
lowest dissolution rate followed by DCI-D and DCI-C, in that order. At 950°C, the growth
of intermetallic layers of DCIs showed large negative deviations from the parabolic growth
law (x=K′t0.5
), Table 4.7, and decreasing trends in intermetallic layer thickness with
increasing exposure time were commonly found. At 950°C, in GCIs, the negative deviations
from the parabolic growth law were lower compared to DCIs, and thinning of the
intermetallic layers of GCIs with increasing time or temperature was not observed. In
contrast, DCIs commonly showed thinner intermetallic layers at 950°C compared to the
lower temperatures.
4.6 Morphology of the Intermetallic Layers
The morphology of the intermetallic layer and corrosion rates were found to vary with the
substrate composition and alloy type. In order to better understand the intermetallic
compound structure, a deep-etching technique was also used to reveal the 3D morphology of
the intermetallic layers of steel and cast irons. This analysis would be helpful to understand
the effect of alloy composition on the structure of the intermetallic layer.
4.6.1 2D Morphology of the Intermetallic Layer
Figure 4.60 shows the examples of intermetallic layers of cast irons specimens for (850°C-
600s-static) and (850°C-1200s-static). The intermetallic layer morphology of the DCI
specimens was serrated and uneven. In contrast, the GCIs showed a uniform appearance.
The morphology of intermetallic layers for these alloys was compared by evaluating the
average maximum ( maxX ) average minimum ( minX ) intermetallic layer thicknesses.
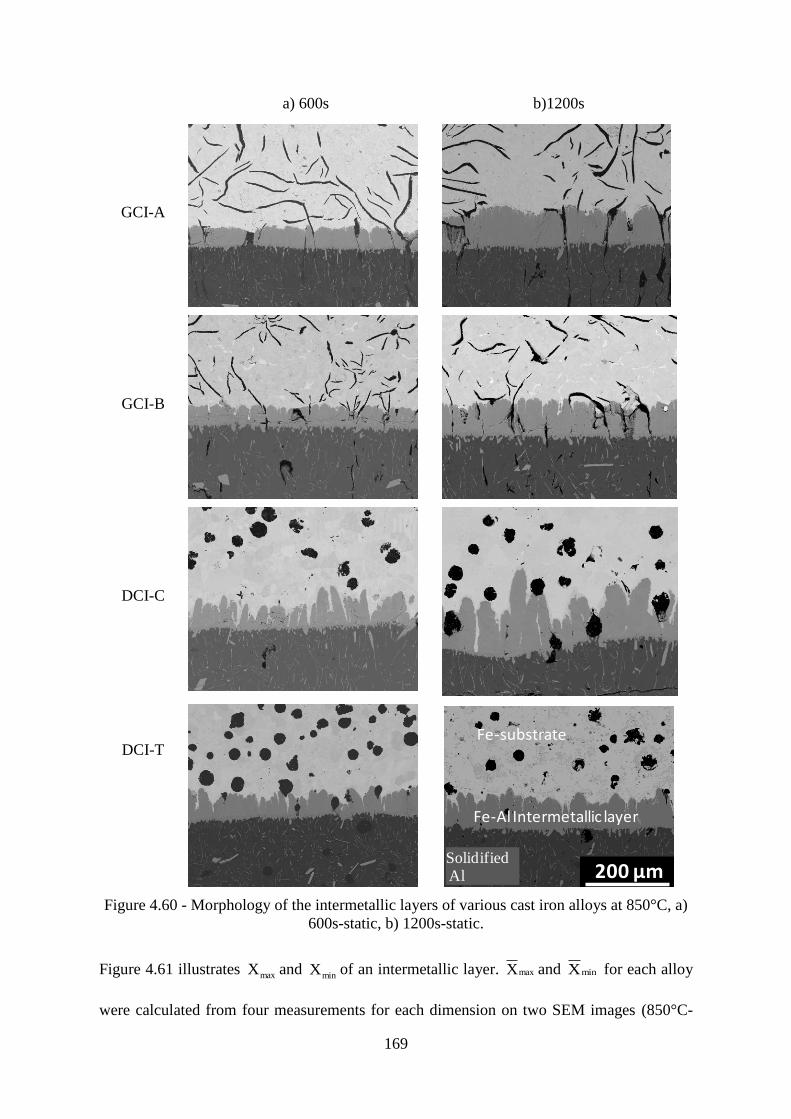
169
a) 600s b)1200s
GCI-A
GCI-B
DCI-C
DCI-T
Figure 4.60 - Morphology of the intermetallic layers of various cast iron alloys at 850°C, a)
600s-static, b) 1200s-static.
Figure 4.61 illustrates maxX and minX of an intermetallic layer. maxX and minX for each alloy
were calculated from four measurements for each dimension on two SEM images (850°C-
200 μm
Fe-Al Intermetallic layer
Solidified aluminum
Fe-substrate
Fe-Al Intermetallic layer
Solidified aluminum
Fe-substrate
SolidifiedAl
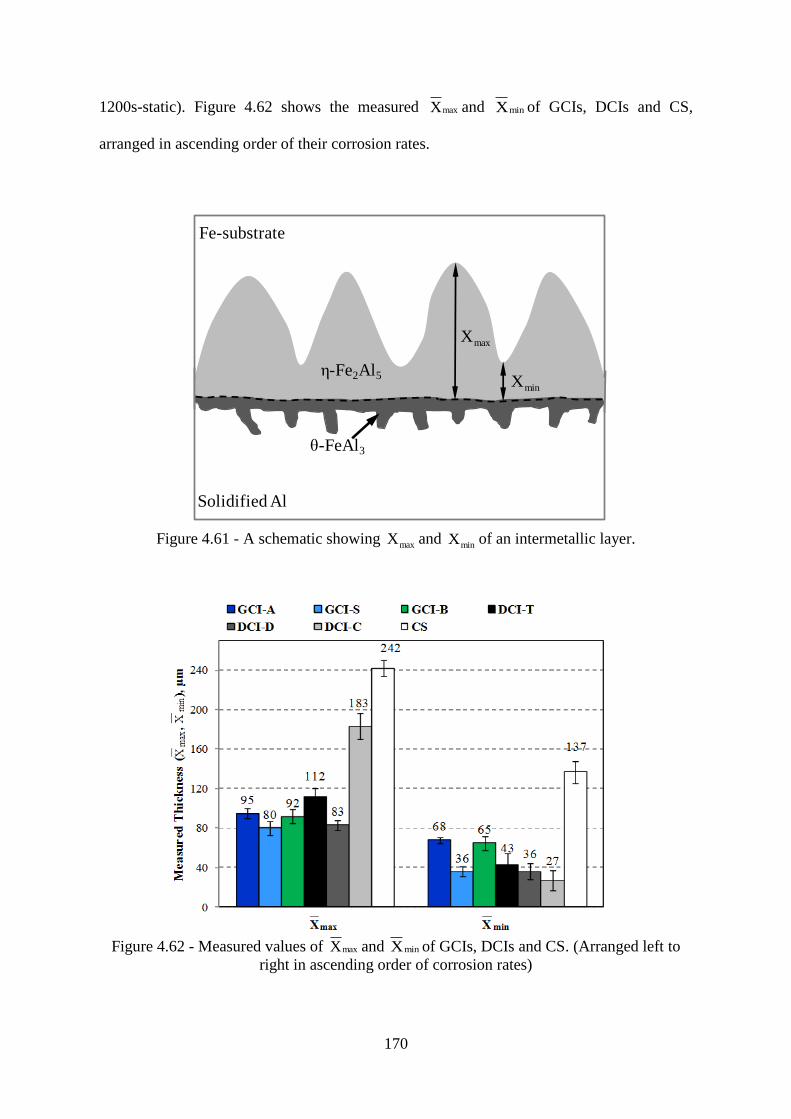
170
1200s-static). Figure 4.62 shows the measured maxX and minX of GCIs, DCIs and CS,
arranged in ascending order of their corrosion rates.
Figure 4.61 - A schematic showing maxX and minX of an intermetallic layer.
Figure 4.62 - Measured values of maxX and minX of GCIs, DCIs and CS. (Arranged left to
right in ascending order of corrosion rates)
ε-Fe2Al5
ζ-FeAl3
Fe-substrate
Solidified Al
maxX
minX
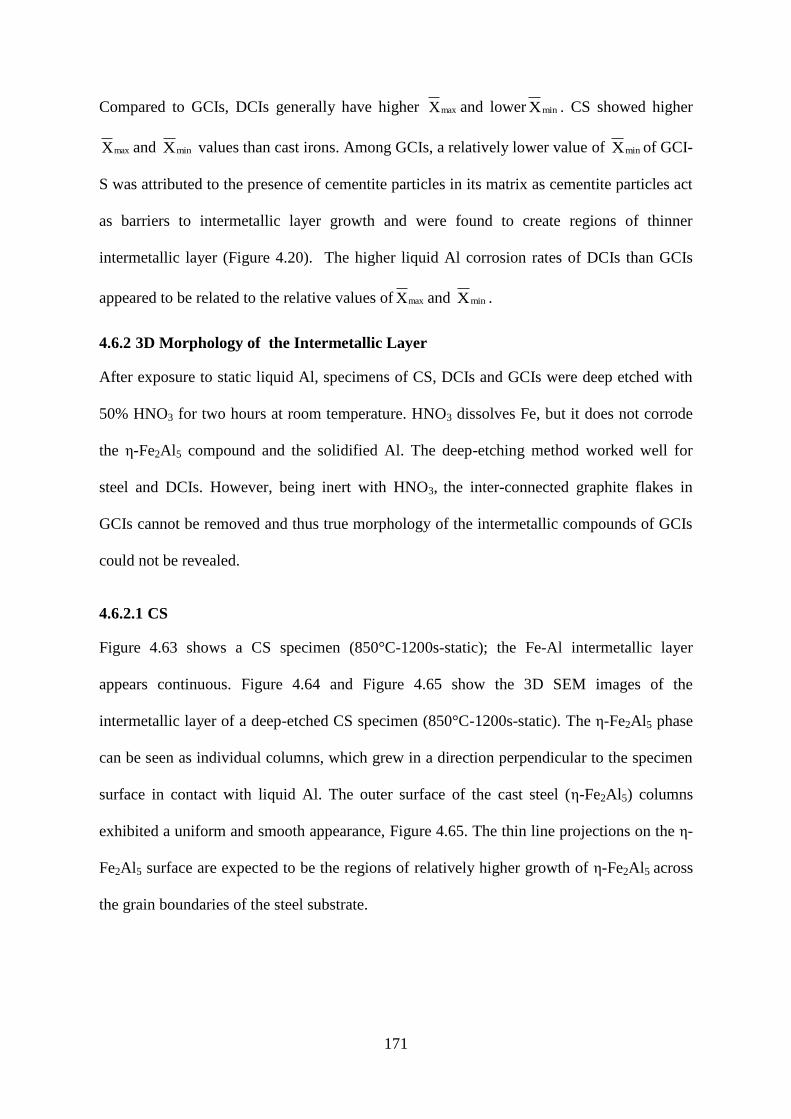
171
Compared to GCIs, DCIs generally have higher maxX and lower minX . CS showed higher
maxX and minX values than cast irons. Among GCIs, a relatively lower value of minX of GCI-
S was attributed to the presence of cementite particles in its matrix as cementite particles act
as barriers to intermetallic layer growth and were found to create regions of thinner
intermetallic layer (Figure 4.20). The higher liquid Al corrosion rates of DCIs than GCIs
appeared to be related to the relative values of maxX and minX .
4.6.2 3D Morphology of the Intermetallic Layer
After exposure to static liquid Al, specimens of CS, DCIs and GCIs were deep etched with
50% HNO3 for two hours at room temperature. HNO3 dissolves Fe, but it does not corrode
the ε-Fe2Al5 compound and the solidified Al. The deep-etching method worked well for
steel and DCIs. However, being inert with HNO3, the inter-connected graphite flakes in
GCIs cannot be removed and thus true morphology of the intermetallic compounds of GCIs
could not be revealed.
4.6.2.1 CS
Figure 4.63 shows a CS specimen (850°C-1200s-static); the Fe-Al intermetallic layer
appears continuous. Figure 4.64 and Figure 4.65 show the 3D SEM images of the
intermetallic layer of a deep-etched CS specimen (850°C-1200s-static). The ε-Fe2Al5 phase
can be seen as individual columns, which grew in a direction perpendicular to the specimen
surface in contact with liquid Al. The outer surface of the cast steel (ε-Fe2Al5) columns
exhibited a uniform and smooth appearance, Figure 4.65. The thin line projections on the ε-
Fe2Al5 surface are expected to be the regions of relatively higher growth of ε-Fe2Al5 across
the grain boundaries of the steel substrate.
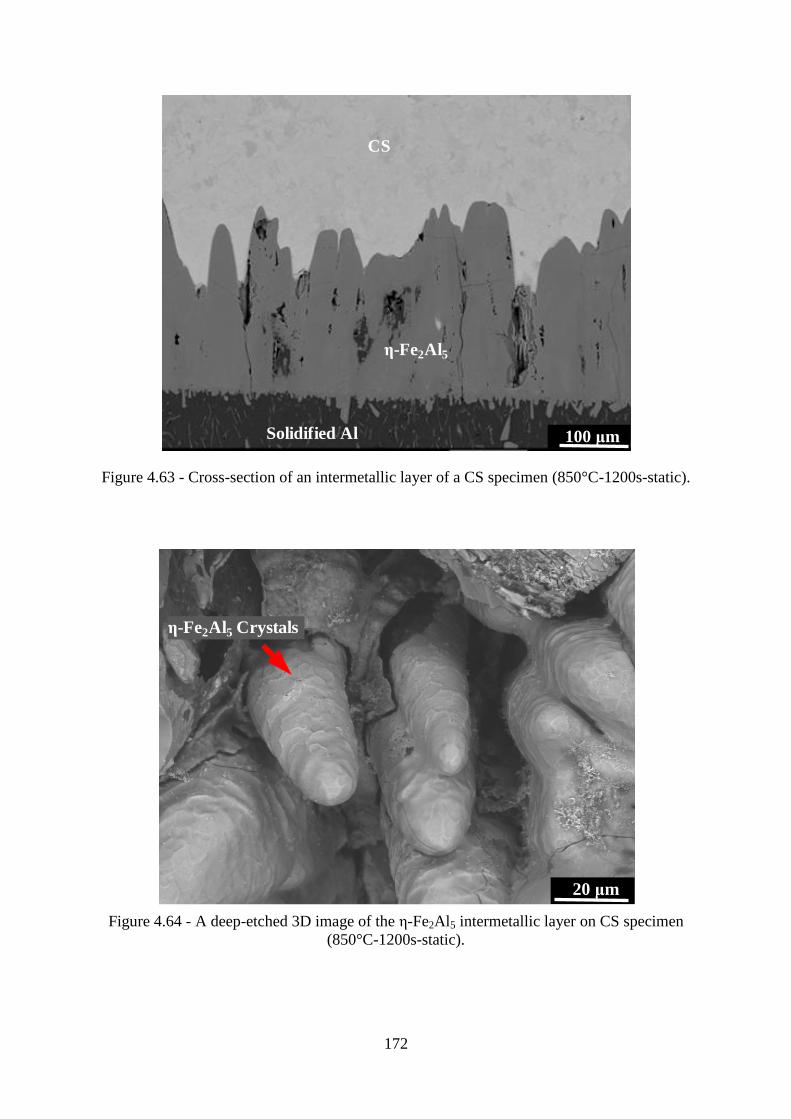
172
Figure 4.63 - Cross-section of an intermetallic layer of a CS specimen (850°C-1200s-static).
Figure 4.64 - A deep-etched 3D image of the ε-Fe2Al5 intermetallic layer on CS specimen
(850°C-1200s-static).
ε-Fe2Al5
CS
Solidified Al 100 μm
20 μm
ε-Fe2Al5 Crystals
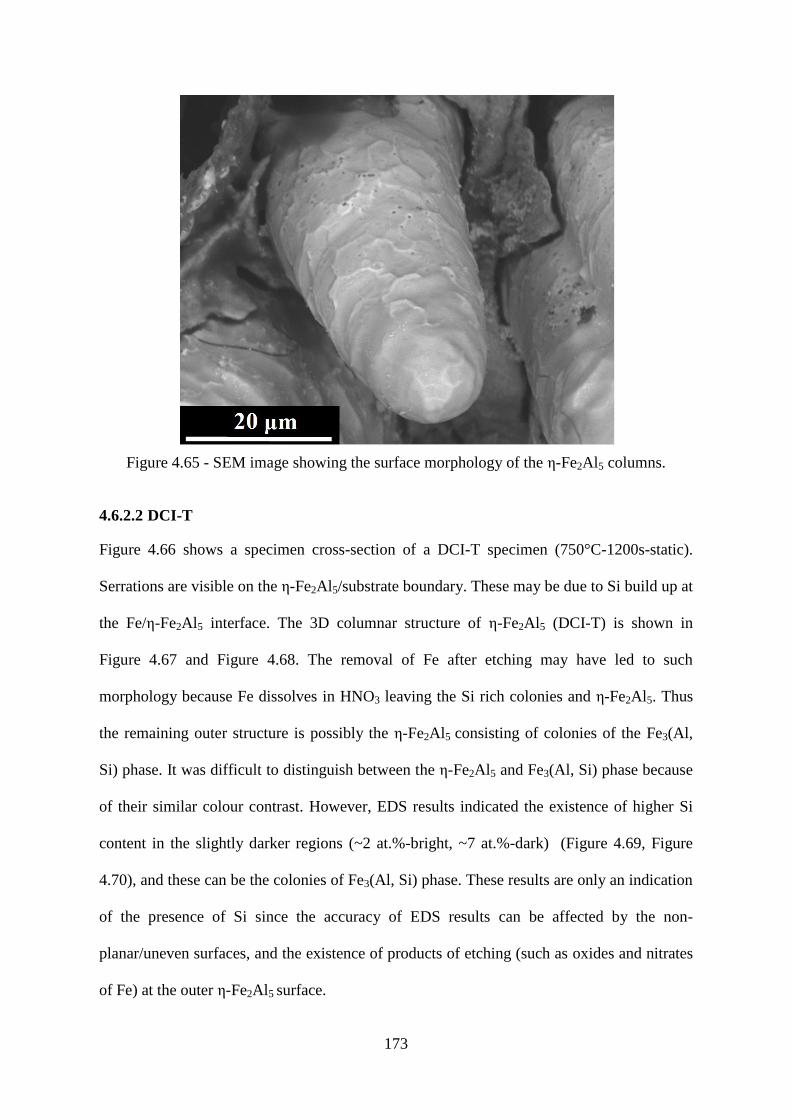
173
Figure 4.65 - SEM image showing the surface morphology of the ε-Fe2Al5 columns.
4.6.2.2 DCI-T
Figure 4.66 shows a specimen cross-section of a DCI-T specimen (750°C-1200s-static).
Serrations are visible on the ε-Fe2Al5/substrate boundary. These may be due to Si build up at
the Fe/ε-Fe2Al5 interface. The 3D columnar structure of ε-Fe2Al5 (DCI-T) is shown in
Figure 4.67 and Figure 4.68. The removal of Fe after etching may have led to such
morphology because Fe dissolves in HNO3 leaving the Si rich colonies and ε-Fe2Al5. Thus
the remaining outer structure is possibly the ε-Fe2Al5 consisting of colonies of the Fe3(Al,
Si) phase. It was difficult to distinguish between the ε-Fe2Al5 and Fe3(Al, Si) phase because
of their similar colour contrast. However, EDS results indicated the existence of higher Si
content in the slightly darker regions (~2 at.%-bright, ~7 at.%-dark) (Figure 4.69, Figure
4.70), and these can be the colonies of Fe3(Al, Si) phase. These results are only an indication
of the presence of Si since the accuracy of EDS results can be affected by the non-
planar/uneven surfaces, and the existence of products of etching (such as oxides and nitrates
of Fe) at the outer ε-Fe2Al5 surface.

174
Figure 4.66 - A 2-D image of a DCI-T specimen (750°C-1200s-static).
Figure 4.67 - Morphology of ε-Fe2Al5 columns on a DCI-T specimen (750°C-1200s-static).
40 μm
ε-Fe2Al5
DCI-T
Solidified Al
Serrations

175
Figure 4.68 - A magnified image of a ε-Fe2Al5 column on a DCI-T specimen (750°C-1200s-
static).
Figure 4.69 - An SEI image showing beam locations for EDS analysis on DCI-T specimen
(750°C-1200s- static).
10 μm
Graphite spheroid ε- Fe2Al5 crystal
DCI-T
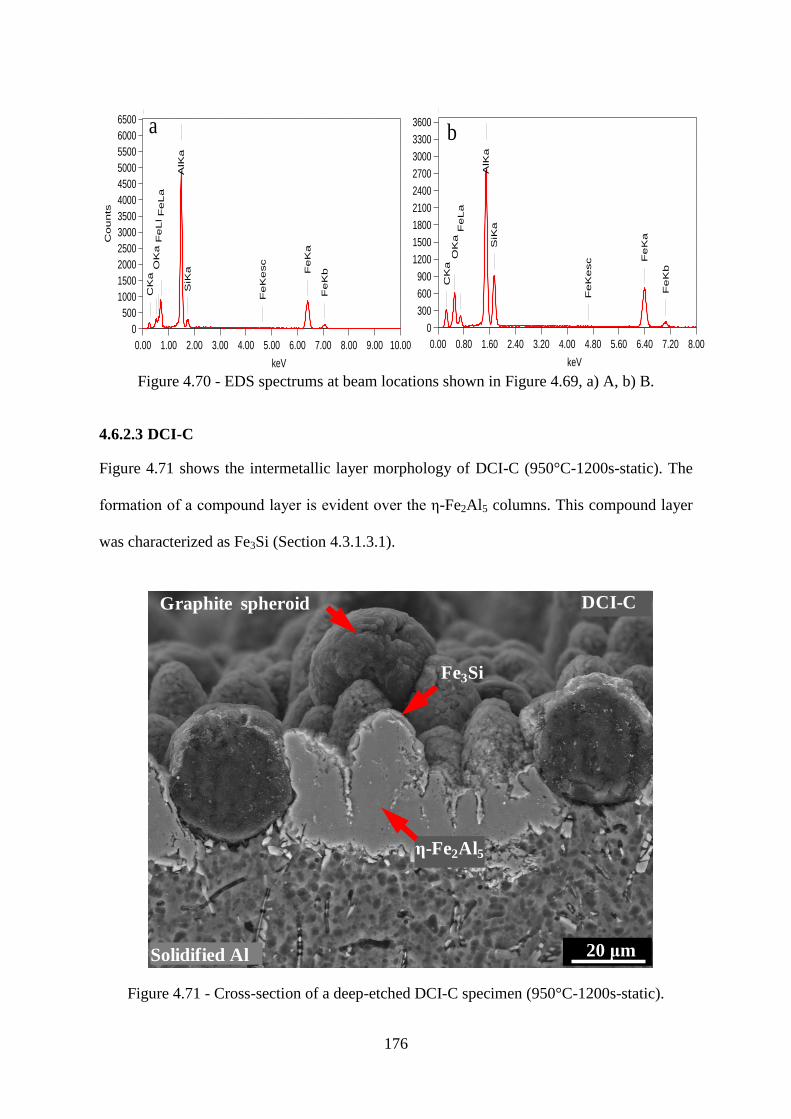
176
Figure 4.70 - EDS spectrums at beam locations shown in Figure 4.69, a) A, b) B.
4.6.2.3 DCI-C
Figure 4.71 shows the intermetallic layer morphology of DCI-C (950°C-1200s-static). The
formation of a compound layer is evident over the ε-Fe2Al5 columns. This compound layer
was characterized as Fe3Si (Section 4.3.1.3.1).
Figure 4.71 - Cross-section of a deep-etched DCI-C specimen (950°C-1200s-static).
0.00 0.80 1.60 2.40 3.20 4.00 4.80 5.60 6.40 7.20 8.00
keV
010
0
300
600
900
1200
1500
1800
2100
2400
2700
3000
3300
3600
Co
un
ts
CK
aO
Ka
AlK
aS
iKaFe
La
Fe
Ke
sc F
eK
a
Fe
Kb
0.00 1.00 2.00 3.00 4.00 5.00 6.00 7.00 8.00 9.00 10.00
keV
012
0
500
1000
1500
2000
2500
3000
3500
4000
4500
5000
5500
6000
6500
Co
un
ts
CK
aO
Ka
AlK
aS
iKa
Fe
LlF
eL
a
Fe
Ke
sc
Fe
Ka
Fe
Kb
a b
20 μm
Fe3Si
ε-Fe2Al5
Graphite spheroid DCI-C
Solidified Al
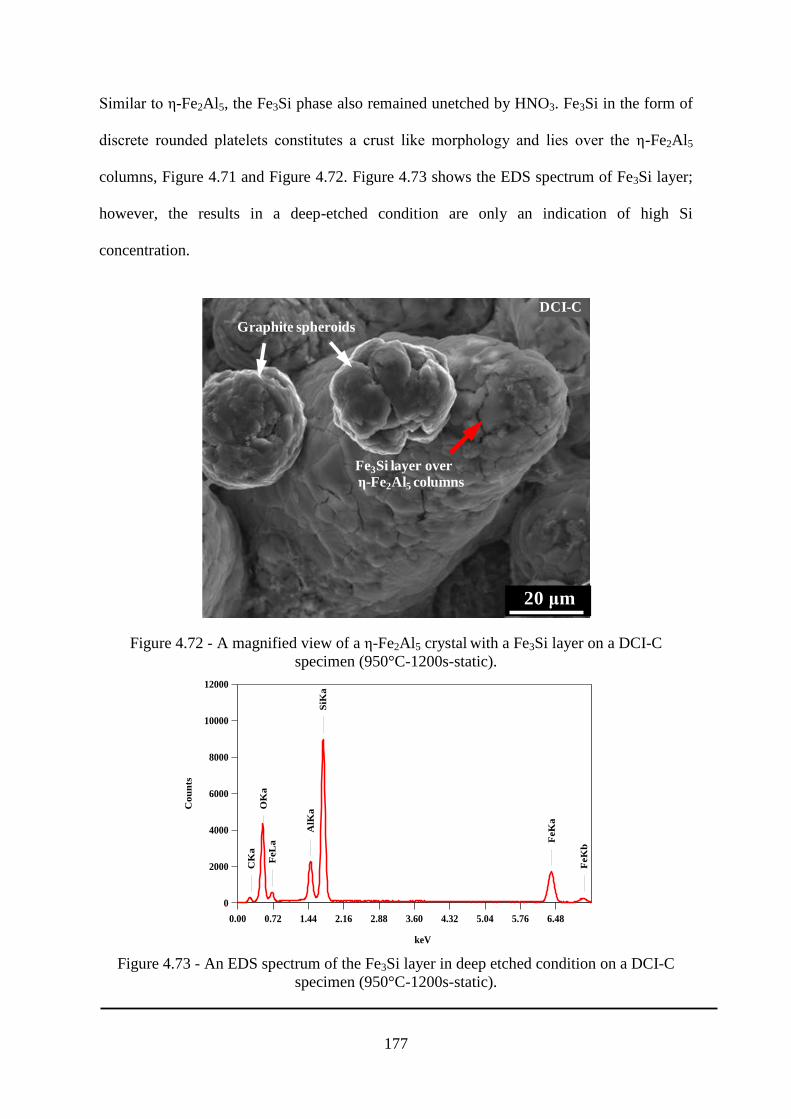
177
Similar to ε-Fe2Al5, the Fe3Si phase also remained unetched by HNO3. Fe3Si in the form of
discrete rounded platelets constitutes a crust like morphology and lies over the ε-Fe2Al5
columns, Figure 4.71 and Figure 4.72. Figure 4.73 shows the EDS spectrum of Fe3Si layer;
however, the results in a deep-etched condition are only an indication of high Si
concentration.
Figure 4.72 - A magnified view of a ε-Fe2Al5 crystal with a Fe3Si layer on a DCI-C
specimen (950°C-1200s-static).
Figure 4.73 - An EDS spectrum of the Fe3Si layer in deep etched condition on a DCI-C
specimen (950°C-1200s-static).
20 μm
Fe3Si layer over
ε-Fe2Al5 columns
Graphite spheroids
DCI-C
0.00 0.72 1.44 2.16 2.88 3.60 4.32 5.04 5.76 6.48
keV
0
2000
4000
6000
8000
10000
12000
Cou
nts
CK
a
OK
a
AlK
a
SiK
a
FeL
a FeK
a
FeK
b
178
Chapter References
[1] S.G. Denner, R.D. Jones, R.J. Thomas, Iron and Steel International, 48 (1975) 241-252.
[2] A. Bouayad, C. Gerometta, A. Belkebir, A. Ambari, Materials Science Engineering A,
A363 (2003) 53-61.
[3] T. Heumann, S. Dittrich, Zeitschrift Fuer Metallkunde, 50 (1959) 617-625.
[4] R.W. Richards, R.D. Jones, P.D. Clements, H. Clarke, International Materials Reviews,
39 (1994) 191-212.
[5] P. Villars, L.D. Calvert, Pearson‟s Handbook of Crystallographic Data for Inter-
metallic Phases, 2nd ed., ASM International, Materials Park, Ohio, 1991.
[6] D. Balloy, J.C. Tissier, M.L. Giorgi, M. Briant, Metallurgical and Materials Transactions
A, 41 (2010) 2366-2376.
[7] H. Baker, ASM Handbook-Alloy Phase Diagrams, ASM International, Materials Park,
Ohio, 1992.
[8] T. Maitra, S.P. Gupta, Materials Characterization, 49 (2003) 293-311.
[9] H.R. Shahverdi, M.R. Ghomashchi, S. Shabestari, J. Hejazi, Journal of Materials
Processing Technology, 124 (2002) 345-352.
[10] V.I. Dybkov, Reaction Diffusion and Solid State Chemical Kinetics, The IPMS
Publications, Kyiv, 2002.
[11] V.N. Eremenko (Ed.), The Physical Chemistry of Inorganic Materials, Vol. 3, Kiev,
1988.
[12] V.N. Yeremenko, Y.V. Natanzon, V.I. Dybkov, Journal of Materials Science, 16 (1981)
1748-1756.
[13] C. Xa, W. Gao, Materials Research Innovations, 3 (2000), 231-235.

179
CHAPTER 5 : DISCUSSION
Introduction
To understand the liquid Al corrosion characteristics of cast irons and steels, firstly, the
corrosion rates of these materials were discussed with regard to compositions and
microstructures. It was recognized that there are two aspects to understand the mechanisms
and behaviour of corrosion of ferrous alloys in Al melts. One is the advance of substrate/ε-
Fe2Al5 interface towards the Fe-substrate, and other the dissolution and/or spallation of the
Fe-Al intermetallic layer into the melt. In order to understand these characteristics of cast
irons and steels, intermetallic compound formation at substrate/ε-Fe2Al5 interfaces was
analysed in detail and compared with the corrosion rates of these materials. Subsequently,
the intermetallic layer growth characteristics of steel and cast irons were analyzed and
compared with the corrosion rates. Last section describes the effect of Si on dissolution,
growth and nature of the intermetallic layers of cast irons.
5.1 Liquid Al Corrosion Resistance of Cast Irons and Steels
5.1.1 Cast Irons and Corrosion Resistance
The obtained cast iron microstructures chiefly depend upon the amount and type of each
compositional constituent added, and many other variables such as cooling rate and
inoculation [1]. Therefore, achieving the desired cast-microstructures of cast irons requires a
tight control of these variables. Cast irons can be regarded as natural composites with
graphite particles embedded in a matrix of Fe, and the Fe matrix can comprise various
phases such as pearlite, ferrite, and cementite. Thus cast irons generally present an
extremely complex metallurgical system. The liquid Al corrosion resistance of cast irons
could depend upon the following factors:

180
a) Cast irons comprise various phases such as ferrite, pearlite and cementite. Each of these
phases can have different corrosion resistance. The fraction and high temperature stability
of these phases chiefly relies upon cast iron composition. Moreover, the different alloying
elements present in these phases may have different interdiffusion potential with Al,
which can also influence the corrosion rate.
b) Graphite particles could act as a physical barrier to the liquid Al attack. Cast irons
comprise graphite of various shapes and their fraction and morphology are primarily
controlled by the alloy composition.
The effect of these factors on liquid Al corrosion resistance of cast irons is discussed in the
following sections.
5.1.2 GCIs
5.1.2.1 Effect of Microstructure and Composition
The amount of ferrite, pearlite, cementite and graphite in a cast iron can be controlled by
selecting a chemical composition. However, while holding at 850°C or 950°C, pearlite and
cementite can start to transform into austenite and also result in a greater graphite volume in
cast irons [1]. Thus the fraction of pearlite and cementite present in experimental alloys
before testing is indicative of C present in the cast iron matrix. The stability of cementite and
pearlite at elevated temperatures chiefly relies upon the chemical composition of cast iron.
Being dependent upon several factors (Section 5.1.1), the liquid Al corrosion resistance of
cast irons could present a complex relationship to the cast iron composition. This may be a
reason that, previous research efforts presented in [2-3], were unable to establish a
relationship between the liquid Al corrosion resistance of GCIs and chemical composition.
Figure 5.1(a) shows an example of the ranking of GCIs according to the liquid Al corrosion
resistance, data is taken from [3]. These materials were tested at 900ºC for 6 hours, details

181
are in Section 2.3. They [3] only compared the corrosion resistance of cast irons against the
chemical composition; no attempts were made to reveal the effect of cast iron
microstructure. It is to be noted that, those investigations were carried out using static Al
melt. Compared to the average value of the corrosion rate, present results of 850ºC-static
conditions showed a large difference in the corrosion rates of two specimens of each GCI
(Figure 4.1). However, the introduction of forced flow melt conditions depicted a clear
picture of the corrosion resistance of GCIs. Moreover, the details of the surface condition
and number of specimens for each test were not noted in [3]. In the present work, the as-cast
surfaces of cast irons were found to differ to a larger extent than the bulk, and made the
comparison of corrosion resistance difficult, details are found in Appendix B. Thus in the
current work, specimens with finished surfaces was used. If the specimens with as-cast
surfaces were used for the results presented in [3], comparison of the corrosion resistance of
GCIs could be more difficult.
In the results from literature, Figure 5.1(a), P containing cast irons were excluded because
mechanical properties of cast irons deteriorate even with small additions of P. In the current
work, the cast irons were alloyed with only those alloying elements which are well
established to improve the high temperature properties of cast irons, details are found in
Section 2.1. Looking at the results from literature [3], a correlation between the chemical
composition and corrosion resistance of cast irons cannot be established, for example GCI-1
and GCI-2 have similar corrosion resistance but entirely different chemical composition.
Similarly, the composition of GCI-6 is close to GCI-8 but GCI-8 dissolved at a higher rate.
Other example is GCI-11 and GCI-12, being different chemical compositions showed a
similar corrosion resistance. In the literature [3], the microstructures of cast irons were not
investigated.
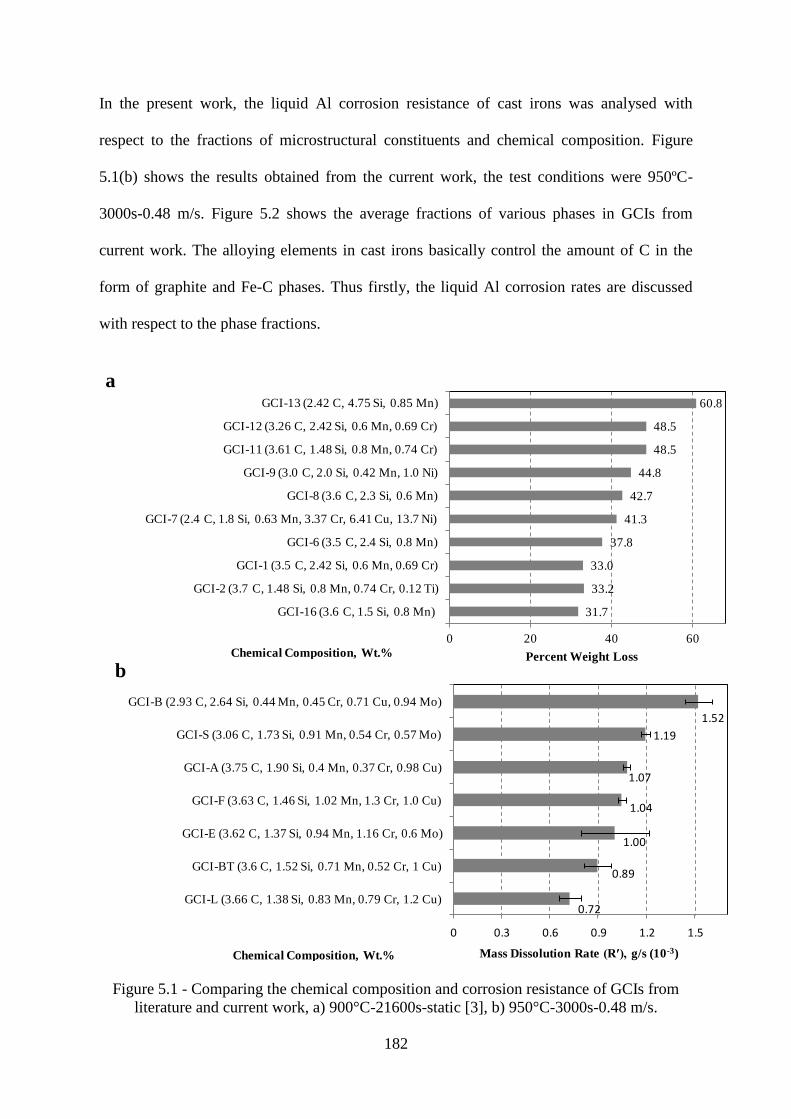
182
In the present work, the liquid Al corrosion resistance of cast irons was analysed with
respect to the fractions of microstructural constituents and chemical composition. Figure
5.1(b) shows the results obtained from the current work, the test conditions were 950ºC-
3000s-0.48 m/s. Figure 5.2 shows the average fractions of various phases in GCIs from
current work. The alloying elements in cast irons basically control the amount of C in the
form of graphite and Fe-C phases. Thus firstly, the liquid Al corrosion rates are discussed
with respect to the phase fractions.
Figure 5.1 - Comparing the chemical composition and corrosion resistance of GCIs from
literature and current work, a) 900°C-21600s-static [3], b) 950°C-3000s-0.48 m/s.
31.7
33.2
33.0
37.8
41.3
42.7
44.8
48.5
48.5
60.8
0 20 40 60
GCI-16 (3.6 C, 1.5 Si, 0.8 Mn)
GCI-2 (3.7 C, 1.48 Si, 0.8 Mn, 0.74 Cr, 0.12 Ti)
GCI-1 (3.5 C, 2.42 Si, 0.6 Mn, 0.69 Cr)
GCI-6 (3.5 C, 2.4 Si, 0.8 Mn)
GCI-7 (2.4 C, 1.8 Si, 0.63 Mn, 3.37 Cr, 6.41 Cu, 13.7 Ni)
GCI-8 (3.6 C, 2.3 Si, 0.6 Mn)
GCI-9 (3.0 C, 2.0 Si, 0.42 Mn, 1.0 Ni)
GCI-11 (3.61 C, 1.48 Si, 0.8 Mn, 0.74 Cr)
GCI-12 (3.26 C, 2.42 Si, 0.6 Mn, 0.69 Cr)
GCI-13 (2.42 C, 4.75 Si, 0.85 Mn)
Percent Weight Loss
0.72
0.89
1.00
1.04
1.07
1.19
1.52
0 0.3 0.6 0.9 1.2 1.5
GCI-L (3.66 C, 1.38 Si, 0.83 Mn, 0.79 Cr, 1.2 Cu)
GCI-BT (3.6 C, 1.52 Si, 0.71 Mn, 0.52 Cr, 1 Cu)
GCI-E (3.62 C, 1.37 Si, 0.94 Mn, 1.16 Cr, 0.6 Mo)
GCI-F (3.63 C, 1.46 Si, 1.02 Mn, 1.3 Cr, 1.0 Cu)
GCI-A (3.75 C, 1.90 Si, 0.4 Mn, 0.37 Cr, 0.98 Cu)
GCI-S (3.06 C, 1.73 Si, 0.91 Mn, 0.54 Cr, 0.57 Mo)
GCI-B (2.93 C, 2.64 Si, 0.44 Mn, 0.45 Cr, 0.71 Cu, 0.94 Mo)
a
b
Mass Dissolution Rate (R′), g/s (10-3)
Chemical Composition, Wt.%
Chemical Composition, Wt.%
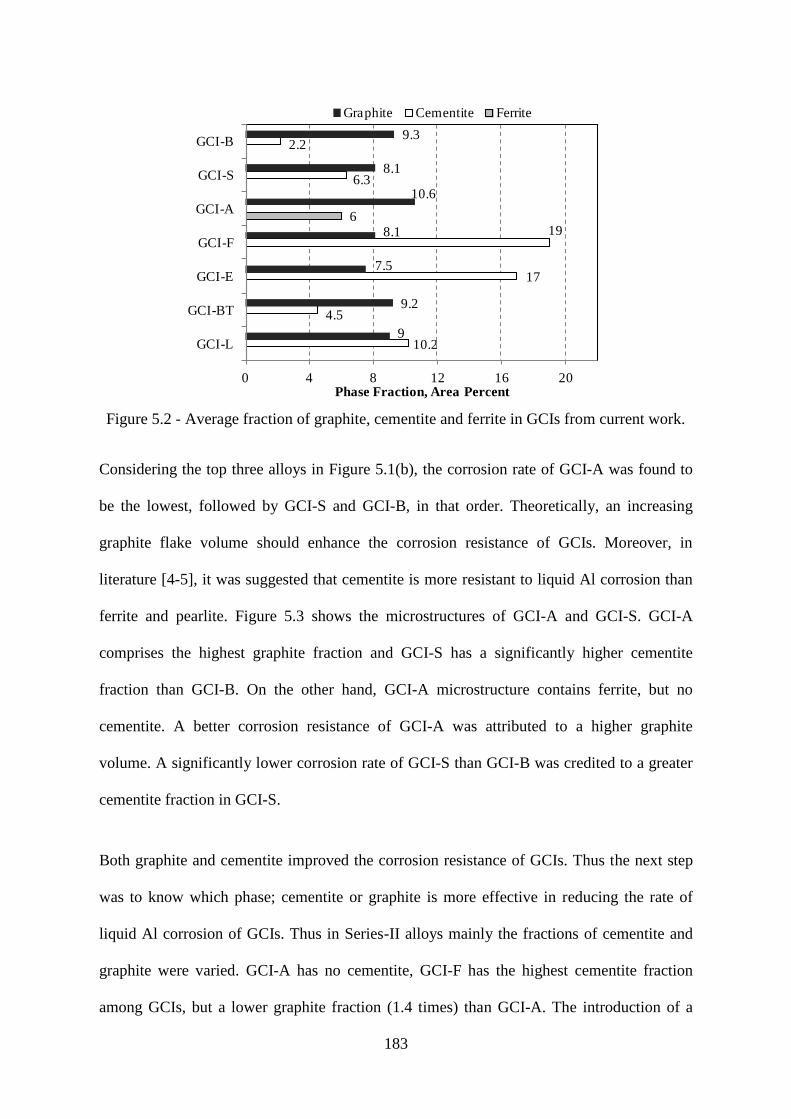
183
Figure 5.2 - Average fraction of graphite, cementite and ferrite in GCIs from current work.
Considering the top three alloys in Figure 5.1(b), the corrosion rate of GCI-A was found to
be the lowest, followed by GCI-S and GCI-B, in that order. Theoretically, an increasing
graphite flake volume should enhance the corrosion resistance of GCIs. Moreover, in
literature [4-5], it was suggested that cementite is more resistant to liquid Al corrosion than
ferrite and pearlite. Figure 5.3 shows the microstructures of GCI-A and GCI-S. GCI-A
comprises the highest graphite fraction and GCI-S has a significantly higher cementite
fraction than GCI-B. On the other hand, GCI-A microstructure contains ferrite, but no
cementite. A better corrosion resistance of GCI-A was attributed to a higher graphite
volume. A significantly lower corrosion rate of GCI-S than GCI-B was credited to a greater
cementite fraction in GCI-S.
Both graphite and cementite improved the corrosion resistance of GCIs. Thus the next step
was to know which phase; cementite or graphite is more effective in reducing the rate of
liquid Al corrosion of GCIs. Thus in Series-II alloys mainly the fractions of cementite and
graphite were varied. GCI-A has no cementite, GCI-F has the highest cementite fraction
among GCIs, but a lower graphite fraction (1.4 times) than GCI-A. The introduction of a
6
10.2
4.5
17
19
6.3
2.2
9
9.2
7.5
8.1
10.6
8.1
9.3
0 4 8 12 16 20
GCI-L
GCI-BT
GCI-E
GCI-F
GCI-A
GCI-S
GCI-B
Phase Fraction, Area Percent
Graphite Cementite Ferrite
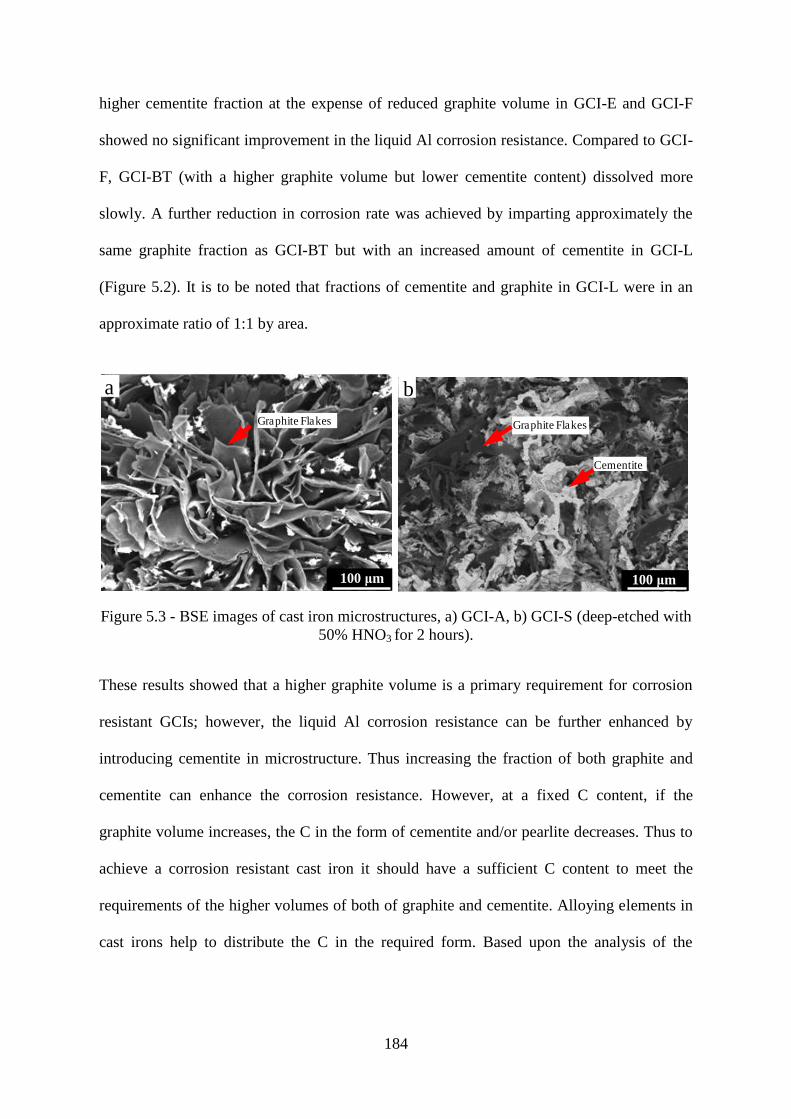
184
higher cementite fraction at the expense of reduced graphite volume in GCI-E and GCI-F
showed no significant improvement in the liquid Al corrosion resistance. Compared to GCI-
F, GCI-BT (with a higher graphite volume but lower cementite content) dissolved more
slowly. A further reduction in corrosion rate was achieved by imparting approximately the
same graphite fraction as GCI-BT but with an increased amount of cementite in GCI-L
(Figure 5.2). It is to be noted that fractions of cementite and graphite in GCI-L were in an
approximate ratio of 1:1 by area.
Figure 5.3 - BSE images of cast iron microstructures, a) GCI-A, b) GCI-S (deep-etched with
50% HNO3 for 2 hours).
These results showed that a higher graphite volume is a primary requirement for corrosion
resistant GCIs; however, the liquid Al corrosion resistance can be further enhanced by
introducing cementite in microstructure. Thus increasing the fraction of both graphite and
cementite can enhance the corrosion resistance. However, at a fixed C content, if the
graphite volume increases, the C in the form of cementite and/or pearlite decreases. Thus to
achieve a corrosion resistant cast iron it should have a sufficient C content to meet the
requirements of the higher volumes of both of graphite and cementite. Alloying elements in
cast irons help to distribute the C in the required form. Based upon the analysis of the
100 μm
Graphite Flakes Graphite Flakes
Cementite
100 μm
a b
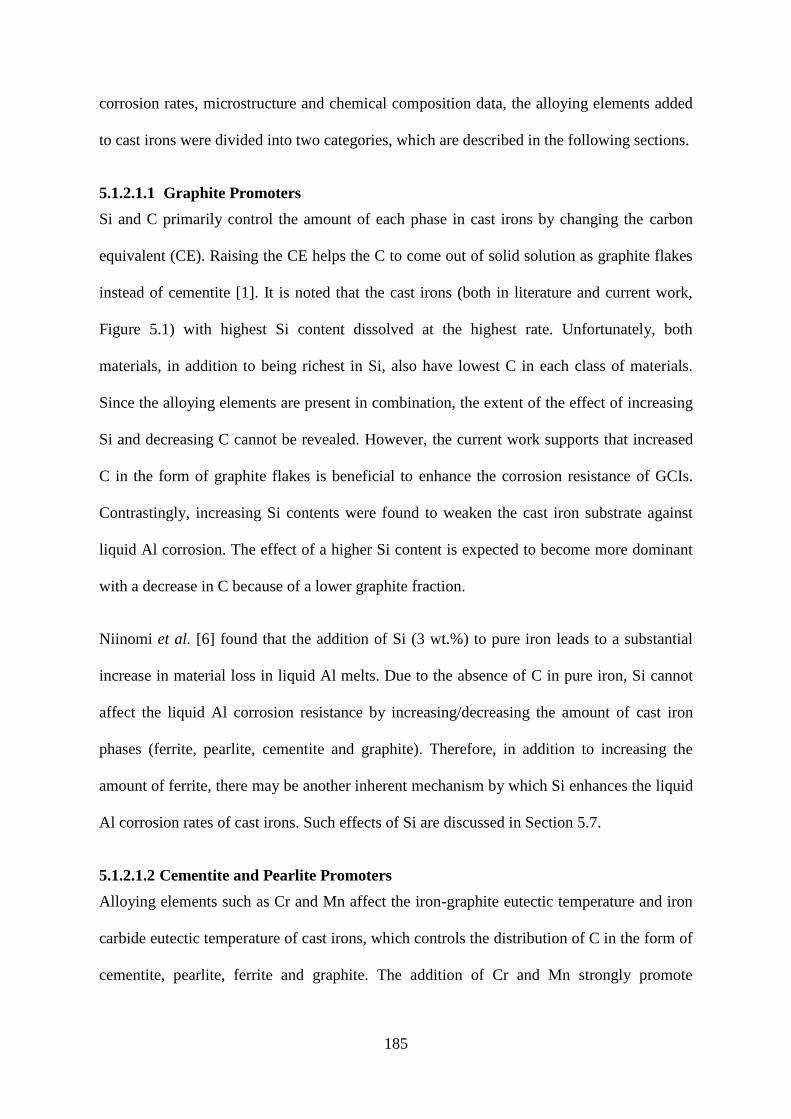
185
corrosion rates, microstructure and chemical composition data, the alloying elements added
to cast irons were divided into two categories, which are described in the following sections.
5.1.2.1.1 Graphite Promoters
Si and C primarily control the amount of each phase in cast irons by changing the carbon
equivalent (CE). Raising the CE helps the C to come out of solid solution as graphite flakes
instead of cementite [1]. It is noted that the cast irons (both in literature and current work,
Figure 5.1) with highest Si content dissolved at the highest rate. Unfortunately, both
materials, in addition to being richest in Si, also have lowest C in each class of materials.
Since the alloying elements are present in combination, the extent of the effect of increasing
Si and decreasing C cannot be revealed. However, the current work supports that increased
C in the form of graphite flakes is beneficial to enhance the corrosion resistance of GCIs.
Contrastingly, increasing Si contents were found to weaken the cast iron substrate against
liquid Al corrosion. The effect of a higher Si content is expected to become more dominant
with a decrease in C because of a lower graphite fraction.
Niinomi et al. [6] found that the addition of Si (3 wt.%) to pure iron leads to a substantial
increase in material loss in liquid Al melts. Due to the absence of C in pure iron, Si cannot
affect the liquid Al corrosion resistance by increasing/decreasing the amount of cast iron
phases (ferrite, pearlite, cementite and graphite). Therefore, in addition to increasing the
amount of ferrite, there may be another inherent mechanism by which Si enhances the liquid
Al corrosion rates of cast irons. Such effects of Si are discussed in Section 5.7.
5.1.2.1.2 Cementite and Pearlite Promoters
Alloying elements such as Cr and Mn affect the iron-graphite eutectic temperature and iron
carbide eutectic temperature of cast irons, which controls the distribution of C in the form of
cementite, pearlite, ferrite and graphite. The addition of Cr and Mn strongly promote

186
cementite and pearlite in cast irons. Cu is of dual character: it promotes pearlite as well as
graphite [7].
Introduction of cementite to cast iron substrates was found to enhance the liquid Al
corrosion resistance. GCI-BT performed better than GCI-E and GCI-F. Both GCI-E and
GCI-F contained about 1.2 wt.% Cr and 1 wt.% Mn, which imparted a lower graphite flake
fraction and a higher cementite fraction (approximately 3 times) than GCI-BT. The modified
alloy GCI-L that exhibited the lowest material loss contained a higher cementite
(approximately 2 times) fraction and a similar graphite fraction to GCI-BT. GCI-L alloy has
higher contents of Cr and Mn than GCI-BT. GCI-L also has slightly higher Cu and C
contents. The elements such as Cr and Mn bind the C in the form of cementite and pearlite
and make the matrix strong against liquid Al corrosion. Cu provides high temperature
stability to pearlite and it also substitutes for Si to some extent leading to more
graphitization.
The addition of Cu + Mo and Cu + Cr combinations in GCI-E and GCI-F, respectively, led
to almost similar dissolution rates. GCI-E and GCI-F have similar base composition thus
substitution of Cu by Mo showed no significant effect. However, the phase fractions of
cementite and graphite were found to be slightly lower in GCI-E than that of GCI-F.
The major impact of alloying elements on corrosion rates was found to result from the
fraction of each phase (ferrite, pearlite, cementite and graphite) in the cast iron
microstructure. In contrast to Si, increased C in GCIs is beneficial, whether it contributes to
the formation of graphite flakes or increases the amount of cementite. The presence of
different alloying elements in ferrite, pearlite and cementite may also directly influence the
corrosion resistance of cast irons. However, due to the predominance of the effect of the
187
cementite and graphite fractions, the direct influence of alloying elements (except Si and C)
on liquid Al corrosion resistance could not be revealed.
5.1.2.2 Optimum Composition
In order to enhance the corrosion resistance, as a rule of thumb, Si content in cast irons
should be kept as low as possible and C at the highest. However, a reduction in Si content
can lead to a lower graphite volume; on the other hand, a higher amount of C can promote
ferrite and/or eliminate cementite. The detrimental effects of increased C content (or carbon
equivalent) can be balanced by increasing the amounts of cementite promoters such as Mn
and Cr. On the basis of current findings, a GCI with a high liquid Al corrosion resistance can
be achieved with the composition stated in Table 5.1.
Table 5.1 - Recommended composition range for GCIs for a high liquid Al corrosion
resistance.
C Si Mn Cr Cu
3.7-3.8 1.35-1.45 0.8-0.9 0.7-0.8 1-1.2
The recommended composition is similar to GCI-L with a relatively higher C content. A
higher C content was recommended to introduce a higher graphite flake fraction than GCI-
L. On the other hand, a higher C content decreases the tensile strength and impact resistance
of GCIs [1]. However, it is generally agreed that a higher C content contributes to a better
thermal fatigue resistance of GCIs [8], which is also a desired property for tapping pipes and
other similar applications.
5.1.2.3 Effect of Temperature and Flow Conditions
Corrosion resistance of Series-I alloys was extensively studied to reveal the effect of
changing temperature and flow conditions. Figure 4.1 shows the obtained corrosion rates at
different exposure conditions of flow and temperature of liquid Al. In general, GCI-A
showed the best corrosion resistance and GCI-S performed better than GCI-B.
188
To know the effect of changing temperature and flow conditions, the relative increases in
corrosion rates of GCIs with a change in exposure conditions are shown in Figure 5.4. With
a rise in temperature (850°C to 950°C) under static conditions, Figure 5.4(a), GCI-A showed
a significantly lower increase in corrosion rate than GCI-S and GCI-B; however, under
forced flow, Figure 5.4(b), the material loss of the former increased by a larger amount than
the latter alloys. With a change in flow conditions from static to forced, at 850°C, GCI-A
showed a significantly lower increase than GCI-S and GCI-B, Figure 5.4(c); however, at
950°C all materials showed similar levels of increase Figure 5.4(d).
Figure 5.4 - Ratios of corrosion rates of Series-I GCIs under different changes of conditions
of liquid Al exposure, a) Static, 950°C to 850°C, b) Forced, 950°C to 850°C, c) 850°C,
forced to static, d) 950°C, forced to static.
With the rise in temperature (850°C-950°C) under static conditions, a higher graphite
volume was believed to reduce the increase in corrosion rate of GCIs. Similar effect of
graphite flakes is expected in the case of a change in melt conditions from static to dynamic
at 850°C. However, comparing the rise in temperature under forced flow, a greater graphite
fraction seems incapable of reducing the material loss to a similar extent at 950°C as it does
1.62
2.52.7
0
1
2
3
4 3.8
2.5
2.9
1.2
2.8 2.8
0
1
2
3
4
2.72.8 2.9
a b
c d
0
0.5
1
1.5
2
2.5
3
1
GCI-A GCI-S GCI-B
189
at 850°C. As mentioned before, ferrite is the weakest phase of GCIs to liquid Al corrosion,
which is related to its low C content. The CE of GCI-A is significantly higher than GCI-S
and GCI-B, thus at the exposure temperature, the depletion of C from the matrix of the
former should occur at a greater rate than the later alloys [1]. This difference of C depletion
should be greater at 950°C than at 850°C. With increase in temperature, this should result
into the weakening of the matrix of GCI-A to a greater extent than GCI-S. With rise in
temperature, under static melt conditions, a greater graphite volume can effectively resist the
increasing corrosion rate, but under forced flow a weaker matrix possibly overrides the
beneficial effect of graphite flakes.
Both GCI-S and GCI-B showed similar levels of increase with increasing severity of
exposure conditions. This was attributed to the balancing effect of a greater cementite
fraction in GCI-S and comparatively more graphite volume in GCI-B. Although, GCI-B has
a higher CE than GCI-S, but the alloying elements (Cr, Cu) in GCI-B tends to bind the C in
the form of pearlite and cementite.
5.1.3 DCIs
5.1.3.1 Effect of Composition and Microstructure
Among DCIs, DCI-T exhibited the lowest rate of material removal, followed by DCI-D and
DCI-C, in that order (Figure 4.3). DCIs contain similar contents of C but different Si
contents. The graphite fraction in all DCIs was found to be approximately the same, thus the
microstructural variables were only the ferrite and pearlite fractions. Figure 5.5 shows the Si
content and fractions of ferrite and pearlite in DCIs. Comparing DCI-T and DCI-C, a higher
amount of Si in DCI-C resulted in greater ferrite content, which was suggested to dissolve at
a higher rate than cementite or pearlite [4]. In other words, a higher C content of cast iron
matrix at exposure temperatures means greater resistance to liquid Al corrosion.
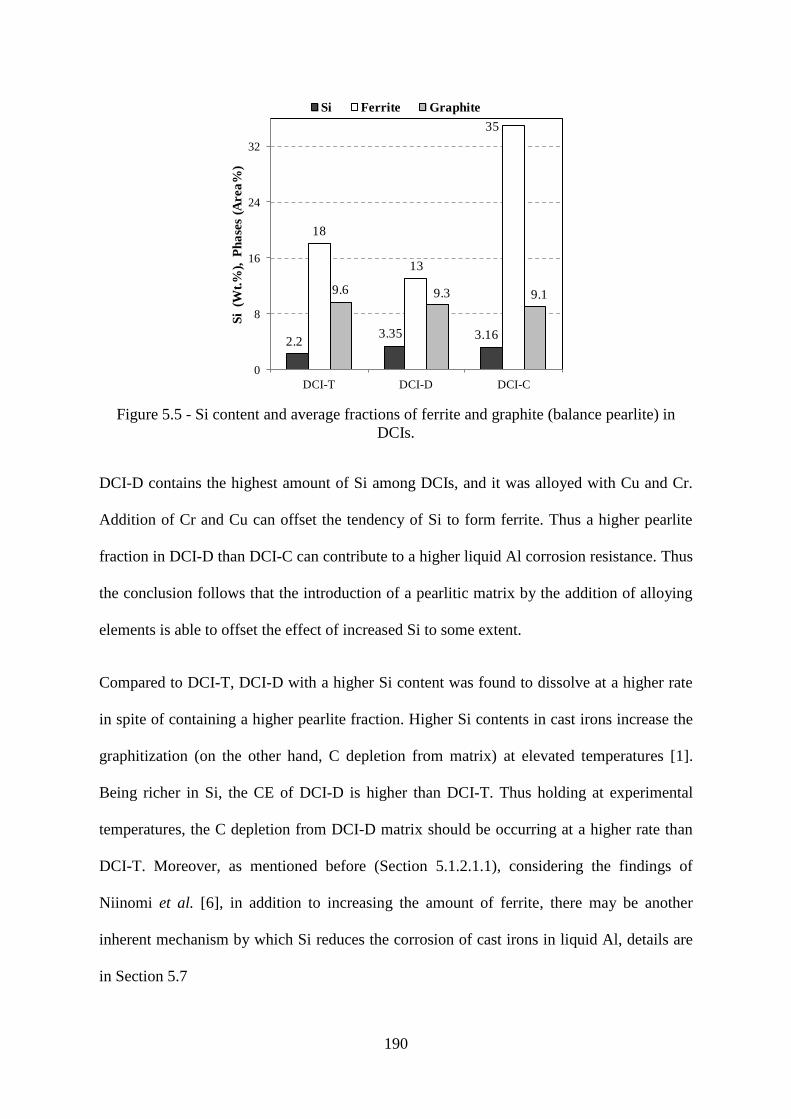
190
Figure 5.5 - Si content and average fractions of ferrite and graphite (balance pearlite) in
DCIs.
DCI-D contains the highest amount of Si among DCIs, and it was alloyed with Cu and Cr.
Addition of Cr and Cu can offset the tendency of Si to form ferrite. Thus a higher pearlite
fraction in DCI-D than DCI-C can contribute to a higher liquid Al corrosion resistance. Thus
the conclusion follows that the introduction of a pearlitic matrix by the addition of alloying
elements is able to offset the effect of increased Si to some extent.
Compared to DCI-T, DCI-D with a higher Si content was found to dissolve at a higher rate
in spite of containing a higher pearlite fraction. Higher Si contents in cast irons increase the
graphitization (on the other hand, C depletion from matrix) at elevated temperatures [1].
Being richer in Si, the CE of DCI-D is higher than DCI-T. Thus holding at experimental
temperatures, the C depletion from DCI-D matrix should be occurring at a higher rate than
DCI-T. Moreover, as mentioned before (Section 5.1.2.1.1), considering the findings of
Niinomi et al. [6], in addition to increasing the amount of ferrite, there may be another
inherent mechanism by which Si reduces the corrosion of cast irons in liquid Al, details are
in Section 5.7
2.23.35 3.16
18
13
35
9.6 9.3 9.1
0
8
16
24
32
DCI-T DCI-D DCI-C
Si (
Wt.
%),
P
ha
ses
(Area
%)
Si Ferrite Graphite
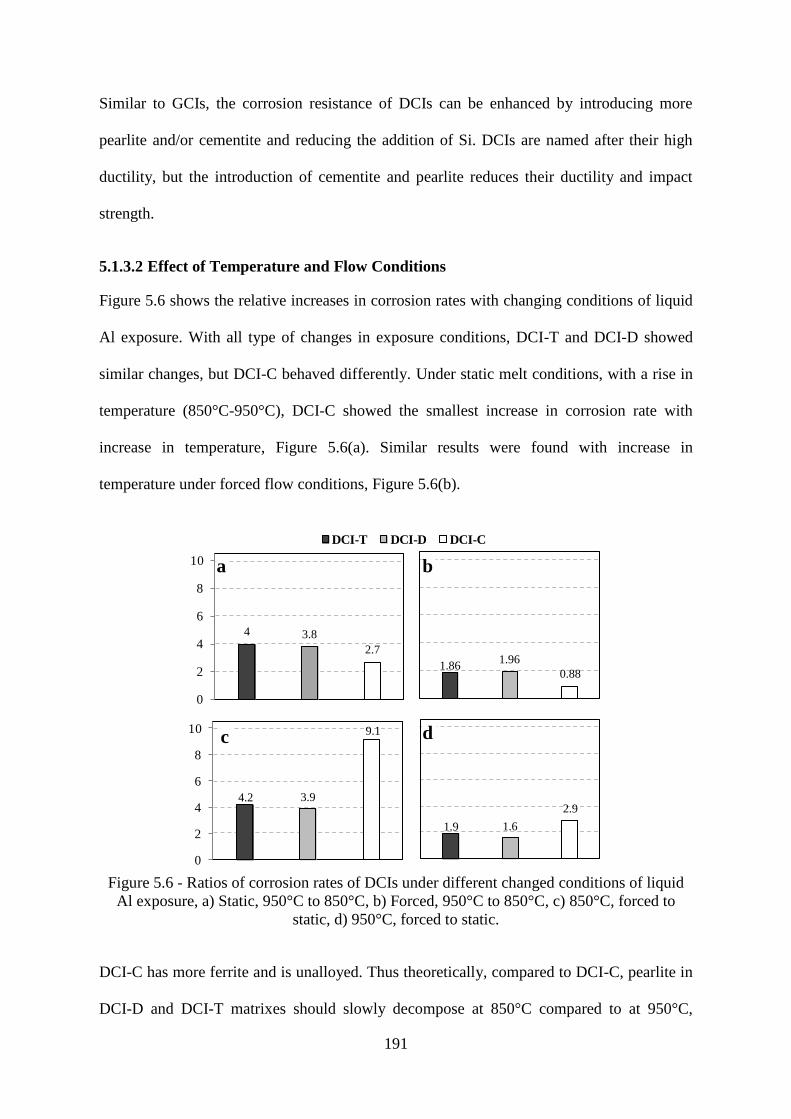
191
Similar to GCIs, the corrosion resistance of DCIs can be enhanced by introducing more
pearlite and/or cementite and reducing the addition of Si. DCIs are named after their high
ductility, but the introduction of cementite and pearlite reduces their ductility and impact
strength.
5.1.3.2 Effect of Temperature and Flow Conditions
Figure 5.6 shows the relative increases in corrosion rates with changing conditions of liquid
Al exposure. With all type of changes in exposure conditions, DCI-T and DCI-D showed
similar changes, but DCI-C behaved differently. Under static melt conditions, with a rise in
temperature (850°C-950°C), DCI-C showed the smallest increase in corrosion rate with
increase in temperature, Figure 5.6(a). Similar results were found with increase in
temperature under forced flow conditions, Figure 5.6(b).
Figure 5.6 - Ratios of corrosion rates of DCIs under different changed conditions of liquid
Al exposure, a) Static, 950°C to 850°C, b) Forced, 950°C to 850°C, c) 850°C, forced to
static, d) 950°C, forced to static.
DCI-C has more ferrite and is unalloyed. Thus theoretically, compared to DCI-C, pearlite in
DCI-D and DCI-T matrixes should slowly decompose at 850°C compared to at 950°C,
4 3.8
2.7
0
2
4
6
8
10
1.861.96
0.88
4.2 3.9
9.1
0
2
4
6
8
10
1.9 1.6
2.9
a b
c d
0
1
2
3
4
5
6
7
8
9
10
1
DCI-T DCI-D DCI-C
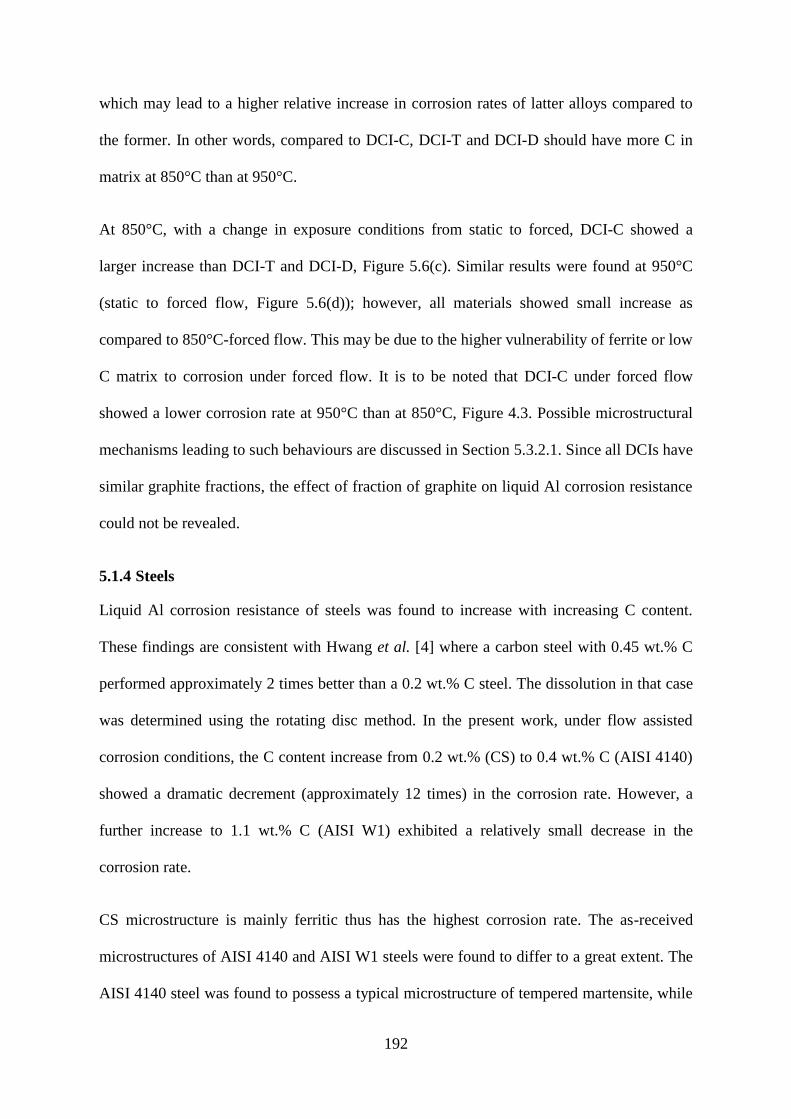
192
which may lead to a higher relative increase in corrosion rates of latter alloys compared to
the former. In other words, compared to DCI-C, DCI-T and DCI-D should have more C in
matrix at 850°C than at 950°C.
At 850°C, with a change in exposure conditions from static to forced, DCI-C showed a
larger increase than DCI-T and DCI-D, Figure 5.6(c). Similar results were found at 950°C
(static to forced flow, Figure 5.6(d)); however, all materials showed small increase as
compared to 850°C-forced flow. This may be due to the higher vulnerability of ferrite or low
C matrix to corrosion under forced flow. It is to be noted that DCI-C under forced flow
showed a lower corrosion rate at 950°C than at 850°C, Figure 4.3. Possible microstructural
mechanisms leading to such behaviours are discussed in Section 5.3.2.1. Since all DCIs have
similar graphite fractions, the effect of fraction of graphite on liquid Al corrosion resistance
could not be revealed.
5.1.4 Steels
Liquid Al corrosion resistance of steels was found to increase with increasing C content.
These findings are consistent with Hwang et al. [4] where a carbon steel with 0.45 wt.% C
performed approximately 2 times better than a 0.2 wt.% C steel. The dissolution in that case
was determined using the rotating disc method. In the present work, under flow assisted
corrosion conditions, the C content increase from 0.2 wt.% (CS) to 0.4 wt.% C (AISI 4140)
showed a dramatic decrement (approximately 12 times) in the corrosion rate. However, a
further increase to 1.1 wt.% C (AISI W1) exhibited a relatively small decrease in the
corrosion rate.
CS microstructure is mainly ferritic thus has the highest corrosion rate. The as-received
microstructures of AISI 4140 and AISI W1 steels were found to differ to a great extent. The
AISI 4140 steel was found to possess a typical microstructure of tempered martensite, while

193
the AISI W1 consisted of fine cementite globules distributed in a ferrite matrix. During
holding at the exposure temperature, martensite, cementite and ferrite should be
transforming into austenite. C in AISI 4140 steel matrix is more uniformly dispersed in the
form of martensite, while AISI W1 steel comprises ferrite and isolated cementite globules.
The existence of ferrite in AISI W1 steel (1.1 wt.% C) can be a reason that being
significantly richer in C, it showed a relatively small increase in corrosion resistance
compared to AISI 4140 (0.45 wt.% C). Moreover, addition of Mn to pure Fe has been found
to increase the liquid Al corrosion resistance [6]. Thus compared to AISI W1 steel, a higher
Mn (by 0.45 wt.%) content in 4140 may have contributed to its liquid Al corrosion
resistance.
5.1.5 Comparing DCIs, GCIs and Steel
Section 4.2 describes the obtained corrosion rates of cast irons and steels. GCIs dissolved at
a slower rate than the DCIs. The low carbon steel (CS, 0.2 wt.% C), dissolved at a
significantly higher rate than the cast irons. The difference between the corrosion rates of
GCIs and DCIs could be explained by the fact that GCIs have a lower fraction of ferrite
compared to DCIs. Current work clearly showed that cementite improves the corrosion
resistance of cast irons, and ferrite or a low carbon matrix has the opposite effect. GCIs
comprise an interconnected network of graphite flakes, which are inert with liquid Al and
difficult to pull out of the matrix compared to isolated spheroidal graphite found in DCI.
Figure 5.7 shows the examples of two types of graphite morphologies at the substrate/Al
interfaces on the specimens obtained from dynamic corrosion tests.
The interconnected network of graphite lamellas in GCIs provides a physical barrier against
liquid Al corrosion, and GCIs also have the added advantage of cementite and pearlite. In
DCIs, the graphite spheroids initially can provide protection against liquid Al attack;
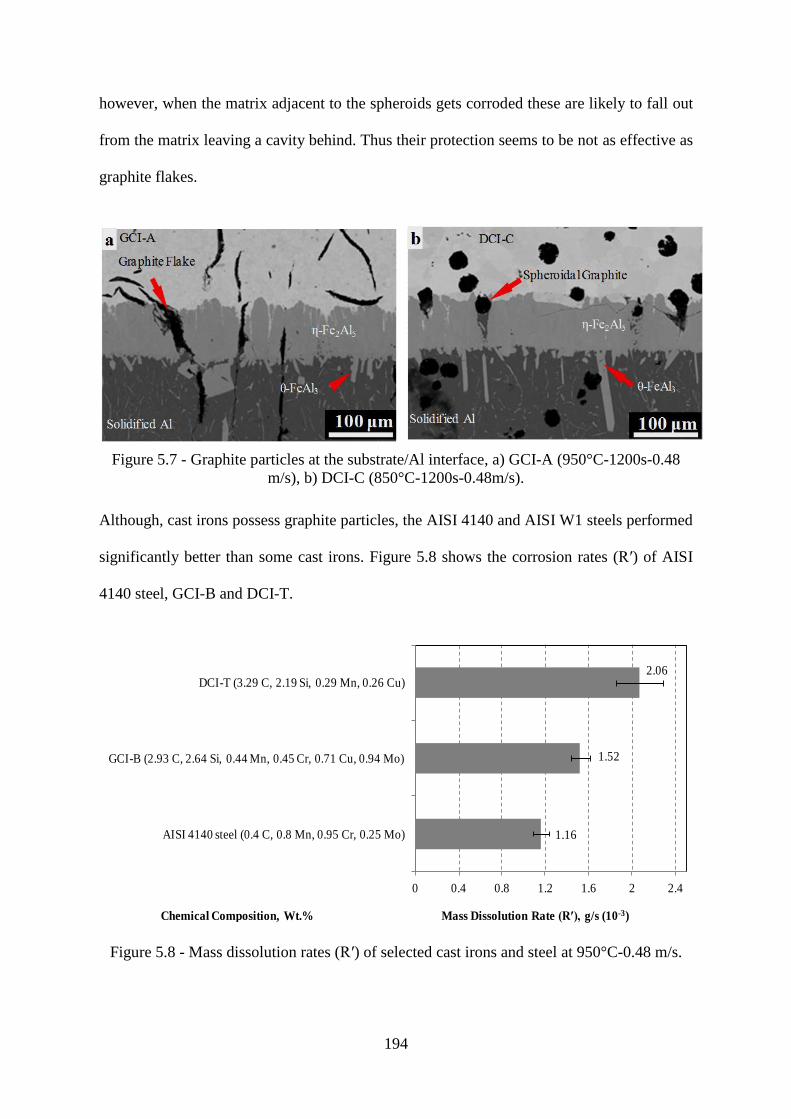
194
however, when the matrix adjacent to the spheroids gets corroded these are likely to fall out
from the matrix leaving a cavity behind. Thus their protection seems to be not as effective as
graphite flakes.
Figure 5.7 - Graphite particles at the substrate/Al interface, a) GCI-A (950°C-1200s-0.48
m/s), b) DCI-C (850°C-1200s-0.48m/s).
Although, cast irons possess graphite particles, the AISI 4140 and AISI W1 steels performed
significantly better than some cast irons. Figure 5.8 shows the corrosion rates (R′) of AISI
4140 steel, GCI-B and DCI-T.
Figure 5.8 - Mass dissolution rates (R′) of selected cast irons and steel at 950°C-0.48 m/s.
1.16
1.52
2.06
0 0.4 0.8 1.2 1.6 2 2.4
AISI 4140 steel (0.4 C, 0.8 Mn, 0.95 Cr, 0.25 Mo)
GCI-B (2.93 C, 2.64 Si, 0.44 Mn, 0.45 Cr, 0.71 Cu, 0.94 Mo)
DCI-T (3.29 C, 2.19 Si, 0.29 Mn, 0.26 Cu)
Mass Dissolution Rate (R′), g/s (10-3)Chemical Composition, Wt.%
195
AISI 4140 steel showed approximately 1.3 and 1.7 times slower rate of corrosion than GCI-
B and DCI-T, respectively. In a previous work [2], a carbon steel (0.37 wt.% C) performed
approximately 1.5 times better than a high Si (4.5 wt.%) GCI, these alloys were exposed to
static liquid Al at 690°C for 72 hours. This difference was attributed [2] to the higher
amount of ferrite in GCI than the carbon steel.
In addition to the as-cast microstructure of cast irons, Si can also affect the microstructural
transformations at exposure temperatures. The as-cast microstructure of GCI-B was pearlitic
with cementite particles, and as-cast DCT-T comprised pearlite and ferrite. The AISI 4140
steel has no Si and the GCI-B and DCI-T contains Si in significantly larger amounts. GCI-B
contained higher Si than GCI-T; however, graphite flakes and pearlite with cementite have
contributed to a higher corrosion resistance of GCI-B than GCI-T. As mentioned before, Si
depletes C from cast iron matrixes at exposure temperatures [1], thus an increase of Si
reduces the corrosion resistance of cast iron matrix. In the absence of Si and graphite, C
remains in the matrix of the 4140 steel at exposure temperatures leading to a higher
corrosion resistance than high Si cast irons. Other effects of Si on liquid Al corrosion are
discussed in Section 5.7.
5.1.6 Effect of Boronizing
Liquid Al corrosion resistance of cast irons under dynamic corrosion conditions was
increased (7-8 times) with boronizing treatment, details are found in Appendix D. An
effective boronizing treatment generally requires a finished surface [9] but in industrial
practice, the tapping pipes are used in as-cast condition. The as-cast surface of cast irons was
found to differ to a large extent than the bulk, and found to be more resistant to the liquid Al
corrosion (3-6 times) than a finished surface (Appendix B). Thus before recommending the

196
boronizing treatment for tapping pipes, issues such as economic viability and obtaining
uniform boride layers need to be addressed.
5.2 Liquid Al Corrosion Characteristics of Ferrous Alloys
Before discussing the underlying mechanisms of liquid Al corrosion of GCIs, DCIs and
steels, it is important to understand the common characteristics of compound formation and
mechanisms of corrosion of ferrous alloys in Al melts. Based upon the current research
findings, the common characteristics of liquid Al corrosion of cast irons and steels are
discussed in this section.
5.2.1 Mechanisms of Liquid Al Corrosion
Immediately after immersion into liquid Al, Fe-Al intermetallic compounds form on the
surface of ferrous alloys and, simultaneously, the ferrous substrate starts to dissolve into
liquid Al. In all the investigated ferrous materials, ε-Fe2Al5 and ζ-FeAl3 appeared as primary
reaction compounds. The predominant appearance of ε-Fe2Al5 to the exclusion of other
phases has been attributed to its anomalously high vacancy concentration; resulting in a
greater Fe/Al diffusion within ε-Fe2Al5 thus it grows rapidly [10].
The corrosion mechanisms based upon the formation and growth kinetics of intermetallic
compounds are difficult to establish because complete characterization of the formation and
growth of ζ-FeAl3 has not been achieved in the past. It has been commonly found that ζ-
FeAl3 exists in the form of a thin layer and as lath-shaped particles [11-12]. However, the
formation of these two types of morphologies was difficult to establish and the origin of the
lath-shape morphology of ζ-FeAl3 remains unclear, details are found in Section 2.2.2.
Moreover, it is difficult to establish whether ζ-FeAl3 in the form of layer and/or particles
grows during ongoing interaction with liquid Al or during solidification of Al around the
197
corroded specimen. The work presented in this section is an attempt to discover the
underlying mechanisms of ζ-FeAl3 formation and growth.
The only way to determine the corrosion mechanisms is to observe the Fe-Al interaction
zone after solidification, which may not present the actual situation while the Fe-liquid Al
interaction proceeds. This limitation is a primary barrier to determine the exact corrosion
mechanisms. Moreover, the mechanisms of flow induced corrosion may vary at different
flow speeds, such as cavitation corrosion, mass-transport controlled or phase-transport
controlled [13]. However, in a generalized case, the corrosion of ferrous substrates in Al
melts can be considered to result from one or more mechanisms as discussed below. It is
difficult to evaluate the contribution of each of the listed mechanisms towards the corrosion
of a ferrous substrate in liquid Al melts. Figure 5.7 shows the examples of corrosion of
ferrous alloys in liquid Al.
a) Both the ε-Fe2Al5 and ζ-FeAl3 phases simultaneously form by the Fe-substrate/liquid Al
interaction or the former grows first and then interacts with liquid Al to form ζ-FeAl3.
Simultaneously, the ζ-FeAl3 phase may break away owing to the presence of convection
currents in Al melt.
b) Both ε-Fe2Al5 and ζ-FeAl3 or only ε-Fe2Al5 may dissolve and/or spall into Al melt,
which may be the principal mode of corrosion under forced flow melt conditions.
However, ε-Fe2Al5 may be simultaneously transforming into ζ-FeAl3 during dissolution.
c) Fe atoms diffuse directly into liquid Al owing to the existence of a concentration gradient
between the intermetallic layer and Al melt.
In the current work, the typical growth direction of ζ-FeAl3 crystallites was found be
perpendicular to the specimen surface (Figure 4.7 and Figure 4.9). Relatively smaller size
particles in the solidified Al layer appeared as broken pieces of the large particles that were
198
grown at ε-Fe2Al5 surface. If ζ-FeAl3 crystals form during solidification, these should
precipitate by a eutectic reaction at 655°C (Figure 2.5). Growth and disintegration of large ζ-
FeAl3 particles into smaller pieces seems less probable during the short period of
solidification. At 950°C, ζ-FeAl3 has a larger negative (- 93862 J/mol) Gibbs free energy of
formation compared to ε-Fe2Al5 (- 87348 J/mol) [14] and the calculated surface free
energies of these compounds are similar (differ by less than 1%) [15]. In Fe-Al interaction at
690°C, Ryabov [16] suggested that ζ-FeAl3 was initially formed being lowest in Fe content.
Moreover, there is a basis for hypothesizing that these intermetallics can grow
simultaneously. Both phases were found to exist at the Fe-Al interface even for a one second
contact time between Fe and liquid Al [17]. According to another opinion [15], when the
surface energies of two compounds (ε-Fe2Al5, ζ-FeAl3) are close, the preferred growth of ε-
Fe2Al5 can be due to the kinetic hindrances to the formation of ζ-FeAl3 because the latter
phase has significantly larger number of atoms per unit cell (ε-Fe2Al5-24 atoms [18], ζ-
FeAl3-100 atoms [19]). However, ζ-FeAl3 formation is thermodynamically favoured over ε-
Fe2Al5. Thus the nucleation and growth of ζ-FeAl3 is possible during ongoing liquid Al
interaction with Fe-substrate.
Significantly smaller size particles (Figure 4.8) were also found uniformly dispersed within
the solidified Al. These particles can form during solidification because the Al melt contains
some amount of dissolved Fe. Also, with the passage of time, the large ζ-FeAl3 crystals may
start to dissolve into the melt leading to the smaller sized particles.
In agreement with the literature, the orthorhombic crystals of ε-Fe2Al5 were found to grow
preferentially in the [001] direction, which is the shortest axis of the ε-Fe2Al5 unit cell. In
the current work, the preferred growth direction of ζ-FeAl3 was found to be the [010]
direction of its monoclinic unit cell, which is also the shortest axis of the ζ-FeAl3 unit cell
199
(Figure 4.13). Similarly to the faster Al/Fe diffusion in ε-Fe2Al5 along c-axis [10], the
diffusion of Al/Fe can be faster along the b-axis of ζ-FeAl3 leading to a significantly higher
growth along this direction. A high rate of Al/Fe interdiffusion can lead to the growth of lath
shape ζ-FeAl3 particles in a direction normal to the ε-Fe2Al5 surface. The thin ζ-FeAl3
stratum that appears continuous in optical or SEM images was identified using EBSD as
polycrystalline. Therefore, the thin layer actually comprises growing ζ-FeAl3 particles or the
remaining roots of fractured ζ-FeAl3 particles. The majority of dispersed ζ-FeAl3 crystals
may be attached to the ε-Fe2Al5 during interaction. It was therefore believed that ζ-FeAl3
can form during ongoing corrosion of ferrous alloys in Al melts.
Corrosion mechanisms of the ferrous materials based upon the formation and growth of ε-
Fe2Al5 and ζ-FeAl3 phases can be divided into two stages as described below, Figure 5.9
shows a schematic of the dissolution of Fe into liquid Al under static melt conditions.
5.2.1.1 Nucleation and Reaction
Immediately after immersion of a ferrous substrate into liquid Al, the nucleation of ε-
Fe2Al5/ζ-FeAl3 at the Fe surface starts. Thermodynamically, ζ-FeAl3 should form first and,
moreover, it requires lower amount of Fe than ε-Fe2Al5. On the other hand, a higher kinetic
hindrance of ζ-FeAl3 as proposed by [15] can lead to a slower growth rate than ε-Fe2Al5.
However, evidence presented in [17] shows that both ε-Fe2Al5 and ζ-FeAl3 phases were
present at the Fe/Al interface even for one second contact time with liquid Al, which
indicates that both phases can form simultaneously. Thus the nucleation and reaction to form
ε-Fe2Al5 and ζ-FeAl3 phases occurs in a very short time after exposure to liquid Al. In this
short period of interaction, the reaction between Fe and Al atoms governs the compound
formation, and the growth of the intermetallic layer occurs at a faster rate than the
subsequent period of interaction [20]. The possible explanation of the columnar morphology
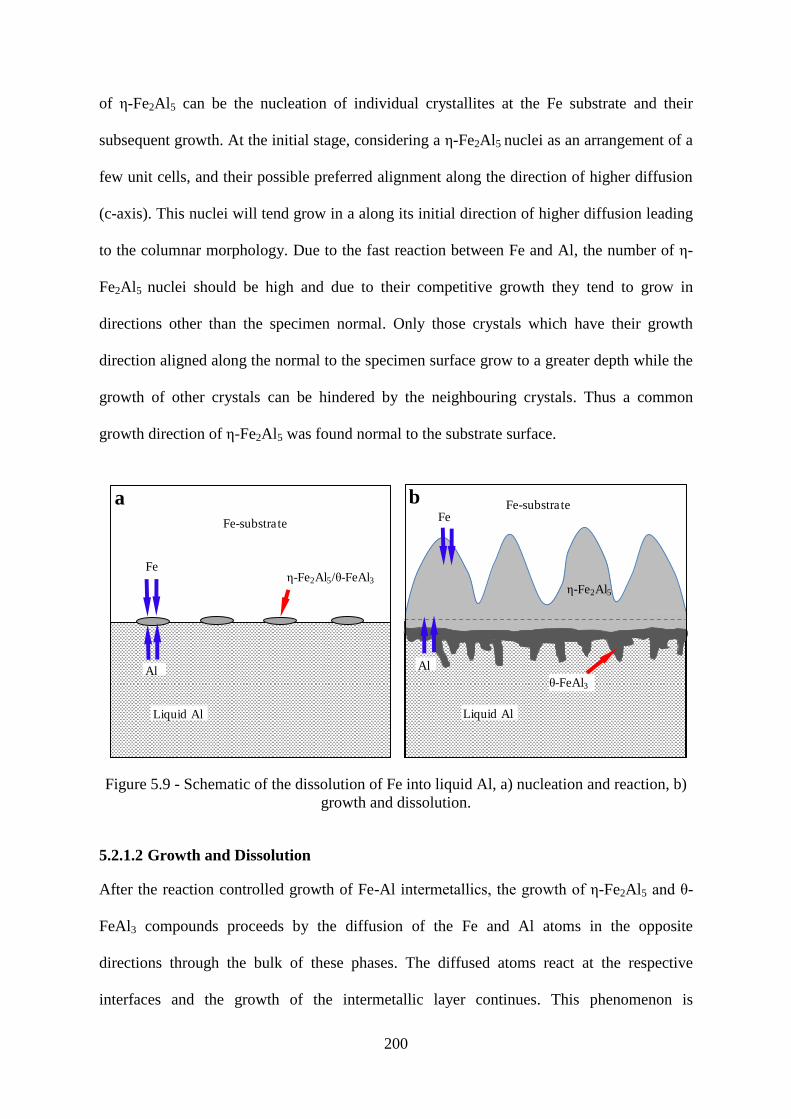
200
of ε-Fe2Al5 can be the nucleation of individual crystallites at the Fe substrate and their
subsequent growth. At the initial stage, considering a ε-Fe2Al5 nuclei as an arrangement of a
few unit cells, and their possible preferred alignment along the direction of higher diffusion
(c-axis). This nuclei will tend grow in a along its initial direction of higher diffusion leading
to the columnar morphology. Due to the fast reaction between Fe and Al, the number of ε-
Fe2Al5 nuclei should be high and due to their competitive growth they tend to grow in
directions other than the specimen normal. Only those crystals which have their growth
direction aligned along the normal to the specimen surface grow to a greater depth while the
growth of other crystals can be hindered by the neighbouring crystals. Thus a common
growth direction of ε-Fe2Al5 was found normal to the substrate surface.
Figure 5.9 - Schematic of the dissolution of Fe into liquid Al, a) nucleation and reaction, b)
growth and dissolution.
5.2.1.2 Growth and Dissolution
After the reaction controlled growth of Fe-Al intermetallics, the growth of ε-Fe2Al5 and ζ-
FeAl3 compounds proceeds by the diffusion of the Fe and Al atoms in the opposite
directions through the bulk of these phases. The diffused atoms react at the respective
interfaces and the growth of the intermetallic layer continues. This phenomenon is
Liquid Al
Al
Fe-substrate
Feε-Fe2Al5/ζ-FeAl3
a
ζ-FeAl3
Liquid Al
Fe-substrate
ε-Fe2Al5
Fe
Al
b
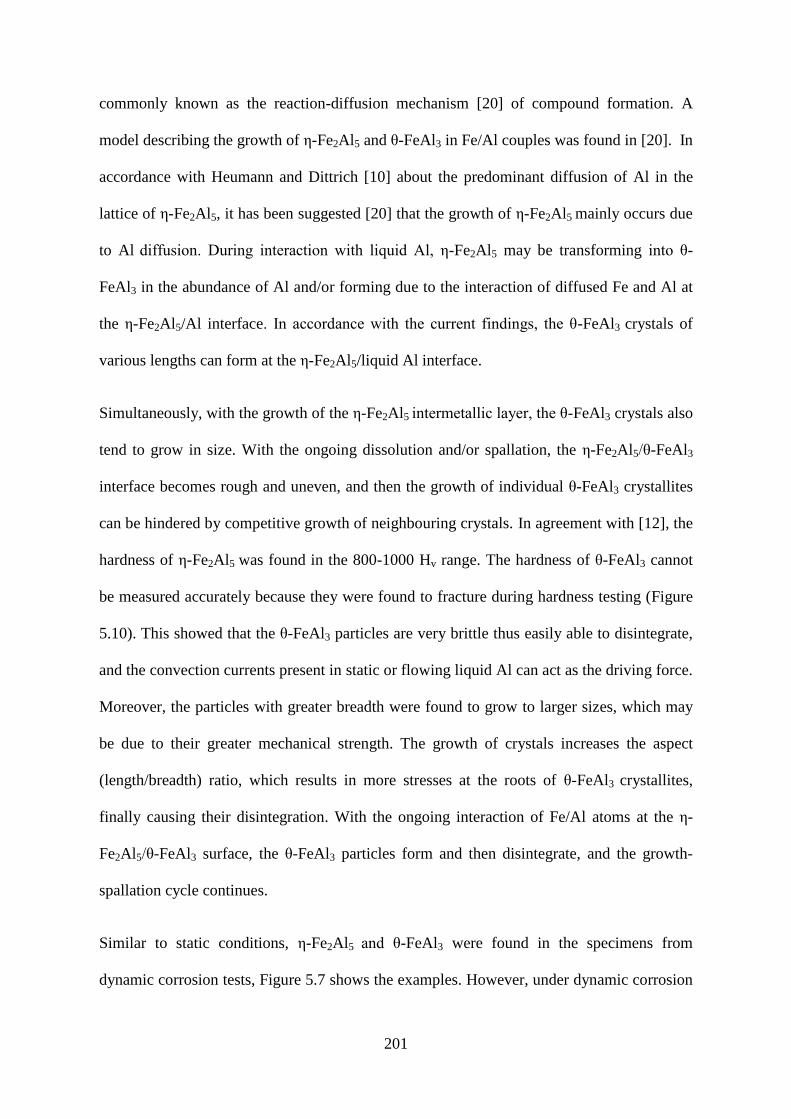
201
commonly known as the reaction-diffusion mechanism [20] of compound formation. A
model describing the growth of ε-Fe2Al5 and ζ-FeAl3 in Fe/Al couples was found in [20]. In
accordance with Heumann and Dittrich [10] about the predominant diffusion of Al in the
lattice of ε-Fe2Al5, it has been suggested [20] that the growth of ε-Fe2Al5 mainly occurs due
to Al diffusion. During interaction with liquid Al, ε-Fe2Al5 may be transforming into ζ-
FeAl3 in the abundance of Al and/or forming due to the interaction of diffused Fe and Al at
the ε-Fe2Al5/Al interface. In accordance with the current findings, the ζ-FeAl3 crystals of
various lengths can form at the ε-Fe2Al5/liquid Al interface.
Simultaneously, with the growth of the ε-Fe2Al5 intermetallic layer, the ζ-FeAl3 crystals also
tend to grow in size. With the ongoing dissolution and/or spallation, the ε-Fe2Al5/ζ-FeAl3
interface becomes rough and uneven, and then the growth of individual ζ-FeAl3 crystallites
can be hindered by competitive growth of neighbouring crystals. In agreement with [12], the
hardness of ε-Fe2Al5 was found in the 800-1000 Hv range. The hardness of ζ-FeAl3 cannot
be measured accurately because they were found to fracture during hardness testing (Figure
5.10). This showed that the ζ-FeAl3 particles are very brittle thus easily able to disintegrate,
and the convection currents present in static or flowing liquid Al can act as the driving force.
Moreover, the particles with greater breadth were found to grow to larger sizes, which may
be due to their greater mechanical strength. The growth of crystals increases the aspect
(length/breadth) ratio, which results in more stresses at the roots of ζ-FeAl3 crystallites,
finally causing their disintegration. With the ongoing interaction of Fe/Al atoms at the ε-
Fe2Al5/ζ-FeAl3 surface, the ζ-FeAl3 particles form and then disintegrate, and the growth-
spallation cycle continues.
Similar to static conditions, ε-Fe2Al5 and ζ-FeAl3 were found in the specimens from
dynamic corrosion tests, Figure 5.7 shows the examples. However, under dynamic corrosion
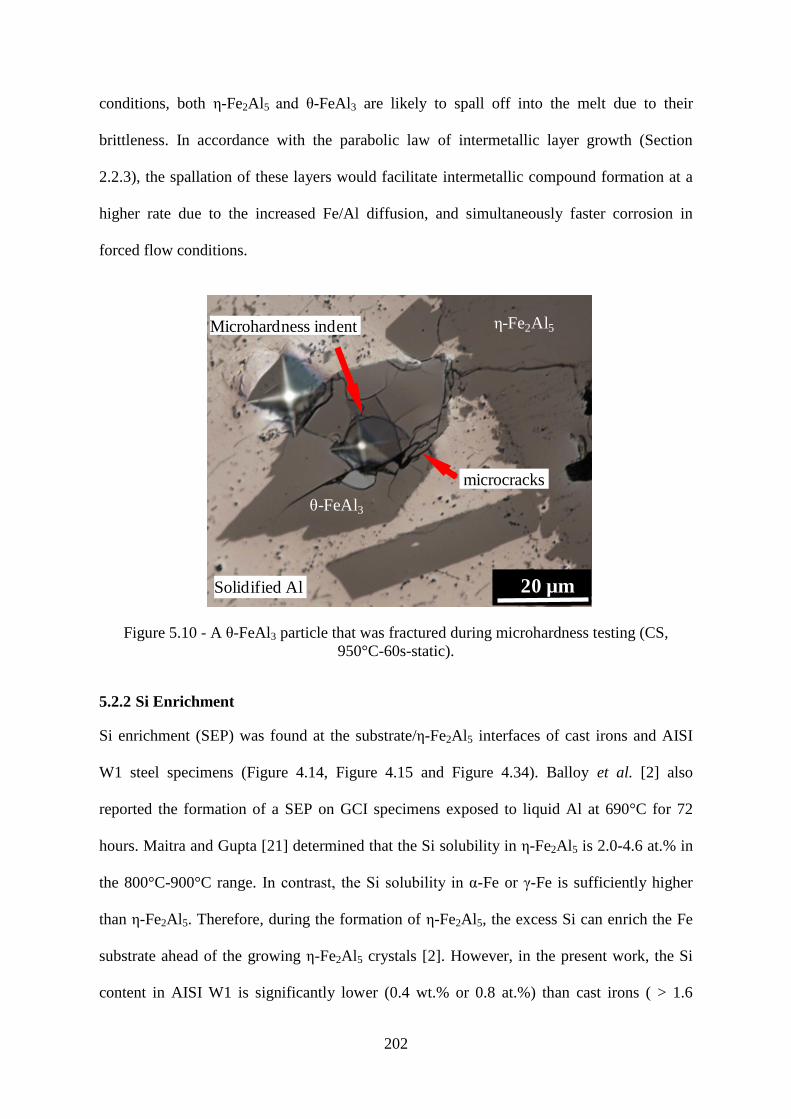
202
conditions, both ε-Fe2Al5 and ζ-FeAl3 are likely to spall off into the melt due to their
brittleness. In accordance with the parabolic law of intermetallic layer growth (Section
2.2.3), the spallation of these layers would facilitate intermetallic compound formation at a
higher rate due to the increased Fe/Al diffusion, and simultaneously faster corrosion in
forced flow conditions.
Figure 5.10 - A ζ-FeAl3 particle that was fractured during microhardness testing (CS,
950°C-60s-static).
5.2.2 Si Enrichment
Si enrichment (SEP) was found at the substrate/ε-Fe2Al5 interfaces of cast irons and AISI
W1 steel specimens (Figure 4.14, Figure 4.15 and Figure 4.34). Balloy et al. [2] also
reported the formation of a SEP on GCI specimens exposed to liquid Al at 690°C for 72
hours. Maitra and Gupta [21] determined that the Si solubility in ε-Fe2Al5 is 2.0-4.6 at.% in
the 800°C-900°C range. In contrast, the Si solubility in α-Fe or γ-Fe is sufficiently higher
than ε-Fe2Al5. Therefore, during the formation of ε-Fe2Al5, the excess Si can enrich the Fe
substrate ahead of the growing ε-Fe2Al5 crystals [2]. However, in the present work, the Si
content in AISI W1 is significantly lower (0.4 wt.% or 0.8 at.%) than cast irons ( > 1.6
ε-Fe2Al5
ζ-FeAl3
Solidified Al
Microhardness indent
20 µm
microcracks
203
wt.%), but a SEP was found. The Si content of 0.8 at.% is well below the solubility limits of
ε-Fe2Al5 reported by [21]. Thus a lower solubility of Si in ε-Fe2Al5 is not a necessary
condition for the occurrence of SEP. Based upon these findings, the SEP may result from the
relatively slower rate of diffusion of Si than Fe. AISI 4140 steel has no Si and in CS the Si
content is significantly low (0.2 wt.%) thus no SEP was detected in the specimens of these
materials.
Balloy et al.[2] reported the formation of a SEP on a high Si (4.5 wt.%) ferritic GCI samples
exposed to liquid Al. Moreover, it was suggested that the diffusion of Si towards the Fe-
substrate can be prevented by the graphite flakes present in the GCI matrix. However, in the
present work, it is concluded that the extent of Si enrichment primarily depends upon the Si
content of the cast iron substrate (Figure 4.16). Furthermore, the Si concentration within the
ε-Fe2Al5 was found to be higher in the cast irons containing higher Si content.
5.2.3 Concentration Distribution of Alloying Elements
In all the experimental materials, the concentration of alloying elements (Cr, Mo, Mn)
within the ε-Fe2Al5 phase was found to be lower than in the Fe-substrates (Figure 4.17).
Dybkov [22] postulated that the corrosion of 18-10 stainless steel by molten Al was “non-
selective dissolution” based upon the hypothesis that the metallic bonds between Fe, Cr and
Ni have approximately the same strength. Thus all the alloying elements should pass into the
melt in those ratios in which they are present in the Fe-substrate. Dybkov also suggested that
the alloying elements can easily substitute for the Fe of ε-Fe2Al5 to form (Cr,Ni)2Al5 phases.
If this is the case, then similar to Fe, the concentration of alloying elements present in ε-
Fe2Al5 should be lower than the Fe-substrate.
In contrast to Si, enrichment of other alloying elements (such as Cr, Mn, and Mo) at the Fe/
ε-Fe2Al5 interface was not detected. Considering the suggestion of [22] these elements may
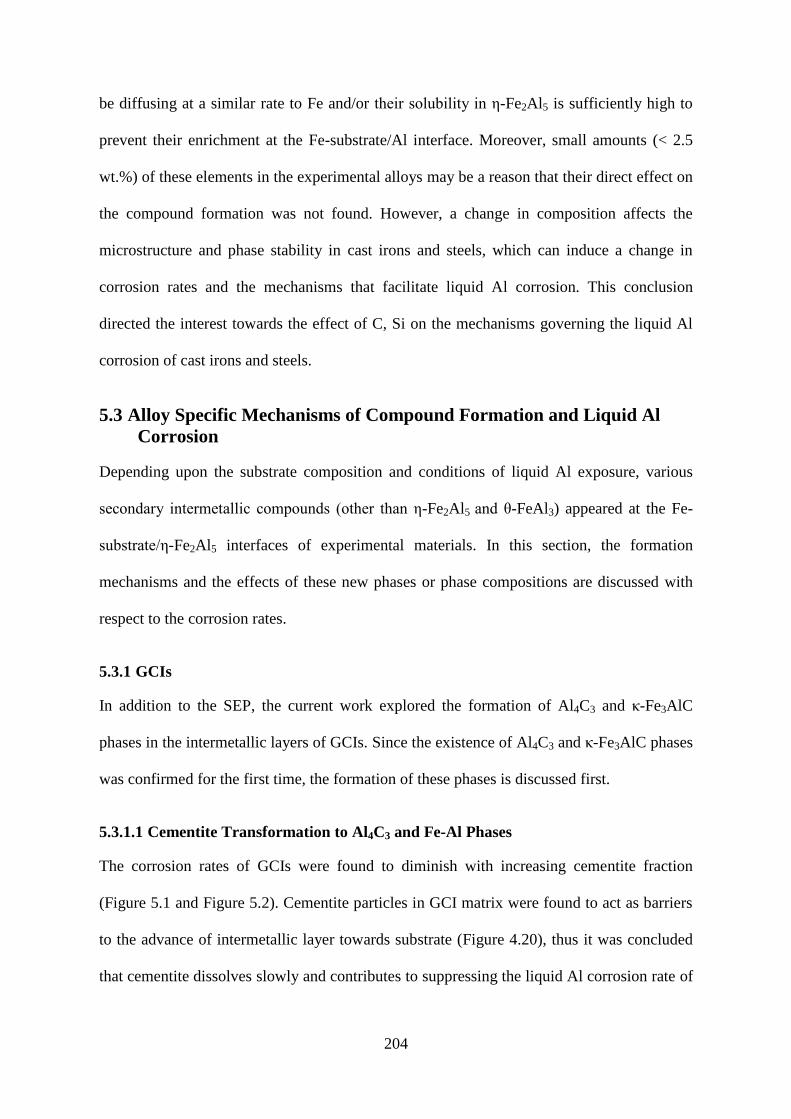
204
be diffusing at a similar rate to Fe and/or their solubility in ε-Fe2Al5 is sufficiently high to
prevent their enrichment at the Fe-substrate/Al interface. Moreover, small amounts (< 2.5
wt.%) of these elements in the experimental alloys may be a reason that their direct effect on
the compound formation was not found. However, a change in composition affects the
microstructure and phase stability in cast irons and steels, which can induce a change in
corrosion rates and the mechanisms that facilitate liquid Al corrosion. This conclusion
directed the interest towards the effect of C, Si on the mechanisms governing the liquid Al
corrosion of cast irons and steels.
5.3 Alloy Specific Mechanisms of Compound Formation and Liquid Al
Corrosion
Depending upon the substrate composition and conditions of liquid Al exposure, various
secondary intermetallic compounds (other than ε-Fe2Al5 and ζ-FeAl3) appeared at the Fe-
substrate/ε-Fe2Al5 interfaces of experimental materials. In this section, the formation
mechanisms and the effects of these new phases or phase compositions are discussed with
respect to the corrosion rates.
5.3.1 GCIs
In addition to the SEP, the current work explored the formation of Al4C3 and κ-Fe3AlC
phases in the intermetallic layers of GCIs. Since the existence of Al4C3 and κ-Fe3AlC phases
was confirmed for the first time, the formation of these phases is discussed first.
5.3.1.1 Cementite Transformation to Al4C3 and Fe-Al Phases
The corrosion rates of GCIs were found to diminish with increasing cementite fraction
(Figure 5.1 and Figure 5.2). Cementite particles in GCI matrix were found to act as barriers
to the advance of intermetallic layer towards substrate (Figure 4.20), thus it was concluded
that cementite dissolves slowly and contributes to suppressing the liquid Al corrosion rate of
205
cast irons. A significant contribution of the present work is the exploration of the mechanism
of cementite transformation to Al4C3 and Fe-Al phases.
There is sparse information on the formation of Al4C3 in Fe-Al couples. So-called "white
spots" in the reaction (ε-Fe2Al5) layer between 1040 steel and Al-7 wt.% Si alloy were
found to have high (2.8 wt.%) C contents and were suggested to contain Al4C3 particles [23].
Likewise, the existence of Al4C3 was also detected in Al-cementite composites synthesized
by mechanical alloying [24]. Recently, Balloy et al. [2] observed tiny particles (< 5μm long)
in the intermetallic layer of carbon steel (0.38 wt.% C) after 72 hours immersion in liquid Al
at 690°C. Owing to the small particle size, phase identification could not be made, and this
phase was suggested to be graphite or Al4C3 [2]. To date there are no reports on the
morphology, and complete identification of an Al4C3 phase formed between ferrous
substrate(s) and liquid Al.
Under ordinary melt conditions, the formation of Al4C3 in graphite/liquid Al couples only
occurs above 1000°C [25-27]. Poor wetability of graphite by liquid Al was suggested to
prevent the Al/C interaction to form Al4C3. Above 1000°C, the contact angle between Al
and graphite was found to decrease with increasing temperature, and attained values below
90º above 1100 °C [25, 27]. From the present work, it is interesting to note that in GCI-
liquid Al interaction, the formation of Al4C3 is possible at 750°C, which is significantly
lower than the temperature required to form this phase by graphite-liquid Al interaction.
At high temperatures, Al has a high potential for reaction with the elements such as C, Si, Fe
and O. The Gibbs free energy of reaction (∆Gf) between Al and these elements is given in
Table 5.2. Thermodynamically, the Al2O3 is the most favourable phase to form among the
listed phases and the formation of Al4C3 should be preferred to the Fe-Al phases. However,
in a study [23] where carbon steel and liquid Al interaction was studied under atmospheric
206
air, only the existence of a few 1-2 µm long Al2O3 particles entrapped in the ε-Fe2Al5
intermetallic layer was reported [23]. In contrast, no such particles were found in the current
work. However, O in the melt is not abundantly available as at the melt surface exposed to
atmospheric air because the formation of Al2O3 layer at the melt surface minimizes the
further possible oxidation of the Al melt. Thus the possibility of Al2O3 formation in the
Fe/Al interaction zone is negligible.
Table 5.2 - Gibbs free energy of formation of various phases at 950°C.
Phase (∆Gf), J/mol Ref.
Al2O3 - 1346602 [28]
Al4C3 - 148788 [28]
ζ-FeAl3 - 93862 [14]
ε-Fe2Al5 - 87348 [14]
β2-FeAl - 44107 [14]
κ-Fe3AlC -95179 [29]
Exposure of ferrous alloys to liquid Al leads to the formation of the intermetallic layer at the
Fe/Al interface. In contrast, liquid Al does not react with graphite due to the poor wetability
of graphite by liquid Al. Thus the presence of ε-Fe2Al5 reaction layer over the cast iron
substrate facilitates the cementite (C)/Al interaction to form Al4C3. This is a possible
explanation of the formation of Al4C3 in Fe-liquid Al couples at the temperatures lower
compared to the graphite-liquid Al couples.
Cementite in GCI matrix was found as a major source of Al4C3 formation. For relatively
short (< 2400s) exposure periods at 750°C, 850°C and 950°C, the Al4C3 particles were
observed in contact with the cementite surface and extending towards the ε-Fe2Al5 phase
(Figure 4.21). Considering the reaction-diffusion mechanism of compound formation, the
diffused Al through the ε-Fe2Al5 phase layer can react with cementite to form Al4C3 and ε-
Fe2Al5. After extended periods of liquid Al exposure at 950°C, the α-Fe(Al, Si) solid
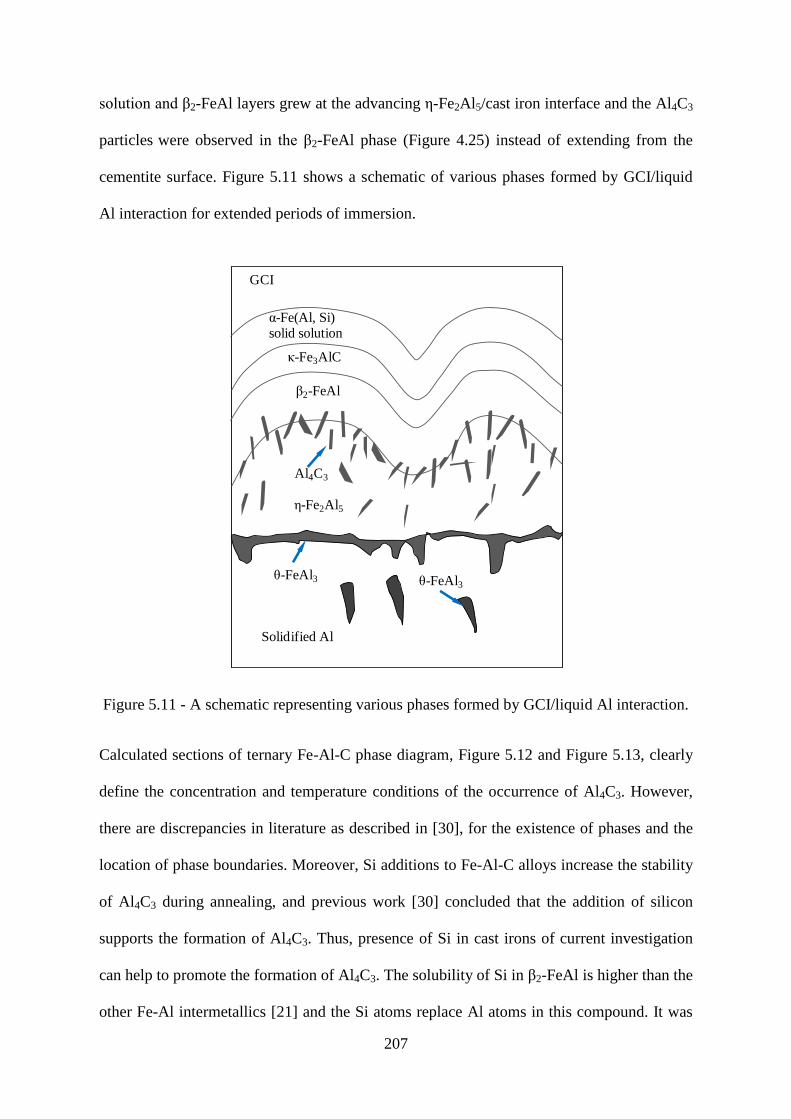
207
solution and β2-FeAl layers grew at the advancing ε-Fe2Al5/cast iron interface and the Al4C3
particles were observed in the β2-FeAl phase (Figure 4.25) instead of extending from the
cementite surface. Figure 5.11 shows a schematic of various phases formed by GCI/liquid
Al interaction for extended periods of immersion.
Figure 5.11 - A schematic representing various phases formed by GCI/liquid Al interaction.
Calculated sections of ternary Fe-Al-C phase diagram, Figure 5.12 and Figure 5.13, clearly
define the concentration and temperature conditions of the occurrence of Al4C3. However,
there are discrepancies in literature as described in [30], for the existence of phases and the
location of phase boundaries. Moreover, Si additions to Fe-Al-C alloys increase the stability
of Al4C3 during annealing, and previous work [30] concluded that the addition of silicon
supports the formation of Al4C3. Thus, presence of Si in cast irons of current investigation
can help to promote the formation of Al4C3. The solubility of Si in β2-FeAl is higher than the
other Fe-Al intermetallics [21] and the Si atoms replace Al atoms in this compound. It was
ε-Fe2Al5
GCI
Solidified Al
ζ-FeAl3
κ-Fe3AlC
Al4C3
β2-FeAl
ζ-FeAl3
α-Fe(Al, Si)solid solution
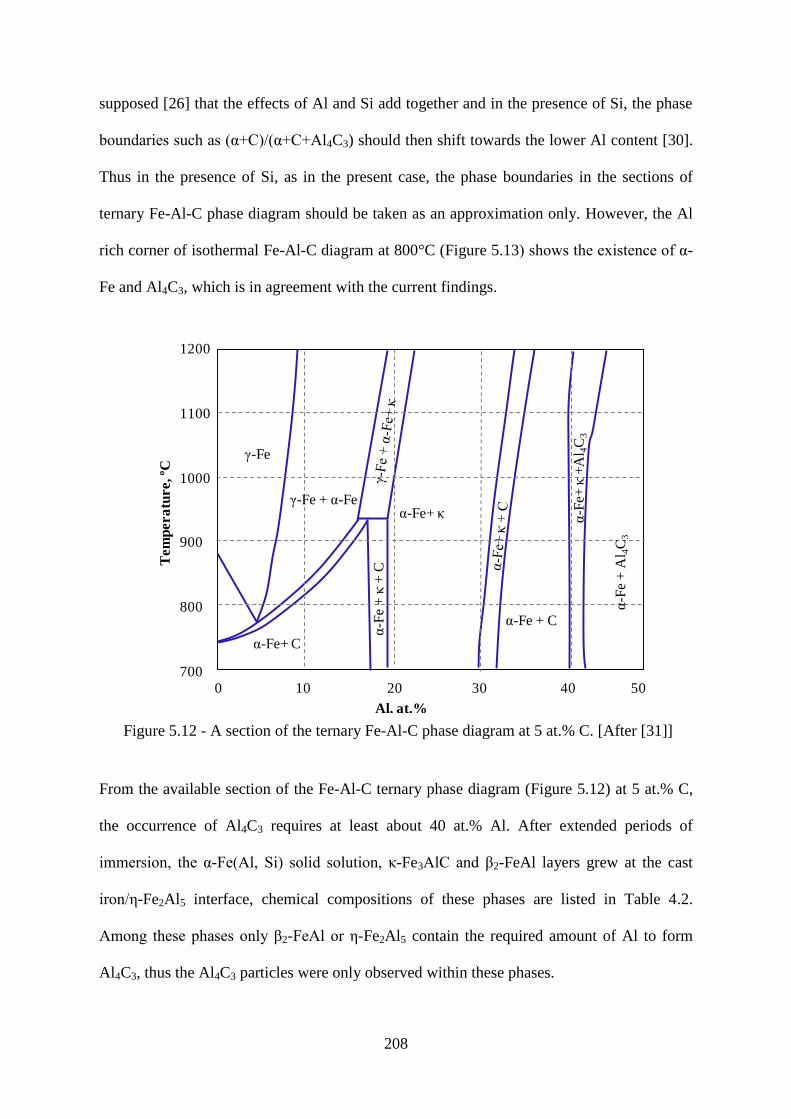
208
supposed [26] that the effects of Al and Si add together and in the presence of Si, the phase
boundaries such as (α+C)/(α+C+Al4C3) should then shift towards the lower Al content [30].
Thus in the presence of Si, as in the present case, the phase boundaries in the sections of
ternary Fe-Al-C phase diagram should be taken as an approximation only. However, the Al
rich corner of isothermal Fe-Al-C diagram at 800°C (Figure 5.13) shows the existence of α-
Fe and Al4C3, which is in agreement with the current findings.
Figure 5.12 - A section of the ternary Fe-Al-C phase diagram at 5 at.% C. [After [31]]
From the available section of the Fe-Al-C ternary phase diagram (Figure 5.12) at 5 at.% C,
the occurrence of Al4C3 requires at least about 40 at.% Al. After extended periods of
immersion, the α-Fe(Al, Si) solid solution, κ-Fe3AlC and β2-FeAl layers grew at the cast
iron/ε-Fe2Al5 interface, chemical compositions of these phases are listed in Table 4.2.
Among these phases only β2-FeAl or ε-Fe2Al5 contain the required amount of Al to form
Al4C3, thus the Al4C3 particles were only observed within these phases.
0 10 20 30 40 50
Al, at.%
1200
1100
1000
900
800
700
γ-Fe
α-F
e +
κ+
C
γ-Fe + α-Fe α-Fe+ κ
α-Fe+ C
α-Fe + C
α-F
e+
κ+
Al 4
C3
α-F
e +
Al 4
C3
Tem
pera
ture, ºC
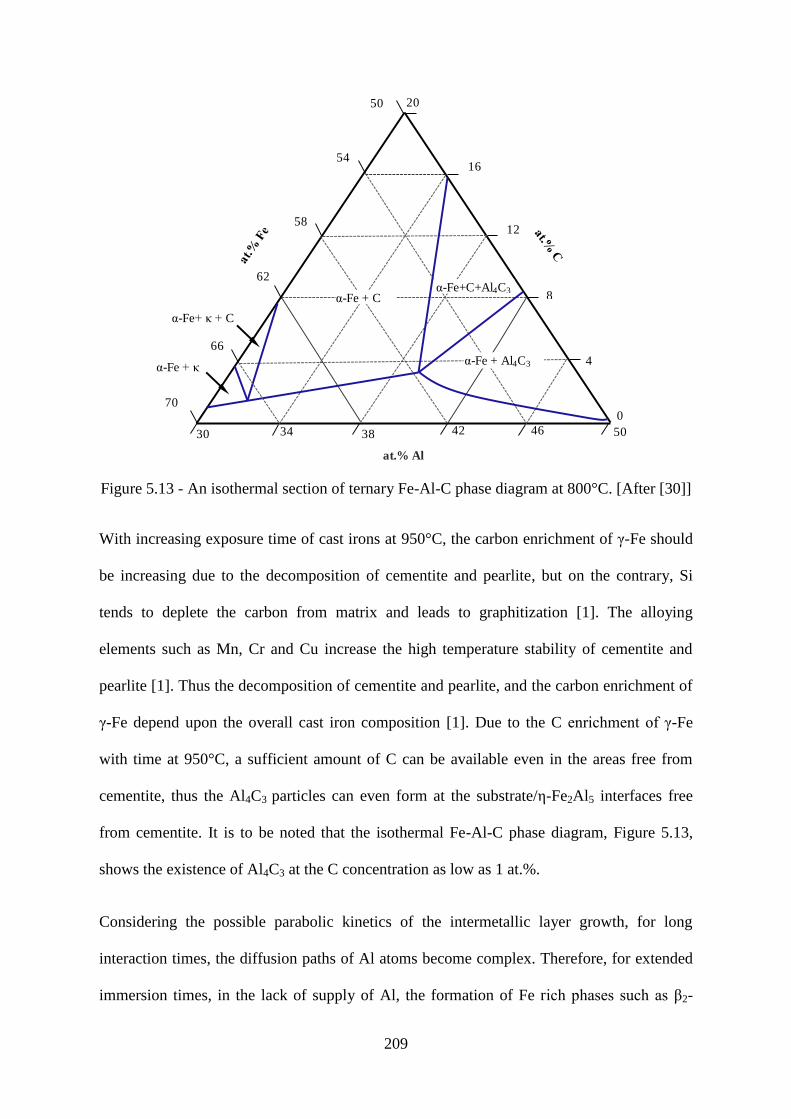
209
Figure 5.13 - An isothermal section of ternary Fe-Al-C phase diagram at 800°C. [After [30]]
With increasing exposure time of cast irons at 950°C, the carbon enrichment of γ-Fe should
be increasing due to the decomposition of cementite and pearlite, but on the contrary, Si
tends to deplete the carbon from matrix and leads to graphitization [1]. The alloying
elements such as Mn, Cr and Cu increase the high temperature stability of cementite and
pearlite [1]. Thus the decomposition of cementite and pearlite, and the carbon enrichment of
γ-Fe depend upon the overall cast iron composition [1]. Due to the C enrichment of γ-Fe
with time at 950°C, a sufficient amount of C can be available even in the areas free from
cementite, thus the Al4C3 particles can even form at the substrate/ε-Fe2Al5 interfaces free
from cementite. It is to be noted that the isothermal Fe-Al-C phase diagram, Figure 5.13,
shows the existence of Al4C3 at the C concentration as low as 1 at.%.
Considering the possible parabolic kinetics of the intermetallic layer growth, for long
interaction times, the diffusion paths of Al atoms become complex. Therefore, for extended
immersion times, in the lack of supply of Al, the formation of Fe rich phases such as β2-
0
α-Fe + Al4C3
α-Fe + C
α-Fe+ κ + C
α-Fe + κ
8
12
20
16
46423834
66
58
54
50
70
62
30 50
α-Fe+C+Al4C3
4
at.% Al
210
FeAl or β1-Fe3Al could dominate the strong growth kinetics of ε-Fe2Al5. Moreover, due to
the slow diffusion of Si compared to Fe, the presence of α-Fe(Al, Si) solid solution layer
was found between cast iron substrate and ε-Fe2Al5. Thus for extended exposure times and
due to slow Al diffusion, the Al4C3 formation appeared to start by Al-C interaction in the β2-
FeAl phase. This also suggests that before being converted into Al4C3, the substrate C
diffuses through the α-Fe(Al, Si) solid solution, κ-Fe3AlC and β2-FeAl phase layers.
5.3.1.2 κ-Fe3AlC Formation
In high C steels, a thin C-enrichment zone ahead of the advancing ε-Fe2Al5 serrations has
been suggested, for example [32]. Whereas, owing to the lack of experimental verification
Richards et al. [33] disregarded the formation of such a layer and suggested this as α-Fe
solid solution. However, the present study confirmed the existence of a C-enrichment zone
ahead of the growing ε-Fe2Al5 columns, which is in agreement with [23]. Moreover, the
existence of κ-Fe3AlC has been found and confirmed for the first time in the cast iron-liquid
Al interaction.
κ-Fe3AlC was found in the intermetallic layers of GCI-S and GCI-A. The thickness of the κ-
Fe3AlC was increased with increasing time at exposure temperature (Figure 4.25). Thus at
short exposure times the κ-Fe3AlC zone may be too thin to detect. Figure 5.14 shows a unit
cell of κ-Fe3AlC [34]. The κ-Fe3AlC unit cell structure can be viewed as L12-Fe3Al structure
with only the difference of C atom at the octahedral position. The presence of the C atom at
the centre of the κ-Fe3AlC leads to an energetically destabilized structure thus the κ phase
often exists as Fe3AlC0.5 [34]. This could be the reason that only about 12 at.% C is detected
in the κ-Fe3AlC layers of GCIs. Nevertheless, EDS is not a very accurate method for
determining the amount of light elements such as C.

211
The ternary Fe-Al-C phase diagrams, Figure 5.12 and Figure 5.13, show the existence of κ-
Fe3AlC over a wide range of composition and temperature. This indicates that κ-Fe3AlC can
exist at the temperature (950°C) used for the immersion tests. Also, the thermodynamic
potential (∆G) of the formation of κ-Fe3AlC is also relatively high (Table 5.2). Existence of
κ-Fe3AlC and Al4C3 has been reported [35] in cast irons containing Al as the alloying
element. Formation of κ-Fe3AlC was reported between 10-16 wt.% Al and between 25-26
wt.% Al, the existence of Al4C3 was detected [35].
Figure 5.14 - Pervoskite (κ) structure of Fe3AlC [34].
Owing to the low solubility of C in Fe-Al compounds, the diffusion of C through Fe-Al
intermetallics is suggested to be slow [32, 36]. The slower diffusion of C than Fe in β2-FeAl
and ε-Fe2Al5 is a possible cause of its enrichment in the form of κ-Fe3AlC. Compared to C,
the Si solubility in α-Fe or γ-Fe is much greater, and at high temperatures, Si tends to
deplete C from cast iron matrix [37]. Thus in cast iron/liquid Al interaction, the growing ε-
Fe2Al5 enriches the adjacent cast iron substrate with Si, the substrate C is forced out of the
solid solution, and C then tends to diffuses through the α-Fe(Al, Si) solid solution and β2-
FeAl layers. Diffusion of C through the α-Fe(Al, Si) solid solution layer believed to be faster
Fe
Al
C
212
than the β2-FeAl layer since the existence of κ-Fe3AlC detected between the two phases.
Moreover, the growth of κ-Fe3AlC with time at exposure temperature indicated that for
shorter immersion times this layer may be too thin to detect. The Al concentration of the α-
Fe(Al, Si) solid solution was found to be significantly (approximately 3 times) lower than κ-
Fe3AlC (Table 4.2), which may be due to the inhibition of Al diffusion by κ-Fe3AlC. During
the formation of the intermetallic layer, while Si enriches the Fe-substrate, part of the C
diffusing towards the ε-Fe2Al5 transforms into Al4C3, while some amount of C combines
with Al and Fe to form κ-Fe3AlC.
Alternatively, there may be a possibility of κ-Fe3AlC formation during cooling of cast iron
specimens after the immersion test. In Fe-Al interaction, the Al concentration was found to
increase from the substrate to the ε-Fe2Al5 phase, and starting from ε-Fe2Al5, the formation
of Fe-rich phases such as, δ-FeAl2, β2-FeAl and β1-Fe3Al is possible. If β1-Fe3Al forms in
pure Fe and liquid Al interaction its location should be similar to κ-Fe3AlC in cast irons.
Among these phases the β1-Fe3Al is the richest in Fe, and according to Fe-Al phase diagram
(Figure 2.5) this phase cannot form at higher (> 600°C) temperatures. Also, the ∆G of
formation of β1-Fe3Al was found to be positive above 730°C [14]. During cooling, the
excess C rejected from α-Fe(Al, Si) solid solution and β2-FeAl phase layers may combine
with Fe and Al to form the κ-Fe3AlC phase instead of β1-Fe3Al.
5.3.1.3 Si-enrichment, Al4C3, κ-Fe3AlC and Corrosion Resistance
During solidification of cast irons, higher Si content in cast irons promotes ferrite and leads
to a larger volume fraction of graphite. Increasing Si content in cast irons also accelerates
the decomposition of pearlite and cementite at annealing temperatures (> 600°C) and
increases graphitization [1, 37]. From the present results, it is believed that SEP forms due
to the slower diffusion of Si than Fe; however, a greater Si content in SEP has shown no

213
positive effect in suppressing the corrosion rate of cast irons (Figure 4.1, Figure 4.3 and
Figure 4.16). EDS analysis in Figure 4.25(d) identified a lower C content in the α-Fe(Al, Si)
solid solution layer than the adjacent GCI-A substrate. Therefore, under the conditions of
increasing Si content ahead of the advancing ε-Fe2Al5, C could be depleted from this zone.
In a previous investigation [4] and in the present work a lower C content (higher ferrite
fraction) in ferrous alloys was found to be least resistant to liquid Al corrosion. Thus the
existence of a low C zone (due to Si-enrichment) ahead of the advancing ε-Fe2Al5 was
ascertained to facilitate the corrosion of cast irons in Al melts.
In GCIs, cementite was identified as a barrier to intermetallic compound growth, and
therefore enhances the liquid Al corrosion resistance of cast irons. For relatively short
interaction times (< 2400s) cementite particles were observed in contact with the ε-Fe2Al5
phase (Figure 4.21). With the passage of time at exposure temperature, Si-rich (α-Fe(Al, Si)
solid solution and β2-FeAl) layers grew between cementite and the ε-Fe2Al5 phase (Figure
5.15). Thus no cementite particles were seen in contact with ε-Fe2Al5 in GCI-S specimen
(950°C-7200s-static). As mentioned before, a high Si concentration ahead of the growing
intermetallic layer can facilitate the transformation of cementite. After 7200s of exposure at
950°C, two Si-rich layers were evident, α-Fe(Al, Si) solid solution and β2-FeAl. However,
adjacent to the cementite particle only β2-FeAl was seen, and the α-Fe(Al, Si) solid solution
layer appears to be involved in the transformation of cementite into β2-FeAl and Al4C3
(Figure 5.15).
The combined effect of temperature and long exposure time is expected to complete the
cementite (Fe3C) austenite (γ-Fe) + graphite (C) transformation. However, the cementite
particles within the GCI-S matrix were found intact even after 2 hours interaction at 950°C
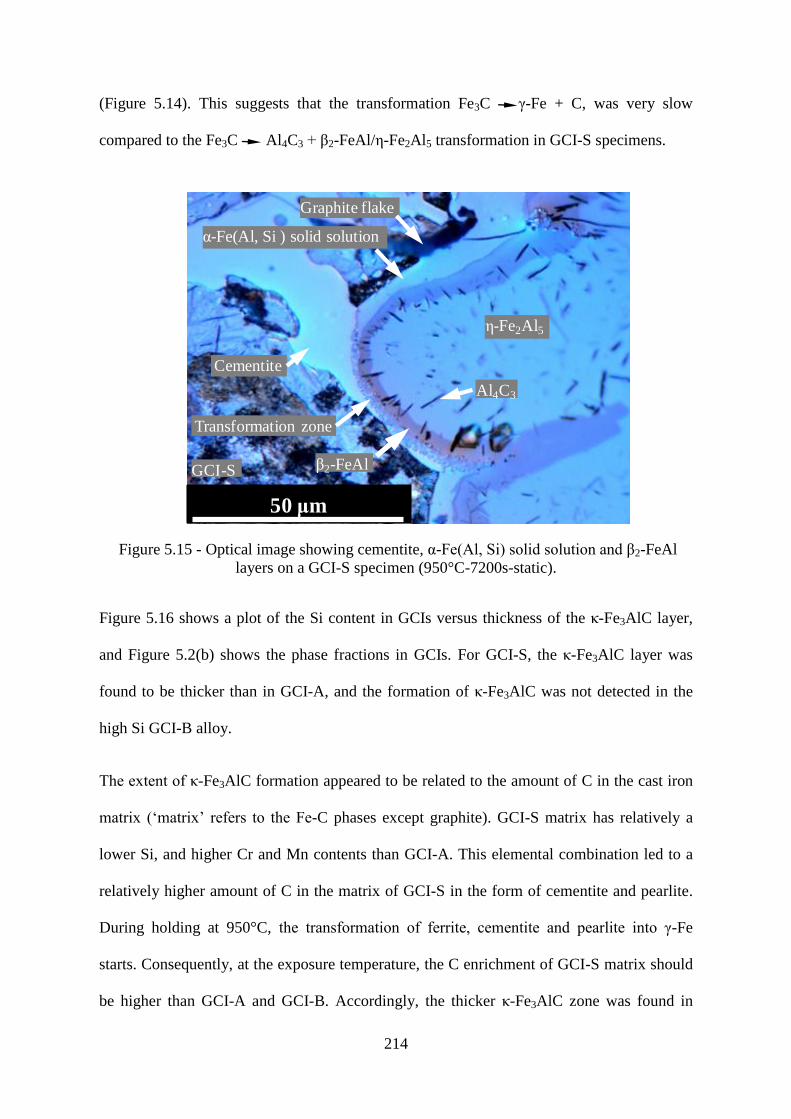
214
(Figure 5.14). This suggests that the transformation Fe3C γ-Fe + C, was very slow
compared to the Fe3C Al4C3 + β2-FeAl/ε-Fe2Al5 transformation in GCI-S specimens.
Figure 5.15 - Optical image showing cementite, α-Fe(Al, Si) solid solution and β2-FeAl
layers on a GCI-S specimen (950°C-7200s-static).
Figure 5.16 shows a plot of the Si content in GCIs versus thickness of the κ-Fe3AlC layer,
and Figure 5.2(b) shows the phase fractions in GCIs. For GCI-S, the κ-Fe3AlC layer was
found to be thicker than in GCI-A, and the formation of κ-Fe3AlC was not detected in the
high Si GCI-B alloy.
The extent of κ-Fe3AlC formation appeared to be related to the amount of C in the cast iron
matrix („matrix‟ refers to the Fe-C phases except graphite). GCI-S matrix has relatively a
lower Si, and higher Cr and Mn contents than GCI-A. This elemental combination led to a
relatively higher amount of C in the matrix of GCI-S in the form of cementite and pearlite.
During holding at 950°C, the transformation of ferrite, cementite and pearlite into γ-Fe
starts. Consequently, at the exposure temperature, the C enrichment of GCI-S matrix should
be higher than GCI-A and GCI-B. Accordingly, the thicker κ-Fe3AlC zone was found in
50 μm
ε-Fe2Al5
β2-FeAl
Cementite
GCI-S
α-Fe(Al, Si ) solid solution
Graphite flake
Al4C3
Transformation zone
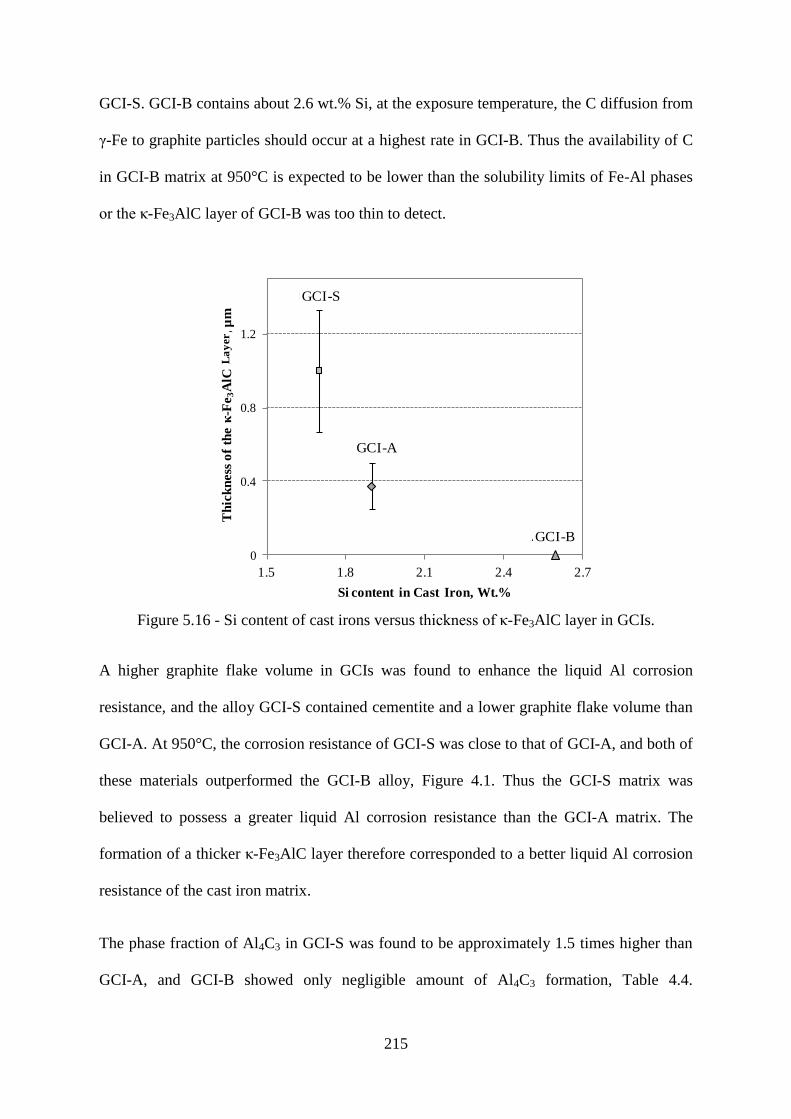
215
GCI-S. GCI-B contains about 2.6 wt.% Si, at the exposure temperature, the C diffusion from
γ-Fe to graphite particles should occur at a highest rate in GCI-B. Thus the availability of C
in GCI-B matrix at 950°C is expected to be lower than the solubility limits of Fe-Al phases
or the κ-Fe3AlC layer of GCI-B was too thin to detect.
Figure 5.16 - Si content of cast irons versus thickness of κ-Fe3AlC layer in GCIs.
A higher graphite flake volume in GCIs was found to enhance the liquid Al corrosion
resistance, and the alloy GCI-S contained cementite and a lower graphite flake volume than
GCI-A. At 950°C, the corrosion resistance of GCI-S was close to that of GCI-A, and both of
these materials outperformed the GCI-B alloy, Figure 4.1. Thus the GCI-S matrix was
believed to possess a greater liquid Al corrosion resistance than the GCI-A matrix. The
formation of a thicker κ-Fe3AlC layer therefore corresponded to a better liquid Al corrosion
resistance of the cast iron matrix.
The phase fraction of Al4C3 in GCI-S was found to be approximately 1.5 times higher than
GCI-A, and GCI-B showed only negligible amount of Al4C3 formation, Table 4.4.
0
0.4
0.8
1.2
1.5 1.8 2.1 2.4 2.7
Th
ick
ness
of
the κ
-Fe
3A
lC Z
on
e, µ
m
Si content in Cast Iron, Wt.%
a
0
10
20
30
40
50
60
70
80
90
100
0 5 10 15 20 25
GCI-S GCI-A GCI-B
0
0.4
0.8
1.2
1.5 1.8 2.1 2.4 2.7
Th
ick
ness
of
the κ
-Fe
3A
lC Z
on
e, µ
m
Si content in Cast Iron, Wt.%
a
0
10
20
30
40
50
60
70
80
90
100
0 5 10 15 20 25
GCI-S GCI-A GCI-B
0
0.4
0.8
1.2
1.5 1.8 2.1 2.4 2.7
Th
ick
ness
of
the κ
-Fe
3A
lC Z
on
e, µ
m
Si content in Cast Iron, Wt.%
a
0
10
20
30
40
50
60
70
80
90
100
0 5 10 15 20 25
GCI-S GCI-A GCI-B
0
0.4
0.8
1.2
1.5 1.8 2.1 2.4 2.7
Th
ick
ness
of
the κ
-Fe
3A
lC Z
on
e, µ
m
Si content in Cast Iron, Wt.%
a
0
10
20
30
40
50
60
70
80
90
100
0 5 10 15 20 25
GCI-S GCI-A GCI-B
0
0.4
0.8
1.2
1.5 1.8 2.1 2.4 2.7
Th
ick
ness
of
the κ
-Fe
3A
lC Z
on
e, µ
m
Si content in Cast Iron, Wt.%
a
0
10
20
30
40
50
60
70
80
90
100
0 5 10 15 20 25
GCI-S GCI-A GCI-B
0
0.4
0.8
1.2
1.5 1.8 2.1 2.4 2.7
Th
ick
ness
of
the κ
-Fe
3A
lC Z
on
e, µ
m
Si content in Cast Iron, Wt.%
a
0
10
20
30
40
50
60
70
80
90
100
0 5 10 15 20 25
GCI-S GCI-A GCI-B
0
0.4
0.8
1.2
1.5 1.8 2.1 2.4 2.7
Th
ick
ness
of
the κ
-Fe
3A
lC Z
on
e, µ
m
Si content in Cast Iron, Wt.%
a
0
10
20
30
40
50
60
70
80
90
100
0 5 10 15 20 25
GCI-S GCI-A GCI-B
0
0.4
0.8
1.2
1.5 1.8 2.1 2.4 2.7
Th
ick
ness
of
the κ
-Fe
3A
lC Z
on
e, µ
m
Si content in Cast Iron, Wt.%
a
0
10
20
30
40
50
60
70
80
90
100
0 5 10 15 20 25
GCI-S GCI-A GCI-B
La
yer
216
Formation of Al4C3 and κ-Fe3AlC phases consumes some diffusing Al; consequently, the
formation of Fe-Al phases should slow down and thus the corrosion rate decrease.
Moreover, inter-diffusion paths of Fe and Al may become more difficult with a greater
amount of Al4C3 particles.
The formation of κ-Fe3AlC and Al4C3 phases were found to depend upon the C content of
cast iron matrix. Thus the corrosion resistance of cast iron matrix can be enhanced by the
introduction of C in the form of cementite and pearlite. From these findings, it is confirmed
that C and Si are the major compositional constituents that control the rate and mechanisms
of liquid Al corrosion of cast irons. Addition of other alloying elements (being present in
small amounts, ~ 1 wt.%) controls the amount of C in various phases in cast irons thus were
believed to indirectly affect the corrosion resistance and mechanisms of liquid Al corrosion.
5.3.2 DCIs
5.3.2.1 Si-enrichment and Corrosion Resistance
Similar to GCIs, a higher Si content accelerates the rate of C depletion from the matrix of
DCIs [1]. Thus during liquid Al corrosion of DCIs at exposure temperatures, Si enrichment
was believed to facilitate the liquid Al corrosion by weakening the matrix by the depletion
of C ahead of growing ε-Fe2Al5. Si content of DCIs is sufficiently high, accordingly, they
have low amount of C in their matrix. Thus during ongoing liquid Al corrosion, due to the Si
enrichment of DCI substrate (SEP), the available carbon from the matrix tends to diffuse
through the Fe-Al phases, but this C content is expected to be below the solubility limits of
ε-Fe2Al5. Therefore, no C enrichment zone was found at the interface between DCIs and ε-
Fe2Al5.
In the experimental DCIs, the graphite fraction was approximately the same, the only major
variable was Si content. At the substrate/ε-Fe2Al5 interface, DCI-T with comparatively low

217
Si (2.2 wt.%) showed the formation of Fe3(Al, Si), while the alloys (DCI-C and DCI-D) with
higher Si contents (3.1-3.3 wt.%) showed the formation of Fe3Si (Table 4.5). Figure 5.17
shows a schematic of phases formed at the corrosion interfaces of DCIs.
In addition to the C depletion form DCI matrix at exposure temperatures, the formation of
Si-rich phases may also affect the mechanisms of corrosion. In the present work, in cast
iron/liquid Al couples, the existence Fe3Si was recognized for the first time thus its
formation and possible effects on liquid Al corrosion are explained in detail. Balloy et al. [2]
also reported the formation of an Al free SEP (13 wt. % Si approx.) in the specimens of a
ferritic GCI (4.5 wt.% Si) the and suggested this as an α-Fe(Si) solid solution. They [2]
noted that due to the formation of Al free α-Fe(Si) solid solution, Al diffusion to cast iron
substrate may be lower than the diffusion of Fe to Al side. However, how Si enrichment at
the GCI/ ε-Fe2Al5 interface can affect the liquid Al corrosion was not explained in Balloy et
al.‟s work.
Comparing the corrosion rates and Si concentration of SEP, DCI-C and DCI-D with higher
Si concentration of SEP corroded more rapidly compared to DCI-T. In SEP of DCI-C and
DCI-D, only a negligible amount (about 0.35 at.%) of Al was detected. Since the three
elements - Fe, Al and Si - were involved in the diffusion interaction while the formation of
phases proceeds - the formation of binary Fe3Si phase in the intermetallic layers of DCIs is
unexpected.

218
Figure 5.17 - A schematic of the corrosion phases formed in DCIs.
The binary Fe-Si phase diagram (Figure 5.18) shows that Fe3Si can exist over fairly wide
ranges of composition and temperature. Zhang and Ivey [38] determined the free energy of
formation of Fe3Si phase taking into account the chemical and magnetic interactions. The
configurational free energy (∆A) was found to decrease with increasing Si content in Fe3Si
from 12 to 25 at.%. Therefore, the stoichiometric Fe3Si is expected to form preferentially. In
DCIs, the Si content of the SEP was found to increase with increasing Si content in the cast
iron matrix. However, the Si concentration of SEP was drastically increased with increasing
Si content of cast irons from 2.6 wt.% to 3.2 wt.% (Figure 4.16). Therefore, in the case of
high Si cast irons, it is likely that the thermodynamic potential (∆A) favours the formation of
near stoichiometric Fe3Si.
DCI
ε-Fe2Al5
ζ-FeAl3
Fe3Si or Fe3(Al, Si)
Solidified Al
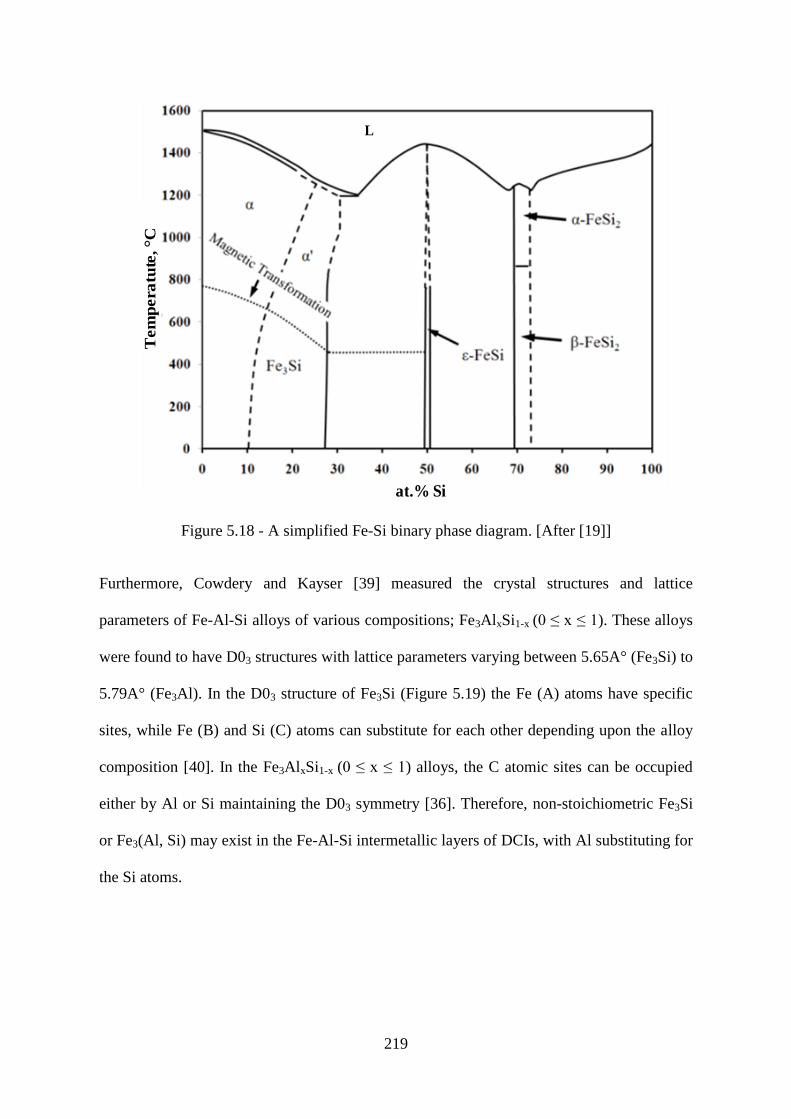
219
Figure 5.18 - A simplified Fe-Si binary phase diagram. [After [19]]
Furthermore, Cowdery and Kayser [39] measured the crystal structures and lattice
parameters of Fe-Al-Si alloys of various compositions; Fe3AlxSi1-x (0 ≤ x ≤ 1). These alloys
were found to have D03 structures with lattice parameters varying between 5.65A° (Fe3Si) to
5.79A° (Fe3Al). In the D03 structure of Fe3Si (Figure 5.19) the Fe (A) atoms have specific
sites, while Fe (B) and Si (C) atoms can substitute for each other depending upon the alloy
composition [40]. In the Fe3AlxSi1-x (0 ≤ x ≤ 1) alloys, the C atomic sites can be occupied
either by Al or Si maintaining the D03 symmetry [36]. Therefore, non-stoichiometric Fe3Si
or Fe3(Al, Si) may exist in the Fe-Al-Si intermetallic layers of DCIs, with Al substituting for
the Si atoms.
at.% Si
L
Tem
pera
tute
, °C
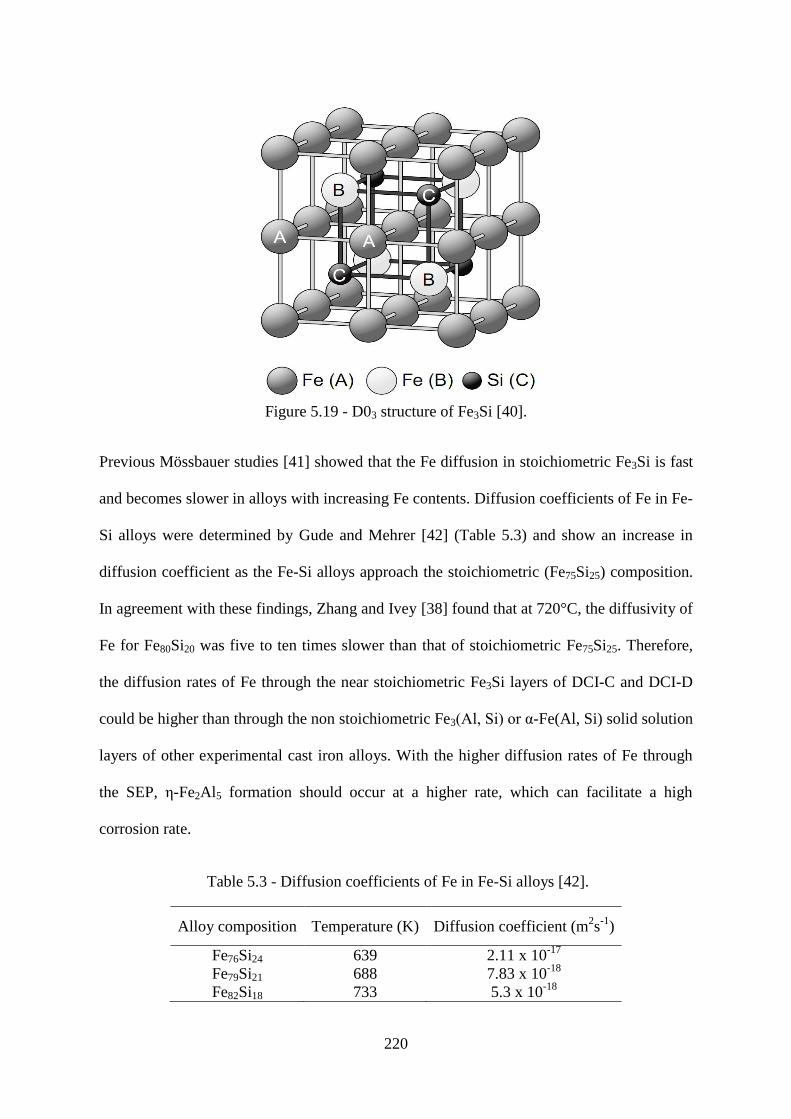
220
Figure 5.19 - D03 structure of Fe3Si [40].
Previous Mössbauer studies [41] showed that the Fe diffusion in stoichiometric Fe3Si is fast
and becomes slower in alloys with increasing Fe contents. Diffusion coefficients of Fe in Fe-
Si alloys were determined by Gude and Mehrer [42] (Table 5.3) and show an increase in
diffusion coefficient as the Fe-Si alloys approach the stoichiometric (Fe75Si25) composition.
In agreement with these findings, Zhang and Ivey [38] found that at 720°C, the diffusivity of
Fe for Fe80Si20 was five to ten times slower than that of stoichiometric Fe75Si25. Therefore,
the diffusion rates of Fe through the near stoichiometric Fe3Si layers of DCI-C and DCI-D
could be higher than through the non stoichiometric Fe3(Al, Si) or α-Fe(Al, Si) solid solution
layers of other experimental cast iron alloys. With the higher diffusion rates of Fe through
the SEP, ε-Fe2Al5 formation should occur at a higher rate, which can facilitate a high
corrosion rate.
Table 5.3 - Diffusion coefficients of Fe in Fe-Si alloys [42].
Alloy composition Temperature (K) Diffusion coefficient (m2s
-1)
Fe76Si24 639 2.11 x 10⁻¹⁷
Fe79Si21 688 7.83 x 10⁻¹⁸
Fe82Si18 733 5.3 x 10⁻¹⁸
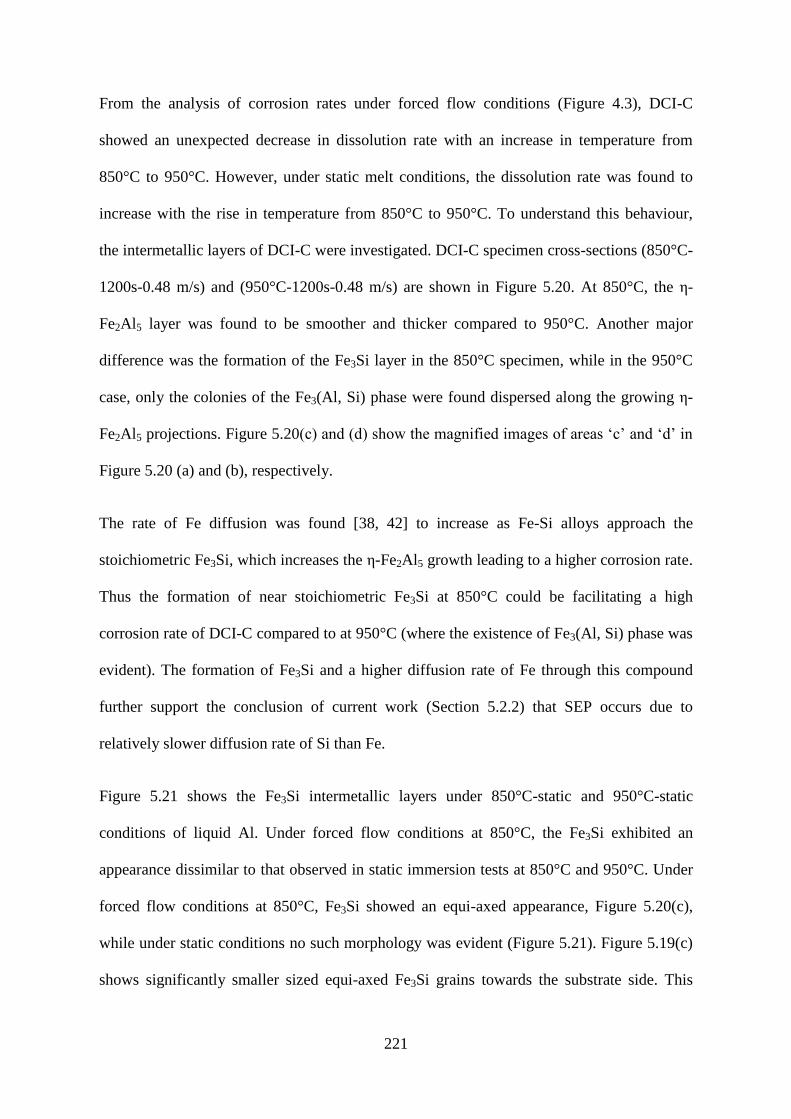
221
From the analysis of corrosion rates under forced flow conditions (Figure 4.3), DCI-C
showed an unexpected decrease in dissolution rate with an increase in temperature from
850°C to 950°C. However, under static melt conditions, the dissolution rate was found to
increase with the rise in temperature from 850°C to 950°C. To understand this behaviour,
the intermetallic layers of DCI-C were investigated. DCI-C specimen cross-sections (850°C-
1200s-0.48 m/s) and (950°C-1200s-0.48 m/s) are shown in Figure 5.20. At 850°C, the ε-
Fe2Al5 layer was found to be smoother and thicker compared to 950°C. Another major
difference was the formation of the Fe3Si layer in the 850°C specimen, while in the 950°C
case, only the colonies of the Fe3(Al, Si) phase were found dispersed along the growing ε-
Fe2Al5 projections. Figure 5.20(c) and (d) show the magnified images of areas „c‟ and „d‟ in
Figure 5.20 (a) and (b), respectively.
The rate of Fe diffusion was found [38, 42] to increase as Fe-Si alloys approach the
stoichiometric Fe3Si, which increases the ε-Fe2Al5 growth leading to a higher corrosion rate.
Thus the formation of near stoichiometric Fe3Si at 850°C could be facilitating a high
corrosion rate of DCI-C compared to at 950°C (where the existence of Fe3(Al, Si) phase was
evident). The formation of Fe3Si and a higher diffusion rate of Fe through this compound
further support the conclusion of current work (Section 5.2.2) that SEP occurs due to
relatively slower diffusion rate of Si than Fe.
Figure 5.21 shows the Fe3Si intermetallic layers under 850°C-static and 950°C-static
conditions of liquid Al. Under forced flow conditions at 850°C, the Fe3Si exhibited an
appearance dissimilar to that observed in static immersion tests at 850°C and 950°C. Under
forced flow conditions at 850°C, Fe3Si showed an equi-axed appearance, Figure 5.20(c),
while under static conditions no such morphology was evident (Figure 5.21). Figure 5.19(c)
shows significantly smaller sized equi-axed Fe3Si grains towards the substrate side. This
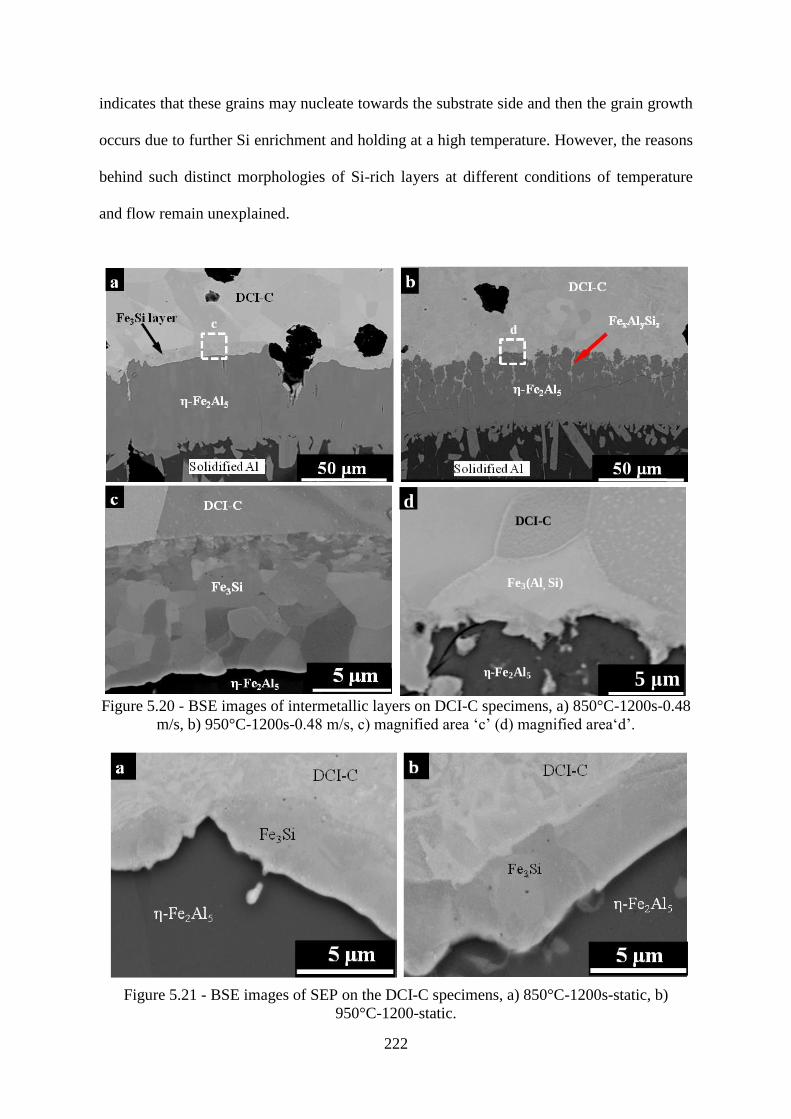
222
indicates that these grains may nucleate towards the substrate side and then the grain growth
occurs due to further Si enrichment and holding at a high temperature. However, the reasons
behind such distinct morphologies of Si-rich layers at different conditions of temperature
and flow remain unexplained.
Figure 5.20 - BSE images of intermetallic layers on DCI-C specimens, a) 850°C-1200s-0.48
m/s, b) 950°C-1200s-0.48 m/s, c) magnified area „c‟ (d) magnified area„d‟.
Figure 5.21 - BSE images of SEP on the DCI-C specimens, a) 850°C-1200s-static, b)
950°C-1200-static.
5 μm
d
ε-Fe2Al5
DCI-C
Fe3(Al, Si)
223
5.3.2.2 Al4C3
Existence of Al4C3 was rarely observed in DCI specimens (Figure 4.31). The major reason is
the absence of cementite particles in DCIs, which were found to be the major source of C for
Al4C3 formation in the case of GCIs. Moreover, the DCIs contain significantly lower pearlite
fraction than GCIs. During holding DCIs at 850°C, pearlite can partially or fully transform
into γ-Fe, and this transformation rate chiefly relies upon cast iron composition. The liquid
Al remained in contact with DCI-T substrate during the entire time of pearlite to γ-Fe
transformation and the isothermal Fe-Al-C phase diagram, Figure 5.13, indicates that Al4C3
formation is possible at a C concentration as low as 1 at.%. Thus the origin of these particles
may be the interaction of Al with C from γ-Fe or the cementite lamellae of remaining
pearlite.
5.3.3 Steels
In addition to ε-Fe2Al5 and ζ-FeAl3, β1-Fe3Al was found in CS specimen (950°C-2400s-
static), Figure 4.32. The existence of β1-Fe3Al has also been reported by Kobayashi and
Yakou [43] in solid Fe-Al diffusion couples subjected to long-term annealing at 1000°C. In
the present work, no distinguishable β1-Fe3Al layer was detected at 850°C and for shorter (<
2400s) interaction times at 950°C. The parabolic law of diffusion suggests that the growth
rate of the ε-Fe2Al5 intermetallic layer diminishes with time. With the passage of time, the
diffusion paths of Al atoms become complex and the availability of Al atoms reduces at the
Fe/ε-Fe2Al5 interface. In the shortage of Al atoms, the possibility of formation of Fe-rich
phases, such as β1-Fe3Al, β2-FeAl increases. However, the binary Fe-Al phase diagram
shows that (Figure 2.5) β1-Fe3Al cannot exist above 600ºC, and thus this phase should form
by cooling below this temperature. Moreover, ∆G of β1-Fe3Al was found to be positive
above 730ºC [14].
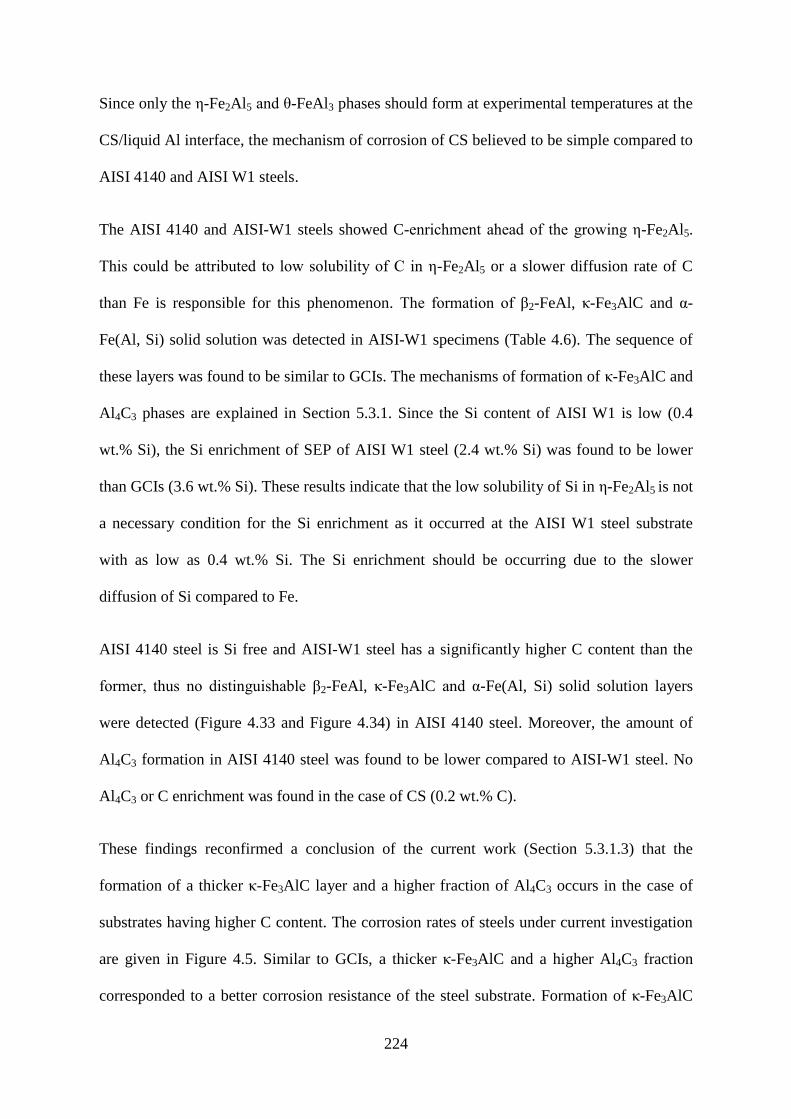
224
Since only the ε-Fe2Al5 and ζ-FeAl3 phases should form at experimental temperatures at the
CS/liquid Al interface, the mechanism of corrosion of CS believed to be simple compared to
AISI 4140 and AISI W1 steels.
The AISI 4140 and AISI-W1 steels showed C-enrichment ahead of the growing ε-Fe2Al5.
This could be attributed to low solubility of C in ε-Fe2Al5 or a slower diffusion rate of C
than Fe is responsible for this phenomenon. The formation of β2-FeAl, κ-Fe3AlC and α-
Fe(Al, Si) solid solution was detected in AISI-W1 specimens (Table 4.6). The sequence of
these layers was found to be similar to GCIs. The mechanisms of formation of κ-Fe3AlC and
Al4C3 phases are explained in Section 5.3.1. Since the Si content of AISI W1 is low (0.4
wt.% Si), the Si enrichment of SEP of AISI W1 steel (2.4 wt.% Si) was found to be lower
than GCIs (3.6 wt.% Si). These results indicate that the low solubility of Si in ε-Fe2Al5 is not
a necessary condition for the Si enrichment as it occurred at the AISI W1 steel substrate
with as low as 0.4 wt.% Si. The Si enrichment should be occurring due to the slower
diffusion of Si compared to Fe.
AISI 4140 steel is Si free and AISI-W1 steel has a significantly higher C content than the
former, thus no distinguishable β2-FeAl, κ-Fe3AlC and α-Fe(Al, Si) solid solution layers
were detected (Figure 4.33 and Figure 4.34) in AISI 4140 steel. Moreover, the amount of
Al4C3 formation in AISI 4140 steel was found to be lower compared to AISI-W1 steel. No
Al4C3 or C enrichment was found in the case of CS (0.2 wt.% C).
These findings reconfirmed a conclusion of the current work (Section 5.3.1.3) that the
formation of a thicker κ-Fe3AlC layer and a higher fraction of Al4C3 occurs in the case of
substrates having higher C content. The corrosion rates of steels under current investigation
are given in Figure 4.5. Similar to GCIs, a thicker κ-Fe3AlC and a higher Al4C3 fraction
corresponded to a better corrosion resistance of the steel substrate. Formation of κ-Fe3AlC
225
and Al4C3 was believed to reduce the corrosion by consuming some of the diffusing Fe and
Al and hindering the Fe/Al interdiffusion. In the case of AISI-W1 steel, Si enrichment can
accelerate the depletion of C from steel matrix ahead of advancing ε-Fe2Al5. Due to the
formation of a low C zone at the steel substrate, the ε-Fe2Al5 may be forming at a higher rate
and thus facilitating the liquid Al corrosion of the steel substrate. Thus the Si enrichment at
the AISI W1 substrate may be a reason for a relatively small increase in corrosion rate with
increase in C content of steel substrate from 0.4 wt.% (AISI 4140) to 1.1 wt.% (AISI W1).
5.3.4 Comparison of Corrosion Compounds in Ex-service and Laboratory Materials
Comparison of the formed intermetallic compounds can be used to judge the similarities of
corrosion mechanisms under laboratory and industrial service conditions. In ex-service and
laboratory GCIs, the intermetallic phases observed most frequently are ε-Fe2Al5 and ζ-FeAl3
and less frequently, β2-FeAl, δ-FeAl2, κ-Fe3AlC and Al4C3. The formation of the latter
phases may be hampered by the non-equilibrium conditions. However, certain phases may
be present in very small quantities and thus could not be detected by scanning electron
microscopy. The formation of β1-Fe3Al was found under specific material and experimental
conditions. The laboratory CS specimens obtained from the 950°C-2400s-static immersion
test contained β1-Fe3Al; however, it was not found in any of the after-service specimens.
The infrequent formation of the Fe-rich Fe-Al phases can also be explained on the basis of
the available literature. Naoi and Kajihara [44] suggest that the Fe/Al interdiffusion
coefficient is more than two orders of magnitude smaller for β2-FeAl, δ-FeAl2 and ζ-FeAl3
than for ε-Fe2Al5. Yan and Fan [45] conducted tests by immersing H21 tool steel specimens
in liquid Al for long durations. The ε-Fe2Al5 and ζ-FeAl3 phases appeared as the first
reaction products. After extended (9 hours) periods of immersion into liquid Al, δ-FeAl2
formed and its thickness was found to increase with exposure time while the ε-Fe2Al5
thickness remained constant [45]. These studies suggest that the Fe-rich phases such as β2-
226
FeAl, δ-FeAl2 grow more slowly than ε-Fe2Al5 and ζ-FeAl3. In other words, these phases
only grow when there is a lack of Al diffusion.
After-service tapping pipes may be retained at ambient temperature for several months. This
could help in achieving equilibrium between the intermetallic layers, leading to the
formation of a wider range of compounds from the Fe-Al system. For example, δ-FeAl2 was
only found in an after-service GCI. Al4C3 and κ-Fe3AlC phases were found in both after-
service and laboratory GCI specimens. However, the formation of κ-Fe3AlC under
laboratory conditions was detected only after extended periods of liquid Al exposure at
950°C.
β2-FeAl, Al4C3 and κ-Fe3AlC phases were observed in laboratory and after-service GCIs.
This suggests that the GCI employed as bottom tapping pipe material corrodes in a similar
manner to laboratory materials. Laboratory CS also shows a similar behaviour of liquid Al
corrosion to after-service CS. In both the after-service and laboratory specimens, only ζ-
FeAl3 particles were found dispersed in the solidified Al, which suggests that ζ-FeAl3 is the
major contaminant of liquid Al melts.
5.4 Intermetallic Layer Growth
When a ferrous alloy is exposed to liquid Al, Fe-Al intermetallic compounds appear at the
substrate-Al interface and these tend to grow with the increasing exposure time. The
available literature (Section 2.2.3) relating to the intermetallic layer growth was found to be
confined to steels and pure Fe, and only a very few studies considered the dissolution as well
as the growth of the Fe-Al intermetallic layer. In the present work, several cast iron alloys
were compared for the first time in terms of dissolution and growth kinetics of the
intermetallic compounds. The recorded growth of intermetallic layers of Series-I materials is
described in Section 4.4.
227
5.4.1 Comparing GCIs, DCIs and CS
At 750°C and 850°C, GCIs generally exhibited a lower mean intermetallic layer thickness
(x) than DCIs, and CS showed a significantly larger x than the former alloys (Figure 4.54).
Among the three test temperatures, at 850°C, most alloys showed highest x at 1200s (Figure
4.55). At this set of conditions, the relative effect of the dissolution and/or spallation of the
layer believed to be small and thus the intermetallic layer grows to a maximum.
At all the temperatures, GCIs showed an increase in x with the increasing t; however, DCIs
and CS showed negative deviations to this trend. The corrosion specimens of these alloys
from static immersion tests showed one major difference: the GCI specimens exhibited a
significantly greater thickness of solidified Al layer than that of CS and DCIs. Figure 5.22
shows the examples of solidified Al layers of each alloy type (950°C-1200s-static).
Figure 5.22 - Solidified Al layer on test specimens (950°C-1200-static), a) cast steel (CS), b)
DCI-T, c) GCI-A, d) a magnified cross-section of GCI-A.
Mounting compound
Mounting compound
Mounting compound
d
250 μm
FeAl3 Fe2Al5
Solidified Al
Graphite
flakes
Solidifed Alε -Fe2Al5
ζ-FeAl3
Graphite falkes
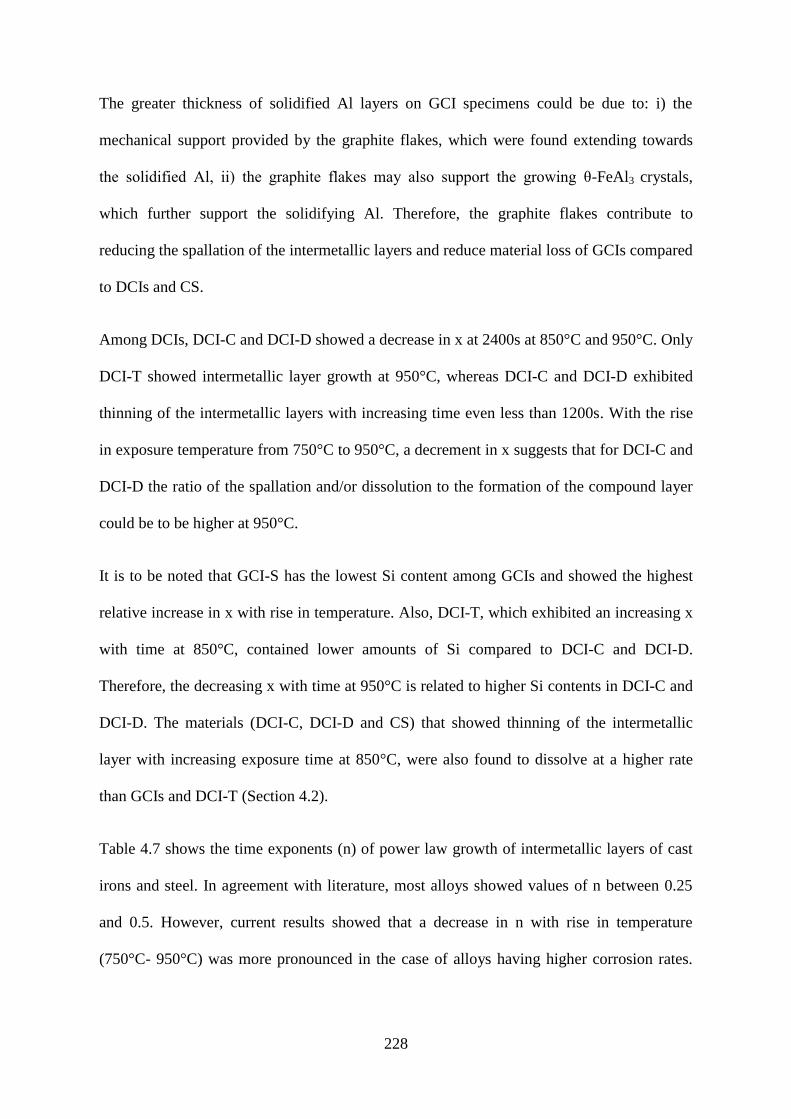
228
The greater thickness of solidified Al layers on GCI specimens could be due to: i) the
mechanical support provided by the graphite flakes, which were found extending towards
the solidified Al, ii) the graphite flakes may also support the growing ζ-FeAl3 crystals,
which further support the solidifying Al. Therefore, the graphite flakes contribute to
reducing the spallation of the intermetallic layers and reduce material loss of GCIs compared
to DCIs and CS.
Among DCIs, DCI-C and DCI-D showed a decrease in x at 2400s at 850°C and 950°C. Only
DCI-T showed intermetallic layer growth at 950°C, whereas DCI-C and DCI-D exhibited
thinning of the intermetallic layers with increasing time even less than 1200s. With the rise
in exposure temperature from 750°C to 950°C, a decrement in x suggests that for DCI-C and
DCI-D the ratio of the spallation and/or dissolution to the formation of the compound layer
could be to be higher at 950°C.
It is to be noted that GCI-S has the lowest Si content among GCIs and showed the highest
relative increase in x with rise in temperature. Also, DCI-T, which exhibited an increasing x
with time at 850°C, contained lower amounts of Si compared to DCI-C and DCI-D.
Therefore, the decreasing x with time at 950°C is related to higher Si contents in DCI-C and
DCI-D. The materials (DCI-C, DCI-D and CS) that showed thinning of the intermetallic
layer with increasing exposure time at 850°C, were also found to dissolve at a higher rate
than GCIs and DCI-T (Section 4.2).
Table 4.7 shows the time exponents (n) of power law growth of intermetallic layers of cast
irons and steel. In agreement with literature, most alloys showed values of n between 0.25
and 0.5. However, current results showed that a decrease in n with rise in temperature
(750°C- 950°C) was more pronounced in the case of alloys having higher corrosion rates.

229
This indicates that the dissolution and/or spallation of the intermetallic layer should be
relatively higher at the higher exposure temperature.
5.4.2 GCIs
As mentioned before, at 1200s, compared to the other temperatures, most alloys showed a
maximum x at 850°C. This exposure condition may be more favourable for formation of ε-
Fe2Al5 at a higher rate relative to its dissolution and/or spallation. Thus x at this set of
conditions was taken as a representative of the aggressiveness of liquid Al to form ε-Fe2Al5.
For convenience x at 850°C-1200s-static was designated as xh. Figure 5.23 shows a plot
between xh and cementite fraction in GCIs. The xh of GCIs was varied inversely with the
increasing cementite fraction. Compared to pearlite or ferrite, the decomposition of
cementite into Fe-Al compounds was found to be relatively slow (Section 4.3.1.2), which
tends to limit the thickness of the intermetallic layer.
Figure 5.23 - Mean Intermetallic layer thickness (xh) versus cementite fraction in GCIs.
25
45
65
85
0 2 4 6 8
Mea
n I
nte
rm
eta
llic
La
yer T
hic
kn
ess
(x
h),
µm
Cementite Fraction, Area %
0
10
20
30
40
50
60
0 0.2 0.4 0.6 0.8 1 1.2
GCI-A GCI-S GCI-B
Mea
nIn
term
eta
llic
La
yer T
hic
kn
ess
(x
h),
µm
25
45
65
85
0 2 4 6 8
Mea
n I
nte
rm
eta
llic
La
yer T
hic
kn
ess
(x
h),
µm
Cementite Fraction, Area %
0
10
20
30
40
50
60
0 0.2 0.4 0.6 0.8 1 1.2
GCI-A GCI-S GCI-B
Mea
nIn
term
eta
llic
La
yer T
hic
kn
ess
(x
h),
µm
25
45
65
85
0 2 4 6 8
Mea
n I
nte
rm
eta
llic
La
yer T
hic
kn
ess
(x
h),
µm
Cementite Fraction, Area %
0
10
20
30
40
50
60
0 0.2 0.4 0.6 0.8 1 1.2
GCI-A GCI-S GCI-B
Mea
nIn
term
eta
llic
La
yer T
hic
kn
ess
(x
h),
µm
25
45
65
85
0 2 4 6 8
Mea
n I
nte
rm
eta
llic
La
yer T
hic
kn
ess
(x
h),
µm
Cementite Fraction, Area %
0
10
20
30
40
50
60
0 0.2 0.4 0.6 0.8 1 1.2
GCI-A GCI-S GCI-B
Mea
nIn
term
eta
llic
La
yer T
hic
kn
ess
(x
h),
µm
GCI-A
230
5.4.3 DCIs
In DCIs, xh varied directly with the ferrite fraction, Figure 5.24 shows a plot between xh
ferrite fractions in DCIs. The fraction of each Fe-C phase (ferrite, pearlite and cementite)
depends upon the chemical composition of cast irons. Exposure of DCIs to 850°C should
initiate the transformation of these phases to austenite, thus the phase fraction measured
before exposure is indicative of the C present in cast iron matrix. Both DCI-C and DCI-D
have high Si (> 3 wt.%) and Si promotes ferrite in cast irons [1]; however, the addition of
Cu and Cr to DCI-D has lead to a lower amount of ferrite than DCI-T. DCI-C alloy has the
highest amount of ferrite or low carbon matrix at exposure temperatures, which was found to
be the least resistant to the liquid Al corrosion, thus the DCI-C intermetallic layer grows
fast.
Figure 5.24 - Mean Intermetallic layer thickness (xh) versus ferrite fraction in DCIs.
5.4.4 CS
At the three test temperatures, CS showed an increasing x with increasing t; however, a
decrease in x was observed at 2400s at 850°C (Figure 4.55). In general, thicker intermetallic
25
50
75
100
125
150
0 10 20 30 40 50
Mea
n I
nte
rm
eta
llic
La
yer T
hic
kn
ess
(x
h),
µm
Ferrite Fraction, Area %
0
20
40
60
80
100
120
140
160
180
0 0.2 0.4 0.6 0.8 1 1.2
DCI-T DCI-D DCI-C
Mea
nIn
term
eta
llic
La
yer T
hic
kn
ess
(x
h),
µm
25
50
75
100
125
150
0 10 20 30 40 50
Mea
n I
nte
rm
eta
llic
La
yer T
hic
kn
ess
(x
h),
µm
Ferrite Fraction, Area %
0
20
40
60
80
100
120
140
160
180
0 0.2 0.4 0.6 0.8 1 1.2
DCI-T DCI-D DCI-C
Mea
nIn
term
eta
llic
La
yer T
hic
kn
ess
(x
h),
µm
25
50
75
100
125
150
0 10 20 30 40 50
Mea
n I
nte
rm
eta
llic
La
yer T
hic
kn
ess
(x
h),
µm
Ferrite Fraction, Area %
0
20
40
60
80
100
120
140
160
180
0 0.2 0.4 0.6 0.8 1 1.2
DCI-T DCI-D DCI-C
Mea
nIn
term
eta
llic
La
yer T
hic
kn
ess
(x
h),
µm
25
50
75
100
125
150
0 10 20 30 40 50
Mea
n I
nte
rm
eta
llic
La
yer T
hic
kn
ess
(x
h),
µm
Ferrite Fraction, Area %
0
20
40
60
80
100
120
140
160
180
0 0.2 0.4 0.6 0.8 1 1.2
DCI-T DCI-D DCI-C
Mea
nIn
term
eta
llic
La
yer T
hic
kn
ess
(x
h),
µm
231
layers are expected at higher temperatures. However, most CS specimens showed a
complete reversal with the lowest x at 950°C. Since CS has the highest corrosion rate among
the alloys under current investigation, the increased dissolution and/or spallation of the
intermetallic layer at 950°C can lead to such behaviour. However, unlike DCIs, with
increasing time at 950°C, the thinning of the intermetallic layers was not observed in the
case of CS.
5.5 Intermetallic Layer Growth and Dissolution Kinetics
The diffusion of Fe and spallation (and/or dissolution) of the intermetallic layer are the
primary mechanisms of material loss from Fe-substrates in Al melts. In order to reveal the
role of spallation and/or dissolution of the intermetallic layer, the observed intermetallic
layer thickness (x) was compared with the dissolution under static melt conditions (Method-
II) (Figure 4.59). The extent of dissolution of ferrous alloys was linear with time.
As a general consideration, the observed thickness of the intermetallic layer at any instant is
a balance between its advance towards the substrate and spallation and/or dissolution into
the melt. Yeremenko et al. [46] suggested that the growth rate of the intermetallic layer in a
saturated solution (liquid Al saturated with Fe) can be given by Equation 5.1.
x
k
dt
dx 1 (5.1)
In an undersaturated solution, after immersion, the diffusion boundary layer rapidly forms at
the solid Fe-liquid Al interface; thus, the concentration of Fe near the solid surface was
regarded as being equal to the saturation concentration. Thus k1 was assumed to be
independent of the degree of saturation of liquid metal, and dissolution in a saturated
solution does not occur [46]. Considering the dissolution of the intermetallic layer in an
232
undersaturated Al melt, Yeremenko et al. revised Equation 5.2 to include the dissolution rate
(d′):
d
x
k
dt
dx 1 (5.2)
They [43] noted that the decreased x can contribute to increased growth of the intermetallic
layer. As the dissolution rate (d′) increases, x should decrease, and Equation 5.2 suggests
that with a decrease in x, the compound formation rate increases. Thus, the observed
thickness (x) of the intermetallic layer is not a simple difference between the growth and
dissolution of the intermetallic layer.
In solid state Fe-Al diffusion couples, the intermetallic layer growth has been found to
follow the parabolic growth law [43], and there are no reports of negative deviations.
However, in the case of Fe-liquid Al systems, for extended exposure periods, a decrease in x
can be understood because in agreement with the reaction-diffusion mechanism [20], the
growth rate of the intermetallic layer reduces with time. Concurrently, the dissolution and/or
spallation rate remains constant thus thinning of the intermetallic layers can take place.
The intermetallic layer growth rate varies inversely with x (Equation 5.2). However,
Equation 5.2 does not account for the growth and dissolution during the reaction controlled
regime (initial short period of immersion). An increased rate of compound formation should
result when x decreases by a high dissolution. Moreover, with a further decrease in x, the
growth of Fe-Al compounds can occur at a higher rate because the compound formation
may become reaction dominant (a faster growth regime than diffusion controlled growth). In
high Si DCIs (Si > 3 wt.%), with increasing immersion time at 950°C, x for the subsequent
period of interaction decreased less than or remain nearly equal to the intermetallic thickness
at the initial exposure period (60s). Thus a high dissolution rate can cause a small x, which
233
was further believed to enhance the formation rate of the intermetallic layer and
simultaneously, the dissolution and/or spallation of the intermetallic layer continues.
Both dissolution and intermetallic layer growth occur simultaneously. Considering Equation
5.2, when dx
k1 , 0dt
dx and reach steady state.
All GCIs showed an increase in x with increasing t, while DCIs and CS generally showed a
maxima and then x decreased with increasing t. In GCIs, the equilibrium between the
growth and dissolution may not be achieved up to the maximum exposure period. At 950°C,
DCI-C showed maxima in x at 60s and for DCI-T it was at 1200s. These results suggest that
the equilibrium between the growth and dissolution of the intermetallic layer may have
attained in a short exposure time for the alloys having higher dissolution rates. The results
presented here also affirmed the suggestion of Yeremenko et al. [46] that the growth of the
intermetallic layer cannot be considered independent of the dissolution.
According to Yeremenko et al. [46], in the solid-liquid systems such as Fe-liquid Al, it is
impossible to avoid the formation of intermetallic compounds by increasing the dissolution
rate. Nucleation and reaction between Fe and Al are sufficiently fast at exposure
temperatures [43] that the thickness of the intermetallic layer can decrease by dissolution,
but it may not vanish completely. Thus there is a possibility of a minimum intermetallic
layer thickness (xmin) even under high dissolution rates. Current work showed that the
occurrence of xmin depends upon the type and composition of ferrous alloy and the
conditions of liquid Al exposure. It was found that the alloys with higher corrosion rates
show xmin in shorter immersion periods.
The negative deviations from the parabolic growth law and decreasing trends of x with
increasing t were more readily observed in the cases of alloys having higher corrosion rates.
234
These findings indicate that formation and dissolution (and/or spallation) of the intermetallic
layer are the primary modes of liquid Al corrosion of ferrous materials.
5.6 Comparing Intermetallic Layer Growth and Corrosion Rates
In order to judge the performance of ferrous alloys in liquid Al melts, two types of
characteristics of intermetallic layers of were compared with the corrosion rates, first is the
mean intermetallic layer thickness at a single set of temperature and time and second the x-t
behaviour at different temperatures.
5.6.1 Mean Intermetallic Layer Thickness at 950°C
A simple approach for judging the performance of ferrous alloys can be x at a single set of
conditions. Current findings suggest that dissolution and/or spallation of the intermetallic
layer contributes to the material loss from Fe-substrates. Compared to lower temperatures, at
950°C, thinning of the intermetallic layer with increasing exposure time was commonly
observed in the cases of alloys having higher corrosion rates. Thus x at this temperature was
used to relate to the corrosion resistance. For this purpose x at 950°C-2400s-static was used,
x at these exposure conditions was designated as xd. The xd of ferrous alloys was compared
with their corrosion rates under forced flow of liquid Al at 950°C, same ranking of corrosion
resistance of cast iron alloys was found under static melt conditions (Figure 4.1 and Figure
4.3). Figure 5.25 shows xd and mass dissolution rates (R’) of cast irons and steel under
dynamic corrosion conditions (950°C-0.48m/s). The corrosion rate generally followed the
inverse relationship to xd. However, for CS, xd was found to be highest among these alloys
but also the highest corrosion rate. The CS microstructure was mainly ferritic (0.2 wt.% C),
which promoted the intermetallic layer growth at a relatively higher rate. Moreover, CS is
different from cast irons in terms of graphite particles and Si content. A higher Si content
promotes the thinning of intermetallic layers at 950°C, Section 5.4.1. When there are several

235
factors affecting the intermetallic layer thickness, it is difficult to know the effect of each of
these factors. However, the effect of higher C in cast irons and a significantly higher Si may
have contributed to a lower xd of cast irons. A higher C content of Fe-substrate can cause the
ε-Fe2Al5 at a slower rate and a higher Si may lead to the thinning of intermetallic layers.
There is also a conflict between GCI-A and GCI-S. However, xd and R’ of GCI-B can be
clearly differentiated from these alloys. The difference between the corrosion rates of GCI-A
and GCI-S under static melt conditions at 950°C was found to be small (Figure 4.1) thus
similar can be the case of x. Thus when the corrosion resistance of two GCIs is close, it is
difficult to judge their corrosion performance on the basis of intermetallic layer thickness
(xd).
Figure 5.25 - a) Mean intermetallic layer thickness at 950°C-2400s-static (xd), Method-II,
and mass dissolution rate (R’) 950°C-0.48 m/s, Method-I.
5.6.2 Intermetallic Layer Growth Behaviour at 750°C and 950°C
Intermetallic layer growth of each alloy at 750°C and 950°C was compared with their
ranking according to the corrosion rates (Figure 4.56 and Figure 5.25). A lower growth rate
or a decrease in x with a rise in temperature (750-950°C) reflected a greater susceptibility to
corrosion. In other words, a larger area confined between the Log(x)-Log(t) trend-lines for
127
131
115
62
46
28
167
0 50 100 150
GCI-A (1.07)
GCI-S (1.19)
GCI-B (1.52)
DCI-T (2.07)
DCI-D (2.60)
DCI-C (4.10)
CS (14.75)
Mean Intermetallic Layer Thickness (xd), µmFerrous Alloys (Rʹ, g/s (10 -3))Ferrous Alloys (Rʹ, g/s (10-3)
236
750°C (above) and 950°C (below) indicated a higher corrosion resistance. For example,
DCI-C has the lowest corrosion resistance among cast irons, and x of DCI-C decreases with
time at 950°C and the majority of data points at 750°C showed greater x than at 950°C.
GCI-A was found to be an exception to this trend: it has a lower corrosion rate compared to
GCI-S but showed a larger area between 750°C-950°C trend lines but these difference were
relatively small. There is a complex effect of phases present and Si content in cast irons on
liquid Al corrosion rates such as GCI-A comprises ferrite, which can enhance the corrosion
rate but a higher graphite fraction than GCI-S has the opposite effect. Thus it is not possible
to reveal the effect of each factor when the corrosion resistance and x-t behaviour of two
cast irons are close. However, a higher amount of Si and ferrite in GCI-A can be a possible
explanation because ferrite promotes the formation of intermetallic layer, on the other hand
at higher temperatures a greater Si content leads to the thinning of intermetallic layers.
In literature, the x-t behaviour of carbon steels studied by Sasaki et al. [47] showed a
similarity with the present observations on cast irons, with a rise in temperature the two high
C steels designated as C45 and C88 (0.45 wt.% C and 0.88 wt.% C, respectively) showed a
larger area between the 700°C and 850°C trend lines than a low C steel (C05, 0.05 wt.% C).
At 850°C, the C05 and C45 steels showed negative deviations from parabolic behaviour
while the C88 steel followed the parabolic behaviour at the three test temperatures, for
details see Figure 2.8. However, corrosion rates of these materials were not investigated in
Sasaki et al.‟s work. Considering the present findings, a higher C content in steels reduces
the corrosion rate. Thus the deduced x-t behaviour that relates the corrosion rates to the
thinning of intermetallic layers (with a rise in temperature) may be applicable to steels as
well.
237
These findings suggest that xd or x-t (750°C-950°C) behaviour in static melt conditions can
be used to judge the performance of ferrous alloys under static or flow assisted liquid Al
corrosion. However, the x-t behaviour was believed to be more robust than evaluating x at a
single set of conditions. Current work found that both x and corrosion rates are interrelated
and strongly depend on the chemical composition of ferrous alloys. However, when there is
a small difference between the corrosion resistances of two materials and/or they differ to
large extent in terms of chemical composition and phases present, the stated x-t (750°C-
950°C) behaviour versus-corrosion relationship may not be applicable.
5.7 Role of Si in Liquid Al Corrosion of Ferrous Alloys
5.7.1 Dissolution and Growth of Intermetallic Layers
It is well known that Si addition to molten Al strongly reduces the intermetallic layer
thickness, details are found in Section 2.2. However, the mechanism by which Si reduces the
growth of the Fe-Al alloy layer remains controversial. One point of view suggests that Si
atoms occupy the structural vacancies in the ε-Fe2Al5 phase resulting in reduced Al
diffusivity, and as a result Si containing ε-Fe2Al5 grows more slowly than Si free ε-Fe2A15
[10, 48]. On the other hand, Komatsu et al. [49] and Ueda et al. [50] suggested that the
presence of Si in Al melts does not inhibit the intermetallic layer growth, but accelerates its
dissolution into liquid Al. Moreover, Komatsu et al. concluded that presence of Si in Fe
substrates does not affect the corrosion rate; however, an increase (approximately 15 %) of
corrosion rate at 1 and 3 wt.% Si additions to pure Fe was clearly seen in Komatsu et al.‟s
work. It is to be noted that in the present work, the Si content in cast irons was between 1.4 -
3.5 wt.%.
Niinomi and Ueda [5] found that that the addition of Si (3 wt.%) to pure Fe decreases the
intermetallic layer thickness. In an another publication, Niinomi et al. [6] reported that the
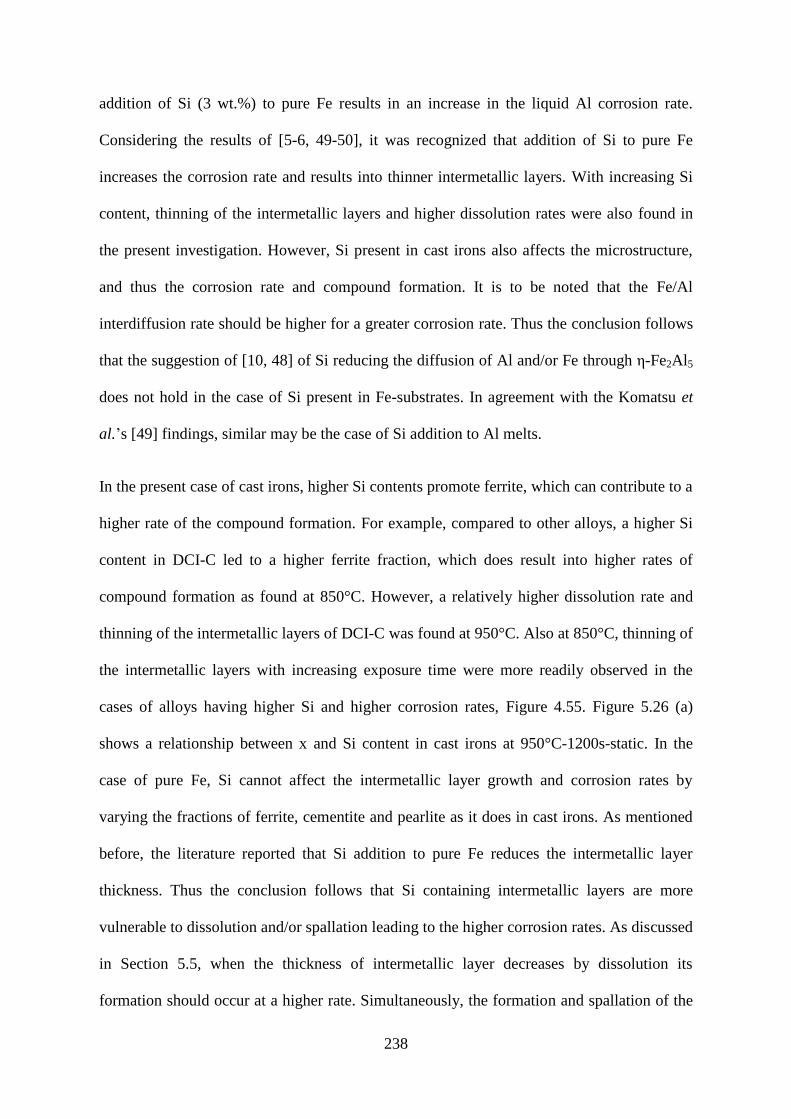
238
addition of Si (3 wt.%) to pure Fe results in an increase in the liquid Al corrosion rate.
Considering the results of [5-6, 49-50], it was recognized that addition of Si to pure Fe
increases the corrosion rate and results into thinner intermetallic layers. With increasing Si
content, thinning of the intermetallic layers and higher dissolution rates were also found in
the present investigation. However, Si present in cast irons also affects the microstructure,
and thus the corrosion rate and compound formation. It is to be noted that the Fe/Al
interdiffusion rate should be higher for a greater corrosion rate. Thus the conclusion follows
that the suggestion of [10, 48] of Si reducing the diffusion of Al and/or Fe through ε-Fe2Al5
does not hold in the case of Si present in Fe-substrates. In agreement with the Komatsu et
al.‟s [49] findings, similar may be the case of Si addition to Al melts.
In the present case of cast irons, higher Si contents promote ferrite, which can contribute to a
higher rate of the compound formation. For example, compared to other alloys, a higher Si
content in DCI-C led to a higher ferrite fraction, which does result into higher rates of
compound formation as found at 850°C. However, a relatively higher dissolution rate and
thinning of the intermetallic layers of DCI-C was found at 950°C. Also at 850°C, thinning of
the intermetallic layers with increasing exposure time were more readily observed in the
cases of alloys having higher Si and higher corrosion rates, Figure 4.55. Figure 5.26 (a)
shows a relationship between x and Si content in cast irons at 950°C-1200s-static. In the
case of pure Fe, Si cannot affect the intermetallic layer growth and corrosion rates by
varying the fractions of ferrite, cementite and pearlite as it does in cast irons. As mentioned
before, the literature reported that Si addition to pure Fe reduces the intermetallic layer
thickness. Thus the conclusion follows that Si containing intermetallic layers are more
vulnerable to dissolution and/or spallation leading to the higher corrosion rates. As discussed
in Section 5.5, when the thickness of intermetallic layer decreases by dissolution its
formation should occur at a higher rate. Simultaneously, the formation and spallation of the
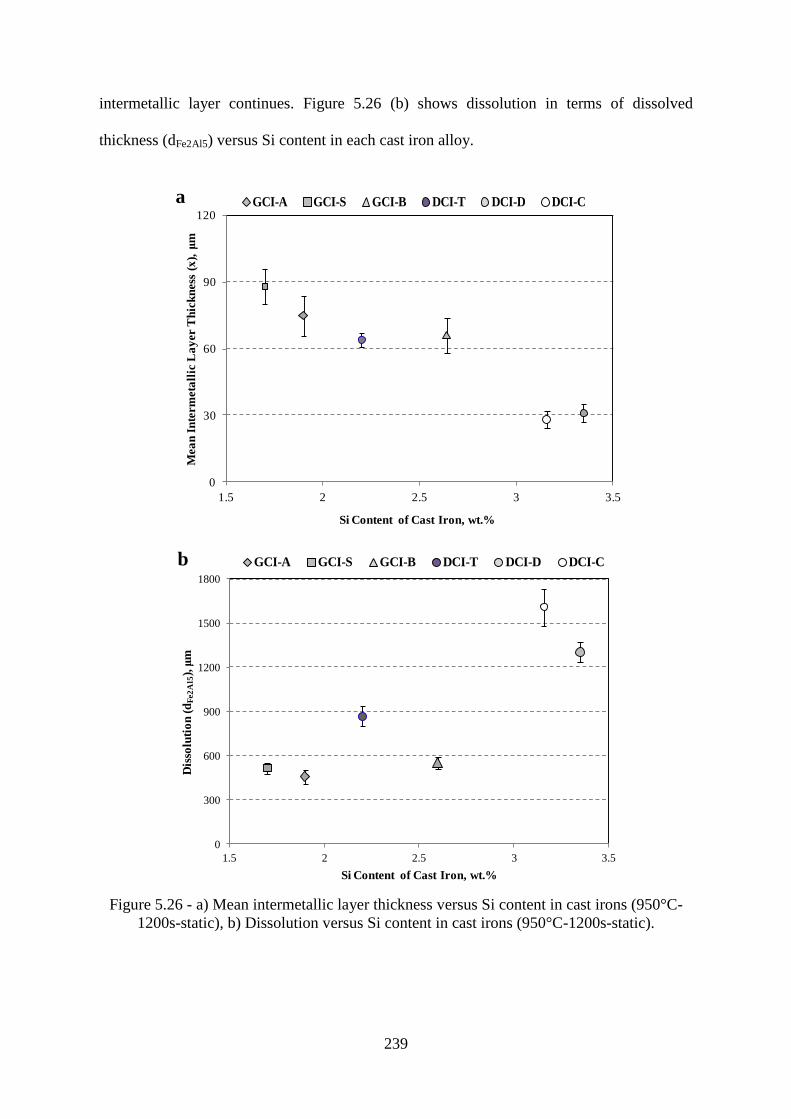
239
intermetallic layer continues. Figure 5.26 (b) shows dissolution in terms of dissolved
thickness (dFe2Al5) versus Si content in each cast iron alloy.
Figure 5.26 - a) Mean intermetallic layer thickness versus Si content in cast irons (950°C-
1200s-static), b) Dissolution versus Si content in cast irons (950°C-1200s-static).
0
30
60
90
120
1.5 2 2.5 3 3.5
Mea
n I
nte
rm
eta
llic
La
yer T
hic
kn
ess
(x
), μ
m
Si Content of Cast Iron, wt.%
0
50
100
150
200
250
300
350
400
450
500
1 2
GCI-A GCI-S GCI-B DCI-T DCI-D DCI-Ca
0
300
600
900
1200
1500
1800
1.5 2 2.5 3 3.5
Dis
solu
tio
n (
dF
e2
Al5
), μ
m
Si Content of Cast Iron, wt.%
0
50
100
150
200
250
300
350
400
450
500
1 2
GCI-A GCI-S GCI-B DCI-T DCI-D DCI-Cb
240
Data presented shows that the intermetallic layer thickness varied inversely and the
dissolution tends to increase with increasing Si content. Thus Si in cast irons was believed to
act in two ways:
a) Si promotes ferrite and depletes C from cast iron matrix at exposure temperatures,
which contributes to higher rates of compound formation and liquid Al corrosion.
b) Si leads to a higher dissolution and/or spallation rate of the intermetallic compounds,
which is reflected by the higher dissolution and thinning of the intermetallic layers of
high Si DCIs.
In addition, the formation of SEP at the cast iron/ε-Fe2Al5 interfaces were also believed to
affect the liquid Al corrosion as discussed in Section 5.3.1.3 and Section 5.3.2.1.
Considering these aspects, for improving the liquid Al corrosion resistance of cast irons, the
Si content should be minimized. Moreover, similar to cast irons increasing Si content may
also negatively impact the liquid Al corrosion resistance of steels.
5.7.2 Morphology of Intermetallic Layers
To investigate the mechanisms by which Si increases the dissolution and/or spallation
tendency of intermetallic layers, the morphology of the intermetallic layers of cast irons was
investigated in detail (Section 4.6). The morphology of the intermetallic layer was found to
vary with the substrate composition and alloy type. The DCIs showed more serrated
morphology and uneven intermetallic layers than GCIs. The nature of the intermetallic
layers was determined from the average maximum ( maxX ) and average minimum ( minX )
intermetallic layer thickness, Figure 4.62.
As a general consideration, a lower value of minX suggests that liquid Al was closer to the
substrate and the intermetallic layer is difficult to sustain in liquid Al. On the other hand, a
241
higher value of maxX can be attributed to formation of intermetallic layer at a greater rate.
Generally, minX of cast irons showed a decrease with increasing Si while maxX showed the
opposite trend. For example, DCI-C is richer in Si than DCI-T and maxX of DCI-C was found
to be significantly higher than DCI-T and minX followed the opposite trend. A lower value
of minX may correspond to the higher tendency of spallation and/or dissolution. On the other
hand, a higher maxX value suggests that the intermetallic layer formation in DCI-C occurred
at a greater rate. Thus more serrated and uneven morphology of the intermetallic layer of
DCIs may be directly related to their higher Si content than GCIs.
CS showed highest maxX and minX values and also has the highest corrosion rate. This trend
is not consistent with cast irons. CS is mainly ferritic and has a negligible Si content (0.2
wt.%) compared to cast irons. Moreover, the compositional constituents in CS are similar to
cast iron matrixes except the graphite inclusions. Since Si addition to pure Fe was found [5]
to reduce the intermetallic layer thickness, and the current work showed that minX decreases
with increasing Si. Thus a higher value minX of CS was attributed to a significantly lower Si
content, and a ferritic microstructure can promote the intermetallic layer formation at a
higher rate leading to a higher maxX . Moreover, the graphite particles can also affect the
growth and spallation of the intermetallic layer; however, the affect of the Si content
appeared to dominate the both characteristics.
In the present work, the deep etching technique was successfully used to reveal the true
morphology of the intermetallic layers of cast irons and steel, Section 4.6.2. Fe3(Al, Si) or
Fe3Si compounds can create discontinuities at the surface of ε-Fe2Al5 columns of DCIs.
Compared to DCIs, the ε-Fe2Al5 compound structure of CS was found to be uniform and
free from structural imperfections which may be reflected by considerably thicker
242
intermetallic layers. The structural imperfections created by the formation of Fe3(Al, Si) or
Fe3Si phases may cause stress concentrations, which decrease the physical strength of the ε-
Fe2Al5 columns resulting in the increased spallation under natural or forced convection.
Si concentration at the cast iron substrate/ε-Fe2Al5 interface varied directly with the
substrate Si content. Also, within the bulk of ε-Fe2Al5, Si concentration was found to be
higher for high Si cast irons (Section 4.3.1.1). Thus a higher Si content within the bulk of the
ε-Fe2Al5 phase may also affect the spallation tendency of the intermetallic layer. However, it
is difficult to reveal the possible contribution of each factor (higher Si concentration at
substrate/ε-Fe2Al5 interface and within the bulk of ε-Fe2Al5) to the spallation tendency.
The results of present investigation identified that the liquid Al corrosion resistance of a
ferrous alloy depends upon the rate of formation and spallation tendency of the ε-Fe2Al5
layer. For example, the higher dissolution rates of high Si cast irons were attributed to the
mechanically weaker and/or enhanced tendency of dissolution of Si containing ε-Fe2Al5.
The case of ζ-FeAl3 may be similar. Similarly to ε-Fe2Al5, the rate of formation and/or the
physical strength ζ-FeAl3 may vary with the chemical composition of ferrous alloy.
However, the formation rate and spallation and/or dissolution tendency of ζ-FeAl3 cannot be
determined because of the fragility of the ζ-FeAl3 phase.
Chapter References
[1] J.R. Davis, ASM Speciality Handbook-Cast Irons, ASM International, Materials Park,
Ohio, 1996.
[2] D. Balloy, J.C. Tissier, M.L. Giorgi, M. Briant, Metallurgical and Materials Transactions
A, 41 (2010) 2366-2376.
[3] F.A. Mountford, T.J. Glover, Foundry Trade Journal, 120 (1966) 849-852.
[4] S.H. Hwang, J.H. Song, Y.S. Kim, Materials Science and Engineering A, 390 (2005)
437-443.
[5] M. Niinomi, Y. Ueda, Transactions of the Japan Institute of Metals, 23 (1982) 709-717.
243
[6] M. Niinomi, Y. Ueda, M. Sano, Transactions of the Japan Institute of Metals, 23 (1982)
780-787.
[7] J.F. Janowak, R.B. Gundlach, American Foundry Society Transactions, 90 (1982) 847-
863.
[8] K. Roehrig, American Foundry Society Transactions, 86 (1978) 75-88.
[9] U. Sen, S. Sen, F. Yilmaz, Journal of Materials Processing Technology, 148 (2004) 1-7.
[10] T. Heumann, S. Dittrich, Zeitschrift Fuer Metallkunde, 50 (1959) 617-625.
[11] A. Bouayad, C. Gerometta, A. Belkebir, A. Ambari, Materials Science Engineering A,
A363 (2003) 53-61.
[12] H.R. Shahverdi, M.R. Ghomashchi, S. Shabestari, J. Hejazi, Journal of Materials
Processing Technology, 124 (2002) 345-352.
[13] F. Balbaud-Célérier, F. Barbier, Journal of Nuclear Materials, 289 (2001) 227-242.
[14] E.G. Ivanov, Metal Science and Heat Treatment, 21 (1979) 449-452.
[15] V.I. Nizhenko, Powder Metallurgy and Metal Ceramics, 43 (5-6) (2004) 273-279.
[16] V.R. Ryabov, Fusion Welding of Aluminium to Steel, Scientific Thoughts, Nauk,
Dumuka, Kiev, (1969) 232-258.
[17] V.N. Eremenko (Ed.), The Physical Chemistry of Inorganic Materials, Vol. 3, Kiev,
1988.
[18] R.U. Burkhardt, Y.U. Grin, M. Ellner, Acta Crystallographica, B50 (1994) 313-316.
[19] M. Hansen, Constitution of Binary Alloys, McGraw-Hill Book Company, New York,
1958.
[20] V.I. Dybkov, Reaction Diffusion and Solid State Chemical Kinetics, The IPMS
Publications, Kyiv, 2002.
[21] T. Maitra, S.P. Gupta, Materials Characterization, 49 (2003) 293-311.
[22] V.I. Dybkov, Journal of Materials Science, 25 (1990) 3615-3633.
[23] T.S. Shih, S.H. Tu, Materials Science Engineering A, 454-455 (2007) 349-356.
[24] D. Chaira, S. Sangal, B.K. Mishra, Materials and Manufacturing Processes, 22 (2007)
492-496.
[25] A. Banerji, W. Reif, Metallurgical Transactions A, Physical Metallurgy and Materials
Science, 17 A (1986) 2127-2137.
[26] J.C.R. Manning, T.B. Gurganus, Journal of the American Ceramic Society, 52 (1969)
115-118.
[27] J.V. Naidich, J.N. Chuvashov, Journal of Materials Science, 18 (1983) 2071-2080.
[28] P.C. Hayes, Process Principles in Minerals and Materials Production, Hayes Publishing
Company, Sherwood, 1993.
[29] P. Maugis, J. Lacaze, R. Besson, J. Morillo, Metallurgical and Materials Transactions
A, 37 (2006) 3397-3401.
[30] P. Kratochvil, F. Dobe, V. Vodickova, Intermetallics, 17 (2009) 39-45.

244
[31] H. Ohtani, M. Yamano, M. Hasebe, Iron and Steel Institute of Japan, 44 (10) (2004)
1738-1747.
[32] N.W. Ageew, O.I. Vher, Institute of Metals - Advance Papers, Institute of Metals
Meeting, London, 44 (2) (1930) 83-95.
[33] R.W. Richards, R.D. Jones, P.D. Clements, H. Clarke, International Materials Reviews,
39 (1994) 191-212.
[34] D. Connetable, P. Maguis, Intermetallics, 16 (2008) 345-352.
[35] N.N. Aleksandrov, L.V. Il'Icheva, Metal Science and Heat Treatment, (1963) 646-650.
[36] S.G. Denner, R.D. Jones, R.J. Thomas, Iron and Steel International, 48 (1975) 241-252.
[37] Y.N. Malinochka, Metal Science and Heat Treatment, (1963) 640-646.
[38] Y. Zhang, D.G. Ivey, Journal of Materials Science, 33 (1998) 3131-3135.
[39] S.J. Cowdery, F.X. Kayser, Materials Research Bulletin, 14 (1979) 91-99.
[40] U. Starke, J. Schardt, W. Weiss, W. Meier, C. Polop, P.L. De Andres, K. Heinz,
Europhysics Letters, 56 (2001) 822-830.
[41] B. Sepiol, G. Vogl, Diffusion in ordered Fe-Si alloys, Switzerland, (1995) 149-159.
[42] A. Gude, H. Mehrer, Philosophical Magazine A, 76 (1) (1976) 1-29.
[43] S. Kobayashi, T. Yakou, Materials Science and Engineering A, 338 (2002) 44-53.
[44] D. Naoi, M. Kajihara, Materials Science and Engineering A, 459 (2007) 375-382.
[45] M. Yan, Z. Fan, Journal of Materials Science, 35 (2000) 1661-1667.
[46] V.N. Yeremenko, Y.V. Natanzon, V.I. Dybkov, Journal of Materials Science, 16 (1981)
1748-1756.
[47] T. Sasaki, T. Yakou, K. Mochiduki, K. Ichinose, The Iron and Steel Institute of Japan
International, 45 (2005) 1887-1892.
[48] J.E. Nicholls, Corrosion Technology, 11 (1964) 16-21.
[49] N. Komatsu, M. Nakamura, H. Fujita, Journal of Japan Institute of Metals, 18 (1968)
474-482.
[50] Y. Ueda, M. Sano, M. Niinomi, Journal of the Japan Institute of Metals, 42 (1978) 549-
555.
245
CHAPTER 6 : CONCLUSIONS
The primary purpose of the present research program was to enhance the service life of cast
iron/steel tapping pipes used to transfer liquid Al from smelting cells. In order to achieve
this goal, research was focused on developing the cast iron and steel alloys with better liquid
Al corrosion resistance. Moreover, the formation and growth characteristics of intermetallic
compounds were studied to better understand the dissolution mechanisms and to predict the
relative corrosion behaviour of ferrous alloys. The most significant contribution of the
present work is the identification of the factors and mechanisms affecting the liquid Al
corrosion resistance of cast irons and steels. The conclusions derived from this work are
described in the following sections.
6.1 Liquid Al Corrosion Resistance and Chemical Composition
Review of the literature indicated that there is no known correlation between the cast irons
composition and liquid Al corrosion resistance. The current work successfully differentiated
liquid Al corrosion resistance of cast irons and steels according to the microstructure and/or
chemical composition. The following conclusions were drawn:
Both increasing the temperature of the liquid Al and introducing forced flow conditions
significantly accelerated the material loss of ferrous alloys. The liquid Al corrosion
resistance of GCIs under static and dynamic corrosion environments was found to be
exceptionally better than DCIs. This was mainly due to the presence of interconnected
graphite flakes in GCIs compared to the isolated spheres in the case of DCIs. Moreover,
cementite present in GCIs also contributed to their enhanced corrosion resistance.
The key to obtaining GCIs with enhanced corrosion resistance was identified as the effect
of alloying elements on the amount of each phase (ferrite, pearlite, cementite and
246
graphite) present in the microstructure. The increased amount of C in the form of graphite
flakes enhances the liquid Al corrosion resistance of GCIs, which can be further
improved by the introduction of cementite. No increase in corrosion resistance was found
by increasing cementite fraction at the expense of a decreased graphite flake fraction in
GCIs. Among the GCIs under current study, the best corrosion resistance was obtained
when both graphite and cementite were present in an approximate ratio of 1:1 by area.
Contrary to C, the material loss of cast irons tends to increase with increasing Si content
because Si promotes ferrite and depletes C from cast iron matrixes at exposure
temperatures. Thus in order to maintain the matrix corrosion resistance, Si content should
be minimized; however, a small amount Si (> 1 wt.%) is generally required to promote
graphite flakes in GCIs.
A GCI with a high liquid Al corrosion resistance can be obtained with C 3.7-3.8, Si 1.35-
1.45, Mn 0.8-0.9, Cr 0.7-0.8 and Cu 1-1.2 (in wt.%). Furthermore, a higher amount of C
may be used to enhance the corrosion resistance. When increasing C in GCIs, Mn and Cr
contents should also be higher than the stated values so that the amount and high
temperature stability of cementite can be maintained. However, the drawbacks are
reduced toughness and strength of cast irons.
Similar to GCIs, alloying the DCIs with cementite and pearlite forming elements such as
Mn, Cr and Cu yields improvements to corrosion resistance, and increasing Si has the
opposite effect. However, a relatively high Si content is often required in DCIs for
improving their high temperature properties and to promote ferrite for high ductility. The
elements such as Mn, Cr and Cu can be useful to offset the effect of increased Si to some
extent.
247
A higher amount of C in steel was also found to improve the liquid Al corrosion
resistance. A steel with 0.4 wt.% C showed a significant improvement in the liquid Al
corrosion resistance compared to a 0.2 wt.% C steel, while a further increase to 1.1 wt.%
C showed a relatively small increase. It was also found that carbon steels ( ≥ 0.4 wt.% C)
can be more resistant to flow assisted liquid Al corrosion than high Si (> 2 wt.%) DCIs
and GCIs. The absence of Si (or significantly lower Si contents) in steels was believed to
enhance their corrosion resistance compared to cast irons because Si weakens the cast
iron matrix by promoting ferrite and depleting carbon from cast iron matrix at exposure
temperatures.
6.2 Intermetallic Compounds and Liquid Al Corrosion Resistance
In order to determine the effect of intermetallic compounds on liquid Al corrosion
resistance, the substrate-Al interfaces of steel and cast iron alloys were investigated utilizing
SEM, EDS and EBSD.
In all the ferrous alloys under investigation, ε-Fe2Al5 was the major phase of the
intermetallic layers, while ζ-FeAl3 remained the minor phase. Moreover, all the
intermetallic compounds of the Fe-Al binary system (formed under the equivalent
temperature range) were detected. The compounds ε-Fe2Al5, ζ-FeAl3, β2-FeAl and β1-
Fe3Al were found in laboratory specimens, while δ-FeAl2 was only detected in an after-
service GCI.
The orthorhombic ε-Fe2Al5 phase was found to grow in a [001] direction, which is
consistent with the existing literature. Current work reported for the first time that the
preferred crystallographic growth direction of ζ-FeAl3 is [010]. It was conjectured that,
like ε-Fe2Al5, ζ-FeAl3 has faster diffusion of Fe/Al in the [010] direction leading to the
lath shaped morphology of ζ-FeAl3 particles. Also the morphology of the thin ζ-FeAl3

248
layer was found to be polycrystalline. It was believed that formation and spallation of ζ-
FeAl3 particles forms an active part of the process of dissolution of ferrous alloys into
liquid Al melts.
Si enrichment (SEP) was found ahead of the growing ε-Fe2Al5 projections. A previous
work suggested that the Si enrichment can be due to the low solubility of Si in ε-Fe2Al5.
In the present work, it was identified that the low Si solubility of ε-Fe2Al5 is not a
necessary condition for the formation of SEP. SEP can result from the relatively slower
diffusion of Si than Fe. The Si concentration of SEP was found to rise with the increasing
Si content in the cast iron matrix and also the corrosion rate. The Si enrichment was
believed to facilitate the corrosion by depleting the C ahead of the growing ε-Fe2Al5.
The existence of near stoichiometric Fe3Si (SEP) was recognized for the first time in Fe-
liquid/solid Al couples. This phase was found to form in high Si ( > 3 wt.%) DCIs. Also
these alloys corroded at a greater rate than the cast irons with lower Si contents. The Fe
diffusion in stoichiometric Fe3Si is known to be faster than the non-stoichiometric Fe3Si
(with lower Si content), which can facilitate a higher corrosion rate of high Si cast irons.
The current research reported formation of κ-Fe3AlC in Fe-liquid Al couples for the first
time. The fraction of this phase increased with the carbon present in the cast iron or steel
matrix. Moreover, a higher thickness of the ternary κ-Fe3AlC compound layer
corresponded to a better liquid Al corrosion resistance of a cast iron or steel matrix.
The existence of Al4C3 has been confirmed for the first time in Fe-liquid Al systems.
Intermetallic layers of cast irons and steels exposed to liquid Al have been found to
contain Al4C3. Thus all ferrous alloys containing cementite may be susceptible to the
formation Al4C3 when exposed to liquid Al. The present work identified that in a

249
cementite/liquid Al interaction, the Al4C3 formation is possible at temperatures 750°C-
950°C. However, according to the literature, in the case of graphite/liquid Al couples, the
Al4C3 formation occurs at temperatures ≥1000°C.
The literature indicated that the presence of higher C in steels reduces the corrosion rate,
which was attributed to the increase in cementite content in the steel microstructure.
Unfortunately, the identification of the underlying mechanisms could not be achieved in
the past. The present research explored the mechanism of cementite transformation into
Al4C3 and Fe-Al phases (at the cast iron/liquid Al interface), which occurred at a
significantly higher rate compared to its transformation to austenite or graphite. It was
conjectured that the formation of carbon rich phases, Al4C3 and κ-Fe3AlC, consumes a
part of the diffused Al and complicates the Fe/Al diffusion paths, therefore reducing the
corrosion rate.
6.3 Intermetallic Layer Growth and Dissolution
The kinetics of dissolution and intermetallic layer growth were also determined to predict
the effect of microstructure and chemical composition on the mechanisms controlling the
corrosion rate of cast irons and steels.
Liquid Al temperature played an important part in the growth of Fe-Al intermetallic
layers formed on ferrous substrates. Increasing the temperature was found to accelerate
the material loss and change the growth of the intermetallic layers of cast irons and steel.
At 750°C, 850°C and 950°C, the intermetallic layer thickness of GCIs increased with
increasing exposure time, whereas the DCIs and steel showed negative deviations from
this behaviour. Graphite flakes in GCIs possibly provide mechanical support to the
intermetallic layer, which was believed to suppress the liquid Al corrosion and leads to
the thicker intermetallic layers with rise in temperature (750°C-950°C).
250
At 750°C and 850°C, the time exponents (n) for the power law growth of intermetallic
layers of ferrous alloys were varied between 0.32-0.54 (t = 60s-1200s), and the value of n
for a low carbon cast steel (CS) and a high Si ferritic DCI (DCI-C) was close to 0.5. With
a rise in temperature to 950°C, a large decrease in n was found especially in the case of
DCIs.
A thinner layer and/or a decrease in growth rate of the intermetallic layer with a rise in
temperature (750°C-950°C) reflected the higher susceptibility of a cast iron to liquid Al
corrosion. This type of relationship can be utilized to predict the relative corrosion
resistance of ferrous alloys in static and forced flow conditions of liquid Al.
The thinning and/or decrease in the growth rate of the intermetallic layers with a rise in
temperature was found to vary directly with increasing Si contents in cast irons, which
indicated that increasing Si additions affect the properties of the intermetallic layer. As
the available literature suggested that a decrease in intermetallic layer thickness can
enhance the compound formation rate. With a decrease in intermetallic layer thickness a
higher corrosion rate is expected. Therefore, Si not only weakens the cast iron matrix
against liquid Al corrosion by promoting ferrite or low carbon matrix at exposure
temperatures, it also leads to enhanced susceptibility of the intermetallic layer to
dissolution and/or spallation.
Under static melt conditions, the dissolution of ferrous alloys was found to be a linear
function of exposure time. Thinning of the intermetallic layer was observed with
increasing exposure time in the cases of alloys having higher dissolution rates.
Dissolution and/or spallation of the intermetallic layer are believed to be the cause of the
negative deviations of the intermetallic layer growth from the parabolic law. These
251
findings also suggest that the dissolution and/or spallation of the intermetallic layer can
be the primary mode of liquid Al corrosion.
3-D characterization of deep-etched specimens showed the true morphology of the
intermetallic layers of steel and DCIs. The surface morphologies of ε-Fe2Al5 columns for
both types of ferrous alloys were found to be entirely different. The presence of Si in cast
irons changes the surface morphology of the interfacial layer by forming iron rich Fe-Al-
Si or Fe-Si phases. The existence of these phases made the ε-Fe2Al5 surface
discontinuous, which may be related to the fragility or poor mechanical strength of the
intermetallic layer causing a higher tendency to spallation. However, there may be
another physical or chemical phenomenon by which Si present in the bulk and/or at the
outer surface of ε-Fe2Al5 enhances the spallation and/or dissolution tendency of the
intermetallic layer.
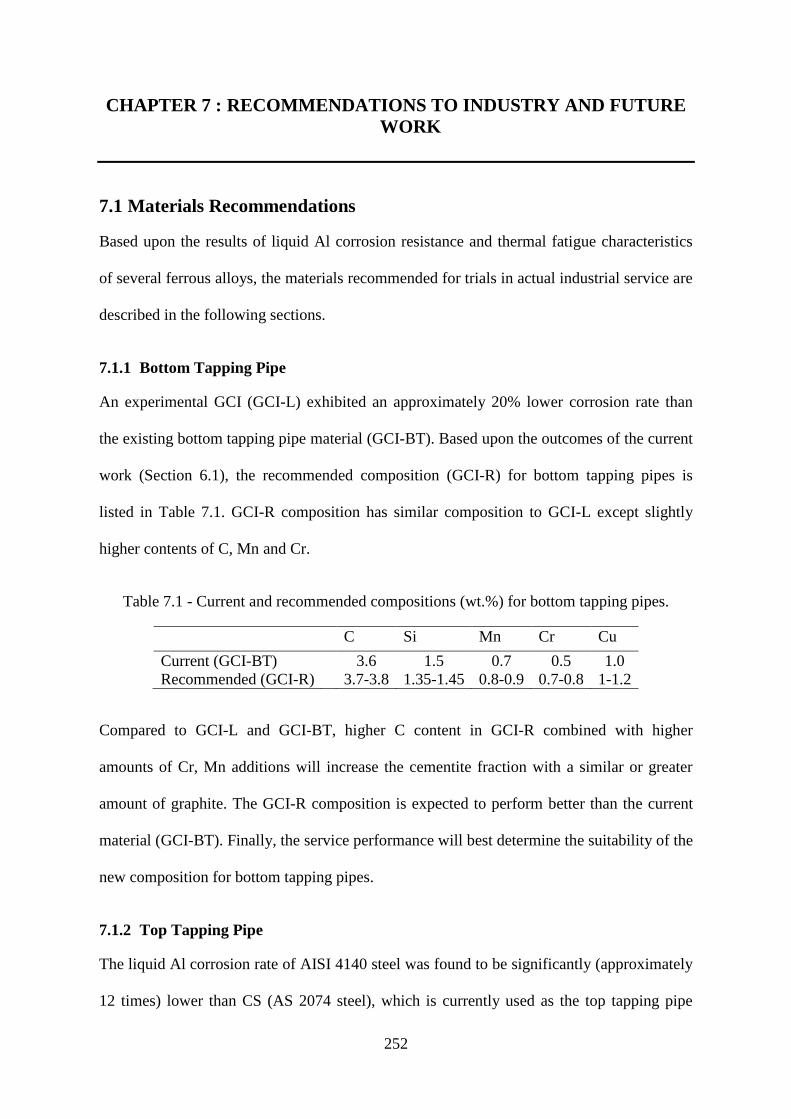
252
CHAPTER 7 : RECOMMENDATIONS TO INDUSTRY AND FUTURE
WORK
7.1 Materials Recommendations
Based upon the results of liquid Al corrosion resistance and thermal fatigue characteristics
of several ferrous alloys, the materials recommended for trials in actual industrial service are
described in the following sections.
7.1.1 Bottom Tapping Pipe
An experimental GCI (GCI-L) exhibited an approximately 20% lower corrosion rate than
the existing bottom tapping pipe material (GCI-BT). Based upon the outcomes of the current
work (Section 6.1), the recommended composition (GCI-R) for bottom tapping pipes is
listed in Table 7.1. GCI-R composition has similar composition to GCI-L except slightly
higher contents of C, Mn and Cr.
Table 7.1 - Current and recommended compositions (wt.%) for bottom tapping pipes.
C Si Mn Cr Cu
Current (GCI-BT) 3.6 1.5 0.7 0.5 1.0
Recommended (GCI-R) 3.7-3.8 1.35-1.45 0.8-0.9 0.7-0.8 1-1.2
Compared to GCI-L and GCI-BT, higher C content in GCI-R combined with higher
amounts of Cr, Mn additions will increase the cementite fraction with a similar or greater
amount of graphite. The GCI-R composition is expected to perform better than the current
material (GCI-BT). Finally, the service performance will best determine the suitability of the
new composition for bottom tapping pipes.
7.1.2 Top Tapping Pipe
The liquid Al corrosion rate of AISI 4140 steel was found to be significantly (approximately
12 times) lower than CS (AS 2074 steel), which is currently used as the top tapping pipe
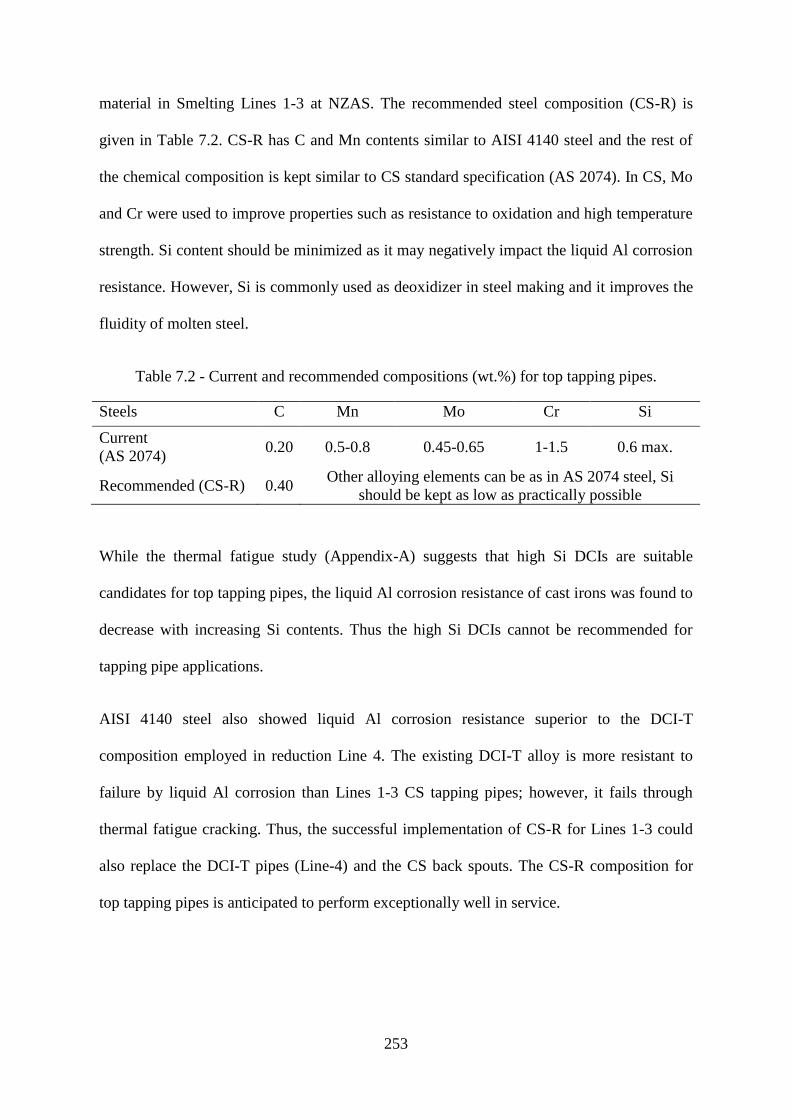
253
material in Smelting Lines 1-3 at NZAS. The recommended steel composition (CS-R) is
given in Table 7.2. CS-R has C and Mn contents similar to AISI 4140 steel and the rest of
the chemical composition is kept similar to CS standard specification (AS 2074). In CS, Mo
and Cr were used to improve properties such as resistance to oxidation and high temperature
strength. Si content should be minimized as it may negatively impact the liquid Al corrosion
resistance. However, Si is commonly used as deoxidizer in steel making and it improves the
fluidity of molten steel.
Table 7.2 - Current and recommended compositions (wt.%) for top tapping pipes.
Steels C Mn Mo Cr Si
Current
(AS 2074) 0.20 0.5-0.8 0.45-0.65 1-1.5 0.6 max.
Recommended (CS-R) 0.40 Other alloying elements can be as in AS 2074 steel, Si
should be kept as low as practically possible
While the thermal fatigue study (Appendix-A) suggests that high Si DCIs are suitable
candidates for top tapping pipes, the liquid Al corrosion resistance of cast irons was found to
decrease with increasing Si contents. Thus the high Si DCIs cannot be recommended for
tapping pipe applications.
AISI 4140 steel also showed liquid Al corrosion resistance superior to the DCI-T
composition employed in reduction Line 4. The existing DCI-T alloy is more resistant to
failure by liquid Al corrosion than Lines 1-3 CS tapping pipes; however, it fails through
thermal fatigue cracking. Thus, the successful implementation of CS-R for Lines 1-3 could
also replace the DCI-T pipes (Line-4) and the CS back spouts. The CS-R composition for
top tapping pipes is anticipated to perform exceptionally well in service.
254
7.2 Future Work
GCIs have proved to be the best ferrous materials to combat liquid Al corrosion. In the
present work, the liquid Al corrosion resistance of various GCIs was compared only on
the basis of the amounts of ferrite, graphite and cementite. It would be interesting to
further reveal the effect of morphology, size and distribution of graphite flakes and
cementite particles on material removal rate in liquid Al melts.
Heat treatments can cause various types of microstructural and physical changes in cast
irons, such as changing the phase fractions and internal oxidation, which may be studied
to achieve a cast iron with a better performance in service. In the present work, the range
of Si content in cast iron alloys was only varied between 1.38-3.35 (wt.%). Efforts may
be made to determine the critical amounts of Si at which the corrosion rate will be
minimum or maximum. Likewise, the increased amount of carbon in steels is beneficial
in enhancing the liquid Al corrosion resistance. However, the optimum amount of carbon
associated with the least dissolution in liquid Al melts is yet to be determined.
Findings presented in this thesis identified that, higher Si additions in cast irons change
the nature of intermetallic layers leading to a higher tendency towards
spallation/dissolution in liquid Al. However, the inherent mechanism(s) by which Si
causes such changes is not completely understood, which may be a challenge for future
research.
In the current research, all the materials were selected for comparison under the
constraints of two desirable properties (liquid Al corrosion resistance and thermal fatigue)
and the final product cost. Considering the available literature on the high temperature
properties of cast irons and the cost of high alloy cast irons, only low alloy compositions
of cast irons/steels were studied. Therefore, only the effects of low alloy additions of Mo,
255
Cr and Cu were revealed, and higher amounts of these elements may influence the liquid
Al corrosion in a different way. Also the other pearlite and/or carbide promoting elements
such as V and Ti can be given a trial. However, a relatively higher cost of these elements
may be a constraint in employing the V and/or Ti alloyed cast irons to industrial
applications.
In addition to the modifications in the chemical composition, external factors such as the
design features of tapping pipes and the casting design (position and size of risers, gates
etc.) can also affect the service life of tapping pipes. For example, during solidification,
the formation of shrinkage cavities can act as stress raisers leading to the eventual origin
of cracks during service. Research endeavours may be made to address the effect of pipe
design and casting design factors, which can further help in enhancing the service life of
tapping pipes and similar types of hardware used in the Al industry.
256
APPENDIX A : THERMAL FATIGUE RESISTANCE OF GRAY AND
DUCTILE CAST IRONS
Thermal fatigue often causes failure in applications including brake drums and rotors, ingot
moulds, exhaust manifolds, cylinder heads of high performance diesel engines, moulds used
for glass and pig iron castings. Selecting a cast iron for thermal cycling conditions is largely a
matter of trial and error because resistance to thermal fatigue is a complex, extrinsic material
property that depends on intrinsic properties such as thermal conductivity, thermal
expansivity, modulus of elasticity and high temperature strength. Furthermore, cast irons
have complex microstructures consisting of graphite in various shapes and a variety of matrix
structures, which makes the selection of cast iron for a particular application under thermal
fatigue difficult.
This appendix describes the various test apparatuses that were developed to assess the
thermal fatigue resistance of cast irons for tapping pipe applications. Finally, the obtained
results on the thermal fatigue resistance of candidate ferrous alloys are discussed. It is
anticipated that the present research effort will provide another piece to the puzzle of the
thermal fatigue resistance of cast irons.
A.1 Literature Review
A.1.1 Types of Thermal Fatigue Failures
It is important to know the type of failures that occur by thermal stresses. Cast iron
components when subjected to temperature cycling may fail in the following ways:
a) Cracks first appear in the hot zone of the component and may eventually propagate
through the section as observed in brittle materials like GCIs [1].
b) Severe distortion which ultimately renders the component useless. This type of failure is
usually found in DCI components [1].
257
c) Gross cracking through the entire section during the first few cycles. These failures
emanate from the mismatching of materials selected, improper design and random thermal
cycling [1].
d) Lowering of the mechanical properties of materials owing to metallurgical variations such
as microstructural changes and internal oxidation, which can lead to premature failure of
the components [1].
A.1.2 Material Properties Affecting the Thermal Fatigue Resistance of Cast Irons
There are several material properties upon which the thermal fatigue resistance of cast irons
depends. The most important of these are described as follows:
A.1.2.1 Thermal Diffusivity
The temperature gradient induced in a material depends upon the rate of distribution of heat,
which is known as thermal diffusivity (k) and expressed as:
pρC
Kk (A.1)
where K is the thermal conductivity, ρ is the density and Cp the specific heat capacity.
k of metals usually decreases with temperature. For cast irons, k decreases by a factor of two
when the shape of graphite is changed from flake-like to spherical, because in the case of
GCIs, the dispersion of highly conductive graphite flakes provides easy pathways for heat
flux leading to a higher K [2].
A.1.2.2 Thermal Expansion
Cast irons have a complex internal structure, typically a composite of carbon steel and
graphite clusters of various types. The thermal expansion (α) of cast irons is much more
complex than many other materials, because the volume fractions of ferrite, pearlite, austenite
and graphite changes during heating. This change in volume fraction primarily depends upon
258
the increase in the C content of ferrite and austenite during heating. The change in C content
causes a lattice expansion, which also influences α. It is assumed that graphite loses contact
with the iron matrix owing to the lower density of graphite relative to cast iron. The iron can
now be considered to contain pores instead of graphite, and the thermal expansion can
compared to that of steel. In addition, C content in austenite increases with temperature. The
austenite lattice expands with the increasing C content and the expansion thus consists of two
parts (a) thermal expansion and (b) austenite expansion [2].
A.1.2.3 Elastic Modulus and Strength
The low elastic modulus (E) of a material means a temperature gradient (∆T) will create
stresses (σ) of low magnitude (Equation A.2) [3]. In general, a material with high E and high
α is assumed to have low resistance to thermal fatigue, but at the same time it may have an
adequate strength.
σ = Eα∆T (A.2)
It is shown that E and α are lower and k is higher for a cast iron with flake graphite as
opposed to compacted or spheroidal morphologies. Thus, GCIs are believed to possess a
higher fatigue resistance than CGIs or DCIs [1].
A.1.2.4 Oxidation and Phase Transformations
DCIs appear to be more suitable for use at higher temperatures because they are more
oxidation resistant than GCIs and because a ferritic grade can be used to overcome the
problem associated with pearlite decomposition. The oxidation rate at the surface of DCI is
about the same as that of GCIs of similar Si content; however, the internal oxidation is
negligible [1].
The ferrite to austenite transformation temperature is largely a function of Si content, and
generally lies between 700oC and 900
oC. Thermal cycling of cast irons in this temperature

259
region causes partial or complete austenization and retransformation to a new structure takes
place depending upon the cooling rate [1].
A.1.2.5 Growth
When cast irons are subjected to prolonged periods of continuous or cyclic heating, they have
a tendency to swell, which may occur due to factors such as the decomposition of carbides,
structural change of pearlite to ferrite and graphitization. Growth can be reduced either by
producing a ferritic matrix with no pearlite or by stabilizing the carbides so as to prevent their
breakdown into ferrite and graphite [1].
A.1.2.6 Creep
Creep is primarily important where the component is constrained, implying that the
component is not free to expand or contract under thermal loading. However, these
constraints may be external or internal depending upon the component design and prevailing
service conditions. During alternating heating and cooling cycles, materials creep under the
effect of induced compressive and tensile stresses. Under constrained specimen tests, the
GCIs with greatest resistance to creep were found to be most resistant to thermal cycling [4].
A.1.3 Thermal Fatigue Resistance of Cast Irons
For a particular service application, suitability of a cast iron depends upon several factors as
discussed in previous sections. In cast irons, strength, E and K are closely interrelated owing
to their dependence on graphite flake size and morphology. Higher graphite content in GCIs
increases K, decreases E and reduces strength. For example, a pearlitic GCI with A-type
graphite has good K and low E but comparatively low strength. On the downside, the
pearlitic GCIs have limited structural stability and low resistance to oxidation. However, they
are economically attractive, so the bulk of cast irons used under thermal cycling conditions

260
are in fact GCIs [1]. As mentioned before, ferritic DCIs are structurally stable and almost
immune to internal oxidation. Drawbacks are high E, low K and a higher cost than GCIs [1].
The literature on the thermal fatigue of gray and DCIs comprises several investigations,
which were carried out using a variety of thermal fatigue test methods, thermal cycling
conditions, specimen geometry and microstructures of cast irons. The majority of studies
were focused upon the thermal fatigue resistance of GCIs only [1, 4, 5-6], and only a few
studies considered the DCIs [1, 6]. Table A.1 summarizes the results obtained by various
researchers and are arranged in descending order of thermal fatigue resistance of the cast
irons. This review of the literature demonstrates the lack of information available for
selecting a type of cast iron for a particular application under thermal fatigue.
a) Rukadikar and Reddy [5] found that the thermal fatigue resistance of GCIs largely
depends upon graphite morphology, degree of pearlite refinement and chemical
composition. High C cast irons were found to have superior thermal fatigue resistance and
alloy additions such as Mo, Mo+Cr and Cr+3 wt.% Cu imparted good thermal fatigue
resistance to GCIs.
b) Roehrig [1] found that in the temperature range of 590°C-200°C, alloying with Mo and Cr
improves performance. In the temperature range of 690°C-240°C, DCIs outperformed the
GCIs, while the compacted graphite irons exhibited intermediate thermal fatigue resistance
between GCIs and DCIs.
c) Shea [6] found that an unalloyed DCI having 3.62 wt.% C and 2.64 wt.% Si exhibited the
best thermal fatigue resistance followed by a GCI alloyed with Cr, Mo and Sn. Thermal
resistance of a GCI containing Cr, Mo and Al was found to be very poor. Shea concluded
that graphite morphology has a greater effect on the thermal fatigue resistance than the
matrix microstructure.

261
d) Gundlach [4] found that a low C (3.2 wt.% C) GCI with Mo and Cr alloying elements
showed superior thermal fatigue resistance compared to the cast irons with higher C
contents. It was concluded that thermal fatigue was very much dependent on the resistance
to creep and, to a lesser extent, on the tensile strength.
Table A.1 - Summary of the literature on the thermal fatigue resistance of cast irons.
Test conditions
Alloys under test
(In descending order of thermal fatigue resistance )
Results
Type
Composition Wt.% (Balance Fe) Cycles to
first major
crack C Si Mn Mo Cr Cu Others
Rukadikar and Reddy [5]
Tmax= 700oC
Tmin = 40oC
Disc with a central hole.
Molten salt heating-water
cooled
GCI
3.93 1.06 0.7 1.0 -- -- -- 40
3.00 1.98 0.7 0.3 0.7 -- -- 40
3.93 1.06 0.7 -- 1.0 3.1 -- 39
3.00 1.98 0.7 1.0 -- -- -- 36
3.93 1.06 0.7 0.3 0.72 -- -- 32
3.93 1.06 0.7 -- -- -- -- 30
Roehrig [1]
Tmax= 590oC
Tmin = 200oC
Disc with a central hole
Cycled in fluidized bed
alumina
GCI
3.40 1.66 0.58 0.4 0.50 -- -- 1550
3.45 1.68 0.63 0.3 0.30 0.87 0.97Ni 1475
3.44 1.69 0.58 0.3 0.21 0.30 0.77Ni 1325
3.45 1.74 0.59 -- 0.49 0.59 0.6 Ni 1075
3.43 1.65 0.60 -- -- -- -- 925
Roehrig [1]
Tmax= 690oC
Tmin = 240oC
Disc with a central hole
Cycled in fluidized bed
alumina
DCI 3.7 2.17 -- -- -- -- -- 800
3.7 2.17 -- 0.2 -- -- -- 800
CGI*
3.7 1.80 -- 0.4 0.20 -- -- 510
3.7 1.80 -- -- 0.20 -- -- 460
3.7 1.80 -- -- 0.20 -- -- 380
3.7 1.80 -- 0.5 0.20 -- -- 380
GCI 3.7 2.17 -- 0.2 0.26 -- -- 370
3.84 1.65 -- -- 0.15 -- -- 220
Shea [6]
Tmax= 850oC
Tmin = 65oC
Disc shape specimens
Induction heating-water
cooled
Steel 0.84 2.06 0.66 0.2 0.29 -- -- 180
DCI 3.62 2.64 0.48 -- -- -- -- 50
GCI 3.93 2.37 0.78 0.3 0.22 -- 0.21Sn 22
3.49 2.37 0.84 0.2 0.24 -- -- 12
3.48 0.60 0.88 0.2 0.23 -- 2.37Al 5
3.50 2.38 0.83 0.7 0.30 1.51 -- 5

262
Test conditions Type Composition Wt. % (Balance Fe) Results
C Si Mn Mo Cr Cu Other
Gundlach [4]
Tmax= 540oC
Tmin = 100oC
Test bar with ends
fixed.
Induction heating-
water cooled
GCI
3.26 1.56 0.63 0.76 0.20 0.10 0.11Ni 511#
3.40 1.76 0.65 0.48 0.31 0.11 0.11Ni 288#
3.43 1.66 0.58 0.39 0.50 0.12 0.1Ni 221#
3.44 1.69 0.58 0.38 0.21 0.30 0.1Ni 178#
3.45 1.68 0.63 0.30 0.30 0.87 0.97Ni 139#
3.44 1.74 0.76 -- 0.12 1.48 0.3V 124#
3.45 1.74 0.59 -- 0.49 0.59 0.6Ni 78#
3.43 1.65 0.57 -- 0.11 -- 0.1 Ni 51#
3.39 1.75 0.64 -- 0.30 0.11 0.1Ni 48#
*Compacted graphite iron,
# number of cycles to fracture
According to Roehrig [1], where low cooling rates exist, high strength pearlitic GCIs or DCIs
alloyed with Si and Mo are best with regard to resistance to cracking and distortion. GCIs
with high graphite content give the best performance in the conditions where rapid cooling
and heating cause severe thermal gradients within the component. It was suggested that
increasing the C content up to 4 wt.% can be advantageous. Where medium cooling rates
exist, ferritic ductile and compacted graphite irons have the highest resistance to cracking [1].
The majority of the studies described above were carried out under a maximum cycle
temperature of 700°C. However, in the present application, tapping pipes are frequently
exposed to flowing liquid Al at temperatures of up to 950°C. Considering the service
conditions of tapping pipes, only a few thermal fatigue studies were found in which cast irons
were subjected to such a high temperature (> 900°C):
a) Chou et al. [7] compared the thermal fatigue resistance of CGI and GCI for the cast iron
moulds used for pig iron casting, (for compositional details see Table A.2). The higher
temperature of the mould surface was found to reach between 850°C-1000°C and after
pouring the molten pig iron, the outer surface of the mould was cooled by water spray to
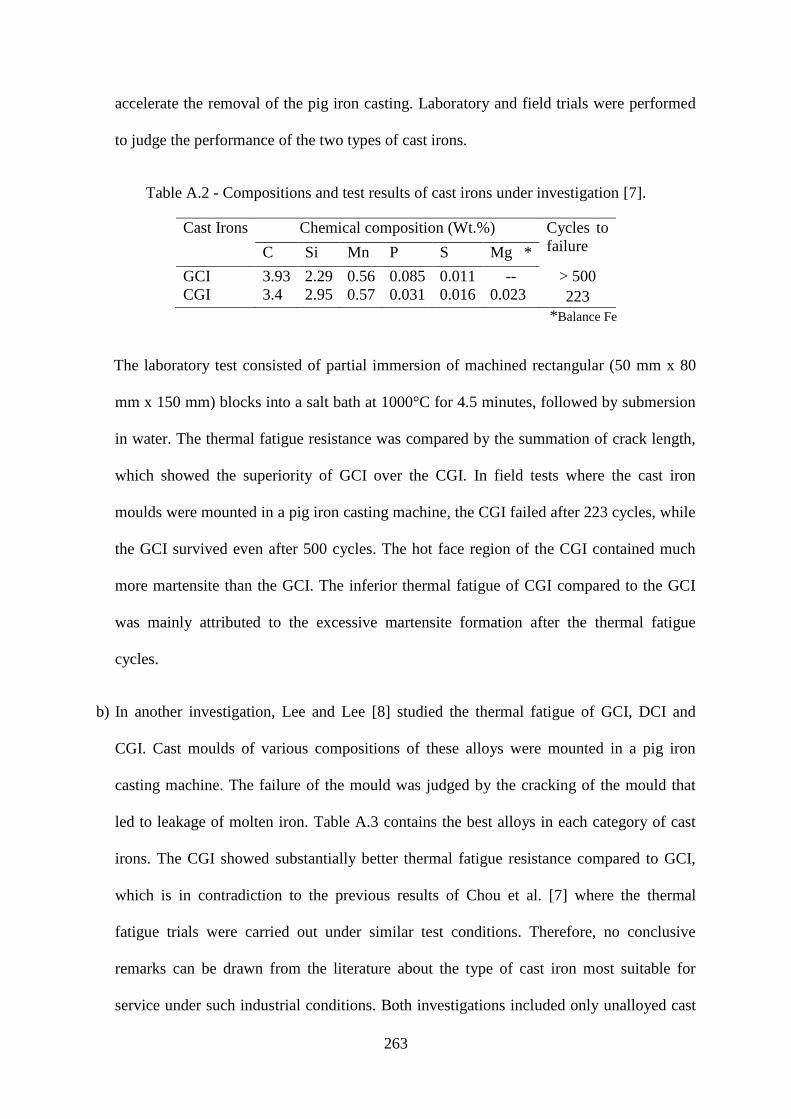
263
accelerate the removal of the pig iron casting. Laboratory and field trials were performed
to judge the performance of the two types of cast irons.
Table A.2 - Compositions and test results of cast irons under investigation [7].
Cast Irons Chemical composition (Wt.%) Cycles to
failure C Si Mn P S Mg *
GCI 3.93 2.29 0.56 0.085 0.011 -- > 500
CGI 3.4 2.95 0.57 0.031 0.016 0.023 223
*Balance Fe
The laboratory test consisted of partial immersion of machined rectangular (50 mm x 80
mm x 150 mm) blocks into a salt bath at 1000°C for 4.5 minutes, followed by submersion
in water. The thermal fatigue resistance was compared by the summation of crack length,
which showed the superiority of GCI over the CGI. In field tests where the cast iron
moulds were mounted in a pig iron casting machine, the CGI failed after 223 cycles, while
the GCI survived even after 500 cycles. The hot face region of the CGI contained much
more martensite than the GCI. The inferior thermal fatigue of CGI compared to the GCI
was mainly attributed to the excessive martensite formation after the thermal fatigue
cycles.
b) In another investigation, Lee and Lee [8] studied the thermal fatigue of GCI, DCI and
CGI. Cast moulds of various compositions of these alloys were mounted in a pig iron
casting machine. The failure of the mould was judged by the cracking of the mould that
led to leakage of molten iron. Table A.3 contains the best alloys in each category of cast
irons. The CGI showed substantially better thermal fatigue resistance compared to GCI,
which is in contradiction to the previous results of Chou et al. [7] where the thermal
fatigue trials were carried out under similar test conditions. Therefore, no conclusive
remarks can be drawn from the literature about the type of cast iron most suitable for
service under such industrial conditions. Both investigations included only unalloyed cast
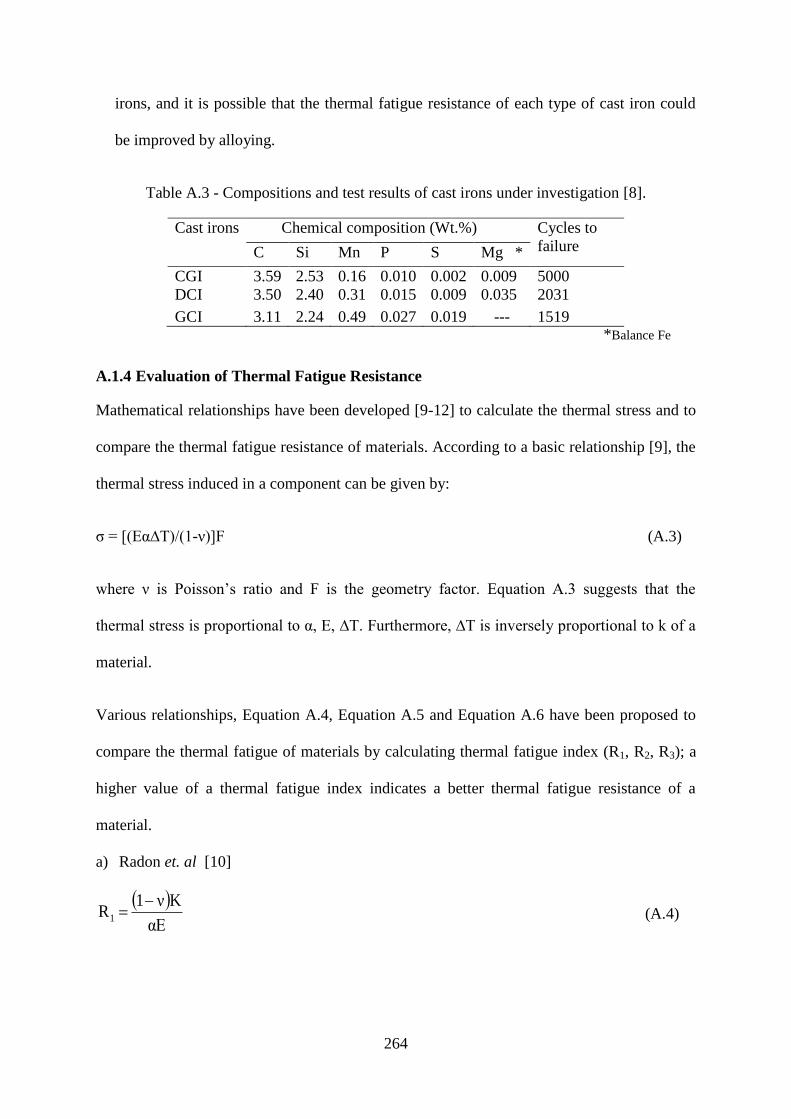
264
irons, and it is possible that the thermal fatigue resistance of each type of cast iron could
be improved by alloying.
Table A.3 - Compositions and test results of cast irons under investigation [8].
Cast irons Chemical composition (Wt.%) Cycles to
failure C Si Mn P S Mg *
CGI 3.59 2.53 0.16 0.010 0.002 0.009 5000
DCI 3.50 2.40 0.31 0.015 0.009 0.035 2031
GCI 3.11 2.24 0.49 0.027 0.019 --- 1519 *Balance Fe
A.1.4 Evaluation of Thermal Fatigue Resistance
Mathematical relationships have been developed [9-12] to calculate the thermal stress and to
compare the thermal fatigue resistance of materials. According to a basic relationship [9], the
thermal stress induced in a component can be given by:
σ = [(Eα∆T)/(1-ν)]F (A.3)
where ν is Poisson’s ratio and F is the geometry factor. Equation A.3 suggests that the
thermal stress is proportional to α, E, ∆T. Furthermore, ∆T is inversely proportional to k of a
material.
Various relationships, Equation A.4, Equation A.5 and Equation A.6 have been proposed to
compare the thermal fatigue of materials by calculating thermal fatigue index (R1, R2, R3); a
higher value of a thermal fatigue index indicates a better thermal fatigue resistance of a
material.
a) Radon et. al [10]
αE
Kν1R1
(A.4)
265
b) Hasselman [11]
αE
K(TS)ν1R 2
(A.5)
c) Lee and Chen [12]
αE
K(BHN)K(TS)ν1R
1/2
IC
21/2
3
(A.6)
where TS is tensile strength, BHN is Brinell hardness value and KIC is the fracture toughness.
Considering the equations above, various researchers (for example [13]) have obtained
controversial results with respect to the service life of cast irons used in different
environments. Literature on the thermal fatigue of cast irons indicates that there is a complex
interaction between the mechanical properties, maximum test temperature, and heating and
cooling conditions. The material properties vary with temperature, and the actual values at
operating temperature should be considered while evaluating the thermal fatigue resistance.
Moreover, the data concerning each of these properties for a range of cast iron compositions
at a range of elevated temperatures (600°C-1000°C) is difficult to obtain. In fact, the
available literature is only limited to 600°C [14]. For this reason, it is difficult to evaluate
theoretically the thermal fatigue resistance of cast irons for a particular application.
A.2 Service Conditions
The periodic flow of liquid Al (at about 950°C) through the tapping pipes creates an irregular
temperature distribution in circumferential, longitudinal and radial directions resulting in
differential expansion, which therefore induces complex stress conditions. Moreover, the
thermal stress conditions could become more severe when liquid Al contacts the regions
along the pipe where the bath is unable to solidify, details are found in Chapter 1. As a
general consideration, the pipe sections at lower temperatures remain in tension, and hot
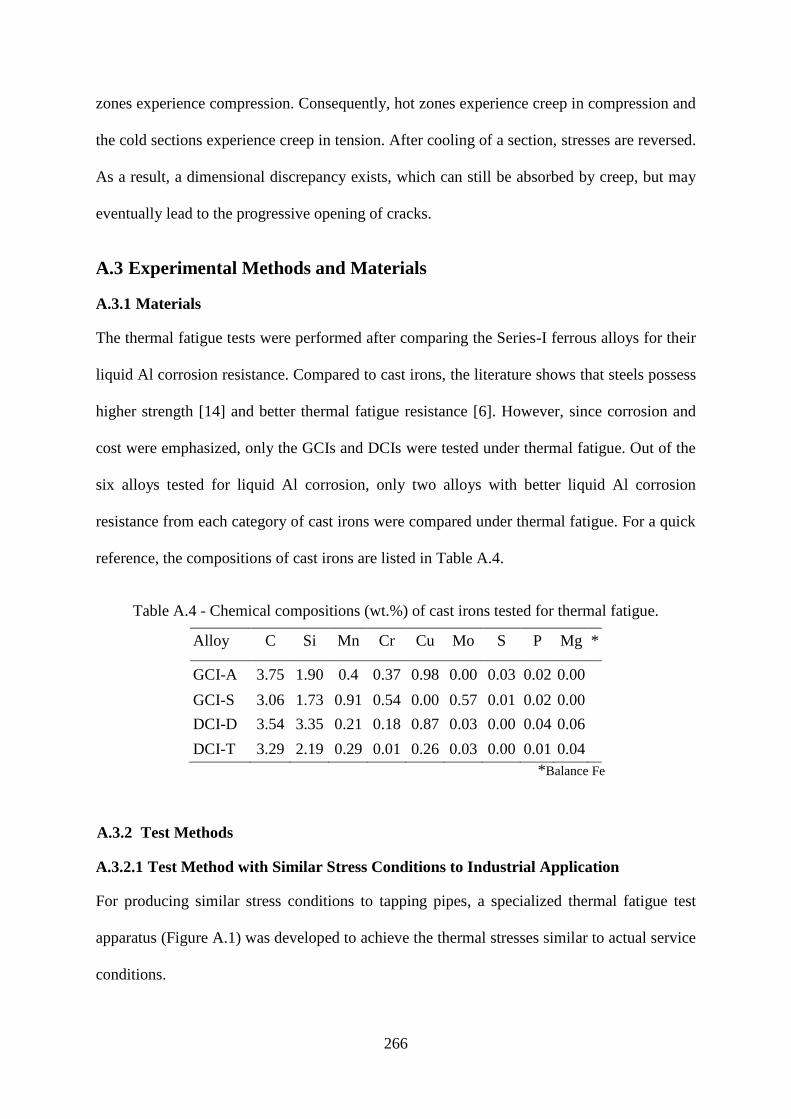
266
zones experience compression. Consequently, hot zones experience creep in compression and
the cold sections experience creep in tension. After cooling of a section, stresses are reversed.
As a result, a dimensional discrepancy exists, which can still be absorbed by creep, but may
eventually lead to the progressive opening of cracks.
A.3 Experimental Methods and Materials
A.3.1 Materials
The thermal fatigue tests were performed after comparing the Series-I ferrous alloys for their
liquid Al corrosion resistance. Compared to cast irons, the literature shows that steels possess
higher strength [14] and better thermal fatigue resistance [6]. However, since corrosion and
cost were emphasized, only the GCIs and DCIs were tested under thermal fatigue. Out of the
six alloys tested for liquid Al corrosion, only two alloys with better liquid Al corrosion
resistance from each category of cast irons were compared under thermal fatigue. For a quick
reference, the compositions of cast irons are listed in Table A.4.
Table A.4 - Chemical compositions (wt.%) of cast irons tested for thermal fatigue.
Alloy C Si Mn Cr Cu Mo S P Mg *
GCI-A 3.75 1.90 0.4 0.37 0.98 0.00 0.03 0.02 0.00
GCI-S 3.06 1.73 0.91 0.54 0.00 0.57 0.01 0.02 0.00
DCI-D 3.54 3.35 0.21 0.18 0.87 0.03 0.00 0.04 0.06
DCI-T 3.29 2.19 0.29 0.01 0.26 0.03 0.00 0.01 0.04
*Balance Fe
A.3.2 Test Methods
A.3.2.1 Test Method with Similar Stress Conditions to Industrial Application
For producing similar stress conditions to tapping pipes, a specialized thermal fatigue test
apparatus (Figure A.1) was developed to achieve the thermal stresses similar to actual service
conditions.

267
Figure A.1 - a) Thermal fatigue test apparatus, b) a view of rising liquid Al inside the test
pipe.
Test pipes of 450 mm length, 70 mm outer diameter and with 15 mm wall thickness were cast
to compare the thermal fatigue resistance of candidate materials. In this apparatus, liquid Al
is drawn inside a test pipe to a specified height by applying a vacuum for a specific period of
time and over a specified number of cycles. A specialized apparatus (Figure A.2) was
designed and built to control the vacuum inside the test pipes.
a
Vacuum line
View port
Test pipe
Vacuum chamber
Melting furnace
Pipe stand
b
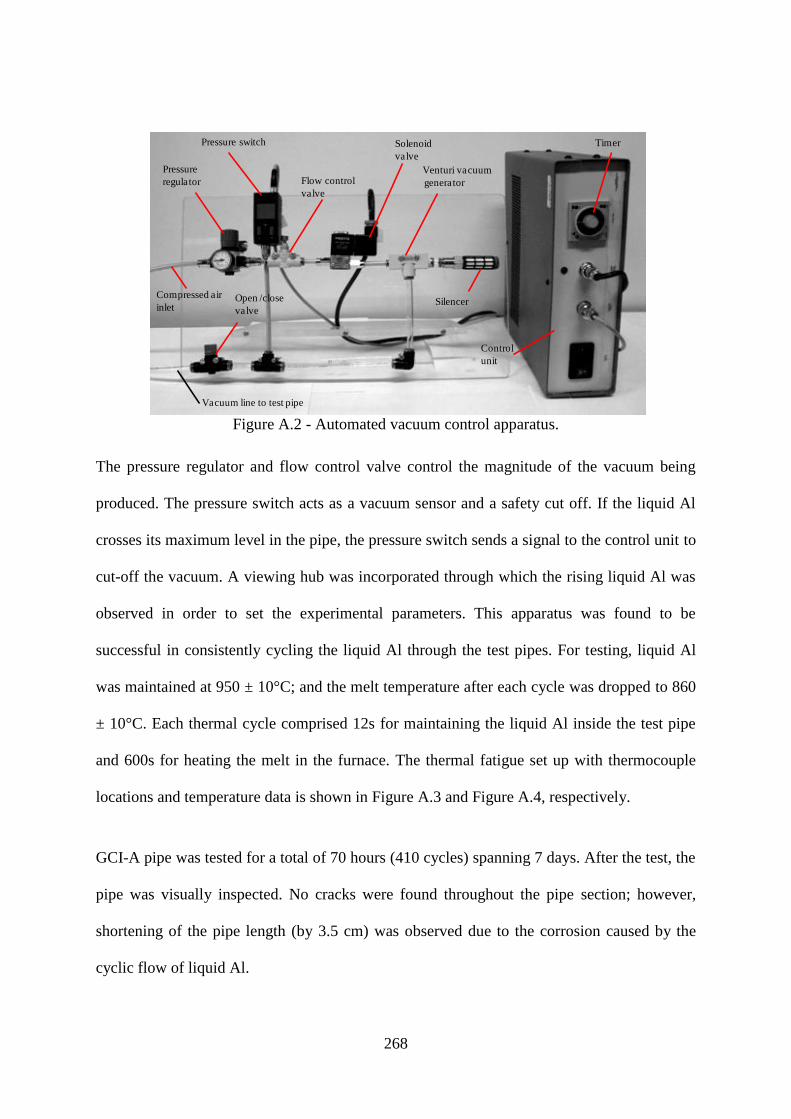
268
Figure A.2 - Automated vacuum control apparatus.
The pressure regulator and flow control valve control the magnitude of the vacuum being
produced. The pressure switch acts as a vacuum sensor and a safety cut off. If the liquid Al
crosses its maximum level in the pipe, the pressure switch sends a signal to the control unit to
cut-off the vacuum. A viewing hub was incorporated through which the rising liquid Al was
observed in order to set the experimental parameters. This apparatus was found to be
successful in consistently cycling the liquid Al through the test pipes. For testing, liquid Al
was maintained at 950 ± 10°C; and the melt temperature after each cycle was dropped to 860
± 10°C. Each thermal cycle comprised 12s for maintaining the liquid Al inside the test pipe
and 600s for heating the melt in the furnace. The thermal fatigue set up with thermocouple
locations and temperature data is shown in Figure A.3 and Figure A.4, respectively.
GCI-A pipe was tested for a total of 70 hours (410 cycles) spanning 7 days. After the test, the
pipe was visually inspected. No cracks were found throughout the pipe section; however,
shortening of the pipe length (by 3.5 cm) was observed due to the corrosion caused by the
cyclic flow of liquid Al.
Flow control
valve
Solenoid
valve
Pressure switch
Compressed air
inlet
Vacuum line to test pipe
Venturi vacuum
generator
SilencerOpen /close
valve
Control
unit
Timer
Pressure
regulator
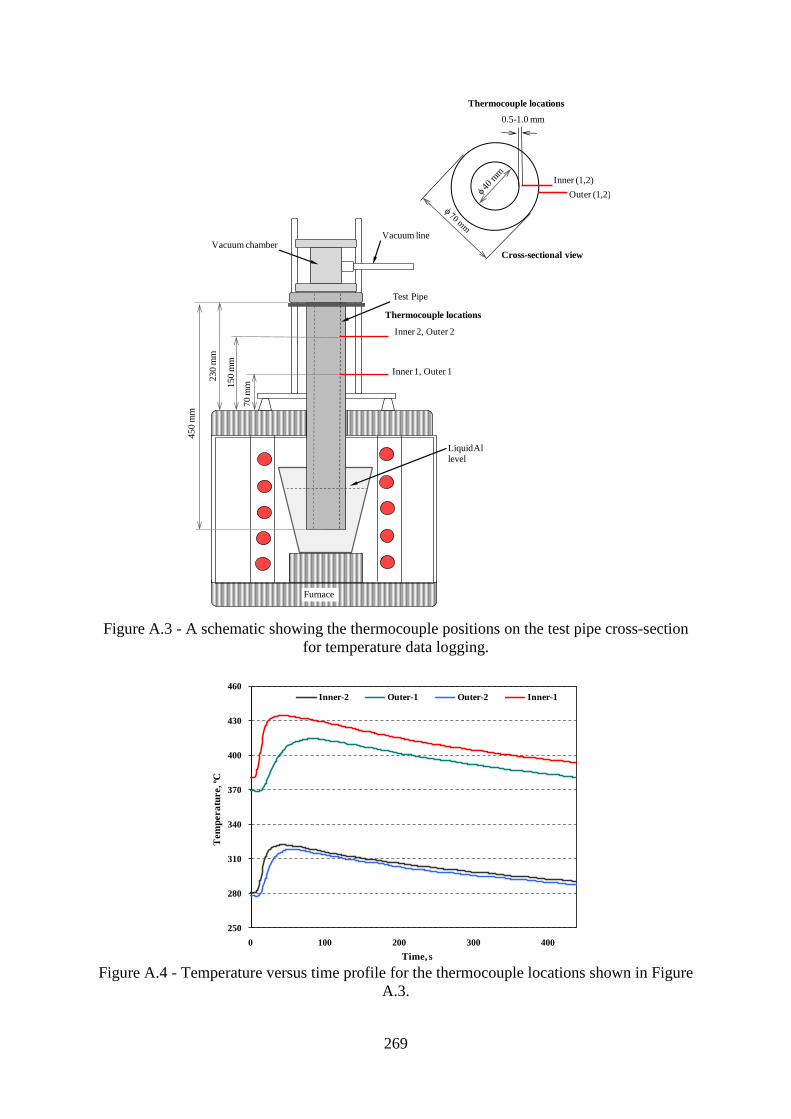
269
Figure A.3 - A schematic showing the thermocouple positions on the test pipe cross-section
for temperature data logging.
Figure A.4 - Temperature versus time profile for the thermocouple locations shown in Figure
A.3.
Inner 2, Outer 2
Inner 1, Outer 1
Thermocouple locations
70 m
m150 m
m
23
0m
m
LiquidAl level
Vacuum chamberVacuum line
Test Pipe
Furnace
450 m
m
Thermocouple locations
0.5-1.0 mm
Inner (1,2)
Outer (1,2)
Cross-sectional view
250
280
310
340
370
400
430
460
0 100 200 300 400
Tem
pera
ture, ºC
Time, s
Inner-2 Outer-1 Outer-2 Inner-1
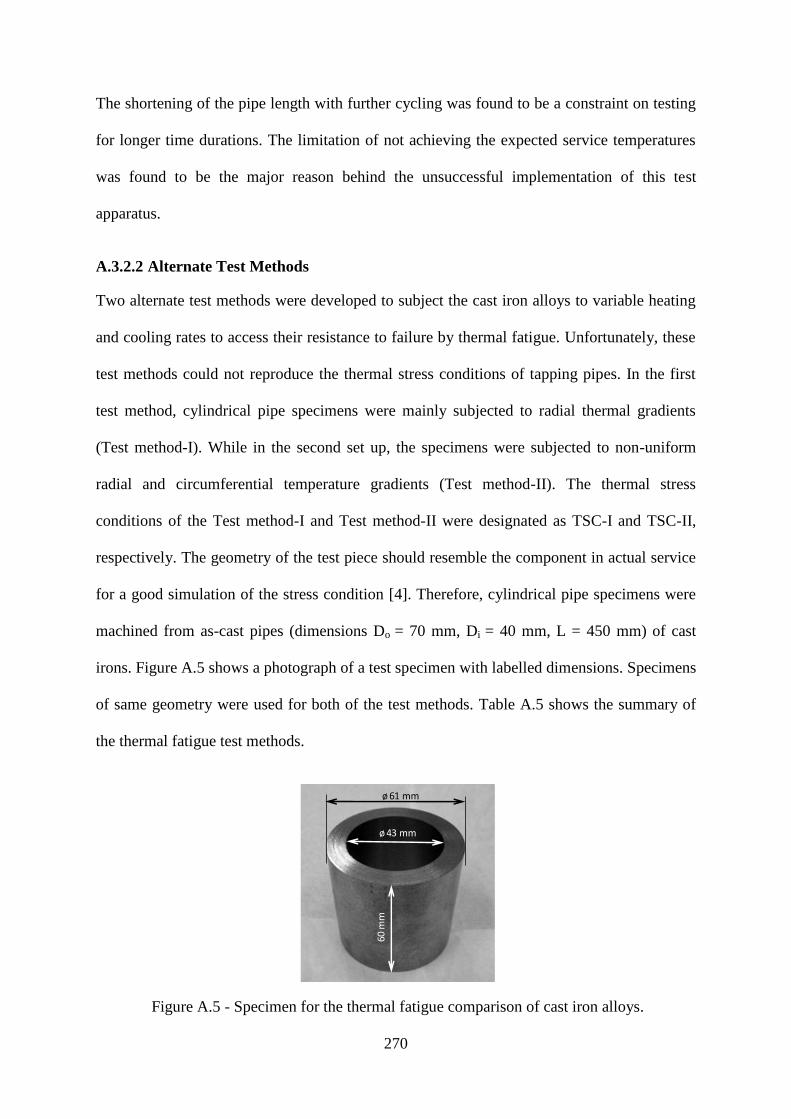
270
The shortening of the pipe length with further cycling was found to be a constraint on testing
for longer time durations. The limitation of not achieving the expected service temperatures
was found to be the major reason behind the unsuccessful implementation of this test
apparatus.
A.3.2.2 Alternate Test Methods
Two alternate test methods were developed to subject the cast iron alloys to variable heating
and cooling rates to access their resistance to failure by thermal fatigue. Unfortunately, these
test methods could not reproduce the thermal stress conditions of tapping pipes. In the first
test method, cylindrical pipe specimens were mainly subjected to radial thermal gradients
(Test method-I). While in the second set up, the specimens were subjected to non-uniform
radial and circumferential temperature gradients (Test method-II). The thermal stress
conditions of the Test method-I and Test method-II were designated as TSC-I and TSC-II,
respectively. The geometry of the test piece should resemble the component in actual service
for a good simulation of the stress condition [4]. Therefore, cylindrical pipe specimens were
machined from as-cast pipes (dimensions Do = 70 mm, Di = 40 mm, L = 450 mm) of cast
irons. Figure A.5 shows a photograph of a test specimen with labelled dimensions. Specimens
of same geometry were used for both of the test methods. Table A.5 shows the summary of
the thermal fatigue test methods.
Figure A.5 - Specimen for the thermal fatigue comparison of cast iron alloys.
ø 61 mm
ø 43 mm
60 m
m
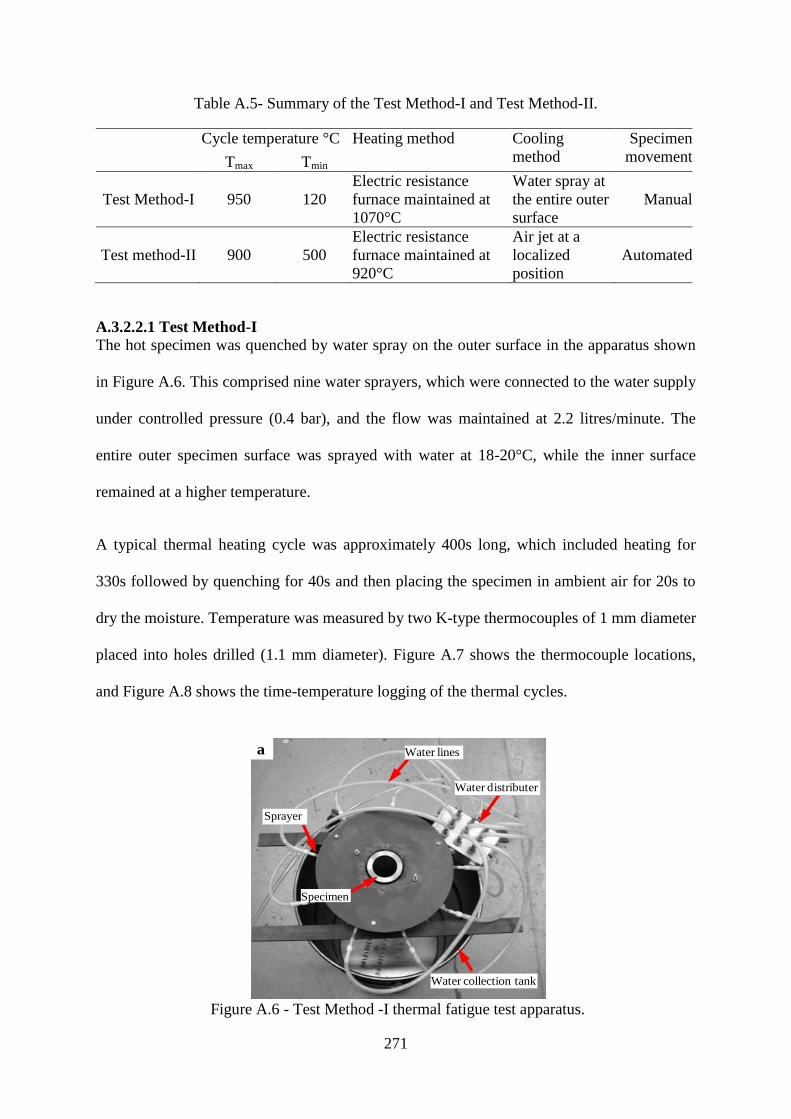
271
Table A.5- Summary of the Test Method-I and Test Method-II.
Cycle temperature °C Heating method Cooling
method
Specimen
movement Tmax Tmin
Test Method-I 950 120
Electric resistance
furnace maintained at
1070°C
Water spray at
the entire outer
surface
Manual
Test method-II 900 500
Electric resistance
furnace maintained at
920°C
Air jet at a
localized
position
Automated
A.3.2.2.1 Test Method-I
The hot specimen was quenched by water spray on the outer surface in the apparatus shown
in Figure A.6. This comprised nine water sprayers, which were connected to the water supply
under controlled pressure (0.4 bar), and the flow was maintained at 2.2 litres/minute. The
entire outer specimen surface was sprayed with water at 18-20°C, while the inner surface
remained at a higher temperature.
A typical thermal heating cycle was approximately 400s long, which included heating for
330s followed by quenching for 40s and then placing the specimen in ambient air for 20s to
dry the moisture. Temperature was measured by two K-type thermocouples of 1 mm diameter
placed into holes drilled (1.1 mm diameter). Figure A.7 shows the thermocouple locations,
and Figure A.8 shows the time-temperature logging of the thermal cycles.
Figure A.6 - Test Method -I thermal fatigue test apparatus.
Specimen
Water distributer
Water lines
Sprayer
Water collection tank
a
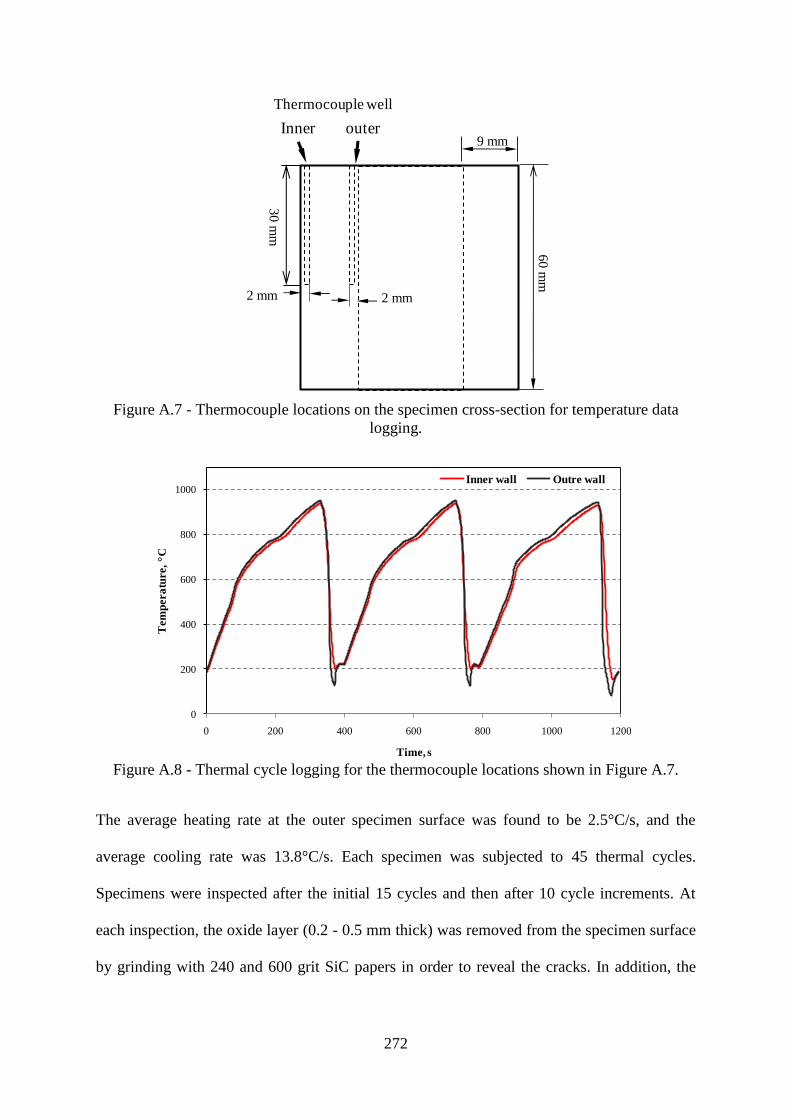
272
Figure A.7 - Thermocouple locations on the specimen cross-section for temperature data
logging.
Figure A.8 - Thermal cycle logging for the thermocouple locations shown in Figure A.7.
The average heating rate at the outer specimen surface was found to be 2.5°C/s, and the
average cooling rate was 13.8°C/s. Each specimen was subjected to 45 thermal cycles.
Specimens were inspected after the initial 15 cycles and then after 10 cycle increments. At
each inspection, the oxide layer (0.2 - 0.5 mm thick) was removed from the specimen surface
by grinding with 240 and 600 grit SiC papers in order to reveal the cracks. In addition, the
30 mm
Thermocouple well
Outer Inner
2mm2mm
60
mm
Inner outer
30
mm
2 mm 2 mm
9 mm
0
200
400
600
800
1000
0 200 400 600 800 1000 1200
Tem
pera
ture, C
Time, s
Inner wall Outre wall
273
removal of the oxide layer helps to minimize its effect on the cooling rate for different alloys
under investigation, because the GCIs are more susceptible to oxidation compared to DCIs.
A.3.2.2.2 Test Method-II
A specialized apparatus (Figure A.9) was designed and built to achieve the TSC-II
conditions. In this apparatus for continuous cycling for longer times, the test specimens were
moved pneumatically. An air cylinder was operated by a solenoid valve, which was
controlled by an automated timer. The control apparatus was used for automation with a few
modifications compared to the thermal fatigue apparatus consisting cycling of liquid Al
cycling through the test pipes.
To maintain the inner surface of the specimens at a higher temperature, specimens were filled
with loosely heaped sand and sealed with FIBERFRAX®
paste. Considering the large amount
of oxidation of cast irons, which occurred at 950°C (Test method-I), the maximum cycle
temperature was limited to 900°C.
The outer surface of the specimen was cooled by means of a compressed air jet (4 mm
diameter) at a constant pressure of 4 bar. Figure A.10 and Figure A.11 show the positions of
the thermocouples and cooling air jet. The total cycle time was 360s, which included 300s for
heating, 50s of cooling and 10s for specimen movement. For temperature data logging, three
K-type thermocouples (1 mm) were used (Figure A.10). Figure A.12 shows the time-
temperature profiles. The outer specimen surface (cooling side) was subjected to an average
heating rate of 1.3°C/s and a cooling rate of 8.1°C/s.
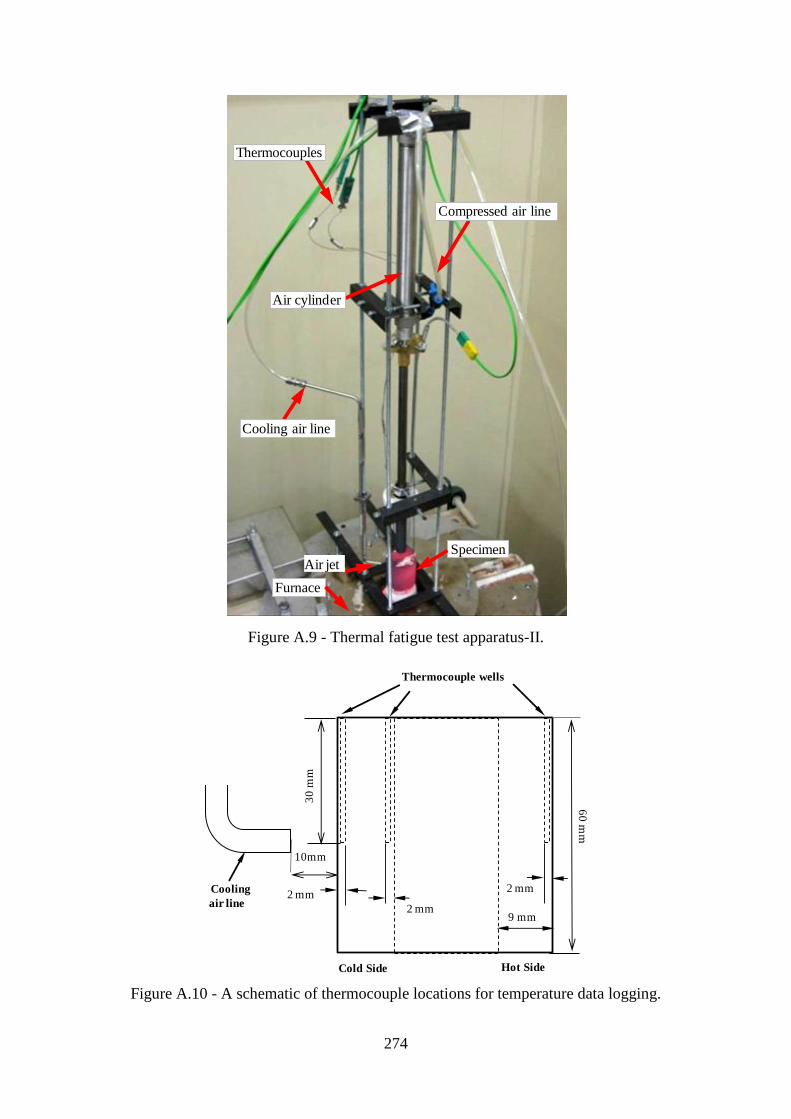
274
Figure A.9 - Thermal fatigue test apparatus-II.
Figure A.10 - A schematic of thermocouple locations for temperature data logging.
Cooling air line
Thermocouples
Air cylinder
Compressed air line
Specimen
Furnace
Air jet
60
mm
30
mm
10mm
Cold Side Hot Side
Cooling
air line
Thermocouple wells
2 mm2 mm
2 mm9 mm
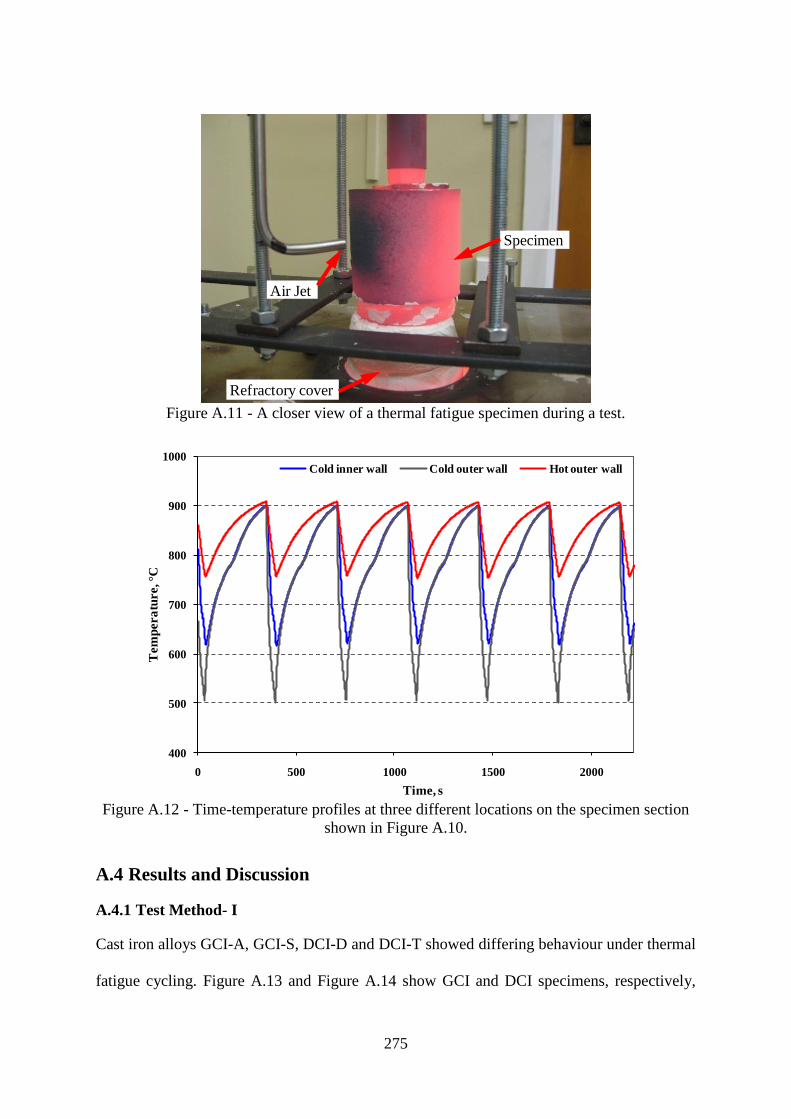
275
Figure A.11 - A closer view of a thermal fatigue specimen during a test.
Figure A.12 - Time-temperature profiles at three different locations on the specimen section
shown in Figure A.10.
A.4 Results and Discussion
A.4.1 Test Method- I
Cast iron alloys GCI-A, GCI-S, DCI-D and DCI-T showed differing behaviour under thermal
fatigue cycling. Figure A.13 and Figure A.14 show GCI and DCI specimens, respectively,
Air Jet
Specimen
Refractory cover
400
500
600
700
800
900
1000
0 500 1000 1500 2000
Tem
pera
ture, °C
Time, s
Cold inner wall Cold outer wall Hot outer wall
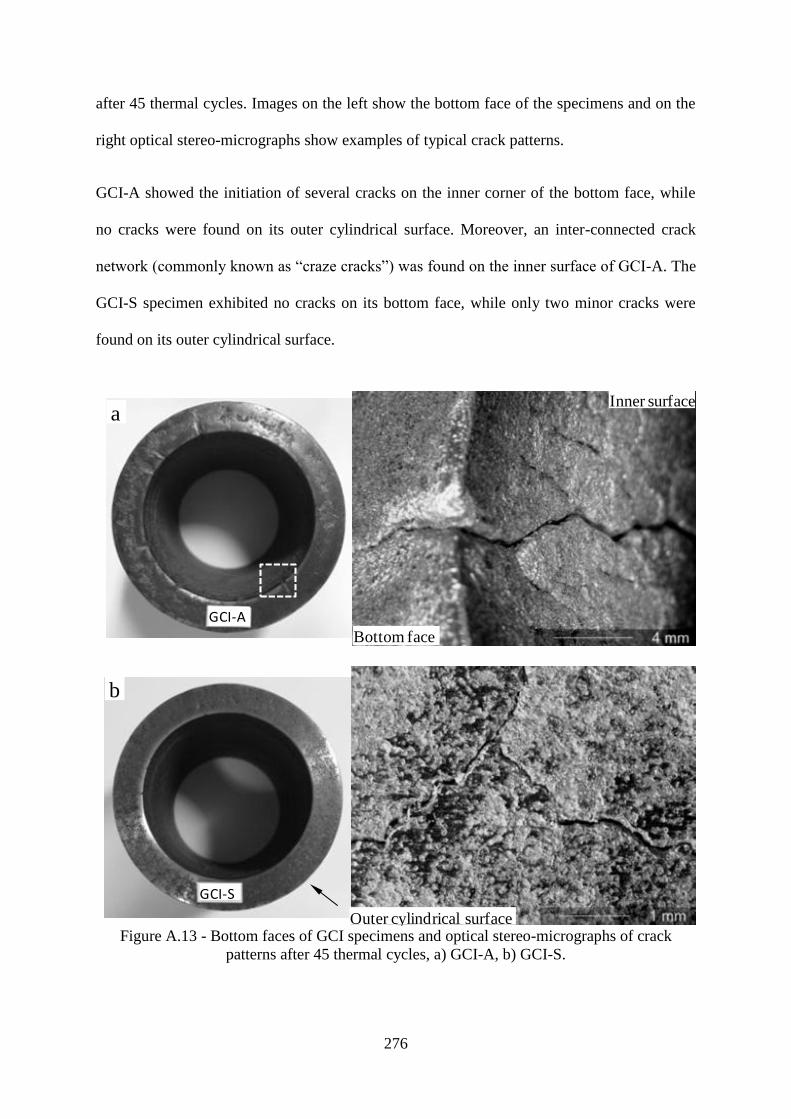
276
after 45 thermal cycles. Images on the left show the bottom face of the specimens and on the
right optical stereo-micrographs show examples of typical crack patterns.
GCI-A showed the initiation of several cracks on the inner corner of the bottom face, while
no cracks were found on its outer cylindrical surface. Moreover, an inter-connected crack
network (commonly known as “craze cracks”) was found on the inner surface of GCI-A. The
GCI-S specimen exhibited no cracks on its bottom face, while only two minor cracks were
found on its outer cylindrical surface.
Figure A.13 - Bottom faces of GCI specimens and optical stereo-micrographs of crack
patterns after 45 thermal cycles, a) GCI-A, b) GCI-S.
Inner surface
GCI-A
Bottom face
a
Outer cylindrical surface
GCI-S
b

277
The DCI-D specimen showed the least amount of surface oxidation and also no cracking at
its bottom face; however, a number of minor cracks were found on its outer cylindrical
surface distributed around its diameter and located approximately midway along the
specimen height.
Figure A.14 - Cast iron specimens and crack patterns after 45 thermal cycles, a) DCI-D, b)
DCI-T.
In the case of DCI-T, a major crack opening on the bottom inner corner can be seen in Figure
A.14 (b), while only one minor crack was found on its outer surface.
The thermal fatigue resistance of these materials was compared in terms of the total surface
crack area, which was evaluated from the following relationship:
∑Ca = ∑ClCw (A.7)
Outer cylindrical surface
DCI-D
a
Bottom faceDCI-T
b
278
where Ca is the crack area, Cl is the crack length and Cw is the maximum width of the crack.
Table A.6 shows the obtained results.
Table A.6 - Measured total crack area after 45 thermal cycles.
Location of cracks Total crack area, mm2 (number of cracks)
GCI-A GCI-S DCI-T DCI-D
Bottom face 22 (8) Nil 11(2) Nil
Outer cylindrical surface Nil 1.2(2) 1.5(1) 12.4(17)
Inner cylindrical surface craze cracks Nil Nil Nil
Total crack area (∑Ca) >>22 1.2 12.5 12.4
GCI-S has demonstrated the best fatigue thermal fatigue resistance of all cast irons under
investigation. The thermal fatigue resistance of DCI-D and DCI-T was found to be between
GCI-S and GCI-A. However, DCI-D and DCI-T showed different modes of failure under
thermal fatigue.
When the outer surface of the hot specimen is quickly cooled by the water spray, it tends to
arrest its shape in an expanded state. Under such conditions, the outer part of the cylindrical
specimen being at a low temperature has higher strength and tends to deform the high
temperature inner material in each thermal cycle. It has been observed that during cooling
some part (height) of each specimen was remained above (~ 5 mm) the water spray area.
Therefore, compared to the top section of the specimen, the bottom section experienced faster
cooling. Thus, the bottom diameter of each specimen experienced a greater increase in
dimension compared to the top diameter.
The change in specimen dimensions after thermal cycling is commonly known as distortion.
In the present case, distortion (∆D) of test specimens was determined in-terms of change in
outer bottom diameter:

279
∆D = 100D
DD
i
if
(A.8)
where Df is the outer bottom diameter after thermal cycling and Di the initial outer bottom
diameter.
Figure A.15 shows the relationship between the number of thermal cycles and the extent of
distortion in the outer bottom diameter. The GCIs showed significantly lower distortion than
DCIs. GCI-S exhibited a minimum distortion among the cast irons tested, showing a
significant change in dimensions in the first 15 cycles only. GCI-A distorted by a
substantially greater extent compared to GCI-S. DCI-T showed the highest distortion of all
the cast irons under investigation, closely followed by DCI-D.
Figure A.15 - Distortion of the bottom diameter of specimens versus the number of thermal
cycles.
GCI-S showed the best resistance to cracking and also exhibited the least distortion of the
cast irons under investigation. However, different alloys of cast irons showed different modes
of failure, such as craze cracking in GCI-A, distortion and one major crack in DCI-T.
0
3
6
9
0 10 20 30 40 50
Disto
rtion (∆
d),
%
Number of Cycles
GCI-S GCI-A DCI-T DCI-D
0
3
6
9
0 10 20 30 40 50
Disto
rtion (∆
d),
%
Number of Cycles
GCI-S GCI-A DCI-T DCI-D
0
3
6
9
0 10 20 30 40 50
Disto
rtion (∆
d),
%
Number of Cycles
GCI-S GCI-A DCI-T DCI-D
0
3
6
9
0 10 20 30 40 50
Disto
rtion (∆
d),
%
Number of Cycles
GCI-S GCI-A DCI-T DCI-D
0
3
6
9
0 10 20 30 40 50
Disto
rtion (∆
d),
%
Number of Cycles
GCI-S GCI-A DCI-T DCI-D
280
GCI-S is alloyed with Cr and Mo. GCI-A has higher C content than GCI-S, and is alloyed
with Cu and Cr (Table A.4). There is general agreement that higher C content improves the
thermal fatigue resistance of GCIs [1]. However, this finding is based upon the results of
thermal fatigue investigations at maximum cycle temperatures < 750°C. The GCIs with
higher C content are less resistant to oxidation and grow at a higher rate. Also, Lee and Lee
[8] compared the thermal fatigue resistance of various alloys of GCIs under a pig iron casting
environment and found that the thermal fatigue resistance of GCIs decreases with increasing
C contents. Possibly, in GCI-A, oxidation occurring along the graphite flakes caused
progressive opening of cracks, which resulted in its inferior thermal fatigue resistance. It is
also well known that the addition of Mo and Cr reduces growth, improves the oxidation
resistance, creep strength and tensile strength of GCI [1]. Therefore, in addition to being
lower in C, GCI-S has the advantage of Cr and Mo additions.
Thermal fatigue resistance of DCI-D and DCI-T falls between those of GCI-A and GCI-S.
DCI-D showed a number of minor cracks on the outer surface, and DCI-T showed
progressive opening of cracks at the specimen corner, where the stress concentration should
be the highest. The DCIs have low K compared to GCIs; however, they possess higher E and
ductility. Under the application of the thermal gradient, the bulk of the specimen deforms
owing to good ductility and higher E, leading to stress build up at sharp corners which have
lower strength. Therefore, at the regions of stress concentration, the thermal fatigue resistance
of DCIs can be adversely affected.
Thermal conductivity (K) of cast irons was found to decrease with increasing Si content [15].
Therefore, being higher in Si, thermal diffusivity (k) (Equation A.1) of DCI-D is less than
DCI-T. Owing to its low k the transient temperature gradient generated during quenching can
281
be highest among the alloys under investigation. This could be a major factor contributing to
the origin of multiple cracks at the outer surface of the DCI-D specimen facing fast cooling.
A.4.2 Test Method-II
Figure A.16 shows the photographs of specimens after 300 thermal fatigue cycles. GCIs
exhibited major crack openings at the inner specimen surface running lengthwise at both
sides of the area cooled by the air jet. In GCI-A the cracks were only visible at the inner
surface, while in GCI-S a crack spread deeply leading to the separation of the specimen wall.
Moreover, several minor crack openings can be seen on the top surface of GCI-S. The DCIs
showed different behaviour to GCIs. These alloys had no cracks at the inner surface. DCI-T
exhibited a typical crack pattern originating at the impingement spot of the cooling air jet
(Figure A.16(c)). DCI-D showed no cracks on its inner or outer surface. Results based upon
the total surface crack (∑Ca) area are listed in Table A.7.
DCIs performed significantly better than GCIs with DCI-D having no signs of cracking after
300 cycles. The measured crack area of GCI-A was found to be higher than GCI-S. However,
a major crack passed through the wall of GCI-S. Therefore, practically speaking, the thermal
fatigue resistance of GCI-S is inferior to GCI-A under test method-II conditions.
Cracking at the area of fast cooling is not of primary importance to the present investigation,
because no fast cooling occurs in the case of tapping pipe applications. The main purpose of
cooling from one face is to create a circumferential temperature gradient. The area between
the fast cooling region and the hot end of the specimen is of specific interest to the present
investigation as it is where thermal deformation occurs during each thermal cycle.

282
Figure A.16 - Cracking and distortion of specimens after 300 thermal fatigue cycles, a) GCI-
A, b) GCI-S, c) DCI-T, d) DCI-D.
Table A.7 - Measured crack area on the specimen surface after 300 thermal cycles.
Cast Iron ∑Ca, mm2 (number of cracks)
GCI-A 253 (4)
GCI-S 167 (9)
DCI-T 33 (7)
DCI-D Nil
Since in the present work, GCIs and DCIs exhibited different behaviour in the two test
methods applied. Moreover, selecting a comparison criterion appeared to be major factor in
determining the thermal fatigue resistance of cast irons. It is difficult to set a common failure
criterion because different cast iron alloys may possess unique thermal fatigue characteristics
under a particular thermal fatigue condition.
After thermal fatigue cycling the specimens became oval thus percentage dimetrical
distortion (∆Dm) was determined in terms maximum (Dmax) and minimum (Dmin) diamaters of
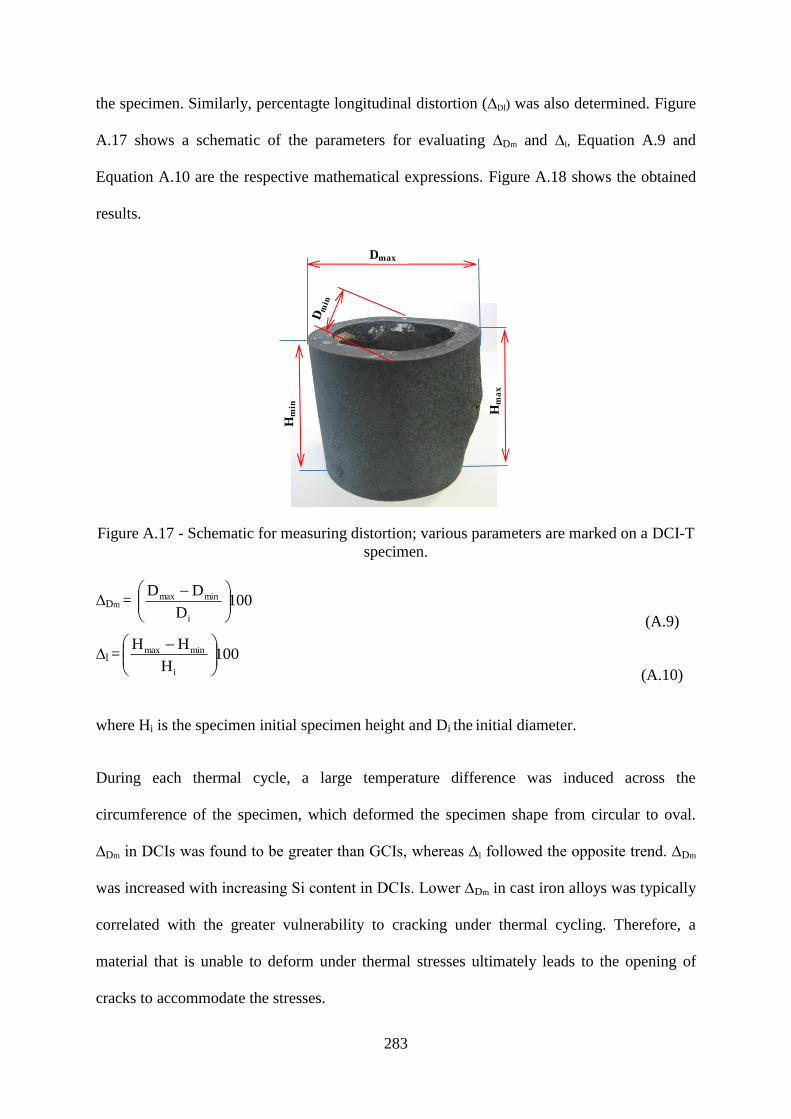
283
the specimen. Similarly, percentagte longitudinal distortion (∆Dl) was also determined. Figure
A.17 shows a schematic of the parameters for evaluating ∆Dm and ∆l, Equation A.9 and
Equation A.10 are the respective mathematical expressions. Figure A.18 shows the obtained
results.
Figure A.17 - Schematic for measuring distortion; various parameters are marked on a DCI-T
specimen.
∆Dm = 100D
DD
i
minmax
(A.9)
∆l = 100H
HH
i
minmax
(A.10)
where Hi is the specimen initial specimen height and Di the initial diameter.
During each thermal cycle, a large temperature difference was induced across the
circumference of the specimen, which deformed the specimen shape from circular to oval.
∆Dm in DCIs was found to be greater than GCIs, whereas ∆l followed the opposite trend. ∆Dm
was increased with increasing Si content in DCIs. Lower ∆Dm in cast iron alloys was typically
correlated with the greater vulnerability to cracking under thermal cycling. Therefore, a
material that is unable to deform under thermal stresses ultimately leads to the opening of
cracks to accommodate the stresses.
Hm
ax
Hm
in
Dmax

284
Figure A.18 - Diametrical and longitudinal distortion in cast irons after 300 thermal cycles.
∆l appears to be related to the growth of cast irons. DCIs grow at a slower rate compared to
GCIs and in GCIs growth increases with increasing C content [14]. Therefore, compared to
GCI-S, GCI-A should grow more because of higher internal oxidation and graphitization
occurring during thermal cycling. During each cycle the cooling caused by the air jet tends to
arrest the material shape in the expanded condition, and growth further adds to the increasing
dimension of the surface experiencing a large thermal gradient.
A.5 Final Thoughts
Under TSC-I conditions with large thermal gradients and fast cooling (13.8 °C/s), a Cr and
Mo alloyed low C cast iron (GCI-S) performed substantially better than a high carbon Cr+Cu
alloyed GCI (GCI-A). The major difference was believed to be the higher oxidation rate of
GCI-A compared to GCI-S, because a higher carbon equivalent (CE) led to higher graphite
volume, which should further increase by subjecting the cast iron to a high temperature.
Graphite flakes can provide easy paths for oxidation that ultimately lead to the progressive
opening of cracks. It was difficult to compare the thermal fatigue resistance of two DCIs with
different Si contents, because their degradation modes were found to be entirely different.
0
6
12
18
24
GCI-A GCI-S DCI-D DCI-T
Dis
torti
on
, %
Cast Irons
Diametrical Distortion (∆Dm) Longitudinal Distortion (∆Dl)(∆Dm) (∆Dl)
285
Under TSC-II condition and relatively lower cooling rates (8.1°C/s), DCIs performed
significantly better than GCIs. The high Si cast iron, DCI-D, outperformed all the alloys
under investigation. Practically, the resistance to thermal fatigue fracture of GCI-S was found
to be slightly inferior to GCI-A; however, under TSC-I, GCI-S outperformed of all the cast
irons under investigation.
Because the GCIs and DCIs behaved differently, comparison of thermal fatigue resistance is
difficult. Under TSC-I and TSC-II conditions the DCI-T alloy showed cracking; however,
owing to its good ductility the cracks did not propagate to a large extent. In ferritic DCIs,
elevated temperature brittleness [16] and embrittlement by cycling heating [17] have been
reported and are believed to be caused by magnesium assisted sulphur segregation and MgO
segregation at grain boundaries, respectively. Moreover, this type of behaviour may also be
related to structural imperfections or other obscure reasons related to the particular chemical
composition.
These findings indicate that, where the lower cooling rates exist, DCIs can perform better
than GCIs because ductile cast irons can absorb thermal stresses by deformation. This finding
is also consistent with the literature [1]. Moreover, under lower cooling rates a better thermal
fatigue resistance in DCIs can be achieved by increasing the Si content.
A.6 Conclusions
Replication of the thermal fatigue conditions of tapping pipes on a laboratory scale was
unsuccessful owing to the relatively low maximum temperature and the practical
constraints of testing the pipes for longer durations. Therefore, alternative test methods
were used to access the thermal fatigue resistance of cast irons.

286
GCI-S, a low C cast iron alloyed with Cr and Mo, showed the greatest thermal fatigue
resistance under the conditions of severe quenching and predominant radial temperature
gradients. Relatively higher C contents, as in GCI-A, were found to be a major factor
behind the inferior thermal fatigue resistance of GCIs, because a higher graphite volume
provides easy paths for oxidation, leading to the progressive opening of cracks. Under the
same test conditions, the ductile cast irons showed poor thermal fatigue resistance. This
could be attributed to their low K and high E, which lead to higher stresses in the regions
of stress concentration and surfaces facing fast cooling.
Under both circumferential and radial thermal gradients and relatively lower cooling rates,
DCIs performed significantly better than GCIs. DCI-D, a high Si ductile cast iron
outperformed all the alloys under investigation. Both GCIs failed in a similar manner and
the resistance to thermal fatigue fracture of GCI-S was found to be inferior to GCI-A.
High Si DCIs appeared to be most promising for tapping pipe applications in terms of
thermal fatigue. However, the corrosion resistance of high Si DCIs was found to be
inferior.
Appendix References
[1] K. Roehrig, American Foundry Society Transactions, 86 (1978) 75-88.
[2] H. Fredriksson, P.A. Sunnerkrantz, P. Ljubinkovic, Materials Science and Technology, 4
(1988) 222-226.
[3] G.E. Dieter, Mechanical Metallurgy, McGraw-Hill Book Company, New York, 1986.
[4] R.B. Gundlach, American Foundry Society Transactions, 87 (1979) 551-450.
[5] M.C. Rukadikar, G.P. Reddy, International Journal of Fatigue, 9 (1987) 25-34.
[6] M.M. Shea, American Foundry Society Transactions, 04 (1978) 23-30.
[7] J.M. Chou, J.L. Lee, Y.C. Ko, Journal of Materials Science, 25 (1990) 2971-2974.
[8] J.L. Lee, S.C. Lee, Metallurgical and Materials Transactions A, 26A (1995) 1431-1439.
[9] I. Minkoff, The Physical Metallurgy of Cast Iron, John Wily & Sons Inc., New York,
1983.
[10] J.C. Randon, D.J. Burns, P.P. Benham, Journal of the Iron and Steel Institute, 204 (1966)
928-935.
[11] D.P.H. Hasselman, Journal of the American Ceramic Society, 46 (11) (1963) 535-540.
287
[12] S.C. Lee, S.C. Chen, Journal of Materials Science, 21 (1989) 210-223.
[13] Y.J. Park, R.B. Gundlach, M. Thoas, I.F. Janowk, American Foundry Society
Transactions, 93 (1985) 415-422.
[14] J.R. Davis, ASM Speciality Handbook-Cast Irons, ASM International, Materials Park,
Ohio, 1996.
[15] D. Holmgren, Thermal Conductivity of Cast Iron, PhD Thesis, Chalmers University of
Technology, Sweden, 2006.
[16] R.N. Wright, T.R. Farrell, American Foundry Society Transactions, 137 (1985) 853-866.
[17] H.M. Lin, T.S. Lui, L.H. Chen, Materials Transactions, 45 (2004) 569-576.
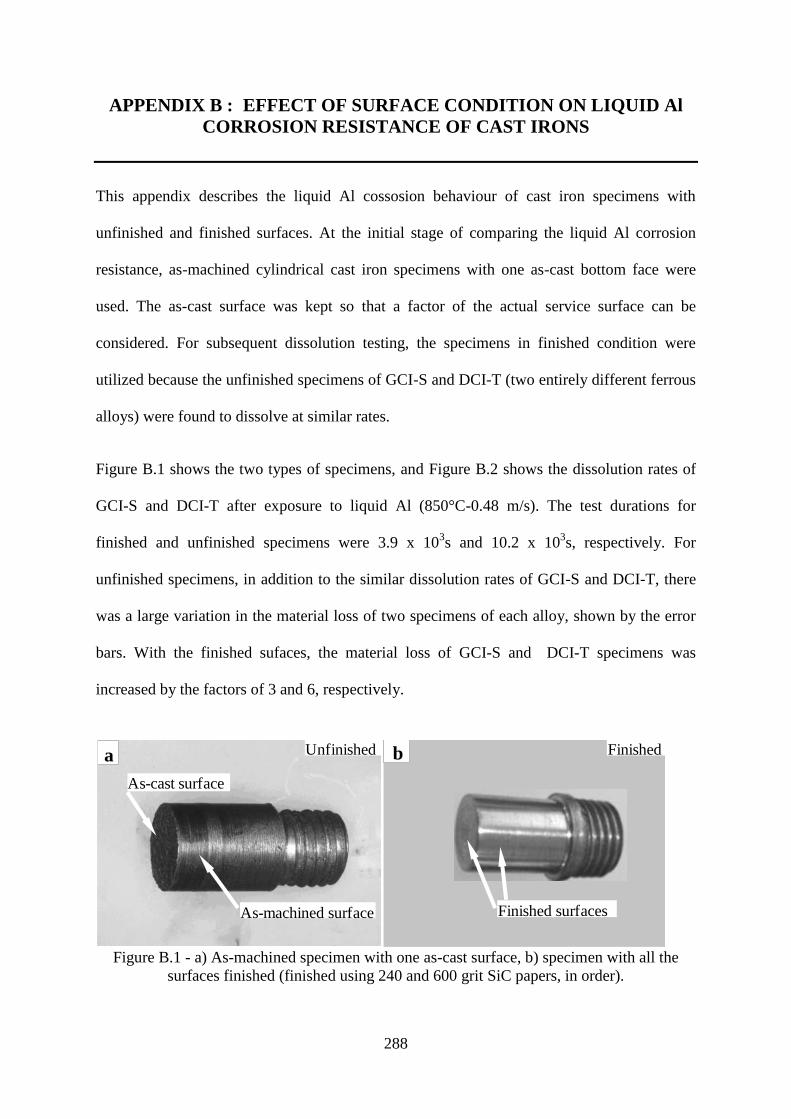
288
APPENDIX B : EFFECT OF SURFACE CONDITION ON LIQUID Al
CORROSION RESISTANCE OF CAST IRONS
This appendix describes the liquid Al cossosion behaviour of cast iron specimens with
unfinished and finished surfaces. At the initial stage of comparing the liquid Al corrosion
resistance, as-machined cylindrical cast iron specimens with one as-cast bottom face were
used. The as-cast surface was kept so that a factor of the actual service surface can be
considered. For subsequent dissolution testing, the specimens in finished condition were
utilized because the unfinished specimens of GCI-S and DCI-T (two entirely different ferrous
alloys) were found to dissolve at similar rates.
Figure B.1 shows the two types of specimens, and Figure B.2 shows the dissolution rates of
GCI-S and DCI-T after exposure to liquid Al (850°C-0.48 m/s). The test durations for
finished and unfinished specimens were 3.9 x 10³s and 10.2 x 10
3s, respectively. For
unfinished specimens, in addition to the similar dissolution rates of GCI-S and DCI-T, there
was a large variation in the material loss of two specimens of each alloy, shown by the error
bars. With the finished sufaces, the material loss of GCI-S and DCI-T specimens was
increased by the factors of 3 and 6, respectively.
Figure B.1 - a) As-machined specimen with one as-cast surface, b) specimen with all the
surfaces finished (finished using 240 and 600 grit SiC papers, in order).
a b
As-cast surface
As-machined surface Finished surfaces
Unfinished Finished
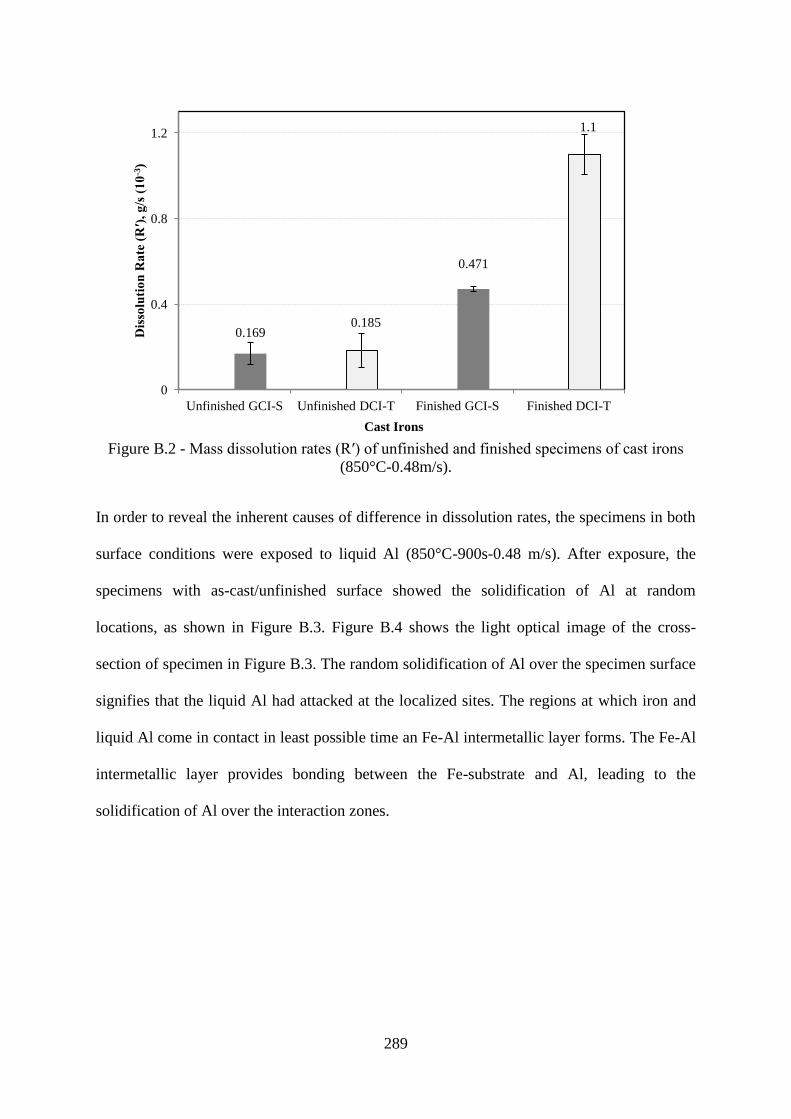
289
Figure B.2 - Mass dissolution rates (R′) of unfinished and finished specimens of cast irons
(850°C-0.48m/s).
In order to reveal the inherent causes of difference in dissolution rates, the specimens in both
surface conditions were exposed to liquid Al (850°C-900s-0.48 m/s). After exposure, the
specimens with as-cast/unfinished surface showed the solidification of Al at random
locations, as shown in Figure B.3. Figure B.4 shows the light optical image of the cross-
section of specimen in Figure B.3. The random solidification of Al over the specimen surface
signifies that the liquid Al had attacked at the localized sites. The regions at which iron and
liquid Al come in contact in least possible time an Fe-Al intermetallic layer forms. The Fe-Al
intermetallic layer provides bonding between the Fe-substrate and Al, leading to the
solidification of Al over the interaction zones.
0.169 0.185
0.471
1.1
0
0.4
0.8
1.2
Unfinished GCI-S Unfinished DCI-T Finished GCI-S Finished DCI-T
Disso
lution R
ate (R′), g/s (10
-3)
Cast Irons
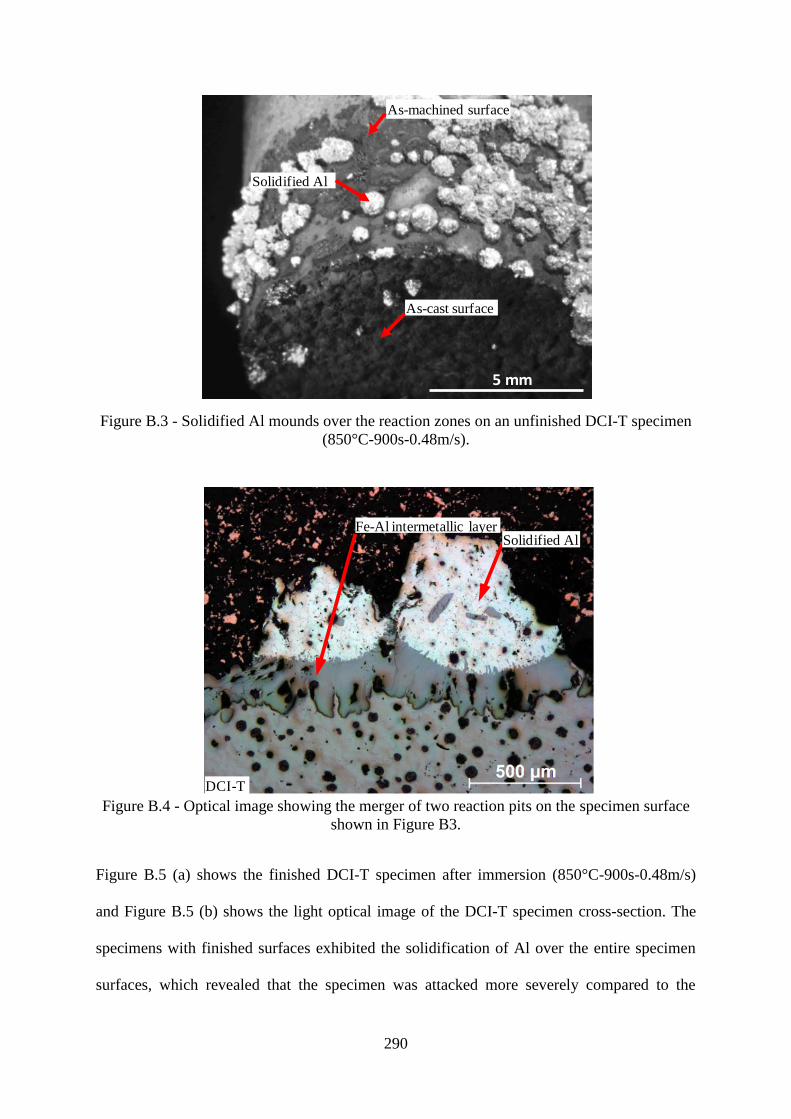
290
Figure B.3 - Solidified Al mounds over the reaction zones on an unfinished DCI-T specimen
(850°C-900s-0.48m/s).
Figure B.4 - Optical image showing the merger of two reaction pits on the specimen surface
shown in Figure B3.
Figure B.5 (a) shows the finished DCI-T specimen after immersion (850°C-900s-0.48m/s)
and Figure B.5 (b) shows the light optical image of the DCI-T specimen cross-section. The
specimens with finished surfaces exhibited the solidification of Al over the entire specimen
surfaces, which revealed that the specimen was attacked more severely compared to the
5 mm
Solidified Al
As-cast surface
As-machined surface
Fe-Al intermetallic layerSolidified Al
DCI-T

291
specimens with unfinished surface. Thus the as-cast and rough/unfinished ferrous substrates
could delay the Fe/Al nucleation, which lead to the occurrence of liquid Al corrosion only at
random locations. The possibility of air trapped in the pores of a rough surface and forming
Al2O3 has been suggested [1], which could inhibit the Fe-Al interaction. Initial reaction on the
specimen surface starts at random locations and with ongoing liquid Al corrosion - these pits
can merge - leading to large pits or a common corrosion surface.
Figure B.5 - a) Finished DCI-T specimen (850°C-900s-0.48m/s) after withdrawal from the
melt, b) light optical image showing the continuous intermetallic layer at the cross-section of
specimen shown in Figure B5(a).
Moreover, the large differences in the dissolution rates of the two types of specimens could
be explained by the fact that the as-cast surfaces of cast irons were found to be entirely
different to the bulk. Figure B.6 and Figure B.7 show the light optical images of as-cast
surfaces of GCI-S and DCI-T specimens, respectively. In GCI-S, high cooling rates at the
mould/casting interface lead to the formation of cementite in the form of a layer about 100
μm thick.
500 μm
Fe-Al intermetallic layer
DCI-T
Solidified Al
b
a

292
Figure B.6 - As-cast surface of GCI-S.
Figure B.7 - Formation of graphite flakes at the as-cast surface of DCI-T.
At the surface of the as-cast block of DCI-T, the formation of a ~ 200 μm thick layer
containing the graphite flakes can be seen. Flake graphite structures at the surface of a DCI
casting can occur as the consequence of surface reactions with contaminants in the sand,
usually sulphur. This structure can become even more pronounced when the Mg content in
the DCI decreases [2].
As-cast surface
GCI-S
Cementite
Fine pearlite
DCI-T
As-cast surface
Graphite flakes
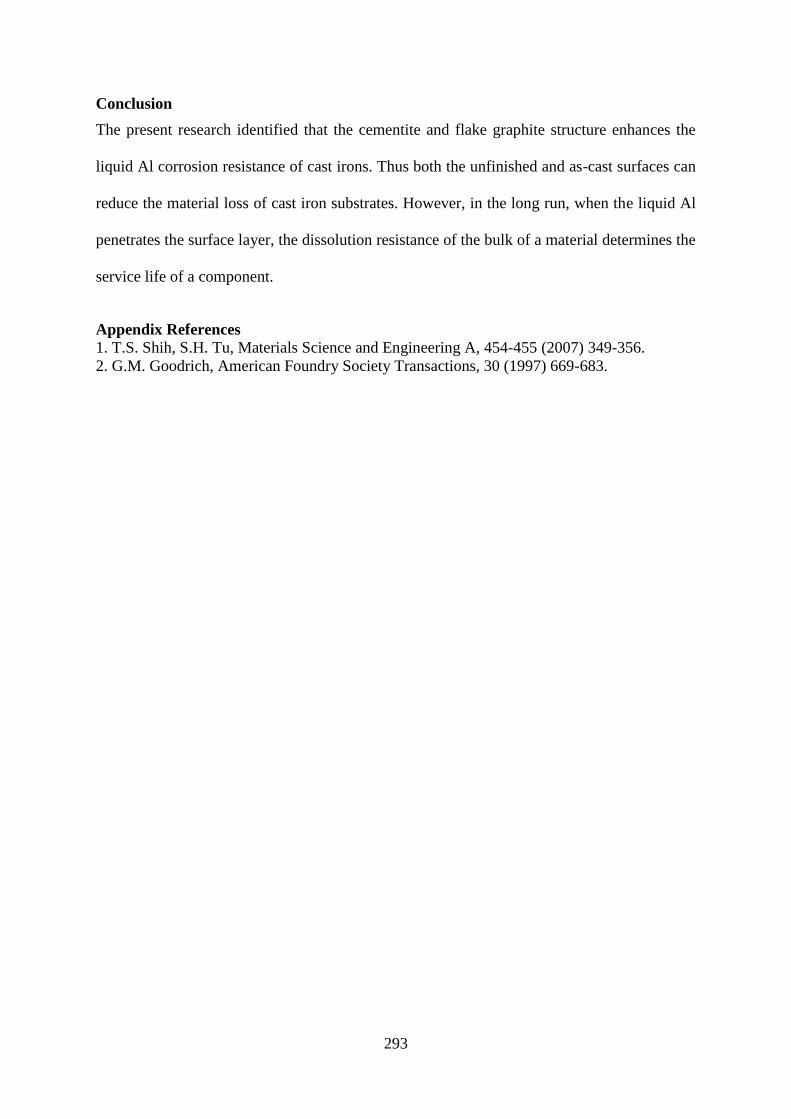
293
Conclusion
The present research identified that the cementite and flake graphite structure enhances the
liquid Al corrosion resistance of cast irons. Thus both the unfinished and as-cast surfaces can
reduce the material loss of cast iron substrates. However, in the long run, when the liquid Al
penetrates the surface layer, the dissolution resistance of the bulk of a material determines the
service life of a component.
Appendix References
1. T.S. Shih, S.H. Tu, Materials Science and Engineering A, 454-455 (2007) 349-356.
2. G.M. Goodrich, American Foundry Society Transactions, 30 (1997) 669-683.
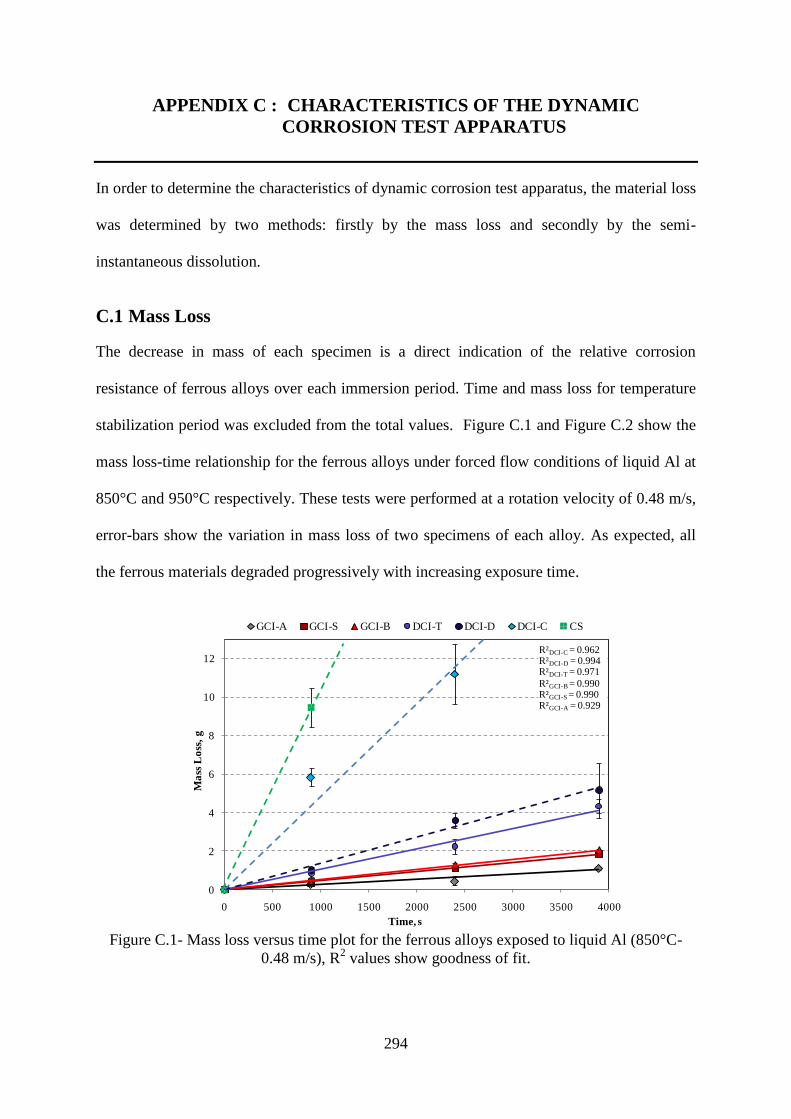
294
APPENDIX C : CHARACTERISTICS OF THE DYNAMIC
CORROSION TEST APPARATUS
In order to determine the characteristics of dynamic corrosion test apparatus, the material loss
was determined by two methods: firstly by the mass loss and secondly by the semi-
instantaneous dissolution.
C.1 Mass Loss
The decrease in mass of each specimen is a direct indication of the relative corrosion
resistance of ferrous alloys over each immersion period. Time and mass loss for temperature
stabilization period was excluded from the total values. Figure C.1 and Figure C.2 show the
mass loss-time relationship for the ferrous alloys under forced flow conditions of liquid Al at
850°C and 950°C respectively. These tests were performed at a rotation velocity of 0.48 m/s,
error-bars show the variation in mass loss of two specimens of each alloy. As expected, all
the ferrous materials degraded progressively with increasing exposure time.
Figure C.1- Mass loss versus time plot for the ferrous alloys exposed to liquid Al (850°C-
0.48 m/s), R2 values show goodness of fit.
0
2
4
6
8
10
12
0 500 1000 1500 2000 2500 3000 3500 4000
Ma
ss L
oss
, g
Time, s
GCI-A GCI-S GCI-B DCI-T DCI-D DCI-C CS
R²DCI-C = 0.962R²DCI-D = 0.994R²DCI-T = 0.971
R²GCI-B = 0.990R²GCI-S = 0.990R²GCI-A = 0.929
295
Figure C.1 identifies a linear relationship of mass loss with time at 850°C for GCIs and DCIs.
Thus a kinetic constant of the material dissolution can be obtained from the slope of each
trend-line representing the relationship of mass loss per unit of time. The listed R2 values
show goodness of the linear fit for each alloy. In general, the alloys with lower dissolution
rates are closer to the ideal linear fit. The CS and DCI-C specimens eroded completely during
experiment, thus only one and two data points are plotted for these alloys.
As expected, increasing the melt temperature to 950°C accelerated the material loss of all the
ferrous alloys, except DCI-C. Data points for CS lie beyond the presented scale thus only a
trend line is shown. The results presented (950°C-0.48m/s) in Figure C.2 identified two
different regimes of material dissolution. All the alloys showed an initial high mass
dissolution followed by a subsequent region of relatively lower mass dissolution. The
dissolution rate constant obtained from a linear fit of the entire set of data points is designated
R, while R1 and R2 are the rate constants in the initial fast and subsequent slower mass
dissolution regimes, respectively.
Figure C.2 - Mass loss versus time plot of various ferrous alloys exposed to liquid Al (950°C-
0.48 m/s), R2 values show goodness of fit for slower mass loss regime (600 ≤ t ≤ 3000s).
0
2
4
6
8
0 500 1000 1500 2000 2500 3000
Ma
ss L
oss
, g
Time, s
GCI-A GCI-S GCI-B DCI-T DCI-D DCI-C CS
R²DCI-D =0.894R²DCI-T = 0.999R²GCI-B = 0.999
R²GCI-S = 0.950R²GCI-A = 0.981
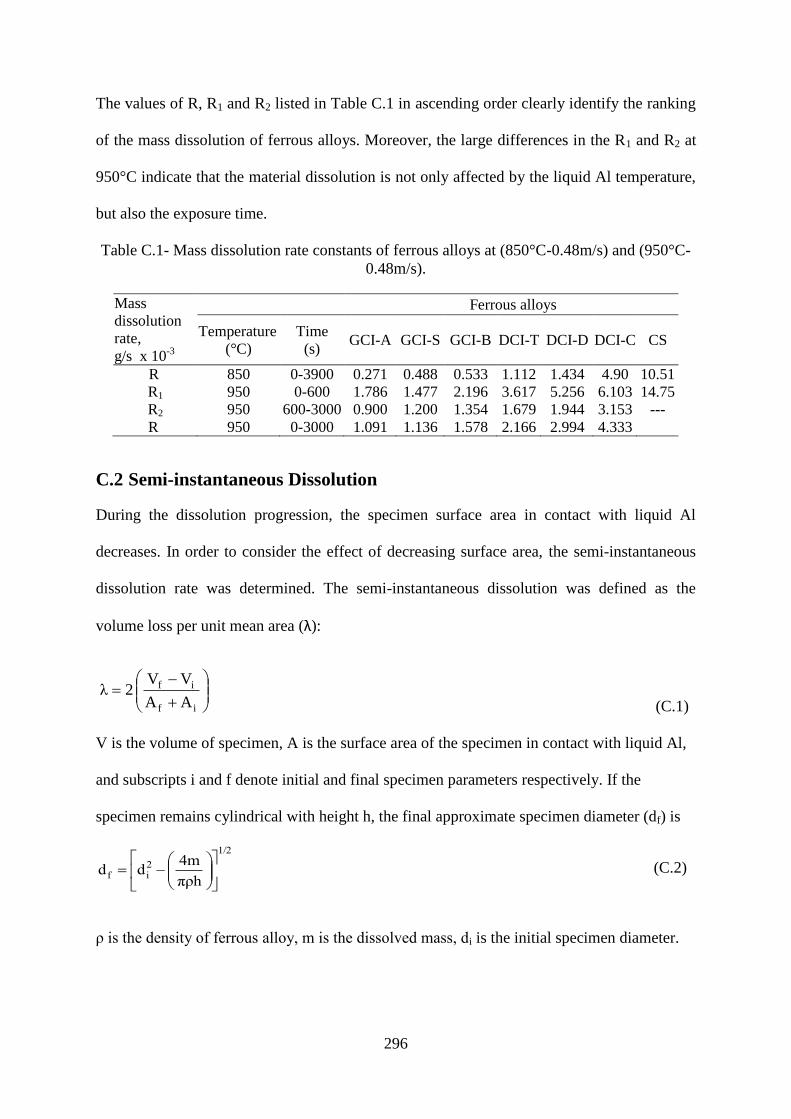
296
The values of R, R1 and R2 listed in Table C.1 in ascending order clearly identify the ranking
of the mass dissolution of ferrous alloys. Moreover, the large differences in the R1 and R2 at
950°C indicate that the material dissolution is not only affected by the liquid Al temperature,
but also the exposure time.
Table C.1- Mass dissolution rate constants of ferrous alloys at (850°C-0.48m/s) and (950°C-
0.48m/s).
Mass
dissolution
rate,
g/s x 10-3
Ferrous alloys
Temperature
(°C)
Time
(s) GCI-A GCI-S GCI-B DCI-T DCI-D DCI-C CS
R 850 0-3900 0.271 0.488 0.533 1.112 1.434 4.90 10.51
R1 950 0-600 1.786 1.477 2.196 3.617 5.256 6.103 14.75
R2 950 600-3000 0.900 1.200 1.354 1.679 1.944 3.153 ---
R 950 0-3000 1.091 1.136 1.578 2.166 2.994 4.333
C.2 Semi-instantaneous Dissolution
During the dissolution progression, the specimen surface area in contact with liquid Al
decreases. In order to consider the effect of decreasing surface area, the semi-instantaneous
dissolution rate was determined. The semi-instantaneous dissolution was defined as the
volume loss per unit mean area (λ):
(C.1)
V is the volume of specimen, A is the surface area of the specimen in contact with liquid Al,
and subscripts i and f denote initial and final specimen parameters respectively. If the
specimen remains cylindrical with height h, the final approximate specimen diameter (df) is
1/2
2if
πρh
4mdd
(C.2)
ρ is the density of ferrous alloy, m is the dissolved mass, di is the initial specimen diameter.
if
if
AA
VV 2λ

297
A value of 7225 kg/m3 was utilized for the density of cast irons [1] and for steel the standard
value of 7800 kg/m3
was taken. The calculated dissolved material volume per mean area for
each alloy is a relative measure of the component service life under a similar liquid Al
degradation environment. The volume loss per mean area versus time plots under forced flow
conditions at the temperatures of 850°C and 950°C are given in Figure C.3 and Figure C.4,
respectively. At 850°C, all the alloys exhibited a linear relationship between volume loss per
mean area and exposure time. The slope of each line represents the semi-instantaneous
dissolution rate (∆) in terms of material volume removed per area per time.
However, at 950°C, the regions of two different regimes of material dissolution can still be
identified. Thus, similar to mass dissolution analysis, three rate constants were determined: ∆
for the entire time range, and ∆1 and ∆2 for the initial fast and subsequent stabilized
dissolution regimes, respectively. Table C.2 shows the ∆, ∆1 and ∆2 values at 850°C and
950°C.
Figure C.3 - Relationship between volume per loss mean area and exposure time (850°C-
0.48m/s), R2 values show goodness of fit for the entire data.
0
150
300
450
600
0 500 1000 1500 2000 2500 3000 3500 4000
Vo
lum
e L
oss
per
Mea
n A
rea
, m
m3/c
m2
Time, s
GCI-A GCI-S GCI-B DCI-T DCI-D DCI-C CS
R² DCI-C = 0.999
R² DCI-D = 0.992
R² DCI-T = 0.974
R²GCI-B = 0.983
R²GCI-S = 0.996
R²GCI-A = 0.929
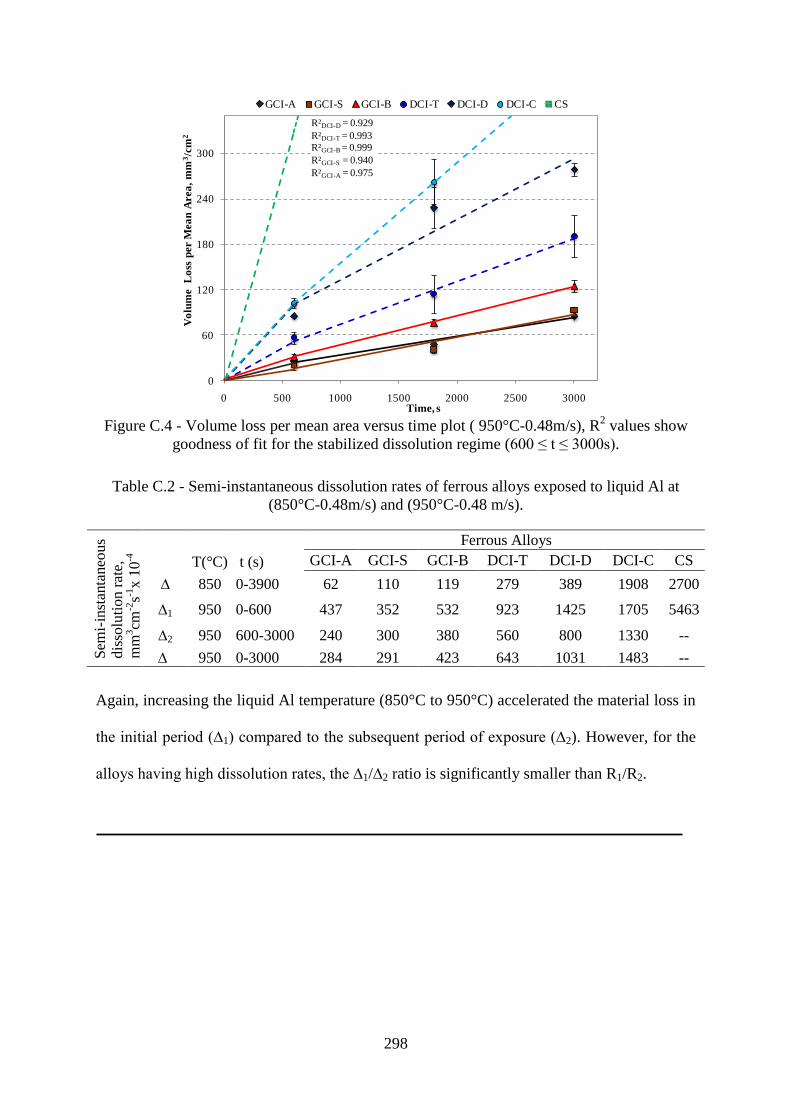
298
Figure C.4 - Volume loss per mean area versus time plot ( 950°C-0.48m/s), R
2 values show
goodness of fit for the stabilized dissolution regime (600 ≤ t ≤ 3000s).
Table C.2 - Semi-instantaneous dissolution rates of ferrous alloys exposed to liquid Al at
(850°C-0.48m/s) and (950°C-0.48 m/s).
Sem
i-in
stan
taneo
us
d
isso
luti
on
rat
e,
mm
3cm
-2s-1
x 1
0-4
T(°C) t (s)
Ferrous Alloys
GCI-A GCI-S GCI-B DCI-T DCI-D DCI-C CS
∆ 850 0-3900 62 110 119 279 389 1908 2700
∆1 950 0-600 437 352 532 923 1425 1705 5463
∆2 950 600-3000 240 300 380 560 800 1330 --
∆ 950 0-3000 284 291 423 643 1031 1483 --
Again, increasing the liquid Al temperature (850°C to 950°C) accelerated the material loss in
the initial period (∆1) compared to the subsequent period of exposure (∆2). However, for the
alloys having high dissolution rates, the ∆1/∆2 ratio is significantly smaller than R1/R2.
0
60
120
180
240
300
0 500 1000 1500 2000 2500 3000
Vo
lum
e
Lo
ss p
er M
ea
n A
rea
, m
m3/c
m2
Time, s
GCI-A GCI-S GCI-B DCI-T DCI-D DCI-C CS
R²DCI-D = 0.929
R²DCI-T = 0.993
R²GCI-B = 0.999
R²GCI-S = 0.940
R²GCI-A = 0.975
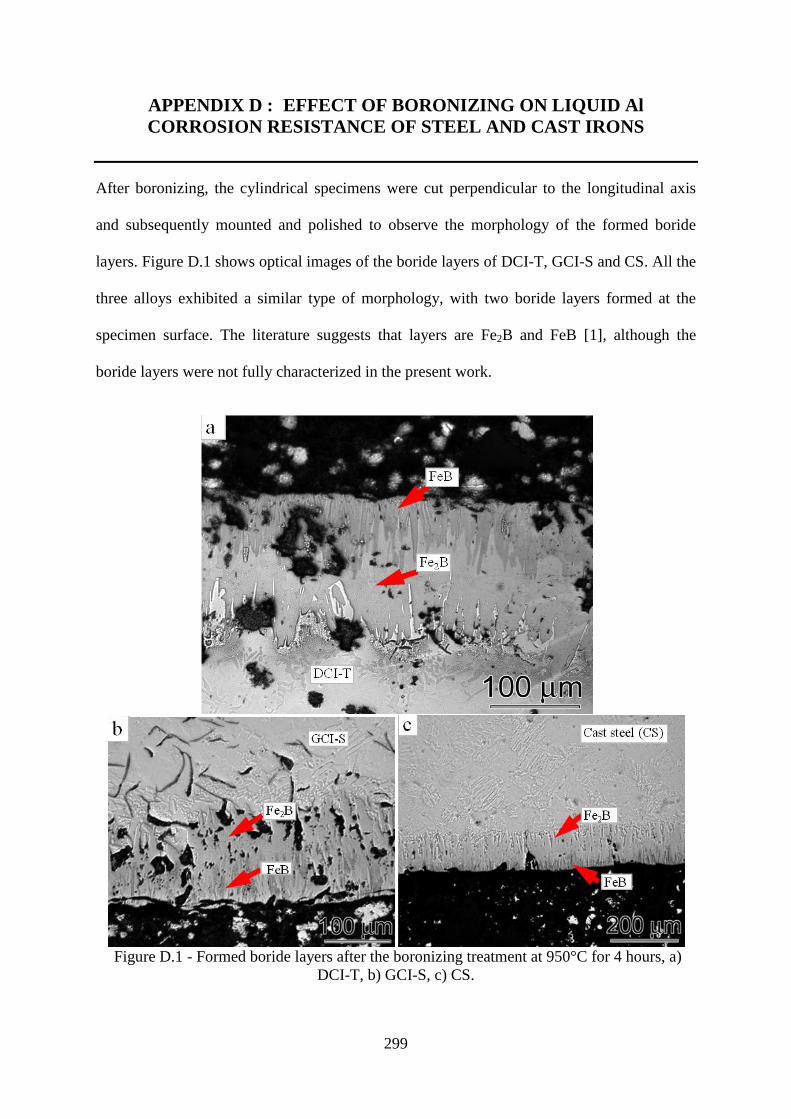
299
APPENDIX D : EFFECT OF BORONIZING ON LIQUID Al
CORROSION RESISTANCE OF STEEL AND CAST IRONS
After boronizing, the cylindrical specimens were cut perpendicular to the longitudinal axis
and subsequently mounted and polished to observe the morphology of the formed boride
layers. Figure D.1 shows optical images of the boride layers of DCI-T, GCI-S and CS. All the
three alloys exhibited a similar type of morphology, with two boride layers formed at the
specimen surface. The literature suggests that layers are Fe2B and FeB [1], although the
boride layers were not fully characterized in the present work.
Figure D.1 - Formed boride layers after the boronizing treatment at 950°C for 4 hours, a)
DCI-T, b) GCI-S, c) CS.

300
The liquid Al corrosion resistance of selected ferrous alloys, GCI-S, GCI-T and CS was also
investigated after a boronizing surface treatment (Section 3.3). Figure D.2 shows the mass
dissolution rates for the non-boronized (finished) and boronized test specimens (950°C-
2400s-0.48 m/s). The test durations for non-boronized and boronized specimens were 600s
and 2400s, respectively. All the boronized alloys showed improved liquid Al corrosion
resistance. With boronizing treatment, the dissolution rate of CS was decreased to about 2
times; however, the entire boronized CS specimens were dissolved during the test.
Figure D.2 - Effect of boronizing surface treatment on the mass dissolution rates (R′) of cast
irons and steel (950°C-0.48m/s).
Boronizing DCI-T and GCI-S decreased the weight dissolution rate by the factors of 7 and 8,
respectively. With boronizing, a significantly greater decrease in the dissolution rates GCI-S
and DCI-T compared to CS was found. This can be attributed to the inferior liquid Al
corrosion resistance of the bulk of CS, since when the liquid Al penetrates the boride layer
14.7
7.57
3.61
0.532
1.78
0.231
0
4
8
12
16
CS CS-Boronized GCI-T GCI-T
Boronized
GCI-S GCI-S
Boronized
Mass D
isso
lotion R
ate (R′), g/s (
10
-3)
301
and starts to corrode the substrate, the material loss of CS should occur at a higher rate than
cast irons.
Conclusion
With boronizing surface treatment, the liquid Al corrosion rate can be controlled. An
effective boronizing treatment generally requires a finished surface. However, presently the
tapping pipes are used in as-cast condition. It has been shown that as-cast, unfinished surfaces
can be more resistant to liquid Al attack than the finished surfaces (Appendix-B). Although,
the test conditions were different (in terms of temperature) to compare the liquid Al corrosion
resistance of unfinished and boronized specimens, the boronizing treatment appeared to be
more effective than the unfinished surfaces. However, the successful application of
boronizing surface treatment to tapping pipes requires overcoming some barriers, such as
obtaining uniformity in the protective boride layer and the total process cost.
Appendix References
[1] S. Sen, U. Sen, C. Bindal, Vacuum, 77 (2005) 195-202.