Liquefaction Characteristic Based on Ground Response ......30-50 Dense 1.25 > 50 Dense-Very dense...
5
Liquefaction Characteristic Based on Ground Response Linier Equivalent Analysis and Cyclic Stress Concept on Young Merapi Volcanic Deposit in Bantul Regency, Yogyakarta, Indonesia TAUFIQ Wira Buana and Muhammad WAFID Agung Geological Agency of Indonesia E-mail:[email protected] Abstract . Bantul regency is one of earthquake prone area due to subduction activities of Indo-Australia and Eurasia crust on the south and Opak fault on the east. The morphology of this area is low land between hills on the west and the east which called as Bantul Graben. Bantul Graben consists of Young Merapi Volcanic Deposit. Devastated area and buildings as severe earthquake evidence on May 27th, 2006 was caused by some factors i.e.: amplification and liquefaction on Young Merapi Volcanic Deposit. From the confirmed deterministic seismic hazard analysis study which indicated that the most responsible source of earthquake at the time of hazard event is an Opak fault with strike-slip type which gives the highest value of peak ground acceleration on bedrock compared with other source i.e.: subduction type Liquefaction phenomena based on cyclic stress analysis by using the result of ground response linier equivalent analysis was investigated and the result shows that safety factor and liquefied lithology are verified. The amplification average of Young Merapi Volcanic Deposit is two times and amplification values tend comparable with sediment thickness. The amplification value of each lithology will decrease with increasing density or consistency. The amplification could trigger the liquefaction phenomena only on sandy and silty deposits. On the other hand, high density or consistency (N 1(60) > 20) and clayey deposits tend not liquefied. Sand deposits will liquefy if the level of density from loose to medium (N 1(60) between 5-20) with cyclic stress ratio (CSR) between 0.18 to 0.53. Whereas silt deposits will liquefy if its consistency level from very soft to stiff (N 1(60) between 3-15) with cyclic stress ratio (CSR) between 0.16 to 0.69. Keywords: cyclic stress concept, amplification, N-SPT, liquefaction 1. Introduction Devastating earthquake on 27 May 2006 in Yogyakarta has severely damaged the ground surface. BAPPENAS data (2006) attributed the loss due to infra structure destruction causes 4,121 people died and 79,889 buildings were severely damaged. Furthermore, the relatively shallow of the earthquake source, the condition of buildings that do not meet the requirements for earthquake resistant buildings, and a relatively dense population is the reason why so many casualties in that event (BAPPENAS, 2006). Earthquake at that time also cause liquefaction in some places on young Merapi volcano deposit (Figure 1). The intent of this study was to determine the characteristics of liquefaction in two types of young Merapi Volcano deposit. Figure 1. Liquefaction evidence due to Yogyakarta Earthquake 1 10th Asian Regional Conference of IAEG (2015)
Transcript of Liquefaction Characteristic Based on Ground Response ......30-50 Dense 1.25 > 50 Dense-Very dense...
Liquefaction Characteristic Based on Ground Response Linier Equivalent Analysis and Cyclic Stress Concept on Young Merapi Volcanic Deposit in Bantul Regency, Yogyakarta,
Indonesia
TAUFIQ Wira Buana and Muhammad WAFID Agung
Geological Agency of Indonesia
E-mail:[email protected]
Abstract .
Bantul regency is one of earthquake prone area due to subduction activities of Indo-Australia and Eurasia crust on the south and Opak fault on the east. The morphology of this area is low land between hills on the west and the east which called as Bantul Graben. Bantul Graben consists of Young Merapi Volcanic Deposit. Devastated area and buildings as severe earthquake evidence on May 27th, 2006 was caused by some factors i.e.: amplification and liquefaction on Young Merapi Volcanic Deposit. From the confirmed deterministic seismic hazard analysis study which indicated that the most responsible source of earthquake at the time of hazard event is an Opak fault with strike-slip type which gives the highest value of peak ground acceleration on bedrock compared with other source i.e.: subduction type Liquefaction phenomena based on cyclic stress analysis by using the result of ground response linier equivalent analysis was investigated and the result shows that safety factor and liquefied lithology are verified. The amplification average of Young Merapi Volcanic Deposit is two times and amplification values tend comparable with sediment thickness. The amplification value of each lithology will decrease with increasing density or consistency. The amplification could trigger the liquefaction phenomena only on sandy and silty deposits. On the other hand, high density or consistency (N1(60) > 20) and clayey deposits tend not liquefied. Sand deposits will liquefy if the level of density from loose to medium (N1(60) between 5-20) with cyclic stress ratio (CSR) between 0.18 to 0.53. Whereas silt deposits will liquefy if its consistency level from very soft to stiff (N1(60) between 3-15) with cyclic stress ratio (CSR) between 0.16 to 0.69.
Keywords: cyclic stress concept, amplification, N-SPT, liquefaction
1. Introduction
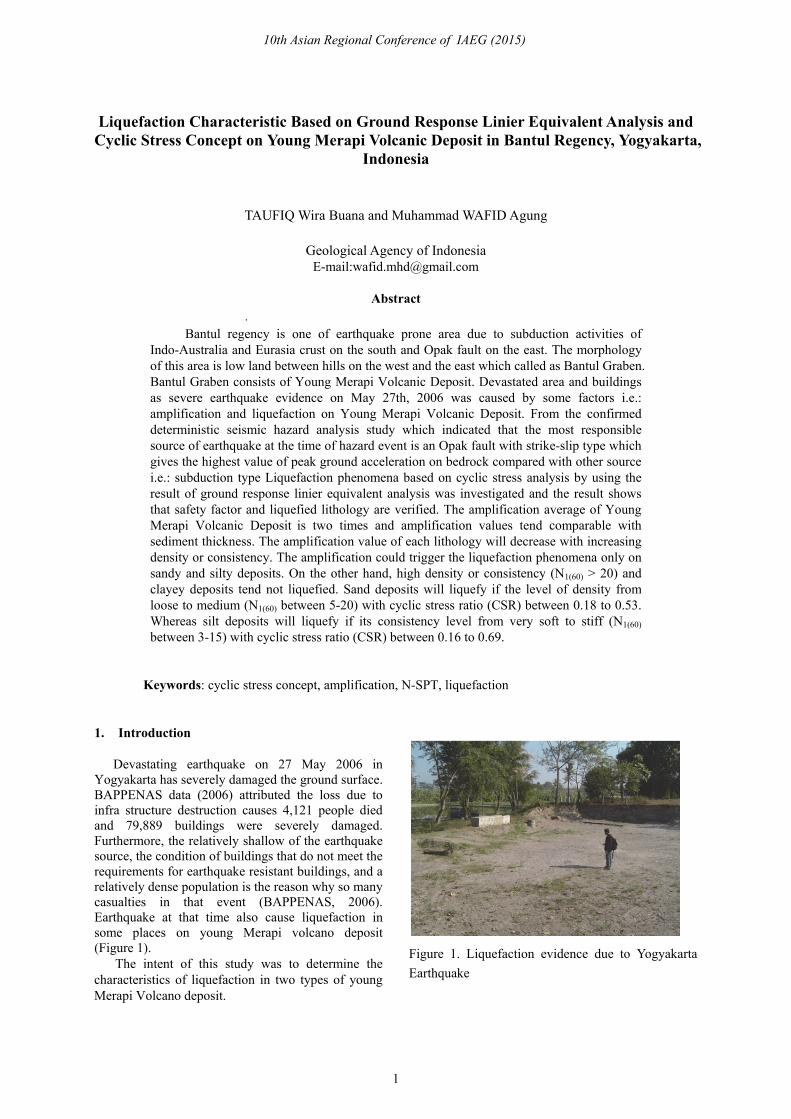
Devastating earthquake on 27 May 2006 in Yogyakarta has severely damaged the ground surface. BAPPENAS data (2006) attributed the loss due to infra structure destruction causes 4,121 people died and 79,889 buildings were severely damaged. Furthermore, the relatively shallow of the earthquake source, the condition of buildings that do not meet the requirements for earthquake resistant buildings, and a relatively dense population is the reason why so many casualties in that event (BAPPENAS, 2006). Earthquake at that time also cause liquefaction in some places on young Merapi volcano deposit (Figure 1).
The intent of this study was to determine the characteristics of liquefaction in two types of young Merapi Volcano deposit.
Figure 1. Liquefaction evidence due to Yogyakarta
Earthquake
1
10th Asian Regional Conference of IAEG (2015)
2. Geology and liquefaction at Bantul Regency
Research area is low land which set between two mountains on west-east, coastal plain on the south, and Merapi Volcano on the north direction (approximately 60-80 km). Major fault system has two orientations on southwest-northeast that divide between South Mountain-Bantul Graben and southeast-northwest that separate Progo Mountain-Batul Graben (Rahardjo et.al, 1995).
Sudarsono and Sugiyanto (2007) stated that Young Merapi Volcanic Deposit (Qmi) has high potential to liquefy. Qualitative description from borehole log shows that Quaternary deposits untill 20 meter depth consist of unconsolidated material (uncementated), i.e.: sand, silt, and clay deposits. Sand deposits have wide spread horizontally and vertically compared with silt and clay deposits.
Based on grains size distributions sand deposit can be classified into three groups of material, i.e: sand, silty sand, and gravelly sand with physical properties as follows. Sand: grey color, fine to coarse sand, less gravel, sub rounded to rounded, various density from very loose to very dense. Silty sand: brownish grey, fine to coarse sand, consist of silt and less gravel, sub rounded to rounded, various density from very loose to very dense.
Gravelly sand: grey, fine to coarse sand and consist of gravel, sub rounded to rounded, various density from medium to very dense.
Silt deposits are limited and founded as a thin layer within sand deposits which could be found near Opak river on the east and near Bedog river on the west. Silt deposits could be divided into two groups of material based on grain distributions, i.e; silt and sandy silt. Silt: pale brown, low plasticity, soft to stiff. Sandy silt: pale brown color, low plasticity to non plastic, soft to stiff, consist of little very fine to fine sand.
Clay are deposited near surface with brown color (sandy clay). Clay deposits with blueish black color are found at the depth of more than 15 m below the surface with limited locations. Clay deposits could be devided into two groups, i.e: clay and sandy clay. Clay: blueish black, medium to high plasticity, stiff to hard. Sandy clay: brown color, medium plasticity, soft to stiff, consist of very fine to fine sand.
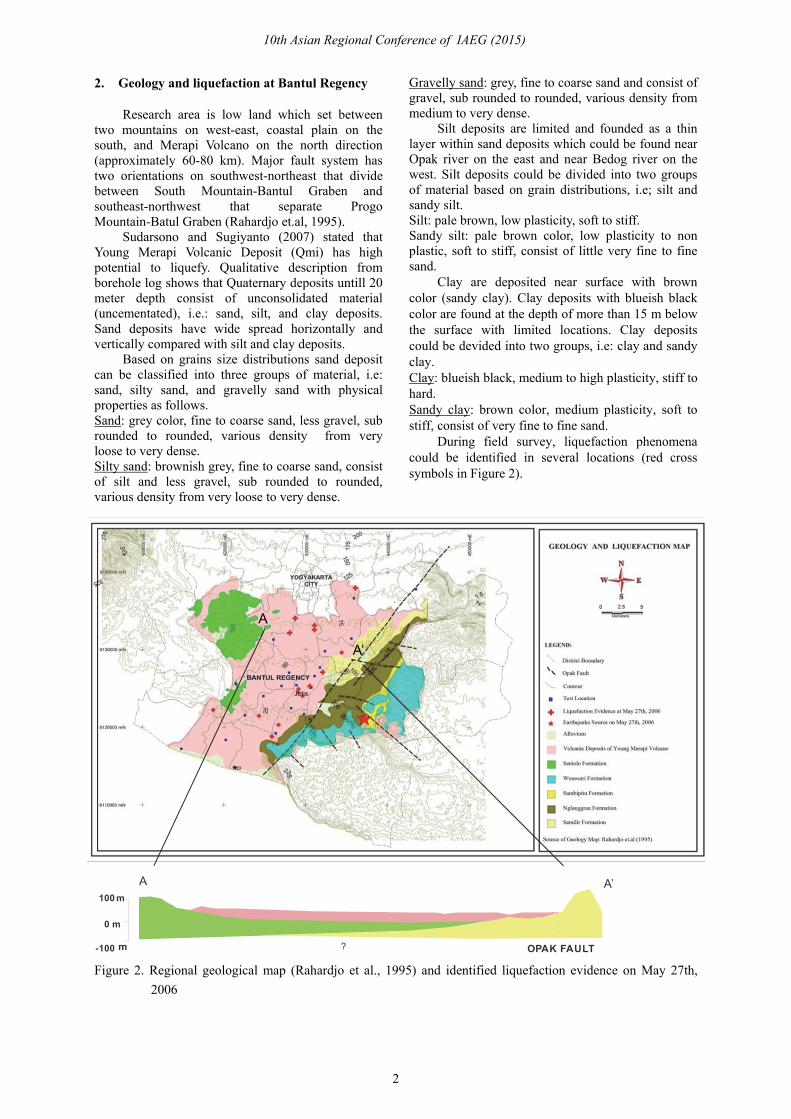
During field survey, liquefaction phenomena could be identified in several locations (red cross symbols in Figure 2).
Figure 2. Regional geological map (Rahardjo et al., 1995) and identified liquefaction evidence on May 27th,
2006
A
A’
OPAK FAULT
100
0 m
-100 ?
A A’
m
m
2
10th Asian Regional Conference of IAEG (2015)
2.1 Ground Response Linier Equivalent Analysis Ideally a complete ground response analysis
needs the rupture mechanism at the source of an earthquake for modelling, the propagation of waves from the earth source to the top of bedrock beneath a specific site and then determine how the surface deposit motion is influenced by soils between it and the bedrock (Kramer, 1996)
Based on deterministic sesmic hazard analysis from Buana & Sadisun (2013a), Yogyakarta earthquake that controlled by fault type source (Opak Fault) give the largest peak ground acceleration on bed rock (0.34 g) than the subduction type (0.15 g). Amplification due to Opak Fault shows value between 1.3 to 2.92 times or average value around two times (Buana & Sadisun , 2013b). 2.2 Cyclic Stress
Cyclic stress concept in this paper is an improvement concept from the Seed and Idriss’s concept (1971) i.e.: Cyclic Stress Ratio (CSR) that define on Seed et.al. (1983). The cyclic stress ratio is the ratio of the average cyclic shear stress h developed on horizontal surfaces of the sand as a result of the cyclic or earthquake loading to the initial vertical effective stress ’0 acting on the sand layer before the cyclic stresses were applied. The cyclic stress ratio developed in the field due to earthquake shaking can readily be computed from an equation by Seed et.al. (1983): CSR =
σ′= 0.65 . σ
σ′. r ....................1
in which: amax = maximum acceleration at the ground surface; h = total overburden pressure on sand layer under consideration; ’0 = initial effective overburden pressure on sand layer; and rd = stress reduction factor. In this case, amax value on analysis refer to Ground Response Linier Equivalent Analysis value from Buana & Sadisun (2013b).
2.3 Standard Penetration Test
Standard Penetration Test is one method to calculate a cyclic retention ratio. As suggested by NCEER (National Centre for Earthquake Engineering Research, 1997), Cyclic Retention Ratio (CRR) value could be calculated by Blake’s formula as follows;
. = ...........................(2)
where CRR7.5 is the cyclic resistance ratio for 7.5 earthquakes magnitude; x = (N1)60; a = 0.048; b = -0.1248; c = -0.004721; d = 0.009578; e = 0.0006136; f = -0.0003285; g = -1.673E-05; and h = 3.714E-06.
(N1)60 is the standard penetration test blow count normalized to an overburden pressure of approximately 100 KPa (1 ton/sq ft) and a hammer energy ratio or hammer efficeincy of 60% (Youd and
Idriss, 2001). According to NCEER (1997), factor of safety
(FS) against liquefaction is needed for correction factors called “magnitude scaling factors (MSF)” to adjust the simplified base curve to magnitudes smaller or larger than 7.5 with recommended formula as follows; MSF = .. ................................................ .(3) FS = . MSF.......................................... (4)
where MSF is magnitude scaling factor and M is earthquake magnitude ; CRR7.5 is the cyclic resistance ratio determined for 7.5 earthquake magnitude (obtained from equation 2) ; CSR is cyclic stress ratio developed in the field due to earthquake shaking (calculated by equation 1) ; FS is factor of safety against liquefaction for the specific earthquake magnitude. 3. Discussion
Liquefaction analysis shows that sand and silt layers are potential to liquefy. Behavior and respond of each deposit may influenced by density and amplification. When the calculate amplification (Buana & Sadisun, 2013b) to be correlated with density of sand or consistency of silt deposit shows the positive correlation. Amplification factor tend to declined with increased of density or consistency (Table 1 and Table 2). Even though, no significant value difference between sand and silt deposits.
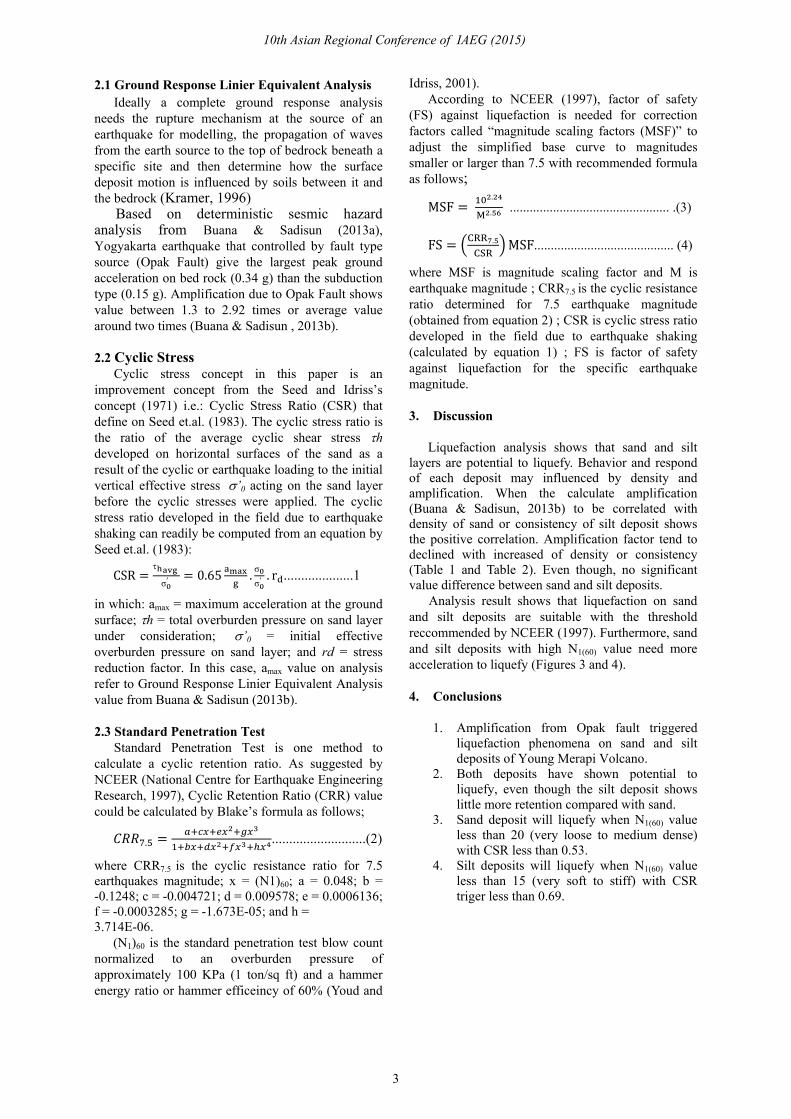
Analysis result shows that liquefaction on sand and silt deposits are suitable with the threshold reccommended by NCEER (1997). Furthermore, sand and silt deposits with high N1(60) value need more acceleration to liquefy (Figures 3 and 4). 4. Conclusions
1. Amplification from Opak fault triggered liquefaction phenomena on sand and silt deposits of Young Merapi Volcano.
2. Both deposits have shown potential to liquefy, even though the silt deposit shows little more retention compared with sand.
3. Sand deposit will liquefy when N1(60) value less than 20 (very loose to medium dense) with CSR less than 0.53.
4. Silt deposits will liquefy when N1(60) value less than 15 (very soft to stiff) with CSR triger less than 0.69.
3
10th Asian Regional Conference of IAEG (2015)
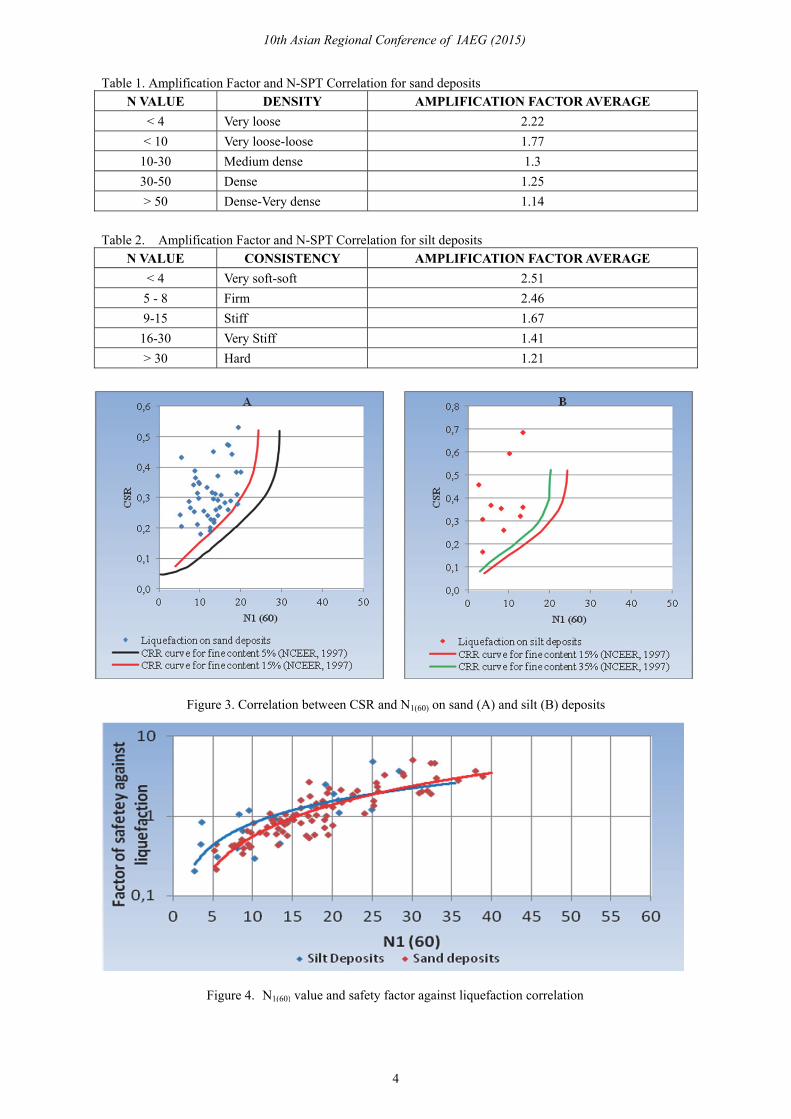
Table 1. Amplification Factor and N-SPT Correlation for sand deposits N VALUE DENSITY AMPLIFICATION FACTOR AVERAGE
< 4 Very loose 2.22
< 10 Very loose-loose 1.77
10-30 Medium dense 1.3
30-50 Dense 1.25
> 50 Dense-Very dense 1.14
Figure 3. Correlation between CSR and N1(60) on sand (A) and silt (B) deposits
Table 2. Amplification Factor and N-SPT Correlation for silt deposits
N VALUE CONSISTENCY AMPLIFICATION FACTOR AVERAGE
< 4 Very soft-soft 2.51
5 - 8 Firm 2.46
9-15 Stiff 1.67
16-30 Very Stiff 1.41
> 30 Hard 1.21
Figure 4. N1(60) value and safety factor against liquefaction correlation
4
10th Asian Regional Conference of IAEG (2015)
References BAPPENAS (2006): Preliminary Damage and Loss
Assesment Yogyakarta and Central Java Natural Disaster, A Joint Report from BAPPENAS, the Provincial and Local Governments of D.I.Yogyakarta, the Provincial and Local Governments of Central Java, and international partners, Jakarta, 1-140.
Buana, T.W. dan Sadisun, I.A. (2013a): Penentuan Percepatan Gempa bumi Batuan Maksimum Dengan Metode Analisis Bahaya Seismik Deterministik Di Kabupaten Bantul, Buletin Geologi Tata Lingkungan Vol.23 No.1, Bandung, 13-22.
Buana, T.W. dan Sadisun, I.A. (2013b): Karakteristik Amplifikasi Pada Endapan Gunung Api Merapi Muda Akibat Gempa Bumi 27 Mei 2006 Di Kabupaten Bantul Daerah Istimewa Yogyakarta Berdasarkan Analisis Respons Tanah Ekuivalen Linier, Buletin Geologi Tata Lingkungan Vol.23 No.2, Bandung, 67-76.
Kramer S.L. (1996): Geotechnical Earthquake Engineering, Prentice Hall, 673
National Centre for Earthquake Engineering Research (NCEER) (1997): Summary Report of Proceedings of the NCEER Workshop on Evaluation of Liquefaction Resistance of Soils,
edited by Youd, T.L. and Idriss I.M. (1997), Technical Report NCEER 97 - 0022, 1-10.
Rahardjo W, Sukandarrumidi, dan H.M.D Rosidi (1995): Peta Geologi Lembar Yogyakarta skala 1 : 100.000, Pusat Penelitian dan Pengembangan Geologi, Bandung.
Seed, H.B. dan Idriss I.M. (1971): Simplified Procedure for Evaluaiting Soil Liquefaction Potential, Journal of the Soil Mechanics and Foundation Design, ASCE, Vol. 107, 1249-1274.
Seed, H.B., Idriss I.M., dan Arango I., (1983): Evaluation of Liquefaction Potential Using Field Performance Data, Journal of Geotechnical Engineering, Vol.109 No.3, pp458-482.
Sudarsono, U. dan Sugiyanto (2007): Zonasi Likuifaksi Daerah Bantul, Daerah Istimewa Yogyakarta, Proceedings Annual Joint Convention Bali 2007 The 32nd HAGI, The 36th IAGI, and The 29th IATMI Annual Conference and Exhibition, Bali.
Youd, T. L. and Idriss, I. M. (2001). Liquefaction resistance of soils: summary report from the 1996 NCEER and 1998 NCEER/NSF workshops on evaluation of liquefaction resistance of soils. Journal of Geotechnical and Geoenvironmental Engineering, 127:4, 297-313.
5
10th Asian Regional Conference of IAEG (2015)