Lipid & surfactant based systems for improved delivery of ...
118
University of Mississippi University of Mississippi eGrove eGrove Electronic Theses and Dissertations Graduate School 1-1-2015 Lipid & surfactant based systems for improved delivery of poorly Lipid & surfactant based systems for improved delivery of poorly soluble APIs soluble APIs Sri Satyasai Nagendra Babu Punyamurthula University of Mississippi Follow this and additional works at: https://egrove.olemiss.edu/etd Part of the Pharmacy and Pharmaceutical Sciences Commons Recommended Citation Recommended Citation Punyamurthula, Sri Satyasai Nagendra Babu, "Lipid & surfactant based systems for improved delivery of poorly soluble APIs" (2015). Electronic Theses and Dissertations. 1467. https://egrove.olemiss.edu/etd/1467 This Dissertation is brought to you for free and open access by the Graduate School at eGrove. It has been accepted for inclusion in Electronic Theses and Dissertations by an authorized administrator of eGrove. For more information, please contact [email protected].
Transcript of Lipid & surfactant based systems for improved delivery of ...

University of Mississippi University of Mississippi
eGrove eGrove
Electronic Theses and Dissertations Graduate School
1-1-2015
Lipid & surfactant based systems for improved delivery of poorly Lipid & surfactant based systems for improved delivery of poorly
soluble APIs soluble APIs
Sri Satyasai Nagendra Babu Punyamurthula University of Mississippi
Follow this and additional works at: https://egrove.olemiss.edu/etd
Part of the Pharmacy and Pharmaceutical Sciences Commons
Recommended Citation Recommended Citation Punyamurthula, Sri Satyasai Nagendra Babu, "Lipid & surfactant based systems for improved delivery of poorly soluble APIs" (2015). Electronic Theses and Dissertations. 1467. https://egrove.olemiss.edu/etd/1467
This Dissertation is brought to you for free and open access by the Graduate School at eGrove. It has been accepted for inclusion in Electronic Theses and Dissertations by an authorized administrator of eGrove. For more information, please contact [email protected].

LIPID & SURFACTANT BASED SYSTEMS FOR IMPROVED DELIVERY OF POORLY
SOLUBLE APIs
A Dissertation Submitted
In The Partial Fulfillment of Requirements For
The Doctor of Philosophy Degree in Pharmaceutical Sciences
With an emphasis in Pharmaceutics & Drug Delivery
by
NAGENDRA S PUNYAMURTHULA
Department of Pharmaceutics & Drug Delivery
School of Pharmacy
The University of Mississippi
May 2016

Copyright Nagendra Punyamurthula 2016
ALL RIGHTS RESERVED

ii
ABSTRACT
A large number of pharmaceutical compounds belong to class II and IV of
biopharmaceutical classification of drug (BCS). Class II compounds are limited by their poor
aqueous solubility, while class IV compounds suffer from poor solubility and permeability. This
translates to poor absorption and low plasma levels post oral administration. Lipids comprise of
fatty acids and their derivatives and are considered a biocompatible option for drug delivery. In
the studies discussed in following chapters, lipid based drug delivery systems (LBDDS) have
been utilized in improving the handling, ease of formulation, solubility and bioavailability of
three compounds. In the first study, studies have been performed to formulate Δ9- THC into a
sustained release tablet, using lipid matrices, for the treatment of chemotherapy induced nausea
and vomiting (CINV). In the second study, LBDDS such as solid lipid nanoparticles were
prepared for non-invasively enhancing the ocular penetration of Δ8-THC for the treatment of
Glaucoma. In the third study, the handling and oral bioavailability of dihydroartemisinin dimer
oxime was studied using various lipid based systems for potential use in the treatment of malaria.
The lipid based tablet formulation of Δ9- THC was successful in achieving a 24 hour
release profile and can be potentially be used as a one dose per day medication for CINV. The
topical ocular penetration of Δ8-THC significantly when formulated as solid lipid nanoparticles
and the drug was able to reach the posterior ocular segments, with levels being maintained at the
end of three hours. The dimer oxime was able to achieve an 8 hour plasma profile through
various lipid based systems and these levels were above the IC50 values of the malarial parasite.

iii
The tested prodrug showed a lot of promise and further optimization of these formulations would
help in developing a new line of malarial therapy.

iv
DEDICATION
I would like dedicate this thesis to my parents Ananth Babu Punyamurthula and Vydehi
Prasanna Punyamurthula for their constant encouragement, unyielding support and love
throughout the course of my life.

v
ACKNOWLEDGEMENTS
Foremost, I would like to thank my adviser Dr. Soumyajit Majumdar for his support,
patience and guidance throughout my graduate studies. He has been a great teacher and a
constant source of innovation and inspiration. I am grateful to my dissertation committee
members Dr. Michael A. Repka, Dr. S. Narasimha Murthy and Dr. John O`Haver for their
guidance and time. Finally, along with my parents, I would like to thank Harika Tadepally, Dr.
Yoganand Kanduri, Sandeep Tadepally, Rajesh Satyavolu & Padmaja Ayyagari without whose
support this would not have been possible.

vi
DISSERTATION COMMITTEE
Research Adviser Dr. Soumyajit Majumdar (Dept. of Pharmaceutics & Drug Delivery)
Committee Members Dr. Michael A. Repka (Dept. of Pharmaceutics & Drug Delivery)
Dr. S. Narasimha Murthy (Dept. of Pharmaceutics & Drug Delivery)
Dr. John H. O`Haver (Dept. of Chemical Engineering)

vii
CONTENTS
ABSTRACT ii
DEDICATION iv
ACKNOWLEDGEMENTS v
DISSERTATION COMMITTEE vi
LIST OF TABLES ix
LIST OF FIGURES xi
1 CHAPTER 1: INTRODUCTION 1
2 CHAPTER 2: AIMS OF THE STUDY 6
3 CHAPTER 3: CONTROLLED RELEASE TABLET FORMULATION CONTAINING NATURAL
Δ9-TETRAHYDROCANNABINOL
INTRODUCTION
METHODS
RESULTS & DISCUSSION
CONCLUSION
9
4 CHAPTER 4: OCULAR DISPOSITION OF Δ8-TETRAHYDROCANNABINOL FROM VARIOUS
TOPICAL FORMULATIONS
INTRODUCTION
METHODS
RESULTS
DISCUSSION
CONCLUSION
29
5 CHAPTER 5: PHYSICOCHEMICAL CHARACTERIZATION AND ORAL BIOAVAILABILITY
EVALUATION OF A NOVEL DIHYDROARTEMISININ DIMER PRODRUG: THE DIMER
OXIME
INTRODUCITON
METHODS
58

viii
RESULTS
DISCUSSION
CONCLUSION
6 SUMMARY OF ALL THE STUDIES 91
7 BIBLIOGRAPHY 94
8 VITA 103
ix
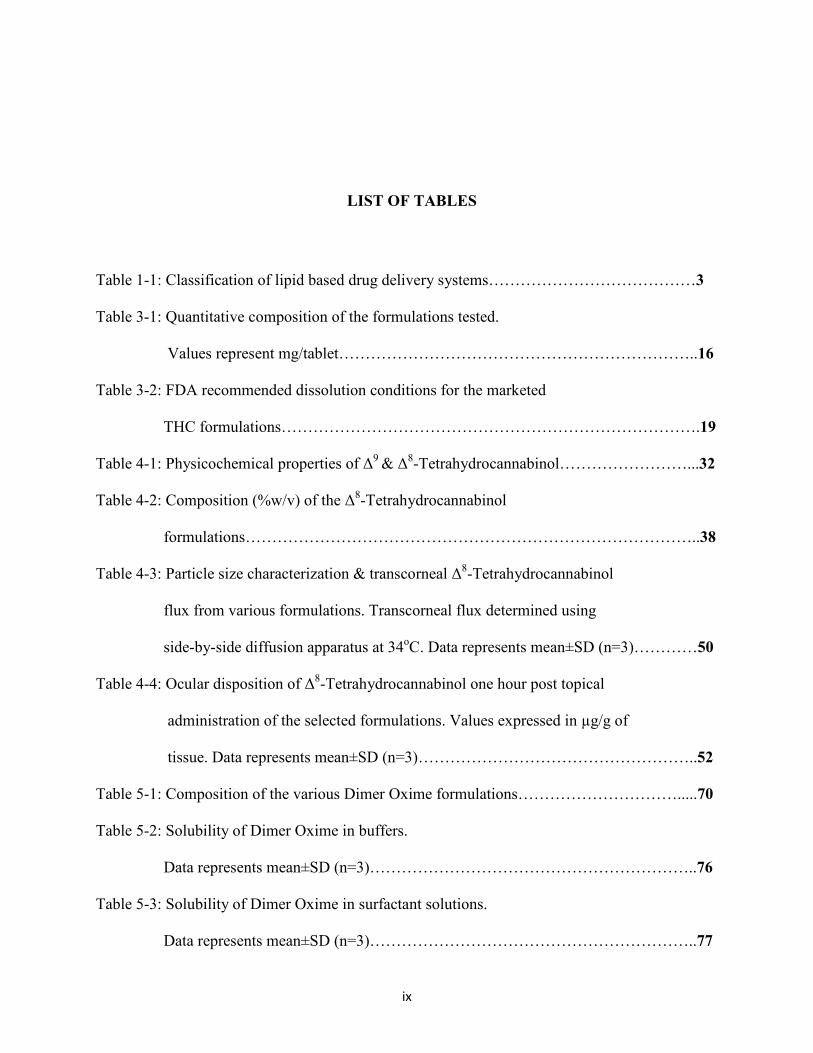
LIST OF TABLES
Table 1-1: Classification of lipid based drug delivery systems…………………………………3
Table 3-1: Quantitative composition of the formulations tested.
Values represent mg/tablet…………………………………………………………..16
Table 3-2: FDA recommended dissolution conditions for the marketed
THC formulations…………………………………………………………………….19
Table 4-1: Physicochemical properties of Δ9 & Δ8-Tetrahydrocannabinol……………………...32
Table 4-2: Composition (%w/v) of the Δ8-Tetrahydrocannabinol
formulations…………………………………………………………………………..38
Table 4-3: Particle size characterization & transcorneal Δ8-Tetrahydrocannabinol
flux from various formulations. Transcorneal flux determined using
side-by-side diffusion apparatus at 34oC. Data represents mean±SD (n=3)…………50
Table 4-4: Ocular disposition of Δ8-Tetrahydrocannabinol one hour post topical
administration of the selected formulations. Values expressed in µg/g of
tissue. Data represents mean±SD (n=3)……………………………………………..52
Table 5-1: Composition of the various Dimer Oxime formulations………………………….....70
Table 5-2: Solubility of Dimer Oxime in buffers.
Data represents mean±SD (n=3)……………………………………………………..76
Table 5-3: Solubility of Dimer Oxime in surfactant solutions.
Data represents mean±SD (n=3)……………………………………………………..77

x
Table 5-4: Solubility of Dimer Oxime in cyclodextrin solutions.
Data represents mean±SD (n=3)……………………………………………………..77
Table 5-5: Stability of Dimer Oxime in various mixtures.
Data represents mean±SD (n=3)……………………………………………………..78
Table 5-6: Particle size and Polydispersity Index (PDI) of various
formulations………………………………………………………………………....80
Table 5-7: Pharmacokinetic disposition of Dimer Oxime from various
formulations in Sprague- Dawley rats. Data represents mean±SD
(n=3)………………………………………………………………………………....85

xi
LIST OF FIGURES
Figure 3-1: Percentage THC released from the tablets as a function of type of the filler used in
the composition. F-1 (DCPA); F-2 (Avicel); F-3 (Lactose). Each data point represents
mean ± SD (n=3). Dissolution conditions: Basket apparatus operated at 100rpm, 37oC
in 0.5%
SLSmedium……………………………………………………………………..18
Figure 3-2: In vitro release profile of THC from controlled release tablets (F-1) as a function of
dissolution apparatus type and paddle/basket speed (rpm). Each data point represents
mean ± SD (n=3). Dissolution conditions: Paddle, basket apparatus operated at
50rpm, 100rpm at 37oC in 0.5% SLS
medium………………………………………………………………………….20
Figure 3-3: In vitro release profile of THC as a function of lipid distribution between the matrix
and/or blend phases of the formulation (basket, 100rpm). F-4: Precirol® distributed
between matrix and blend; F-5: Precirol® in blend only. Each data point represents
mean ± SD (n=3).
Dissolution conditions: Basket apparatus operated at 100rpm, 37oC in 0.5% SLS
medium………………………………………………………………………….22
Figure 3-4: In vitro release profile of THC from F-6 (Precirol® in the blend), F-7 (F-6 with
Pluronic® F68, F-9 (Compritol® in the blend) and F-10 (F9 with Pluronic® F68)
tablets. Each data point represents mean ± S.D. (n=3). Dissolution conditions: Basket
apparatus operated at 100rpm, 37oC in 0.5% SLS
medium……………………………………………………… ……………….23
Figure 3-5: In vitro THC release from tablets prepared using a combination of lipids added to the
blend phase. F-12 and F-14 contained Pluronic® F68. Each data point represents mean

xii
± S.D. (n=3). Dissolution conditions: Basket apparatus operated at 100rpm, 0.5% SLS
medium……………………………………………………………………….....25
Figure 3-6: In vitro THC release profiles from 10 mg and 20 mg tablets. Each data point
represents mean ± S.D. (n=6). Dissolution conditions: Paddle apparatus operated at
100rpm, 37oC in 0.5% SLS
medium………………………………………………………………………….27
Figure 4-1: Side-by-side diffusion apparatus setup for studying in vitro trans-corneal
transport of Δ8-Tetrahydrocannabinol from solid lipid nanoparticles, nanoemulsion
and solution
formulations……………………………………………………………………..41
Figure 4-2: Side-by-side diffusion apparatus setup for studying in vitro trans-corneal
transport of Δ8-Tetrahydrocannabinol from film
formulation……………………………………………………………………....43
Figure 4-3: Release profiles of Δ8-Tetrahydrocannabinol from solid lipid nanoparticles (F1 and
F2) using Slide-A-Lyzer® mini dialysis cassettes. Data represents mean±SD
(n=3)……………………………………………………………………………..48
Figure 4-4: Permeability and flux of Δ8-Tetrahydrocannabinol across isolated rabbit corneas
from various formulations. Data represents mean±SD
(n=3)…………………………………………………………………………..…49
Figure 4-5: Δ8-THC levels obtained in ocular tissues from various formulations, 1h post topical
administration. Dose: 375µg in 50µL for SLNs, 1.6mg in 8mg for film, 15µg in 50µL
for 2.5% CD solution & 70µg in 50µL for 10% CD solution. Data represents
mean±SD(n=3)…………………………………………… …………………….51
Figure 5-1: Scheme for In Vitro permeability using everted gut sac
technique……………………………………………………… ………………...72

xiii
Figure 5-2: Thermal profile of DHA Dimer Oxime using a differential scanning
calorimeter………………....................................................................................75
Figure 5-3: Metabolic Stability of Dimer Oxime & Vermapamil Hydrochloride in rat liver
homogenates. Data represents mean±SD
(n=3)………………………………………………………………………….…79
Figure 5-4: Permeability of Dimer Oxime across rat intestinal segments. Data represents
mean±SD
(n=3)…………………………………………………………………………….81
Figure 5-5: Pharmacokinetic disposition of Dimer Oxime in Sprague-Dawley rats, post
intravenous administration. Data respresents mean±S.D
(n=3)………………………………………………………………………….....82
Figure 5-6: Pharmacokinetic disposition of Dimer Oxime in Sprague-Dawley
rats, post intraperitoneal administration. . Data represents mean±S.D
(n=3)…………………………………………………………………………….83
Figure 5-7: Pharmacokinetic Disposition of Dimer Oxime in Sprague-Dawley Rats,
Post Oral Administration. Data represents mean±S.D
(n=3)……………………………………………………………………….........84

1
CHAPTER 1
INTRODUCTION

2
A large number of pharmaceutical compounds, established and newer ones with
promising therapeutic potential, belong to class II and IV of biopharmaceutical classification of
drug (BCS). Class II compounds are limited by their poor aqueous solubility, while class IV
compounds suffer from poor solubility and permeability. This mostly translates to poor
absorption and low plasma levels post oral administration. To overcome these issues, over the
years, various strategies have been investigated, e.g. using salt forms, co-crystals, complexation,
micellar solutions, co-solvents, lipid systems. Even though all of these approaches have shown
some degree of success in improving the delivery of poorly soluble compounds, surfactant &
lipid based systems have probably demonstrated the highest versatility in terms of improving
delivery of a large number of compounds.
Lipids comprise of fatty acids and their derivatives and are considered a biocompatible
option for drug delivery[1]. The formulations vary from simple oil based solutions to the more
complex self-emulsifying drug delivery systems (SEDDS). Depending on the formulation
characteristics and behavior in vivo, lipid based drug delivery systems (LBDDS) LBDDS are
classified into 4 types as shown in Table 1-1.
In the studies discussed in following chapters, these lipid based carriers have been
utilized in improving the handling, ease of formulation, solubility and bioavailability of three
compounds, namely, Δ9-Tetrahydrocannabinol (Δ9-THC), Δ8-Tetrahydrocannabinol (Δ8-THC) &
a prodrug of dihydroartemisinin dimer (dimer oxime).

3
Table 1-1: Classification of Lipid Based Drug Delivery Systems
Formulation type
Material Characteristics Advantages Disadvantages
Type I
Oils without surfactants (e.g., tri-,
di-, and monoglycerides)
Nondispersing -requires digestion
Generally recognized as safe
(GRAS) status; simple; and
excellent capsule compatibility
Formulation has poor solvent
capacity unless drug is highly
lipophilic
Type II Oils with water
insoluble surfactants
SEDDS formed without water-
soluble components
Unlikely to lose solvent capacity on
dispersion
Turbid o/w dispersion (particle
size 0.25–2µm)
Type III
Oils with surfactants, and cosolvents (both water-insoluble and
water-soluble excipients)
SEDDS/SLNs formed with
water-soluble components
Clear or almost clear dispersion, drug absorption with digestion
Possible loss of solvent capacity on
dispersion, less easily digested
Type IV Water-soluble
surfactants and cosolvents
Formulation disperses typically to form a micellar
solution
Formulation has good solvent
capacity for many drugs
Likely loss of solvent capacity on dispersion may not
be digestible

4
i. In the first study, an effort will be made to formulate Δ9- THC into a sustained release
tablet using lipid matrices. Tetrahydrocannabinol, the active constituent of Cannabis
sativa is used in the treatment of chemotherapy induced nausea and vomiting (CINV).
This compound binds to the cannabinoid receptors, CB1 in the central (brain) and CB2 in
the peripheral nervous systems (spleen), thereby controlling vomiting and is also
beneficial in the treatment of weight loss.[2] They are very beneficial in the treatment of
CINV and added benefits include analgesia, anti-tumor effects, mood elevation and cure
for insomnia in cancer patients.[3, 4] Commercially available pharmaceuticals containing
cannabinoids include Nabilone (Cesamet®) and Dronabinol (Marinol®). Nabilone is given
twice a day up to 48 hours post chemotherapy[5] and Dronabinol, every 2-4 hours for a
total of 4-6 doses a day,[6, 7] a common reason for patient non-compliance. Also, use of
Dronabinol is contraindicated in case of patients with hypersensitivity reaction to sesame
oil[6, 7]. The aim of the present study is to formulate an oral sustained release tablet
formulation of Δ9-THC, which can be administered once a day and provides a sustained
effect over a longer period of time. Also, by eliminating the sesame oil in the formulation
one can enhance the acceptance among a majority of patients.
ii. In the second study, LBDDS will be applied for enhancing the ocular penetration of Δ8-
THC for the treatment of Glaucoma. Δ8-Tetrahydrocannabinol (Δ8-THC) is the primary
active constituent of Cannabis sativa and an isomer of Δ9- THC. This compound has
shown potential in treatment of glaucoma through its intra-ocular pressure (IOP) lowering
and neuroprotective effects, through its agonistic action on the CB1 and CB2 receptors. It

5
presents many challenges, however, in formulation and delivery owing to its high
lipophilicity, poor aqueous solubility and resinous nature. The fact that the eye is an organ
with complex physiological barriers further complicates the problem. Using solid lipid
nanoparticles as carriers, studies will be undertaken to evaluate, and possibly enhance,
penetration of Δ8-THC to the posterior ocular segment following topical application.
iii. In the third study, various surfactant & LBDDS will be utilized for improving the oral
bioavailability of a novel dihydroartemisinin dimer. Dihydroartemisinin (DHA) is the
active metabolite of Artemisinin, which in turn is the active constituent of Artemisia
annua L and is used in the treatment of malaria. This compound was proven to be highly
effective on the malarial parasite and has a short fever clearance time and low toxicity.
Inherently, Artemisinin or DHA are both BCS class IV compounds, which means low
solubility and permeability. For this study, a novel DHA dimer with an oxime group was
synthesized and this compound’s physicochemical characteristics will be delineated,
following which, the compound will be incorporated into various surfactant & lipid based
systems. These formulations will be studied with respect to their performance, both in
vitro and in vivo.

6
CHAPTER 2
AIMS OF THE STUDY

7
Overall Objective:
The goal of the studies is to improve the handling and bioavailability of these three
compounds. Surfactant & lipid based systems will be utilized for this purpose and various
formulation approaches such as solid lipid nanoparticles (SLNs), nanolipid carriers (NLCs) and
sustained release systems will be explored. This is based on the hypothesis that orally, the
surfactants will help in enhancing the solubility of the compounds in solution and LBDDS will
help bypass the dissolution step by presenting the drug in a pre-dissolved form and avoidance of
re-precipitation from this pre-dissolved state, emulsify the drug in the intestinal milieu and
finally, enhance the lymphatic uptake processes. From an ophthalmic delivery point of view, the
lipid based nanoparticles will help increase the residence time on the ocular surface because of
entrapment in the mucosal layer and active epithelial uptake and size.
Specific Aims:
1. To screen various lipids and fillers and finally suggest an optimal composition for
a sustained release tablet of Δ9-THC.
2. To screen Δ8-THC for its physicochemical characteristics, formulate various LBDDS
and evaluate their in vitro release, entrapment efficiencies and transcorneal permeability.

8
3. To evaluate the in vivo bioavailability of these formulations in rabbits & compare it with
conventional solution formulations.
4. To screen the DHA dimer oxime for its solubility, stability and other physicochemical
characteristics.
5. To formulate various DHA incorporated surfactant, LBDDS and compare their in vitro
permeability across intestinal segments.
6. To compare the oral bioavailability of these formulations and suggest a platform for
enhancing the oral bioavailability of DHA dimer oxime.

9
CHAPTER 3
CONTROLLED RELEASE TABLET FORMULATION CONTAINING
NATURAL Δ9 - TETRAHYDROCANNABINOL

10
3.1. Introduction
Chemotherapy Induced Nausea and Vomiting (CINV) is the most common and feared
post chemotherapy side-effect [2, 8-13]. Around 30 to 90% of patients undergoing chemotherapy
experience this, thereby reducing the quality of life (QOL) [2]. Tetrahydrocannabinol (THC), a
component of cannabis is used against CINV. THC binds to the cannabinoid receptors, thereby
controlling vomiting and is also beneficial in the treatment of weight loss [2, 14-20].
Commercially available pharmaceutical cannabinoids include Nabilone (Cesamet®) and
Dronabinol (Marinol®)[5-7]. Synthetic THC used in Dronabinol as well as the natural THC
obtained from the plant, is a resinous sticky oil that hardens on refrigeration. THC undergoes
degradation through several mechanisms [21, 22] and handling of the resinous form is very
difficult from a formulation point of view. Dronabinol is thus formulated as a sesame oil solution
of THC and is supplied in a soft-gelatin capsule. Nabilone, on the other hand, is a synthetic THC
derivative that is crystalline in nature and is thus filled into a hard gelatin capsule.
The goal of this research project was to develop an oral tablet formulation using naturally
occurring THC. To overcome the challenges in handling the oily resinous characteristics of
THC, a lipid based formulation approach was selected to develop controlled release THC tablets
[23, 24].

11
In vivo, it has been shown that THC undergoes high first pass metabolism, transforming it
into its 11-hydroxy metabolite, which results in very low oral bioavailability [22, 25]. Therefore,
the lipid based systems could promote lymphatic uptake of THC and thus decrease first-pass
metabolism, resulting in greater plasma concentrations at lower doses[24]. Also, to our
knowledge this is the first attempt at producing a sustained release solid dosage form for THC.
The instability of THC in solid state has been a major obstacle previously[26], which may also be
migitated through the use of a lipid matrix.
3.2. Materials and methods
Precirol® ATO 5 (Glycerol Distearate) and Compritol® 888 ATO (Glycerol Dibehenate)
were obtained as gift samples from Gatefosse (St.Priest, France), Avicel® 102 (Micro-crystalline
Cellulose) was obtained from FMC Biopolymer (Philadelphia, PA), Emcompress® (Dicalcium
Phosphate Anhydrous, DCPA), from JRS Pharma (Rosenberg,Germany), Ludipress® (composed
of Lactose monohydrate, Povidone K30 (Kollidon® 30) and Crospovidone (Kollidon® CL) from
BASF Fine chemicals (Switzerland), Pluronic® F68 from Sigma Aldrich (St.Louis, Missouri),
Aerosil® R972 from Evonik Industries (Germany), Magnesium Stearate (Mg. Stearate) from
Spectrum Chemicals (Gardena, CA). All solvents used for analysis were of analytical grade.

12
Methods
Three types of THC containing tablets were prepared. The variations involved the use of
the lipid component either in the lipid-THC matrix, lipid in external phase (added during the
blending phase) or incorporating lipid in the matrix as well as in the blend stage. The various
formulations evaluated are shown in Table 2.1.
Preparation of lipid-drug matrix
The lipid-drug matrices were prepared by solid dispersion technique. THC lipid
dispersions, 25% w/w, were made by heating the mixture to 70oC followed by molding of the
dispersion into slugs using 1 mL tuberculin syringes. The matrix was cryo-milled using a Fitz
Mill L1A (The Fitzpatrick Company, Elmhurst, Illinois) and sieved through ASTM sieve # 70.
Preparation of tablets
Granules were compressed using a Manual Tablet Compaction Machine, MTCM-I (Globe
Pharma Inc., New Brunswick, NJ) with 8mm flat faced punches at compression forces ranging
from 7.6kN to 9.8kN. THC-lipid matrices were blended with the other excipients and directly
compressed. In some formulations additional lipid was included during the blending stage also.
Alternatively, THC (in hexane) was coated on the filler (DPCA/ MCC/ Lactose), dried at 25oC,
blended with the other excipients including the lipids under evaluation. The blend was directly
compressed into tablets.

13
Evaluation of tablets
Physical characteristics
The physical properties of the tablets such as appearance, texture, hardness, weight
variation, friability were determined in accordance to standard protocols. Hardness was
determined using VK-200 tablet hardness tester (Varian Inc, NC).
Assay and Content uniformity of tablets
About 5 tablets for assay and 3 tablets separately for content uniformity were powdered in
a mortar and pestle; about 2 mg of the powder was accurately weighed and extracted in 1mL of
methanol, followed by centrifugation (13000 rpm, 20 min). The supernatant was collected and
diluted suitably with mobile phase and was analyzed in triplicate by HPLC using the analytical
method described in the section below.
Analytical method
A Waters HPLC system (Mildford, Massachusetts) consisting of Waters 600 pump
controller, refrigerated Waters 717 plus autosampler, Waters 2487 UV detector, and Agilent
(Santa Clara, California) 3395 integrator was used in the present investigation. Initial stock
solution (1mg/mL) of THC was prepared in ethanol and stored at -20o C till used. Standards were

14
prepared by pipetting out a known amount of stock solution and evaporating it under a stream of
nitrogen gas. Suitable standards were prepared by reconstitution in the mobile phase. A Luna PFP
(2), 4.6 × 250mm column, Phenomenex (Torrance, CA) was used for the separation and analytical
purposes. Mobile phase had a mixture of methanol – water [containing 0.84% (v/v) glacial acetic
acid] in 85:15 ratios. The detector was set at an analytical wavelength of 226nm, while the
injection volume was 20uL. The standards were prepared in the concentration range of 1-100
µg/mL. The standard calibration curve was derived and the parameters such as regression
coefficient (r2), slope and Y- intercept were noted to establish the linearity of the method.
Response after repeated injections from the same sample was recorded to check for precision and
dissolution medium with the placebo formulations were injected to ensure there was no
interference. The method was also validated with respect to limit of detection (3 times signal-to-
noise ratio) and limit of quantification (10 times signal-to-noise ratio).
In vitro drug release studies
The in vitro drug release (dissolution) studies were performed using USP type I (basket)
and type II (paddle) apparatus at 100 rpm and 50 rpm, respectively, and THC release from the
tablets was evaluated. The dissolution medium consisted of 900 mL of water containing sodium
lauryl sulfate (SLS) (0.5 %w/v), while the temperature was maintained at 37oC±0.5oC. At
predetermined time intervals, samples (1 mL) were withdrawn and replaced with an equal volume
of dissolution media. The samples were then analyzed by HPLC.
15
Stability studies
Stability studies were performed as per the ICH guidelines. The tablets were packed into
small aluminum pouches which were then sealed under nitrogen. The samples were loaded into
stability chambers maintained at 25±2oC/60±5 % RH and 40±2oC/75±5% RH. At predetermined
time points, samples were withdrawn for evaluation.
3.3. Results and Discussion
Formulations
A total of 14 formulations with varying excipient proportions were prepared. Qualitative
and quantitative composition of all formulations are listed in Table 3-1.

16
Table 3-1: Quantitative composition of the various formulations tested. Values represent mg/tablet.
Code THC Precirol in Matrix
Compritol in Matrix
DCPA Avicel Ludipress Pluronic Precirol in Blend
Compritol in Blend
Aerosil Mg. Stearate
F-1 10 30 159.7 0.2 0.1 F-2 10 30 159.7 0.2 0.1 F-3 10 30 159.7 0.2 0.1 F-4 10 30 137.7 20 0.2 0.1 F-5 10 159.7 30 0.2 0.1 F-6 10 129.7 60 0.2 0.1 F-7 10 127.7 2 60 0.2 0.1 F-8 10 30 159.7 0.2 0.1 F-9 10 129.7 60 0.2 0.1
F-10 10 127.7 2 60 0.2 0.1 F-11 10 149.7 30 10 0.2 0.1 F-12 10 147.7 2 30 10 0.2 0.1 F-13 10 149.7 20 20 0.2 0.1 F-14 10 147.7 2 20 20 0.2 0.1
Precirol in matrix: Precirol incorporated along with THC into the drug-lipid matrix. Precirol in blend: Precirol added directly in the blend, after THC was coated onto DCPA. Compritol in matrix: Compritol incorporated along with THC into the drug-lipid matrix. Compritol in Blend: Compritol added directly in the blend, after THC coated onto DCPA. Mg. Stearate: Magnesium Stearate
Analytical method
The analytical method showed linearity within the range 0.5 – 100 µg/mL, with an r2 value
of 0.99. Limit of detection and limit of quantification were found to be 10 ng/mL and 30 ng/mL,

17
respectively, and the retention time for THC was about 11.2 min. The method was observed to be
specific and precise.
Evaluation of the tablets
Assay, Content uniformity and Physical characteristics
THC assay in all formulation batches, was between 95 to 102%. Content in each tablet
was between 94 to 101%. The target tablet weight and hardness were 200 mg and 5.4 kp,
respectively. Weight variation (200±2 mg), friability and thickness were all observed to be within
limits. Tablet hardness was found to range between 5.3 - 5.6kp (n=3) over the entire range of
formulations.
In vitro drug release studies
Release of THC from the formulations was seen to be influenced by the type of filler
(DCPA/MCC/Lactose) used in the formulation, as shown in Figure 3-1. In the case of MCC
(Avicel) as the filler (F-2), the drug release was more uneven with about 70 % THC being
released within 1h, followed by minimal release at further time points. Additionally, ‘tablet
splitting’ was observed in the dissolution media in these formulations (F-2). Although hardness
was kept similar in all three formulations, this phenomenon was seen only in formulation F-2.

18
Figure 3-1: Percentage THC released from the tablets as a function of type of the filler used in
the composition. F-1 (DCPA); F-2 (Avicel); F-3 (Lactose). Each data point represents mean ±
SD (n=3). Dissolution conditions: Basket apparatus operated at 100rpm, 37oC in 0.5% SLS
medium.
Tablets prepared using lactose as the filler (F-3), showed good physical characteristics, but
a release of 55% in 1h and 78% in 6 h was observed. On the other hand, tablets with DCPA as the
filler (F-1) released about 34% in 1h and about 74% by the end of 6 h. Moreover, the THC release
profile from formulation F-1 was much smoother and more uniform compared to formulations F-
2 and F-3. On the basis of these results, DCPA was selected as the filler for further studies.
0
25
50
75
100
0 2 4 6
% T
HC R
elea
se
Time (h)
F-2 (Avicel)
F-1(DCPA)
F-3 (Lactose)

19
The dissolution conditions recommended by FDA for the marketed THC formulations, Nabilone
and Dronabinol, are shown in Table 3-2 [27].
Table 3-2: FDA recommended dissolution conditions for the marketed THC formulations.
Drug Name Dosage Form USP Apparatus
Speed (RPMs) Medium Volume (mL)
Recommended Sampling
Times (minutes)
Dronabinol
Capsule
II (Paddle)
100 and 150
10% Labrasol in Water; (In addition, the USP capsule rupture test should also
be conducted)
500
5, 10, 15, 30, 45, 60, and
until at least 80% of the
labeled content is released
Nabilone Capsule II (Paddle) 50
0.1% Tween 80 solution 1000 15, 30, 45 and
60
The currently marketed dosage forms are immediate release capsules. Thus, there was a
need to develop a dissolution method to study THC release from the proposed controlled release
formulations. Since THC release is known to be pH independent and the dissolution medium was
able to maintain sink conditions, apparatus type (basket or paddle) and rpm (50 or 100) were the
only parameters that were varied.
As shown in Figure 3-2, THC release from F-1 was 41% and 52% at the end of 6 hours
when a paddle was employed at 50 and 100 rpm, respectively. When an USP Type I Apparatus
(basket) was used THC release was 48% and 76% in 6 hours at 50 and 100 rpm, respectively. The

20
higher drug release in the basket apparatus, could be due to the greater erosion effect on the
bottom layers of the tablets, due to abrasion.
Figure 3-2: In vitro release profile of THC controlled release tablets (F-1) as a function of
dissolution apparatus type and paddle/basket speed (rpm). Each data point represents mean ± SD
(n=3). Dissolution conditions: Paddle, basket apparatus operated at 50rpm, 100rpm at 37oC in
0.5% SLS medium.
In order to optimize the release characteristics of THC from the formulations, it was
decided that the more stressful dissolution conditions (producing faster release rates) would be
used since these formulations would be more rugged in nature. Considering this, the basket
0
25
50
75
100
0 2 4 6
% T
HC R
elea
se
Time(h)
Paddle 50rpmBasket 50rpmPaddle 100rpmBasket 100rpm

21
apparatus at 100 rpm was selected for studying the release characteristics of the formulations.
Release profile with the paddle method at 100 rpm, as per the FDA approved method, will be
determined on the formulation showing a sustained 24h release profile under the stress conditions.
As discussed earlier, F-1 released 76% of the THC in the formulation at the end of 6 hours
(Fig. 3-2), when a basket at 100 rpm was employed. In order to slow down the release,
formulation F-4 was prepared using 20 mg of additional Precirol® in the blend phase (on top of
the 30 mg in the lipid matrix). The tablet weight was kept at 200 mg by adjusting the amount of
DCPA. Another formulation, F-5, was prepared with the total amount of lipid added externally in
the blend phase. In this case, THC, dissolved in hexane, was coated onto DCPA and dried in an
oven at 25oC for 30 minutes, before blending it with the other excipients. Formulation F-4,
showed 51% THC release at the end of 6 hours with insignificant release at the later time points
(Fig. 3-3). Formulation F-5 exhibited a much faster release profile with a t90 (time taken to release
90 % of drug) of less than 6 hours. From these results, it can be concluded that Precirol®, used
internally in the drug-lipid matrix or externally in the blend phase significantly diminished drug
release, but the inclusion of the lipid in the internal phase had a greater sustained release effect.
On the other hand, when Compritol® was used in the lipid matrix (F-8), the release was found to
be very erratic. From the data (not shown), it was evident that the drug was being released in
uneven bursts.

22
Figure 3-3: In vitro release profile of THC as a function of lipid distribution between the matrix
and/or blend phases of the formulation (basket, 100rpm). F-4: Precirol® distributed between
matrix and blend; F-5: Precirol® in blend only. Each data point represents mean ± SD (n=3).
Dissolution conditions: Basket apparatus operated at 100rpm, 37oC in 0.5% SLS medium.
In view of the relative rapid and uniform release profile of THC from formulation F-5, the
matrix phase was not studied any further and the lipid content in the external phase was increased
to 60 mg per tablet in formulation F-6. As can be seen from Figure 3-4, 83% THC release was
observed in 10 hours.
0
25
50
75
100
0 2 4 6 8 10
% T
HC R
elea
se
Time(h)
F-5
F-4

23
Figure 3-4: In vitro release profile of THC from F-6 (Precirol® in the blend), F-7 (F-6 with
Pluronic® F68), F-9 (Compritol® in the blend) and F-10 (F9 with Pluronic® F68) tablets. Each
data point represents mean ± S.D. (n=3). Dissolution conditions: Basket apparatus operated at
100rpm, 37oC in 0.5% SLS medium.
In vivo, one of the major factors that could significantly affect the release profile of the
drug from a lipid based tablet is lipolysis. The lipases present in the GIT digest the lipids rapidly,
thereby causing rapid drug release. An approach to counter the effect of these enzymes is to use
long chain lipids [28] and stabilizers [29]. Stabilizers act by inhibiting the degradation of drugs
through lipolysis. Pluronic® F68, a triblock polymer, acts by blocking the activity of co-lipase
enzyme. For lipolysis, the particle surface needs to have a lipase anchored to it with co-lipase
playing an important role in facilitating the activity of lipase on the lipid surface. One of the
0
25
50
75
100
0 2 4 6 8 10
% T
HC R
elea
se
Time(h)
F-6
F-7
F-9
F-10

24
predominant mechanism of co-lipase is to anchor the lipase to the particle surface and other is to
prevent the inactivation of lipase by the action by bile salts [29]. A stabilizer reduces the
adsorption of lipases on the particle surface through a mechanism called the “windscreen wiper
effect” [29] wherein the lipases are prevented from anchorage and thus blocking the initial
necessary step for degradation of lipid [30]. Several studies have shown that use of Pluronic® F68,
as a stabilizer has been successful in preventing lipolysis in vitro [31]. Also, the property of
Pluronic® F68’s increased efficiency with increasing protein molecular weight, further facilitates
the anti lipolytic activity, considering the high molecular weight of the lipases, which is
approximately 50,000 kDa [30].
Based on this, formulation F-7 was prepared with Pluronic® F68, added as a stabilizer, to
study the effect of its inclusion on the release of THC from F-6. It was seen that inclusion of
Pluronic® F68 did not significantly affect THC release.
Also, Compritol®, a C-22 chained ester of behenic acid, is impervious to emulsification, a
step that is pre-requisite for lipolysis [28, 32, 33], and formulations based on Compritol® would
likely show minimum change in release profiles as a result of enzymatic degradation of the lipids.
Thus, formulations F-9 & F-10 were prepared substituting Compritol® in place of Precirol® in F-6
and F-7. Compritol® was added directly to the blend. These formulations, F-9 and F-10, showed
a very slow release rate of 5% and 4%, respectively, at the end of 10 hours (Fig. 3-4).

25
The combined effect of Compritol® and Precirol® was then investigated (F-11, F-12, F-13
and F-14). Formulations F-12 & F-14 contained Pluronic® F68 in the composition. Figure 3-5
shows that 100% drug release was observed from all formulations. F-13 and F-14 had better
release profiles compared to F-11 and F-12.
Figure 3-5: In vitro THC release from tablets prepared using a combination of lipids added to the
blend phase. F-12 and F-14 contained Pluronic® F68. Each data point represents mean ± S.D.
(n=3). Dissolution conditions: Basket apparatus operated at 100rpm, 37oC in 0.5% SLS medium.
0
25
50
75
100
0 2 4 6 8 10
% T
HC R
elea
se
Time(h)
F-11
F-12
F-13
F-14

26
Effect of THC dose on the release profile
To simulate the effect of dose on percentage release, the release studies were also carried
out using two tablets of formulation F-14 (containing 10 mg THC each) per jar. Though this does
not mimic adding a single 20 mg THC tablet, the results would provide additional information
with respect to the THC release profiles at higher THC doses (dose weight ratio formulations) and
the performance of the dissolution medium (0.5% SLS in water). THC release profiles from the
lower dose, 10 mg (single tablet), and higher dose, 20 mg (double tablet), formulations was
observed to be similar. Similarity (f2) factors were calculated and the f2 value was greater than 50,
suggesting that the drug release profile remained significantly unchanged.
The dose effect dissolution study was done using the paddle apparatus, as suggested by the
FDA for testing Dronabinol. About 100 % THC release was seen at 22 hours at a paddle speed of
100 rpm from both the single and double doses (Fig. 3-6). These results suggest that doubling the
dose to 20 mg in a dose-weight ratio based formulation would not affect the release profile.

27
Figure 3-6: In vitro THC release profiles from 10 mg and 20 mg tablets. Each data point
represents mean ± S.D. (n=6). Dissolution conditions: Paddle apparatus operated at 100rpm, 37oC
in 0.5% SLS medium.
Drug release model
The release profile obtained from formulation (F-14) was fitted into various models (Zero
order, First order, Higuchi diffusion kinetics, Korsemeyer Peppas, Hixon Crowel model). It was
seen that the zero order release kinetic model (r2 adjusted = 0.99) was the best-fit for the THC
release profiles observed.
0
25
50
75
100
0 2 4 6 8 10 12 14 16 18 20 22 24
% T
HC R
elea
se
Time(h)
F-14 (Single dose at 100rpm)
F-14 (Double dose at 100 rpm)

28
Stability studies
The stability study results demonstrated that formulation F-14 was physically and
chemically stable at 25±2oC/60±5 %RH for 3 months. About 7% drug loss however, was
observed at 40±2oC/75±5 %RH in the same time period. The thermolabile characteristics of THC
and susceptibility to oxidation is probably responsible for this. The stability can be improved with
the addition of antioxidants and an intermediate stress condition, 30±2oC/65±5 %RH, should
probably be more applicable for accelerated testing.
3.4. Conclusions
This study demonstrates that THC can be successfully formulated into a controlled release
tablet. With an optimal lipid combination and proportion, it is possible to tailor the drug release to
meet the desired plasma concentration time profile. Also, dispersion of THC in melted lipids
followed by cryo-milling or the coating of THC (in hexane) on DCPA followed by drying before
blending and compression proved to be good methods for overcoming the handling issues. The
use of Pluronic® F68 as a stabilizer against lipolysis did not alter the release profile in vitro.
Further studies are being planned to establish the stabilizing activity of Pluronic® F68 and
subsequent oral bioavailability, in vivo.

29
CHAPTER 4
OCULAR DISPOSITION OF ∆8-TETRAHYDROCANNABINOL FROM
VARIOUS TOPICAL FORMULATIONS

30
4.1. Introduction:
Glaucoma is a primary cause for irreversible loss of vision. The onset of this condition is
multifactorial which involves an increase in the intra-ocular pressure (IOP), loss of retinal
ganglion cells (RGC) due to apoptosis, vascular insufficiency etc.[34, 35]. Studies have shown
that this condition is widely prevalent with around 2 million people diagnosed in the United
States, and accounts for 17.8% of the medical costs towards major eye diseases. These numbers
are expected to further increase with more than 3 million of the populace being afflicted by this
disease by the year 2020 [34, 36]. On a global scale, this number is expected to reach a
staggering 79.3 million by 2020, with more than 11 million falling into a state of “complete loss
of vision” [37].
Elevation of the IOP, an important factor in glaucoma, is as a result of altered aqueous
humor flow and drainage dynamics which is caused by a change in the trabecular meshwork
structure. Death of RGC has also been shown to have an effect along with elevated IOP on the
ultimate loss of vision in glaucoma patients [38, 39]. It has also been shown that a substantial
number of patients have been diagnosed with glaucoma with no elevated IOP [40]. This shows
that elevated IOP is a determining but not the only factor causing this condition. More recent
studies focus on the loss of RGC due to apoptosis, a mechanism of programmed cell death,
which is believed to be the main reason for neuronal damage, ultimately leading to RGC death
[41, 42].

31
Δ9-Tetrahydrocannabinol (Δ9-THC) & Δ8-Tetrahydrocannabinol (Δ8-THC) are the
primary active constituents of Cannabis sativa. Δ9-THC has shown potential in the treatment of
glaucoma through its IOP lowering and neuroprotective effects [43-45]. The mechanism of
action is not completely understood, though it has been said to have an agonistic action on the
CB1 and CB2 receptors [46, 47]. These receptors are expressed on the iris-ciliary, retina choroid
and the trabecular meshwork [48]. THC, through these receptors, causes relaxation of the
trabecular meshwork which results in increased aqueous humor drainage and subsequent IOP
reduction [44]. Neuroprotective action of Δ9 -THC was also recently studied by El-Remessy et al.
in NMDA induced retinal toxicity [44], making Δ9-THC a promising candidate in glaucoma
therapy. Previous reports from our group have demonstrated the physicochemical characteristics
and permeability and in vivo disposition of Δ9-THC and it’s relatively water soluble prodrugs in
the eye. The effects of ion pairing and micellar solutions on the disposition of Δ9-THC in the eye
were studied in these reports [49, 50].
While all the above literature focuses completely on Δ9-THC, little has been said and
reported about the potential of its isomer, Δ8-THC. This compound exhibits a stereochemistry
similar to Δ9-THC and is also chemically more stable than the latter [51]. In addition, the
efficacy of Δ8-THC in reducing IOP has been demonstrated previously in rabbits [51, 52].
Although Δ8-THC is chemically more stable than Δ9-THC, delivery of this compound to
the deeper ocular tissues is challenging. Like Δ9-THC, this compound is also highly lipophilic

32
and poorly soluble and resinous in nature. Table 4-1 compares the properties of these two
isomers.
Table 4-1: Physicochemical Properties of Δ9 & Δ8-Tetrahydrocannabinol*
*Data obtained from ACD/Structure Elucidator, version 12.01, Advanced Chemistry Development, Inc., Toronto, ON, Canada, www.acdlabs.com, 2014
Solid lipid nanoparticles (SLNs) have been studied over the years as a platform for
enhancing topical administration [53, 54]. Ease of fabrication, stability, targeted delivery, non-
toxicity, small size, prolonged release are some of the advantages of this delivery system.
Additionally, the small size of the SLNs can enhance ocular delivery by increasing the corneal
residence time and penetration [55-57]. Ibrahim et al reported increased bioavailability of
gatifloxacin using mucoadhesive nanoparticles synthesized using Eudargit RS 100 and
hyaluronic acid [58]. Cavalli et al. reported that ocular bioavailability of tobramycin increased 4-
fold on incorporation of the drug into an SLN formulation. The authors attributed the increased
Property Δ8-Tetrahydrocannabinol Δ9-Tetrahydrocannabinol Molecular Weight 314.4 314.4
Log P 7.53 ± 0.36 7.68 ± 0.35 mLog P 3.96 3.96 Log D 7.07 7.07 pKa 9.6 9.6
Polar surface area 29.46 29.46 Solubility (µg/mL) 0.26 ± 0.03 1 - 2

33
bioavailability to the trapping of the nanoparticles in the epithelial mucus layer, thus, resulting in
prolonged release of the drug into the aqueous humor for up to 6 hours [56]. Although the utility
of SLNs in ocular therapy in conditions pertaining to the anterior chamber has been investigated
and reported, the same cannot be said for delivery to the posterior segment.
Another ocular delivery platform that has promise is drug loaded films. These systems,
have the advantage of providing increased contact time with the ocular surface and prolonged
release, which reduces the dosing frequency. Depending on the mechanism of drug release post
application, the films are classified as either soluble or insoluble. Soluble films are generally
made of soluble or erodible polymers and therefore circumvent the need of removal from the
eye. The polymer can be either natural or synthetic and release from these kinds of delivery
systems is mainly by diffusion as the polymer undergoes gradual gelling followed by dissolution
in the tear fluid. Hermans et al reported the improved bioavailability of cyclosporin A using
chitosan films [59], while Attia et al used erodible gelatin films for improving the bioavilability
of dexamethasone [60].
In this study we evaluate the efficacy of topically administered SLNs in delivering Δ8-
THC to the posterior ocular tissues. Further, we also study the utility of a melt-cast film
formulation. This film formulation technique, unlike previous reports, avoids the use of solvents,
thereby eliminating the risks posed by residual solvents to the ocular tissues.

34
A comparative evaluation of the SLNs, films, nanoemulsion and a cyclodextrin solution
in terms of their ability to deliver the drug to various ocular tissues, has been undertaken both at
in vitro and in vivo levels.
4.2. Materials & Methods:
Materials
Compritol® ATO 888 and Precirol® ATO 5 were gift samples from Gattefosse, France.
Poloxamer® 188 was obtained from BASF, Chattanoga, TN. Lipoid® E 80 (Lipoid,
Ludwigshafen, Germany) was a gift sample. Propofol, randomly methylated beta cyclodextrin,
hydroxypropyl methyl cellulose (4000 cps), Polyethylene Oxide N10 were purchased from
Sigma (St. Louis, MO). All other chemicals were purchased from Fisher Scientific (St. Louis,
MO). Solvents used for analysis were of HPLC grade.
Animal Tissues
Whole eye globes of New Zealand Albino rabbits were purchased from Pel Freez
Biologicals (Rogers, AK). Eyes were shipped overnight in Hanks Balanced Salt Solution (HBSS)
over wet ice. Corneas were isolated and used immediately on receipt.

35
Animals
Male New Zealand White Albino Rabbits were procured from Harlan Labs
(Indianapolis, IN). Animal experiments conformed to the tenets of the Association for Research
in Vision and Ophthalmology statement on the Use of Animals in Ophthalmic and Vision
Research and followed the University of Mississippi Institutional Animal Care and Use
committee approved protocols.
Formulations:
Solid Lipid Nanoparticles Containing Δ8-THC:
SLNs were prepared as per previously established protocols [61], using a high speed &
high pressure homogenization method. Δ8-THC was accurately weighed and melted along with
Compritol® 888 ATO or Precirol® ATO 5 (Gattefosse, France) to obtain a clear lipid phase. An
aqueous phase containing 0.25% Poloxamer® 188, 0.75% Tween® 80 and 2.25% Glycerin (w/v)
in distilled water, was heated and added to the melted lipid phase under stirring. A coarse
emulsion from this pre-mix was formed using an Ultra-Turrax®, followed by high pressure
homogenization. The temperature during this entire process was maintained at 70°C. The hot
emulsion was slowly cooled to room temperature to form Δ8-THC SLNs.
SLNs with randomly-methylated beta cyclodextrins (RMβCD) in the lipid phase were
prepared by dissolving Δ8-THC & RMβCD in acetonitrile and keeping in a water bath for 24h at
25oC for complex formation. At the end of 24h, the organic solvent was evaporated under

36
nitrogen and molten lipid was added to this Δ8-THC-RMβCD complex and the above procedure
was repeated for SLN production. Alternately, Δ8-THC-RMβCD SLN formulation was prepared
without the Δ8-THC-RMβCD complexation step. Instead, RMβCD was dissolved in the aqueous
phase along with Poloxamer 188®, Glycerin, Tween® 80 and the procedure described above was
followed for SLN production.
Nanoemulsion Containing Δ8-THC:
The nanoemulsion containing Δ8-THC was prepared according to previously published
protocols [52, 62]. Briefly, ∆8 –THC (0.1%w/v), α-tocopherol (0.02 %w/v) and oleic acid (6
%w/v) were added to super refined soybean oil (14 %w/v) to prepare the oil phase. Poloxamer®
188 (2% w/v) and glycerin (2.25% w/v) were added to deionized water to prepare the aqueous
phase. Lipoid E 80® (1 % w/v) was dispersed in the aqueous phase. Both phases were heated to
70°C. The aqueous phase was first added to the oil phase under constant mixing using Ultra-
Turrax® to form a coarse emulsion. It was then passed through a high pressure homogenizer
(Avestin C5 Emulsiflex®) and later allowed to cool down to room temperature. The pH of the
final emulsion was adjusted to pH 7.4 using 1N sodium hydroxide and filtered through a 0.45
μM membrane filter.
Film Formulation Containing ∆8-THC:
Hot melt cast method was utilized to prepare the polymeric film. Polyethylene oxide
(PEO N10: MW 100000 Daltons) was used as the matrix forming material. ∆8-THC (20% w/w)
was dissolved in acetonitrile and dispersed in PEO N10 with adequate mixing. The mixture was

37
placed in a vacuum chamber to evaporate the organic solvent. A 13 mm die was placed over a
brass plate and the brass plate was heated to 70 °C using a hot plate. The drug-polymer mixture
was placed in the center of the die, compressed and further heated for 2-3 min. Following
cooling, 4 mm x 2 mm film segments were cut from the film.
Solution Formulations containing ∆8-THC:
Solutions were prepared by adding excess of ∆8-THC to 2.5% and 10% aqueous RMβCD
solutions in isotonic phosphate buffered solution (IPBS) and allowing the solutions to equilibrate
for 24h at 25oC in a reciprocating water bath. At the end of 24h, solutions were centrifuged and
the supernatant was analyzed for ∆8-THC content. These solution formulations served as controls
for all the experiments.
The formulation compositions have been presented in Table 4-2

38
Table 4-2: Composition (%w/v) of the various Δ8-Tetrahydrocannabinol Formulations:
*: F-5 values expressed in % w/w terms.
Determination of Particle Size and Polydispersity Index:
Particle size and Polydispersity Index (PDI) of the SLNs and nanoemulsion formulations
were measured using a dynamic light scattering instrument, Zetasizer Nano ZS (Malvern
Instruments Inc., Westbrough, MA), at 25 °C. A high concentration zeta cell was used to
measure both mean particle size (z averaged) and PDI.
Formulation Code C 1 C2 F0 F1 F2 F3 F4 F5* F6
Formulation Type Solution Solid Lipid Nanoparticles (SLNs) Film Nanoemulsion
Δ8-THC .003 0.014 0.1 0.75 0.75 0.75 0.75 20 0.1
Precirol 3 3 Compritol 3 3 3 Glycerine 2.25 2.25 2.25 2.25 2.25 2.25 Tween 80 0.75 0.75 0.75 0.75 0.75
Poloxamer 188 0.25 0.25 0.25 0.25 0.25 2 RMßCD 2.5 10 3 3
HPMC 4k 0.5 0.5 0.5 0.5 0.5 0.5 0.5 PEO N10 80 IPBS (mL) q.s q.s q.s q.s q.s q.s q.s q.s Oleic Acid 6
Tocopherol 0.02 Soyabean Oil 14
Lipoid E80 1

39
Assay Procedure for the Formulations:
Δ8-THC content in the SLNs and nanoemulsions was assayed according to the following
procedure. An accurately measured amount of the formulation, was extracted in 1 mL of ethanol
and the suspension was centrifuged for 10 minutes. The supernatant was diluted in mobile phase
and was analyzed for Δ8-THC content.
Δ8-THC content in the film was determined by placing the film in 10 mL of acetonitrile
and sonicating for 15 min. The film dissolves completely in acetonitrile. This mixture was
centrifuged at 13000 rpm for 10 min and supernatant was collected. The supernatant was then
analyzed by HPLC. To determine the content uniformity of the film three separate sections from
the same film were analyzed following the same procedure as described above.
Entrapment Efficiency for Solid Lipid Nanoparticles:
Entrapment efficiency was determined using AMICON® Ultra centrifugal filters with a
10000 KDa membrane. A measured amount of formulation was taken and placed in the
centrifugal filter and the sample was spun at 13000 rpm for 30 min, following which the filtrate
was collected and analyzed for free Δ8-THC content. Percentage Δ8-THC entrapped was
calculated using the formula.
% 𝐸𝐸𝐸𝐸𝐸𝐸𝐸𝐸𝐸 = 𝑇𝑇𝑇𝑇𝑇 𝐴𝐴𝑇𝐴𝐴𝑇 𝑇𝑜 𝐷𝐷𝐴𝐷− 𝐹𝐷𝐹𝐹 𝐷𝐷𝐴𝐷𝑇𝑇𝑇𝑇𝑇 𝐴𝐴𝑇𝐴𝐴𝑇 𝑇𝑜 𝐷𝐷𝐴𝐷
𝑋 100

40
In vitro Release from Solid Lipid Nanoparicles:
Slide-A-Lyzer® mini dialysis cassettes (0.5mL; 10k membranes) were used for studying
release. The receiver medium contained a solution of IPBS with 2.5% RMβCD. A volume of 500
µL of the formulation was placed in the cassette. Samples, 1 mL aliquots, were drawn at regular
intervals from the receiver (18mL) which was then immediately replaced with an equal volume
of fresh receiver solution. The samples were analyzed and the percentage drug released was
determined. Experiments were carried out in triplicates.
In vitro Transcorneal Transport Studies:
Corneas were excised from whole rabbit eye globes (Pel-Freez Biologicals; Rogers, AK).
Briefly an incision was made about 2mm from the corneal-scleral junction and the cornea was
excised by cutting radially along the sclera. The excised corneas were immediately mounted on
side by side permeation cells (Permgear Inc, Hellertown, PA) (Figure 4-1). A circulating water
bath was used to maintain the temperature at 34°C during the transport studies. Receiver solution
for all permeability studies consisted of 2.5% RMβCD solution in IPBS with pH adjusted to 7.4.
The volume of the receiver solution was 3.2 mL, 0.2 mL more than the donor to maintain the
natural curvature of the corneas, and the solution in the chamber was stirred continuously using
magnetic stirrers. SLNs and nanoemulsion formulations were diluted in a 2:1 ratio with IPBS to
yield donor solution for these studies. The initial donor concentrations were 1.33mg in the case
of F-0 and F-6, 10mg in the case of F-1, F-2, F-3, and F-4. Aliquots, 600µL, were withdrawn
from the receiver chamber every thirty minutes for three hours and immediately replaced with an

41
equal volume of the receiver solution. Samples were analyzed following the method described in
the analytical methods section. All experiments were carried out in triplicate.
Figure 4-1: Side-by-side diffusion apparatus setup for studying in vitro trans-corneal transport of
Δ8-Tetrahydrocannabinol from solid lipid nanoparticles, nanoemulsion and solution
formulations.

42
In vitro transcorneal flux of Δ8-THC from the matrix film was evaluated by sandwiching
the film (4 mm x 2 mm) in between a Spectra/Por® membrane (MWCO: 10,000 2 Daltons) and
isolated rabbit cornea (Pel-Freez Biologicals; Rogers, AK). Corneas were excised from whole
eye globes, with approximately 1 mm scleral portions remaining for ease of mounting. The
membrane-film-cornea sandwich was then placed in between the side-by-side diffusion cells
with the chamber towards the Spectra/Por® membrane representing the periocular surface and
the chamber towards the cornea representing the aqueous humor (Figure 4-2). The side-by-side
diffusion cells were maintained at 34 °C using a circulating water bath. 2.5% RMβCD in IPBS
(pH 7.4) was used as the receiver medium on both sides. The initial donor concentration was 1.6
mg and aliquots, 600µL, were drawn every thirty minutes for three hours and replaced with an
equal volume of receiver solution. Samples were analyzed following the method described in the
analytical methods section. The experiment was carried out in triplicate.

43
Figure 4-2: Side-by-side diffusion apparatus setup for studying in vitro trans-corneal transport of
Δ8-Tetrahydrocannabinol from film formulation
In vivo Ocular Bioavailability Studies:
Ocular bioavailability of Δ8-THC was evaluated from the solution, SLN and film
formulations, in male New Zealand albino rabbits weighing 2-2.5 Kg. Rabbits were anesthetized
at the start of the experiment using a combination of ketamine (35 mg/kg) and xylazine (3.5
mg/kg) injected intramuscularly and were maintained under anesthesia throughout the
experiment. Fifty microliters (375 µg dose) of the SLNs formulation or a 4x2x2 mm (1.6 mg

44
dose) melt-cast film was instilled/placed topically into the conjunctival cul-de-sac of the rabbits.
At the end of one hour after topical application, the rabbits were euthanized with an overdose of
pentobarbital injected through the marginal ear vein under deep anesthesia. The eye was washed
with ice cold IPBS and immediately enucleated and washed again. The ocular tissues were
separated, weighed and stored at -80oC until further analysis. All experiments were carried out
in triplicate.
Sample Preparation for Analysis:
Standard Solutions:
Stock solutions of Δ8-THC were prepared in acetonitrile. Known quantities of Δ8-THC
from these stock solutions were spiked in blank ocular tissues and allowed to stand for 10
minutes before protein precipitation using ice cold acetonitrile (1:1 ratio for aqueous, vitreous
humor and 1 mL for all the other tissues). The samples were then centrifuged for 15 minutes at
4oC and 13000 rpm and the supernatant was collected. Standard curves were prepared in aqueous
humor (10 ng – 200 ng), vitreous humor (20 ng-200 ng), cornea (20ng-200ng), iris ciliary body
(10ng-200ng), retina choroid (10-200 ng) and sclera (20-200 ng). Propofol was used as the
internal standard during the analysis.

45
Sample Preparation:
Hundred microliters of aqueous humor and 500 microliters of vitreous humor was
collected from each test eye into individual centrifugal tubes. All other tissues, retina-choroid,
iris-ciliary, cornea & sclera, from each test eye were cut into very small pieces and placed into
individual vials. Protein precipitation was carried out similar to the standard solution preparation
and analyzed using the method described below.
Analytical Methods:
Bio-analytical Method for in vivo Samples:
A previously published bio-analytical method [50] using fluorescence detection was
modified and used for analyzing THC content in the ocular tissues. HPLC system comprised of a
Waters 600 pump, Waters 717 plus refrigerated autosampler and Waters 2475 fluorescence
detector, set at an excitation wavelength of 220 nm and Δ8-THC was detected at emission
wavelength of 305 nm. EUFS was set at 150 and gain was set at 30. Phenomenex PFP (2) (5µM,
4.6 x 250 mM) column was used. The mobile phase consisted of 30% water containing 0.5% o-
phosphoric acid and 70% acetonitrile, with a flow of 1mL/min. Injection volume was 50 µL.
Retention time for propofol and THC were 7.0 min and 11.9 min, respectively.
The standard calibration curve was derived and the parameters such as regression
coefficient (r2), slope and Y- intercept were noted to establish the linearity of the method. The

46
analytical method was also validated with respect to precision, accuracy, recovery and specificity.
Limit of detection for Δ8-THC in various ocular tissues was, aqueous humor (5 ng), vitreous
humor (10 ng), cornea (10 ng), iris ciliary body (5 ng), retina choroid (5 ng) and sclera (10 ng) in
the fluorescence method.
HPLC-UV Method for in vitro Samples:
A Previously published Waters HPLC-UV system with a Phenomenex PFP(2) (5 µM, 4.6
x 250 mM) column was used for analysis [63]. The mobile phase consisted of 18% water, 0.75%
acetic acid, 30% Acetonitrile and 52% methanol at a flow rate of 1.2 mL/min. The UV detector
wavelength was set at 226 nm. Injection volume was 25 µl and retention time for THC was 13.1
min.
The standard calibration curve was derived and the parameters such as regression
coefficient (r2), slope and Y- intercept were noted to establish the linearity of the method. The
analytical method was also validated with respect to precision, accuracy, recovery and specificity.
Limit of detection and limit of quantification were found to be 10 ng/mL and 30 ng/mL,
respectively, and the retention time for THC was about 13.1 min. The method was observed to be
specific, precise and reproducible.

47
4.3. Results:
Particle Size and Polydispersity Index of the Formulations:
The particle size and PDI of the SLN and nanoemulsion formulations are as described in
Table 4-3.
Assay of the Various Formulations:
Δ8-THC content in all the formulations ranged between 95 to 104%.
Entrapment Efficiency (EE) of the Solid Lipid Nanoparticles:
The degree of entrapment varied in each formulation with highest EE shown by F-2,
(92.5%), followed by F-1 (89.6%), F-4 (85.7%) and F-3 (82.4%).
In vitro Release from the Solid Lipid Nanoparticles:
Δ8-THC release was studied from F-1 and F-2 formulations in vitro. Similar release
profiles were observed from both formulations till the end of 12 hours (f2 > 50), as shown in
Figure 4-3.

48
Figure 4-3: Release profiles of Δ8-Tetrahydrocannabinol from solid lipid nanoparticles (F1 and
F2) using Slide-A-Lyzer® mini dialysis cassettes. Data represents mean±SD (n=3).
In vitro Transcorneal Transport:
Flux values across corneas were calculated for all the formulations (Table 4-3 & Figure 4-
4). The control (C-1) and film (F-5) formulations depicted higher flux in comparison to
nanoemulsion (F-6) and SLN (F-0) formulations. Increasing the drug load from 0.1% to 0.75% in
F-2, F-3 & F-4 resulted in several folds increase in the flux.
0
10
20
30
40
50
60
70
80
90
100
0 2 4 6 8 10 12 14
% T
HC R
elea
sed
Time(h)
THC SLNs with Precirol THC SLNs with Compritol

49
Figure 4-4: Permeability and flux of Δ8-Tetrahydrocannabinol across isolated rabbit corneas from
various formulations. Data represents mean±SD (n=3).
Table 4-3: Particle size characterization & transcorneal Δ8-Tetrahydrocannabinol flux from
various formulations. Transcorneal flux determined using side-by-side diffusion apparatus at
34oC. Data represents mean±SD (n=3)
14.6
0.32 2.03 2.29 2.62
1.8 0.92
0.25
0.014 0.17
0.21 0.23 0.21
0.02
0
2
4
6
8
10
12
14
16
18
C-1 F-0 F-2 F-3 F-4 F-5 F-6
Perm
eabi
lity
x 10
6 cm
/sec
; Flu
x (µ
g/m
in/c
m2
Permeability Flux

50
Code Formulation Particle Size (nm)
Polydispersity Index
Flux Across Isolated Corneas (µg/min/cm2)
Control 1 THC in 2.5% RMßCD
- - 0.25 ± 0.02
F-0 SLNs with
Compritol - 0.1% Load)
495 0.39 0.014 ± 0.005
F-2 SLNs with
Compritol -0.75% Load
390 0.32 0.17 ± 0.04
F-3
SLNs with Compritol &
RMßCD in Aqueous Phase -
0.75% Load
395 0.34 0.21 ± 0.009
F-4
SLNs with Compritol &
RMßCD Complexed with THC- 0.75% Load
410 0.34 0.23 ± 0.01
F-5 Film - - 0.21 ± 0.05
F-6 Nanoemulsion 237 0.28 0.02 ± 0.001
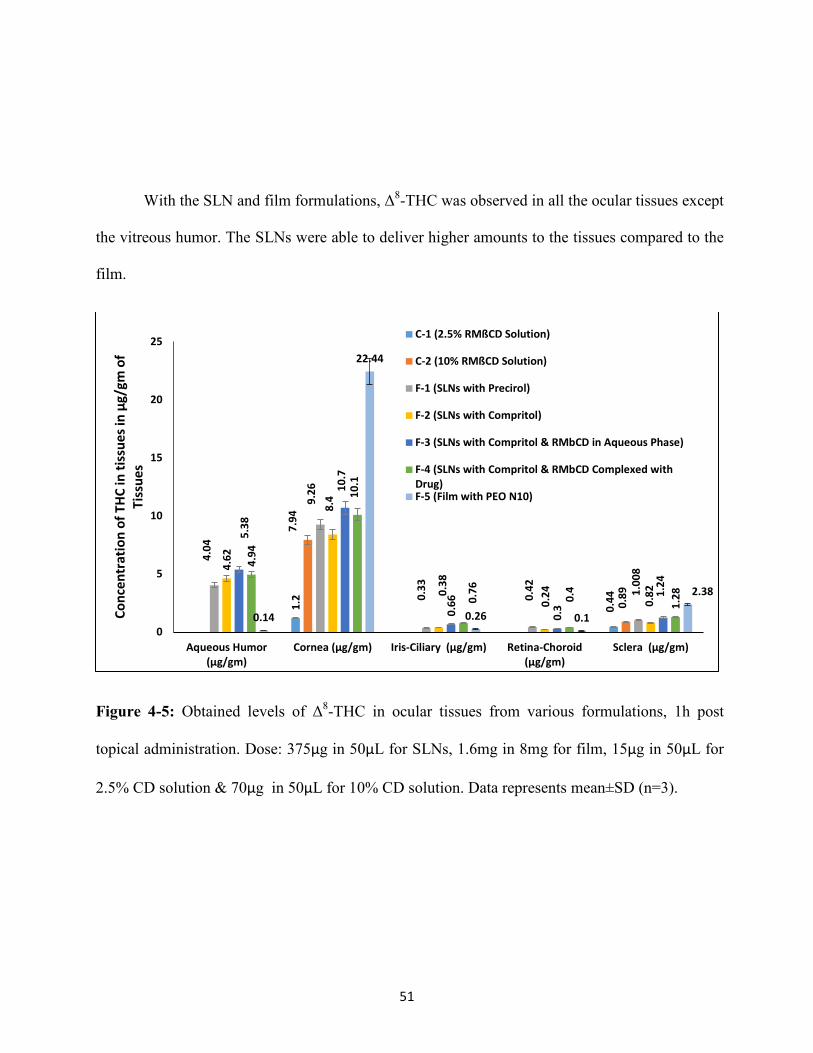
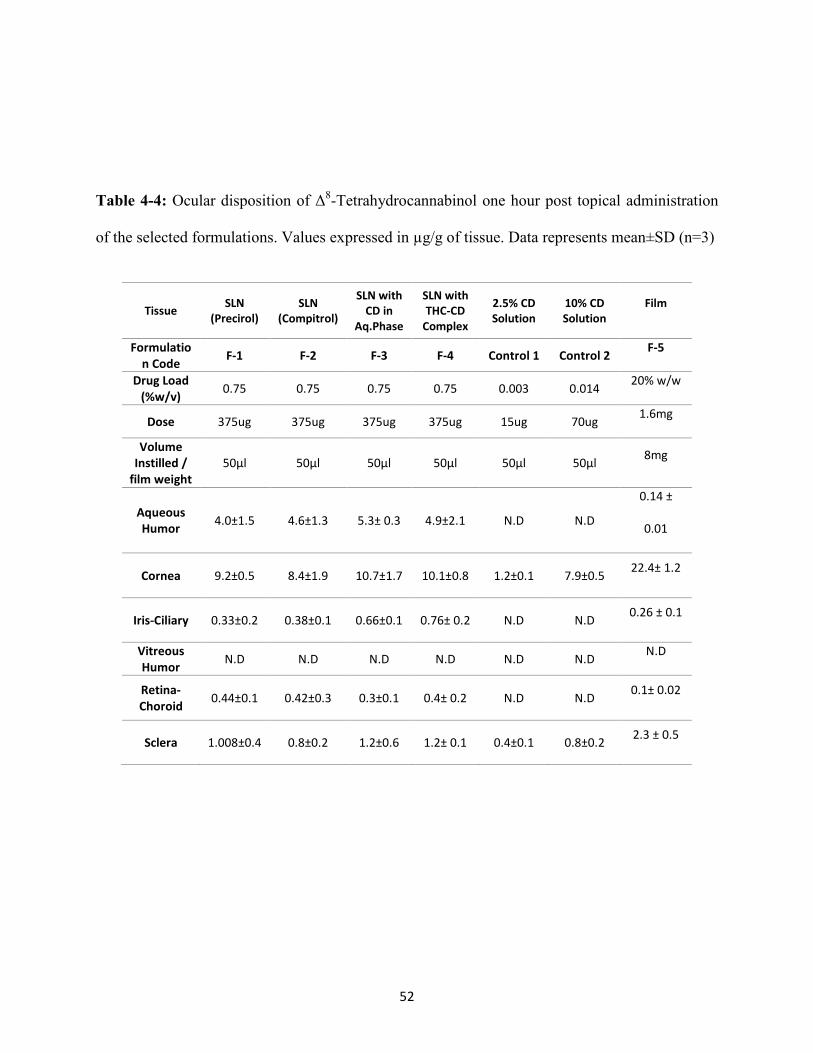
In vivo Ocular Bioavailability:
The Δ8-THC levels in various ocular tissues, from the above formulations, one hour post
topical administration, are illustrated in Table 4-4 and Figure 4-5. Δ8-THC formulated in RMßCD
solutions (2.5% and 10%), which served as controls, did not show any detectable levels in the
aqueous humor, vitreous humor, iris ciliary and retina-choroid. Cornea and sclera on the other
hand showed significant Δ8-THC accumulation levels.
51
With the SLN and film formulations, Δ8-THC was observed in all the ocular tissues except
the vitreous humor. The SLNs were able to deliver higher amounts to the tissues compared to the
film.
Figure 4-5: Obtained levels of Δ8-THC in ocular tissues from various formulations, 1h post
topical administration. Dose: 375µg in 50µL for SLNs, 1.6mg in 8mg for film, 15µg in 50µL for
2.5% CD solution & 70µg in 50µL for 10% CD solution. Data represents mean±SD (n=3).
1.2
0.44
7.94
0.89
4.04
9.26
0.33
0.42
1.00
8 4.62
8.4
0.38
0.24
0.82
5.38
10.7
0.66
0.3
1.24
4.94
10.1
0.76
0.4
1.28
0.14
22.44
0.26 0.1
2.38
0
5
10
15
20
25
Aqueous Humor(µg/gm)
Cornea (µg/gm) Iris-Ciliary (µg/gm) Retina-Choroid(µg/gm)
Sclera (µg/gm)
Conc
entr
atio
n of
THC
in ti
ssue
s in
µg/g
m o
f Ti
ssue
s
C-1 (2.5% RMßCD Solution)
C-2 (10% RMßCD Solution)
F-1 (SLNs with Precirol)
F-2 (SLNs with Compritol)
F-3 (SLNs with Compritol & RMbCD in Aqueous Phase)
F-4 (SLNs with Compritol & RMbCD Complexed withDrug)F-5 (Film with PEO N10)
52
Table 4-4: Ocular disposition of Δ8-Tetrahydrocannabinol one hour post topical administration
of the selected formulations. Values expressed in µg/g of tissue. Data represents mean±SD (n=3)
Tissue SLN (Precirol)
SLN (Compitrol)
SLN with CD in
Aq.Phase
SLN with THC-CD
Complex
2.5% CD Solution
10% CD Solution
Film
Formulation Code F-1 F-2 F-3 F-4 Control 1 Control 2 F-5
Drug Load (%w/v) 0.75 0.75 0.75 0.75 0.003 0.014 20% w/w
Dose 375ug 375ug 375ug 375ug 15ug 70ug 1.6mg
Volume Instilled /
film weight 50µl 50µl 50µl 50µl 50µl 50µl 8mg
Aqueous Humor 4.0±1.5 4.6±1.3 5.3± 0.3 4.9±2.1 N.D N.D
0.14 ±
0.01
Cornea 9.2±0.5 8.4±1.9 10.7±1.7 10.1±0.8 1.2±0.1 7.9±0.5 22.4± 1.2
Iris-Ciliary 0.33±0.2 0.38±0.1 0.66±0.1 0.76± 0.2 N.D N.D 0.26 ± 0.1
Vitreous Humor N.D N.D N.D N.D N.D N.D N.D
Retina-Choroid 0.44±0.1 0.42±0.3 0.3±0.1 0.4± 0.2 N.D N.D 0.1± 0.02
Sclera 1.008±0.4 0.8±0.2 1.2±0.6 1.2± 0.1 0.4±0.1 0.8±0.2 2.3 ± 0.5

53
4.4. Discussion:
Evidence of reduction in IOP through marijuana smoking, a phenomenon that has been
studied and reported as early as in the 70s [64], was not concrete enough to underline the utility of
cannabinoids in glaucoma therapy. Variation in the therapeutic outcome of cannabinoid therapy
was the main reason for this. Previous reports have shown the ability of the relatively hydrophilic
prodrug of Δ9-THC to reach into the iris-ciliary bodies, though no drug was seen to reach the
retina choroid [49, 50]. The micellar solutions of the parent Δ9-THC on the other hand could not
penetrate the surface tissues such as the cornea and sclera, highlighting the innate inability of the
highly lipophilic molecule to permeate across the surface layers. Thus, either hydrophilic prodrug
derivatization or design of formulation approaches which enhance ocular penetration will be
needed for lipophilic therapeutic agents intended for topical ophthalmic application.
Δ8-THC, being a highly lipophilic compound, like Δ9-THC, poses significant challenges in
its delivery across the eye into the deeper ocular tissues. Therefore, in this study we have utilized
SLNs and films for improving the ocular penetration of Δ8-THC through the topical route. Initial
in vitro transcorneal transport studies of the formulations was a comparison between C-1 (2.5%
RMβCD solution), F-0 (SLNs with Compritol®), F-5 (Film) & F-6 (Nanoemulsion).The control
formulation in 2.5% RMβCD solution showed the highest flux in this study, followed by the film.
Nanoemulsion and SLNs on the other hand were not as good comparatively. The lower ability of
the lipid based system, in particular the SLNs, to deliver more drug across the cornea could be

54
because of the preference of Δ8-THC for the lipids, lack of lipases in the experimental set-up,
decreased or absence of phagocytic uptake by the epithelial cells, low drug content in the SLNs
(low Δ8-THC to lipid ratio). Moreover, the side-bi-side diffusion apparatus may not be a good
system to study transcorneal flux from particulate systems because contact profile in vivo in the
conjunctival sac would be different from the side-bi-side apparatus. A vertical diffusion apparatus
may be more appropriate. Formulations F-2 (SLNs with Compritol®), F-3 (SLNs with RMβCD in
the aqueous phase) and F-4 (SLNs with RMβCD complexed with the drug) had a drug load of
0.75%, as opposed to 0.1% in F-0. Significant improvement in flux, 12-16 fold increase, was
observed. The nanoemulsion was not a part of this study due to poor physical stability of the
formulation at room temperature.
In order to test the effect of lipid on SLN release characteristics, two formulations were
studied - one with Precirol ® as the lipid (F-1) and the other with Compritrol ® (F-2). The
formulations were similar in all other aspects. In vitro drug release profiles of both these
formulations were not very different, with the drug being released at almost similar rates (f2 > 50)
from both formulations. Both formulations showed good characteristics in terms of their size, PDI
and entrapment efficiencies (Table 3.3).
In vivo, with the cyclodextrin solutions (C-1 & C-2), at the end of 1h post administration
Δ8-THC content was undetectable in all the tissues tested, with the exception of the cornea and
sclera. Cyclodextrins have been documented to enhance solubility and ocular bioavailability of
various drugs such as diclofenac, dexamethasone, and hydrocortisone [65-67]. Although RMßCD
55
enhanced the aqueous solubility of Δ8-THC and the solution showed comparatively higher
transcorneal flux in vitro, an increased penetration was not seen in vivo. This can be attributed to
the lipophilic Δ8-THC getting entrapped in the corneal and scleral membranes and not penetrating
into the deeper tissues. The 10% solution only resulted in a higher amount of Δ8-THC
accumulating in the cornea and sclera in comparison to the 2.5% solution, showing the inability of
the solution formulation in delivering Δ8-THC to deeper tissues. Also, the comparatively lower
instilled doses due to limited solubility, lower viscosity in comparison to the SLNs, leading to
pre-corneal loss, could be some other factors.
Ocular inserts were reported as early as 1978 when Bloomfield et al suggested the use of
collagen shields for delivery of gentamycin [68]. Since then, a number of reports using these
invasive techniques have appeared for various other drugs such as diclofenac sodium, cyclosporin
A, dexamethasone, pilocarpine etc [69-73]. While ocular inserts were effective in improving the
bioavailability of the tested drugs, the fact they are required to be either surgically implanted or
removed after a certain period of time makes them unattractive. In contrast, a topical film which
gels on application, thereby providing a prolonged release platform and then ultimately dissolving
in the tear fluid appears to be a more convenient system. Moreover, the melt cast method
eliminates any concerns regarding the toxic effects of residual solvents associated with solvent
cast films preparation technique and was found to be successful in producing films that had good
physical characteristics. The process was fast and reproducible and the films produced were able
to deliver the drug to the deeper ocular tissues. The formulation gelled in the tear fluid within 30-
40 seconds on application and stayed in contact with the corneal surface. No irritation of ocular

56
surface was observed and due to the higher residence time, it allowed the drug to permeate
through cornea and was also able to deliver the drug into the retina-choroid. The ocular tissue
concentrations obtained suggest involvement of the conjunctival-scleral diffusional pathway.
Nonetheless, the observed Δ8-THC levels from the film were much lower compared to that
observed with the SLNs. This can be attributed to the fact that even though the film was able to
achieve a longer residence time and sustained release, it had no effect on the inherent
transmembrane permeability characteristics of Δ8-THC. As a result, Δ8-THC efficiently
partitioned from the formulation into the corneal and scleral membranes but could not diffuse any
further.
The SLNs, in contrast, were able to deliver a higher amount of Δ8-THC to all ocular
tissues, except vitreous humor. Formulations F-1 & F-2, made with Precirol® and Compritol®,
respectively, were very similar to each other. The observed Δ8-THC levels in the ocular tissues,
particularly the retina-choroid, may be due to an uptake of these nanoparticles by the conjunctival
and corneal membranes, as suggested in earlier studies[56]. The advantages of SLNs and their
utility in delivering a host of drugs such as ibuprofen, flurbiprofen, cyclosporine A, rapamycin,
gatifloxacin, indomethacin etc. has been tested and published before [55, 57, 58, 61, 74-81].
While most of the observations in these earlier reports have been made at in vitro and ex vivo
studies, only a handful of the studies reported improved in vivo bioavailability and that too only to
the anterior chamber delivery.

57
The efficacy of SLNs in posterior segment delivery, post topical administration, to our
knowledge, has not been reported elsewhere and the results from this study are very encouraging.
At almost a fifth of the dose, compared to the matrix film formulation, the SLNs were able to
generate ocular concentrations significantly greater than that obtained with the film formulation in
the deeper ocular tissues such as the aqueous humor, retina-choroid and iris-ciliary bodies.
Incorporation of cyclodextrins into the SLN formulations (F-3 & F-4) did not improve ocular
penetration of Δ8-THC.
4.5. Conclusion:
The SLN formulations hold great potential in the delivery of lipophilic compounds, such
as Δ8-THC, to the deeper ocular tissues. Other formulations such as solution or film delivery
systems depend on the physico-chemical characteristics of the agent to diffuse across the tissues.
The SLNs on the other hand probably penetrate the tissues on their own to a certain extent and
deliver the drug into the deeper ocular tissues.

58
CHAPTER 5
PHYSICOCHEMICAL CHARACTERIZATION AND ORAL
BIOAVAILABILITY EVALUATION OF A NOVEL DIHYDROARTEMISININ
DIMER PRODRUG: THE DIMER OXIME
59
5.1. Introduction:
Malaria is a very serious mosquito borne infectious disease that affects millions of people
worldwide. According to the CDC, around 3.4 billion people worldwide are at risk of malarial
transmission [82]. The WHO, in 2013, reported around 190 million cases with more than half a
million of them resulting in deaths [83]. Though this disease was eliminated in the US by the
early 1950s, it is a still a problem in other parts of the world, especially in the sub-Saharan parts
of Africa where more than 80% of the global malarial deaths occur. Even in the US, about 2000
cases are diagnosed every year [84, 85] and majority of these cases are immigrants or tourists
coming in or returning from endemic countries [84, 86].
Pathologically, malaria is caused by different species of Plasmodium parasites, such as
falciparum, vivax, ovale, malariae, knowlesi etc. The successive infection of two hosts by these
parasites results in the disease’s transmission. One of the hosts is the female anopheles mosquito
while the other is a human. Of all the above mentioned species, falciparum is more popular in
the malaria caused in human beings [87]. Inside the human body, the parasite undergoes its
“asexual cycle” where it attacks and then multiplies in the liver cells and then moves onto the red
blood cells. Upon division inside the RBCs, the parasites burst the cell open and start invading
neighboring RBC cells for further multiplication. The stage inside the RBC is called the
“merozoite” stage of the parasite’s life cycle and this is what causes the symptoms of malaria.
From here the merzoites are ingested by the anopheles mosquito when it takes a bite on the

60
human host and then, after approximately 10-18 days, the parasites’ cycle (sexual) inside the
mosquito is completed at the end of which they start residing in its salivary glands. When this
mosquito feeds next time on a human, the parasite is transferred into a new host and once again
starts its cycle by attacking the liver cells [88].
During the merozoite phase, various symptoms such as fever, chills, sweats, malaise etc
are seen in patients, while the more severe form of malaria would cause seizures, impairment of
consciousness, acute kidney failure, respiratory distress, hypoglycemia [89] etc. Numerous drugs
such as pyrimethamine, mefloquine, primaquine, chloroquine, progaunil, atovaquone are
available to counter this disease [90, 91], but due to the parasite’s multidrug resistance [92], the
disease keeps recurring.
Artemisinin, the active constituent of Artemisia annua L. was first identified during the
Vietnam War. Advantages of artemisinin over the other compounds include rapid activity, low
toxicity, short fever clearance time, and wide spectrum of activity across various stages of the
parasite’s cycle in the body, higher efficacy [93]. Disadvantages of this compound includes short
half-lives which results in fever recurrence when administered by itself. Artemisinin
monotherapy was banned by WHO in 2006 and currently, combination therapies exist [94]. Also,
a number of side effects from this compound exist, due to higher and frequent dosing [95-97].
Inside the body, post dosing, artemisinin breaks down into its derivatives such as
artemether, arteether, artesunate, artenimol also known as dihydroartemisinin (DHA). Of these,
DHA is the most important metabolite for exerting the anti-malarial activity [98, 99]. Its short

61
half-life is advantageous as it theoretically reduces the risk of the parasites developing resistance,
while the disadvantage would be fever recurrence, as mentioned above, due to short half-life.
The mechanism of action of artemisinins is different from the other classes of anti-
malarial compounds. The peroxide ring within the trioxane system is crucial for its activity
[100]. Some of the artemisinins have a carbon in the place of the peroxidic oxygen and these are
devoid of any activity [101]. Compounds like DHA on the other hand have the oxygen intact and
execute anti-malarial action. It has been suggested that the reactive peroxides act inside the
parasitized RBCs, cause oxidative stress and cause haemolysis [102].
From a formulation standpoint, the limitations with artemisinin and its endoperoxide
group of compounds has always been their poor solubility and bioavailability [103, 104].
Therefore, for this study, we have synthesized a DHA dimer and attached a nitrogen group into
the linker with the hope of overcoming these obstacles (Patent number EP1753419A1).
The novel DHA dimer prodrug, dimer oxime (DO), will be utilized in this project, and
studies will be carried out to elucidate its physicochemical characteristics such as solubility in
buffer and surfactant solutions, stability, metabolic profile & thermal profile. Based on the
results from these preformulation studies, DO will be incorporated into various formulation
platforms and they will be used to study the in vitro intestinal permeation characteristics of the
compound. Finally, the oral bioavailability of the DO through all these formulations will be
evaluated.

62
Using surfactant systems for enhancing solubility and permeability has been extensively
documented[30]. Edwards et al reported improved solubilization of aromatic hydrocarbons
using nonionic surfactants [105], Chiou et al reported and discussed the usefulness of these
systems in their study where the solubility and dissolution of chloramphenicol and prednisolone
was enhanced [106]. Along with these, there have also been plenty of reports with surfactants as
additives in particulate systems and dispersions for similar purposes [107-109]. Similarly, lipid
based systems have also been reported extensively for their versatility as carriers for a host of
compounds and improving their bioavailability. The ability of lipids to promote absorption of
active moieties was proven as early as 1987 [110]. The mechanism of bioavailability
enhancement by the lipid systems is mainly owed to their adhesiveness to physiological
membranes and absorption enhancing effect [111]. Also, lipids with a fatty acid chain length of
C-14 to C-18 are reported to enhance and promote lymphatic uptake [112-114] and this aspect
would be very useful as it helps avoid first pass metabolism [112]. Yang et al studied the
bioavailability enhancement of campothecin using SLNs prepared using stearic acid and reported
significant increase of total campothecin delivered to brain after oral administration [115], while
Chen et al reported improved bioavailability (4%-13%) of lovastatin using precirol and squalene
based NLCs [116]. Nepal et al evaluated the efficacy of Witepsol based SNEDDS in the oral
delivery of coenzyme Q10 and reported 4-5 fold increase in absorption[117]. Studies and reports
similar to these made by various other research groups also validate the efficacy of SLNs, NLCs,
SNEDDS in improving the oral bioavailability of various classes of compounds [118-129].
63
Therefore, all these platforms will be utilized to evaluate the oral bioavailability of the
DO. The formulations will be compared against each other, in vivo, through plasma profile
elucidation, post oral administration. Also, the compound’s intravenous (IV) and intraperitoneal
(IP) profiles will be studied in order to gauge its clearance from the body.
A basic understanding regarding the properties and behavior of DO, both in vitro and in
vivo, would aid in potentially developing a new line compounds for efficient therapy against
malaria.
5.2. Materials & Methods:
Materials:
Compritol® ATO 888, precirol® ATO 5, capryol® 90, transcutol® P, labrafil M® 1944,
gelucire® 50/13, labrasol®, labrafac lipophile®, lauroglycol® were gift samples from Gattefosse,
France. Poloxamer® 407, kolliphor® EL were obtained from BASF, Chattanoga, TN. Randomly
methylated beta cyclodextrin, polyethylene Glycol 400, oleylamine, chitosan chloride, tween®
80, propylene glycol were purchased from Sigma (St. Louis, MO). Avicel® RC591 was a gift
from FMC biopolymer (Philadelphia, PA). All other chemicals were purchased from Fisher
Scientific (St. Louis, MO). Solvents used for analysis were of HPLC grade.

64
Animal Tissues:
Whole small intestines of male Sprague Dawley rats were purchased from Charles River
(Wilmington, MA). Intestines, perfused with saline were shipped fresh overnight over cool
packs. Segments were isolated and used immediately on receipt.
Animals:
Male Sprague-Dawley rats (200-250g) were procured from Harlan Labs (Indianapolis,
IN). Animal experiments conformed to the tenets of the Association for Research in Vision and
Ophthalmology statement on the Use of Animals in Ophthalmic and Vision Research and
followed the University of Mississippi Institutional Animal Care and Use committee approved
protocols.
Differential Scanning Calorimetry:
DSC thermograms for pure dimer was collected using a Diamond Differential Scanning
Calorimeter (Perkin-Elmer® Life and Analytical Sciences).The samples were weighed and
sealed in aluminum pans and were heated from 0oC to 270oC at a heating rate of 10oC/min under
nitrogen purge (20 mL/min).
Hot Stage Microscopy:
Hot stage microscopy under polarized light was conducted on a hot-stage (FTIR 600,
Linkam Technologies & Agilent Technologies Cary 620 IR microscope) to observe
morphological changes in the API as a function temperature.

65
Solubility Studies:
pH Dependent Solubility:
Solubility of dimer oxime in various buffers, 1.2, 4.5, 6.8, 7.4, 8.0, was evaluated by
adding 1mg of the same into respective 1mL buffer which was equilibrated for 24h on a
reciprocating water bath at 25oC. At the end of shaking, the vials were centrifuged and the
supernatant was analyzed for the solubilized drug content. Experiment was carried out in
triplicate.
Solubility in Surfactants & Cyclodextrins:
Solubility of dimer oxime in 5% surfactant solutions of poloxamer 188, poloxamer 407,
tween 80, cremophor EL & sodium lauryl sulfate was evaluated by adding 1mg of the same into
1mL of respective surfactant solutions. The vials were then allowed to equilibrate for 24h on a
reciprocating water bath at 25oC. At the end of shaking, the vials were centrifuged and the
supernatant was analyzed for the solubilized drug content. Experiment was carried out in
triplicate.
Cyclodextrin (CD) solubility was evaluated in 5% and 10% solutions of hydroxypropyl β
cyclodextrin (HPβCD) and randomly methylated β cyclodextrin (RMβCD). 1mg of the dimer
oxime was added to 1mL of respective CD solutions and was allowed to equilibrate for 24h on a
reciprocating water bath at 25oC. At the end of shaking, the vials were centrifuged and the

66
supernatant was analyzed for the solubilized drug content. Experiment was carried out in
triplicate.
Stability Studies:
Stability of dimer oxime was evaluated in mixtures of water-acetonitrile, acetonitrile-
simulated intestinal fluid (SIF) and acetonitrile-simulated gastric fluid (SGF). Briefly, known
amount of drug was spiked in 50:50 and 60:40 mixtures of the above combinations and sampling
was done at 0, 6, 12, 24 hours and analyzed for amount of drug remaining. Experiment was
carried out in triplicate.
Metabolic Stability Studies:
Metabolic stability of dimer oxime was evaluated in whole rat liver homogenates.
Briefly, the whole liver was cut into small pieces and then homogenized in 10 mL DPBS using a
tissue-mizer. To one mL of this homogenate, 5 mL of Bradford reagent was added and was
allowed to stand for 5 minutes before being analyzed for protein content in a UV/VIS
spectrophotometer (standard curve prepared using a protein standard set). Once the
concentration was determined, the study was performed at an initial drug concentration of
25µg/mL and a liver protein concentration of 1 mg/mL. NADPH was supplied through a
regenerating system consisting of NADP+, glucose-6-phosphate, glucose-6-phosphate
dehydrogenase, magnesium chloride.

67
The mixture was incubated at 37oC and at each time point, 1 mL was sampled and
reaction was terminated using ice cold acetonitrile, followed by storing at -20OC for 15 minutes.
At the end of which, it was centrifuged at 4oC & 13,000rpm for 30 minutes. The supernatant was
then analyzed for remaining drug content. Verapamil hydrochloride was used as the positive
control in this study for validating the viability of the liver homogenates and the NADPH
regenerating system.
Formulation Development:
Solution Containing Dimer Oxime:
Solution formulation containing the dimer oxime was prepared by weighing an accurate
amount of dimer oxime, dissolving it in ethanol. In a separate vial, cremophor EL was dissolved
in water and stirred until the solution was clear. Then, the aqueous phase was added to organic
phase and kept overnight for stirring till a clear solution was obtained.
A second solution formulation was prepared to achieve a higher drug loading. Briefly, the
dimer oxime was first dissolved in ethanol. Once a clear solution was obtained, tween 80 was
added to this mixture followed by equal amounts of PEG 400 and water. The mixture was kept
stirring until a clear solution was obtained.
Nano-lipid Carriers Containing Dimer Oxime:
Nano-lipid carriers (NLCs) were prepared using a high speed homogenization followed
by ultra-sonication method. Dimer was accurately weighed and melted along with Precirol®

68
ATO 5 & Capryol® 90 (Gattefosse, France) to obtain a clear lipid phase. An aqueous phase
containing Gelucire® 50/13 in distilled water, was heated and added to the melted lipid phase
under stirring. A coarse emulsion from this pre-mix was formed using an Ultra-Turrax® operated
at 16000 rpm for 5 minutes, followed by sonication for 6 minutes. This resulted in a fine
emulsion which was slowly cooled to room temperature to form dimer oxime NLCs.
A second NLC formulation was prepared with Gelucire® 50/13 in lipid phase where it
was melted along with the dimer and other components of the lipid phase and the aqueous phase
consisted of only distilled water.
Self-Nanoemulsifying Drug Delivery Systems Containing Dimer Oxime:
Self-Nanoemulsifying Drug Delivery Systems (SNEDDS) were prepared by the
following method. An accurately weighed amount of dimer oxime was dissolved in Labrafac
Lipophile and stirred until a clear solution was obtained. In a separate vial, accurately measured
amounts of Cremophor EL, Labrasol, Lauroglycol, Labrafil 1944 were dissolved in to Transcutol
P and stirred until a aqueous phase was obtained. Now, the aqueous phase was added to the lipid
phase under constant stirring. The formulation at the end was visually inspected for clarity. For
evaluating the emulsion forming capability, a measured amount was added to 20mL water and
visual inspection was made followed by particle size measurement.
Alternately a surface charge modified formulation was prepared using the same method
with Oleylamine as charge inducer added to the lipid phase.
69
Solid Lipid Nanoparticles Containing Dimer Oxime:
Solid lipid nanoparticles (SLNs) were prepared as per previously established protocols,
using a high speed & high pressure homogenization method [129]. Dimer oxime was accurately
weighed and melted along with Compritol® 888 ATO or Labrafil® 1944M (Gattefosse, France)
to obtain a clear lipid phase. An aqueous phase containing Poloxamer® 407, propylene glycol
and tween 80 in distilled water, was heated and added to the melted lipid phase under stirring. A
coarse emulsion from this pre-mix was formed using an Ultra-Turrax® operated at 16000 rpm for
10 minutes, followed by high pressure homogenization at 15000 psi for 5 minutes. The
temperature during this entire process was maintained at 60°C. The hot emulsion was slowly
cooled to room temperature to form dimer oxime SLNs.
A second SLN formulation was prepared, where the surface the particles were modified
by adding chitosan chloride to the aqueous phase along with distilled water and other surfactants.
A procedure similar to the above was followed to fabricate these nanoparticles.
Suspension Containing Dimer Oxime:
Suspension formulation was prepared with half of the dimer oxime dispersed in a
Cremophor® EL, Avicel® RC 591 & water vehicle and other half dissolved in ethanol and
added to the suspension. Briefly, an accurately amount of cremophor and avicel were dissolved
in water. Half of the dimer was dispersed in this using an Ultra-Turrax and the other half of
dimer was dissolved in ethanol and added to the suspension. Composition of all the above
formulations is detailed in table 5-1.

70
Table 5-1: Composition of the Various Dimer Oxime Formulations
Dimer Oxime Formulation
Code F1 F2 F3 F4 F5 F6 F7 F8 F9 F10 F11
Type Solution NLC SNEDDS Charged SNEDDS
SLN IV SLN with Chitosan
Suspension IP Solution NLC
Units % w/v %w/v %w/w %w/w %w/w %w/v %w/w %w/w %w/v %w/v %w/v Dimer (%) 0.5 0.5 2.5 2.5 1 0.4 1 1 0.1 1 1
Dose (mg/Kg)
50 50 50 50 50 4 50 50 3 50 50
Dosing Volume
(mL)
2.5 2.5 2.5 2.2 1.25 0.25 1.25 1.25 0.75 1.25 1.25
Ethanol 190 10 10 5 10 10 Cremophor
EL 10 15 15 10 10 10
Capryol 90 2 2 Precirol ATO 5
2 2
Compritol 888 ATO
2 2
Gelucire 50/13
2 2
Oleylamine 5 Labrafac Lipophile
12.5 12.5
Labrasol 15 15 Lauroglycol 10 10 Transcutol 30 30
Labrafil 1944M
10 10 1 1
Propylene Glycol
2.5 2.5
Tween 80 0.7 0.7 15 Poloxamer
407 0.25 0.25
Chitosan Chloride
0.5
Avicel RC591
2
PEG 400 37.5 Water 80 q.s q.s 80 q.s q.s 80 37.5 q.s
*NLC: Nano lipid carriers; SNEDDS: Self Nano-emulsifying drug delivery systems; SLN: Solid lipid nanoparticles; SLNC: Solid lipid nanoparticles with Chitosan; IV: Intravenous; IP: Intraperitoneal

71
Determination of Particle Size and Polydispersity Index:
Particle size and Polydispersity Index (PDI) of the SLNs, NLCs and SNEDDS
formulations were measured using a dynamic light scattering instrument, Zetasizer Nano ZS
(Malvern Instruments Inc., Westbrough, MA), at 25 °C. A high concentration zeta cell was used
to measure both mean particle size (z averaged) and PDI.
Assay Procedure for the Formulations:
Dimer oxime content in the SLNs, NLCs, SNEDDS and suspension was assayed
according to the following procedure. An accurately measured amount of the formulation was
extracted in 1 mL of ethanol and was centrifuged for 10 minutes. The supernatant was diluted in
mobile phase and was analyzed for dimer oxime content.
In vitro Intestinal Permeability Studies:
In vitro permeability of the dimer oxime across small intestinal segments of rats was
carried out using the everted gut sac technique [130] (Fig. 5-1). Briefly, duodenum, jejunum and
ileum segments were measured and cut from the whole small intestines. The segments were
flushed with Tween 80 solution to remove fat bodies. One end of each segment was sutured and
formulation (1mL) was filled, following which the other end was also tied up. These sacs were
suspended in vials containing 9mL of 10% RMβCD solutions and were placed in a water bath set
at 37 degrees Celsius. Samples (0.5mL) were withdrawn every 30 minutes for 3 hours and

72
analyzed. The initial donor concentration was 2mg/mL per sac. For the purpose of this study,
three formulations, a solution, nano lipid carriers and self-emulsifying systems, were used and
the permeability of dimer oxime from these formulations was tested. The SNEDDS were diluted
with IPBS to achieve the predetermined donor concentration.
Figure 5-1: Scheme for In Vitro Permeability using Everted Gut Sac Technique
In vivo Bioavailability Studies:
Oral bioavailability of dimer oxime through the above formulations was tested in male
Sprague-Dawley rats. Studies were carried out as per the protocol approved by the Institutional
animal care and use committee (IACUC), University of Mississippi. Rats were fasted overnight,
but were allowed water ad libitum and were divided into groups of four. A single dose of the
Everting the Sac
Flushing the sacs with IPBS & Tween 80 Solution Followed by Fomulation Filling
Dissecting 10cm Segments
Suspending the Sac in the Receiver Medium Post Ligation
Incubation at 37o C Sac Retrieval at the End for
Remaining Drug Concentration

73
formulations was administered orally by gavage (50mg/kg dose) or intravenously (4 mg/kg dose)
through the catheter or intra-peritoneally (3mg/kg dose). Samples (200µL) were drawn through
the jugular vein at pre-determined time points. Heparinized saline (200 IU/ml) was injected
through the jugular vein following sampling to maintain patency and a constant blood volume.
The samples were centrifuged at 9000 rpm at 4oC for 3 minutes and the separated plasma stored
at -80oC, was then analyzed for drug content. At the end of an experiment animals were
euthanized by an overdose of pentobarbital injected into the jugular vein.
Analytical Method:
HPLC-ELSD Method for in vitro Samples:
Analysis of all the in vitro samples was carried out using a HPLC coupled with an
evaporative light scattering detector (ELSD). The system comprised of a Waters 2695
autosampler and Waters 2424 evaporative light scattering detector (ELSD). Phenomenex
Synergi™ 4 µm Max-RP 80 Å, LC Column 100 x 4.6 mm column was used. The Drift tube in
the detector was set at 50oC and nebulizer was set in the heating mode with 0% power level. The
mobile phase consisted of 20% water containing and 80% acetonitrile, with a flow of 1mL/min.
Injection volume was 20 µL.
The standard calibration curve was derived and the parameters such as regression
coefficient (r2), slope and Y- intercept were noted to establish the linearity of the method. The
analytical method was also validated with respect to precision, accuracy, recovery and specificity.
Limit of detection and limit of quantification were found to be 500ng/mL and 1mg/mL,

74
respectively, and the retention time for THC was about 13.1 min. The method was observed to be
specific, precise and reproducible.
5.3. Results:
Differential Scanning Calorimetry:
Pure dimer oxime was tested and the results showed that the drug recrystallizes at 116oC
and degrades at 160oC. The recrystallization was validated through hot stage microscopy. The
resulting thermogram is shown in figure 5-2.

75
Figure 5-2: Thermal Profile of DHA Dimer Oxime using a Differential Scanning Calorimeter.
Hot Stage Microscopy:
Images from the hot stage microscopy depicted the melting, recrystallization and
degradation characteristics of the compound. It was seen that at room temperature, the compound

76
is a mirror like crystal. Upon heating, the compound started melting at 90oC and as the
temperature was increased gradually at a rate of 2oC per minute, recrystallization was observed
at 116oC. Upon holding at this temperature for 10 minutes, crystal growth was observed. Upon
further increase, these crystals also started melting above 120oC and a color change (degradation)
was observed above 150oC in accordance with the results observed on DSC.
Solubility Studies:
pH Dependent Solubility:
The solubility of dimer oxime across various pH was seen to be less than 1mg/ml as
shown in table 5-2.
Table 5-2: Solubility of Dimer Oxime in Various Buffers. Data represents mean±SD (n=3).
pH Solubility (mg/mL) 1.2 < 1 4.5 < 1 6.8 < 1 7.4 < 1 8.0 < 1

77
Solubility in Surfactants & Cyclodextrins:
The solubility of dimer oxime in all the surfactants tested, was seen to be less than
1mg/mL, whereas, solubility in 5% and 10% HPβCD solutions was seen to be 6µg/mL and
14µg/mL respectively, while it was 116µg/mL and 353µg/mL in 5% and 10% RMβCD solutions
respectively.
The above results have been tabulated in tables 5-3 & 5-4.
Table 5-3: Solubility of Dimer Oxime in Surfactant Solutions. Data represents mean±SD (n=3).
Table 5-4: Solubility of Dimer Oxime in Cyclodextrin Solutions. Data represents mean±SD (n=3).
Cyclodextrin Solubility in 5% Solutions (µg/mL)
Solubility in 10% Solutions (µg/mL)
Hydroxpropyl Methyl β Cyclodextrin 6 14
Randomly Methylated β Cyclodextrin 116 353
Surfactant (5% Solutions) Solubility (mg/mL) Poloxamer 188 < 1 Poloxamer 407 < 1
Tween 20 < 1 Tween 80 < 1
Cremophor EL < 1

78
Stability Studies:
The stability of dimer oxime in mixtures of water-acetonitrile, SGF-water and SIF-water
is shown in table 5-5, in terms of half-lives. It was seen that as the stability is directly
proportional to the acetonitrile content in all 3 mixtures.
Table 5-5: Stability of Dimer Oxime in Various Mixtures. Data represents mean±SD (n=3).
Mixture 50:50 Mixture (Half life in hours)
60:40 Mixture (Half life in hours)
Water: Acetonitrile 277 40 Acetonitrile: SIF 17.3 2.6 Acetonitrile: SGF 71 49.5
Metabolic Stability:
The metabolic stability of dimer oxime is shown in figure 5-3. It was observed that the
compound is highly metabolized in the whole liver homogenate. The degradation profile of
verapamil hydrochloride confirms the viability of the tissue and the method.
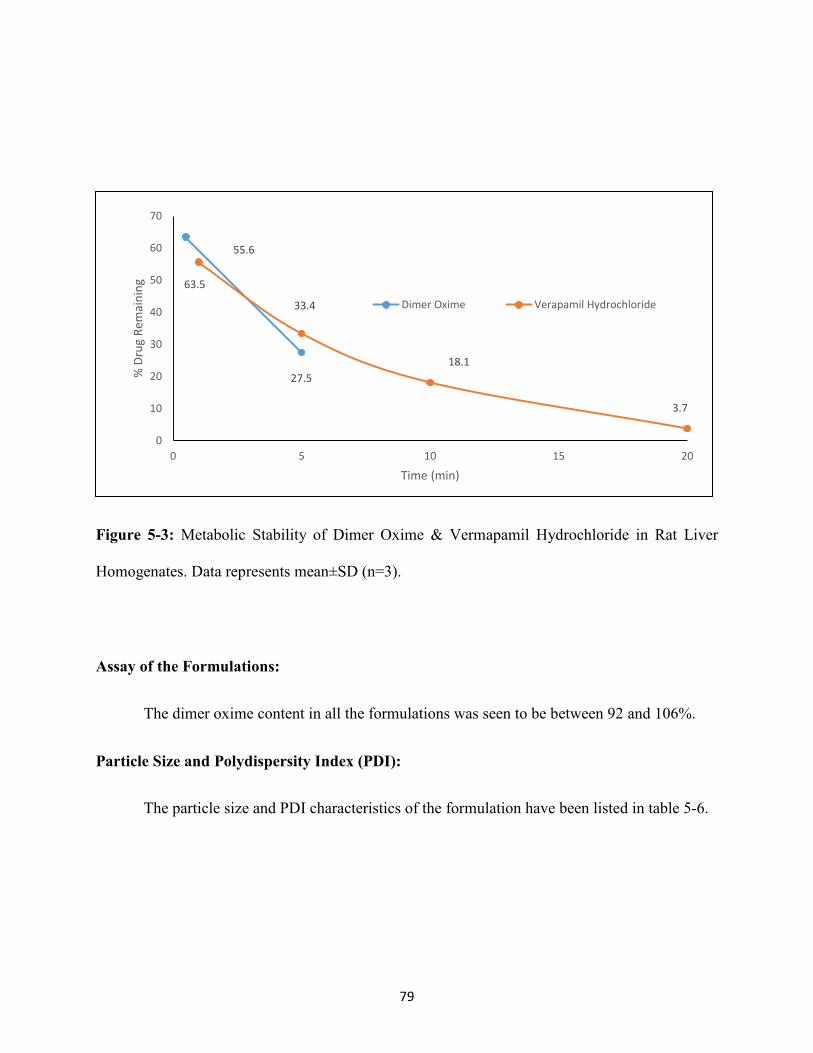
79
Figure 5-3: Metabolic Stability of Dimer Oxime & Vermapamil Hydrochloride in Rat Liver
Homogenates. Data represents mean±SD (n=3).
Assay of the Formulations:
The dimer oxime content in all the formulations was seen to be between 92 and 106%.
Particle Size and Polydispersity Index (PDI):
The particle size and PDI characteristics of the formulation have been listed in table 5-6.
63.5
27.5
55.6
33.4
18.1
3.7
0
10
20
30
40
50
60
70
0 5 10 15 20
% D
rug
Rem
aini
ng
Time (min)
Dimer Oxime Verapamil Hydrochloride

80
Table 5-6: Particle size and Polydispersity Index (PDI) of Various Formulations. Data represents
mean±SD (n=3).
Formulation Particle Size (nm) PDI
F-2 395 0.22
F-3 129 0.13
F-4 194 0.17
F-5 246 0.34
F-7 350 0.29
F-11 374 0.27
In vitro Intestinal Permeability Studies:
The intestinal permeation of dimer oxime across duodenum, jejunum and ileum from the
solution, NLC and SNEDDS formulation is shown in figure 5-4. It was seen that the
permeability did not depend on the intestinal segment, as there was no significant difference in
permeability values between segment types from each formulation.

81
Figure 5-4: Permeability of Dimer Oxime across Rat Intestinal Segments. Data represents
mean±SD (n=3).
In vivo Bioavailability Studies:
The compound reached maximum level of 1665 ng/mL in 30 minutes and then the levels
started dropping rapidly with some amount of drug still remained in the system even at the end
of 8 hours, while a peak plasma concentration of 100ng/mL was seen at the end of 90 minutes
with levels seen till the end of 8 hours post IP administration.
The plasma profiles post oral administration showed that the solution formulation showed
the highest Cmax (345.3ng/mL) followed by the SLNs (266.4ng/mL). The NLCs (242.5ng/mL)
and suspension (160ng/mL) were the next best followed by the SNEDDS formulations
3.23
3.61
3 2.78
3.14 2.85
1.05 0.97
0.004 0
0.5
1
1.5
2
2.5
3
3.5
4
Duodenum Jejunum Ileum
Perm
eabi
lity
x 10
-5 c
m/s
ec
Control NLC SNEDDS

82
(44.6ng/mL & 77.8ng/mL for uncharged & charged respectively). No improvement in absorption
was seen between both the solutions, when half of the water content was replaced with PEG 400
(245.7ng/mL). Presence of chitosan did not show any increase in blood levels in the second SLN
formulation (135.6ng/mL) and the addition of surfactant in the aqueous phase instead of lipid
phase in NLCs also yielded lower Cmax and absorption values (191ng/mL).
Nonetheless, all the formulations were also able to depict an 8 hour profile, with highest
systemic bioavailability values shown by solution, followed by the NLCs. The plasma profiles
from all the formulations post IV, IP and oral administration have been shown in figures 5-5, 5-6
& 5-7 and the corresponding pharmacokinetic parameters have been depicted in table 5-7.
Figure 5-5: Pharmacokinetic Disposition of Dimer Oxime in Sprague-Dawley Rats, Post
Intravenous Administration. Mean±S.D (n=3).
0
200
400
600
800
1000
1200
1400
1600
1800
0 50 100 150 200 250 300 350 400 450 500
Conc
entr
atio
n (n
g/m
L)
Time (min)
F-6

83
Figure 5-6: Pharmacokinetic Disposition of Dimer Oxime in Sprague-Dawley Rats, Post
Intraperitoneal Administration. . Mean±S.D (n=3).
0
20
40
60
80
100
120
0 100 200 300 400 500 600
Conc
entr
atio
n (n
g/m
L)
Time (min)
F-9

84
Figure 5-7: Pharmacokinetic Disposition of Dimer Oxime in Sprague-Dawley Rats, Post Oral
Administration. Mean±S.D (n=3).
0
50
100
150
200
250
300
350
400
0 50 100 150 200 250 300 350 400 450 500
Conc
entr
atio
n (n
g/m
L)
Time (min)
F-1
F-2
F-3
F-4
F-5
F-7
F-8
F-10
F-11

85
Table 5-7: Pharmacokinetic Disposition of Dimer Oxime from Various Formulations in
Sprague-Dawley Rats. Data represents mean±SD (n=3).
*NLC: Nano lipid carriers; SEDDS: Self emulsifying drug delivery systems; SLN: Solid lipid nanoparticles; IV: Intravenous; IP: Intraperitoneal
5.4. Discussion:
Though there have been many modes of therapy for treatment of malaria, none of them
was proven to be effective for a long time mainly due to the resistance developed by the parasites
[131-133]. It has been shown that the parasites’ ability to develop this resistance depends on the
Formulation Code Type Dose
(µg) CMax
(ng/mL) TMax
(min) AUC
(µg.min/mL) Absolute
Bioavailability (%)
F-1 Solution 12500 345.3 40 69.37 6.4 F-2 NLC 12500 242.5 40 38.18 4.4 F-3 SEDDS 12500 169.5 20 11.32 1.3
F-4 Charged SEDDS 12500 82.9 20 17.15 2.0
F-5 SLN 12500 266.4 90 36.25 4.2 F-6 I.V 1000 1665 20 69.50 100
F-7 SLN with Chitosan 12500 135.6 60 14.70 1.7
F-8 Suspension 12500 160.4 90 20.00 2.3 F-9 I.P 750 100.5 90 26.14 50.2
F-10 Solution 12500 245.75 45 30.62 3.5 F-11 NLC 12500 191 45 32.79 3.8

86
class and type of the anti-malarial [133, 134]. Also, some parasites have a higher ability to
develop resistance in comparison to others [135]. Resistance to atovoquone was developed in a
little over a decade, while it took parasites almost only half the time in developing resistance
towards mefloquine [136, 137]. Therefore combination therapies were developed and an
artemisinin derivative was more often than not was the partnering compound with another
compound [138, 139]. The main active metabolite of artemisinin is DHA, which has proven
activity against the malarial parasite [99] due to its peroxide bridge containing ring system [100].
But, like other endoperoxide group of drugs, this compound also has very poor physicochemical
characteristics such as very poor solubility, stability, bioavailability [103, 104]. Haynes et al
depicted the thermal instability of this compound, which makes any attempt towards developing
a formulation difficult [140]. Therefore, for this project, we have synthesized a novel dimer of
the DHA with a nitrogen group in the linker functionality. The dimer oxime was expected to be
more soluble, bioavailable and show improved activity. It may be possible to develop
formulations which can act at lower doses and thereby avoid the side effects seen due to higher
doses of DHA [141-144]. In the studies described and carried out in this part of the project, we
have attempted to get a basic understanding of the compound’s physicochemical characteristics
and evaluate its bioavailability through various formulations.
The initial set of studies carried out, were to check the solubility of the DO in buffer, 5%
surfactant and 5%, 10% cyclodextrin solutions. It was observed that the solubility was below the
detecting limit and less than 1mg/mL in all the buffered and 5% surfactant solutions. On the
other hand, the DO showed very little solubility in 5% and 10% HPβCD, while the highest was

87
seen in 10% RMβCD solution. Stability of the compound in mixtures of water-acetonitrile,
water-SGF and water-SIF showed that the half-life dropped with decreasing organic content and
increasing aqueous content. Also, metabolic stability in whole liver homogenates showed rapid
degradation of the pure DO. Going by the solubility and stability profiles, surfactant, co-solvent
based and lipid based systems were deemed to be the suitable platforms for formulation
development.
The profile on DSC showed degradation at 150oC, while there was small thermal event
observed at 116oC. Further investigation of this under a hot stage microscope with a 2oC step
increase temperature profile showed the compound, molten, started recrystallizing at 116oC.
While there was no change in the retention time for the recrystallized DO on HPLC, the activity
of the recrystallized compound might still be different. That investigation was not a part of this
part of the project, but the thermal profile provided valuable information regarding the
processing conditions that must be maintained during formulation development to avoid any
possible polymorphic changes in the compound.
Based on the above studies, we have decided to focus mainly on lipid based systems for
evaluating the compound’s plasma profile. Initial in vitro evaluation of the compound’s
permeation characteristics was performed using three formulations, namely a surfactant-ethanol
based solution, NLCs and SNEDDS. This study was mainly performed to look at the effect on
intestinal segments on the DO’s permeability. Everted duodenum, jejunum and ileum sacs were
used and the results showed that, there was no significant difference in permeability between

88
segments within each formulation. Higher permeability was seen from the solution, followed by
NLCs and SNEDDS across all segments.
Having seen that the permeability was not segment dependent, we have proceeded to
evaluate the DO’s bioavailability in vivo. It was seen that the drug levels peaked very early, as
expected, post IV dose, and the quick drop in levels after this showed the rapid elimination
profile of the compound. Similar was the case post IP dose, though some levels were still being
detected at the end of 8 hours in both cases.
Following this, the oral bioavailability was evaluated from a wide range of formulations.
It was surprising to see that none of the lipid based formulations were able to surpass the
solution’s plasma levels. The SLNs were the best formulation after the solution followed by the
NLCs. A possibility that lymphatic uptake of the nanoparticles can result in higher plasma levels
through avoiding of first-pass effect [112, 113] was not seen and adding chitosan to the SLN
formulation and adding surfactant to the aqueous phase of the NLCs also did not yield better
results. Also, the SNEDDS were highly unsuccessful and surface modification by imparting a
positive charge also did not provide any improvement and similar results were seen when a
suspension was utilized to control the release. Seeing that the solution was the best formulation
of all, we have attempted to sustain the levels achieved for a longer time by replacing half of the
water content in the formulation with the more viscous PEG 400 and also, this allowed for a
higher loading capacity (15mg/mL in this formulation as opposed to 5mg/mL in the initial

89
solution formulation). It was seen that this formulation also failed to achieve any levels higher
than the initial solution formulation.
Going by previous reports on enhanced drug delivery using lipid based systems [118,
119, 121-125], the results seen in these studies were in contrast. One of the possibilities could be
the lipid getting digested and the drug, once out of the lipid core, is not able to form micelles
[112] and/or partition effectively and get into solution. This is not surprising going by the
aqueous stability and solubility observed in vitro, in the pre-formulation studies. The solution on
the other hand, was able to deliver the compound immediately into the blood upon
administration and so the higher plasma peak level was observed. A second reason could be the
immediate partitioning of drug in to the RBCs post absorption. It has been reported previously
that Artemisinin and its derivative compounds partition into the RBCs quickly [145, 146], and it
is logical to make this assumption as the site of action for this compound is inside the RBCs,
where the parasite merozoites reside and multiply. Seeing that we have only analyzed the plasma
fraction in all the experiments, analyzing the RBC fraction also might give a more definite idea
about the compound’s disposition post absorption.
It has to be noted here that while the plasma levels were not expectedly high, all the
formulations showed levels till the end of 6-8 hours and these levels are higher than the IC50
values of DHA which are 1.79ng/mL in D-6 type P. falciparum parasite and 1.83ng/mL in W-2
type [147]. Also, these levels were achieved with a smaller dose (50mg/kg) in contrast to the
much higher dose of DHA employed previously in other reported studies [141, 142, 144].
90
At this point, we surely know that the DO is absorbed into the blood at lower doses and
levels above the IC50 are being observed even at the end of 6-8 hours. Going by the plasma
profiles from all the above formulations, a dosing frequency of twice a day may be suggested.
This can be further improved through optimization of the solution by testing other and better
suited viscous additives. Also, an RBC partitioning study can help in complete elucidation of the
compound’s disposition and may help take the next step towards formulation optimization.
5.5. Conclusion:
It has been understood from all the above studies that the DHA dimer oxime is poorly
soluble and highly metabolized by the hepatic enzymes. The lipid based formulations prepared
to circumvent these issues were less successful than a surfactant-ethanol based solution. It
remains to be seen whether this is due to the poor partitioning of the compound into the
solution form the lipid cores or higher partitioning into the site of action, the RBCs, from the
same. A deeper understanding of these characteristics maybe helpful in developing a
formulation which performs better and helps in developing a long acting anti-malarial drug
with lower dose and subsequently, lesser side effects.

91
CHAPTER 6
SUMMARY OF ALL THE STUDIES

92
All the approaches used have shown considerable promise and success in achieving the
desired goals in all the studies.
i. The controlled release formulation of Δ9-THC can be a potential one dose per day
formulation used for treating CINV. This formulation eliminates frequent dosing and the
hypersensitivity inducing sesame oil. Δ9-THC, as mentioned is a resinous compound that
is difficult to handle and the processing method described helps in overcoming this aspect.
Also, the composition of this tablet may help circumvent lipolysis and maintain the release
profile of the dosage form
ii. The SLNs instilled topically showed good penetration ability and were able to deliver Δ8-
THC to the posterior ocular segment. In vitro, they exhibited good characteristics in terms
of particle size, PDI, assay, entrapment efficiency and permeability across corneas. In
vivo, they showed the highest efficiency in delivering the intact Δ8-THC when compared
to the other formulations tested, in spite of carrying a lower dose of Δ8-THC. This topical
formulation not only is a promising method for delivery to the anterior chamber, but also
has the potential to delivery compounds non-invasively to the back of the eye and
therefore help in treating afflictions pertaining to the posterior ocular segment.
iii. The surfactant solution and lipid based systems had good in vitro intestinal permeability.
The formulations had good characteristics in terms of particle size & PDI. The in vivo
plasma profiles showed that the solution was the best formulation in terms of levels
achieve. Nonetheless, all the formulations showed levels till the end of 8 hours and these
levels were above the IC50 values for the malarial parasite. The tested novel prodrug

93
showed promise, and further investigation into its disposition would help in developing an
effective line of therapy for malaria.
94
CHAPTER 7
BIBLIOGRAPHY

95
1. Small, D., A classification of biologic lipids based upon their interaction in aqueous systems. Journal of the American Oil Chemists Society, 1968. 45(3): p. 108-119.
2. Viale, P.H., Update on the management of chemotherapy-induced nausea and vomiting. J Infus Nurs, 2006. 29(5): p. 283-92.
3. Tramer, M.R., et al., Cannabinoids for control of chemotherapy induced nausea and vomiting: quantitative systematic review. BMJ, 2001. 323(7303): p. 16-21.
4. Walsh, D., K.A. Nelson, and F.A. Mahmoud, Established and potential therapeutic applications of cannabinoids in oncology. Support Care Cancer, 2003. 11(3): p. 137-43.
5. International, V.P., Cesamet (nabilone) Capsule. 2006. 6. NDA, Marinol® (Dronabinol) 2004. 7. Physicians Total Care, I. Marinol (dronabinol) capsule Daily Med; Available from:
http://dailymed.nlm.nih.gov/dailymed/lookup.cfm?setid=fffb4e00-c921-4958-aeab-18deae4a2e38.
8. Coates, A., et al., On the receiving end--patient perception of the side-effects of cancer chemotherapy. Eur J Cancer Clin Oncol, 1983. 19(2): p. 203-8.
9. Dibble, S.L., et al., Chemotherapy-induced vomiting in women treated for breast cancer. Oncol Nurs Forum, 2004. 31(1): p. E1-8.
10. Eckert, R.M., Understanding anticipatory nausea. Oncol Nurs Forum, 2001. 28(10): p. 1553-8; quiz 1559-60.
11. Griffin, A.M., et al., On the receiving end. V: Patient perceptions of the side effects of cancer chemotherapy in 1993. Ann Oncol, 1996. 7(2): p. 189-95.
12. Jordan, K., C. Sippel, and H.J. Schmoll, Guidelines for antiemetic treatment of chemotherapy-induced nausea and vomiting: past, present, and future recommendations. Oncologist, 2007. 12(9): p. 1143-50.
13. Tipton, J.M., et al., Putting evidence into practice: evidence-based interventions to prevent, manage, and treat chemotherapy-induced nausea and vomiting. Clin J Oncol Nurs, 2007. 11(1): p. 69-78.
14. Andrews, P.L., R.J. Naylor, and R.A. Joss, Neuropharmacology of emesis and its relevance to anti-emetic therapy. Consensus and controversies. Support Care Cancer, 1998. 6(3): p. 197-203.
15. Bender, C.M., et al., Chemotherapy-induced nausea and vomiting. Clin J Oncol Nurs, 2002. 6(2): p. 94-102.
16. Faigel, D.O., A clinical approach to constipation. Clin Cornerstone, 2002. 4(4): p. 11-21. 17. Hesketh, P.J., et al., Differential involvement of neurotransmitters through the time course of
cisplatin-induced emesis as revealed by therapy with specific receptor antagonists. Eur J Cancer, 2003. 39(8): p. 1074-80.
18. Kalant, H., Medicinal use of cannabis: history and current status. Pain Res Manag, 2001. 6(2): p. 80-91.
19. Shelke, A.R., K.M. Mustian, and G.R. Morrow, The pathophysiology of treatment-related nausea and vomiting in cancer patients: current models. Indian J Physiol Pharmacol, 2004. 48(3): p. 256-68.

96
20. Spencer Green, Z.N., and Sarah Nordquist, Pharmacological Evidence for Cannabinoid Receptors in Glutamatergic
Synapses at the Crayfish Neuromuscular Junction. Pioneering Neuroscience, 2005. 6: p. 55-61 21. Munjal, M., M.A. Elsohly, and M.A. Repka, Polymeric systems for amorphous Delta9-
tetrahydrocannabinol produced by a hot-melt method. Part II: Effect of oxidation mechanisms and chemical interactions on stability. J Pharm Sci, 2006. 95(11): p. 2473-85.
22. Huestis, M.A., Human cannabinoid pharmacokinetics. Chem Biodivers, 2007. 4(8): p. 1770-804. 23. Hauss, D.J., Oral lipid-based formulations. Adv Drug Deliv Rev, 2007. 59(7): p. 667-76. 24. Porter, C.J., N.L. Trevaskis, and W.N. Charman, Lipids and lipid-based formulations: optimizing
the oral delivery of lipophilic drugs. Nat Rev Drug Discov, 2007. 6(3): p. 231-48. 25. Grotenhermen, F., Pharmacokinetics and pharmacodynamics of cannabinoids. Clin
Pharmacokinet, 2003. 42(4): p. 327-60. 26. Thumma, S., et al., Preformulation studies of a prodrug of Delta9-tetrahydrocannabinol. AAPS
PharmSciTech, 2008. 9(3): p. 982-90. 27. FDA. Available from:
http://www.accessdata.fda.gov/scripts/cder/dissolution/dsp_searchresults_dissolutions.cfm?printall=1.
28. Witzleb, R., et al., Dissolution of solid lipid extrudates in biorelevant media. Int J Pharm, 2011. 422(1-2): p. 116-24.
29. Hofmann, A.F., Lipase, colipase, amphipathic dietary proteins, and bile acids: new interactions at an old interface. Gastroenterology, 1978. 75(3): p. 530-2.
30. Jafvert, C.T., L.V.H. Patricia, and J.K. Heath, Solubilization of non-polar compounds by non-ionic surfactant micelles. Water Research, 1994. 28(5): p. 1009-1017.
31. Blunk, T., et al., Colloidal carriers for intravenous drug targeting: plasma protein adsorption patterns on surface-modified latex particles evaluated by two-dimensional polyacrylamide gel electrophoresis. Electrophoresis, 1993. 14(12): p. 1382-7.
32. Brubach, J.B., et al., Structural and thermal characterization of glyceryl behenate by X-ray diffraction coupled to differential calorimetry and infrared spectroscopy. Int J Pharm, 2007. 336(2): p. 248-56.
33. Armand, M., Lipases and lipolysis in the human digestive tract: where do we stand? Curr Opin Clin Nutr Metab Care, 2007. 10(2): p. 156-64.
34. Quigley, H.A., et al., Retinal ganglion cell death in experimental glaucoma and after axotomy occurs by apoptosis. Invest Ophthalmol Vis Sci, 1995. 36(5): p. 774-86.
35. Vasudevan, S.K., V. Gupta, and J.G. Crowston, Neuroprotection in glaucoma. Indian J Ophthalmol, 2011. 59 Suppl: p. S102-13.
36. Phelps, C.D. and J.J. Corbett, Migraine and low-tension glaucoma. A case-control study. Invest Ophthalmol Vis Sci, 1985. 26(8): p. 1105-8.
37. Rein, D.B., et al., The economic burden of major adult visual disorders in the United States. Arch Ophthalmol, 2006. 124(12): p. 1754-60.
38. Ji, J., et al., Effects of elevated intraocular pressure on mouse retinal ganglion cells. Vision Res, 2005. 45(2): p. 169-79.

97
39. Levkovitch-Verbin, H., et al., Translimbal laser photocoagulation to the trabecular meshwork as a model of glaucoma in rats. Invest Ophthalmol Vis Sci, 2002. 43(2): p. 402-10.
40. Leske, M.C., et al., Nine-year incidence of open-angle glaucoma in the Barbados Eye Studies. Ophthalmology, 2007. 114(6): p. 1058-64.
41. Almasieh, M., et al., The molecular basis of retinal ganglion cell death in glaucoma. Prog Retin Eye Res, 2012. 31(2): p. 152-81.
42. Bien, A., et al., Apoptotic versus necrotic characteristics of retinal ganglion cell death after partial optic nerve injury. J Neurotrauma, 1999. 16(2): p. 153-63.
43. Crandall, J., et al., Neuroprotective and intraocular pressure-lowering effects of (-)Delta9-tetrahydrocannabinol in a rat model of glaucoma. Ophthalmic Res, 2007. 39(2): p. 69-75.
44. El-Remessy, A.B., et al., Neuroprotective effect of (-)Delta9-tetrahydrocannabinol and cannabidiol in N-methyl-D-aspartate-induced retinal neurotoxicity: involvement of peroxynitrite. Am J Pathol, 2003. 163(5): p. 1997-2008.
45. El-Remessy, A.B., et al., Neuroprotective effects of cannabidiol in endotoxin-induced uveitis: critical role of p38 MAPK activation. Mol Vis, 2008. 14: p. 2190-203.
46. He, F. and Z.H. Song, Molecular and cellular changes induced by the activation of CB2 cannabinoid receptors in trabecular meshwork cells. Mol Vis, 2007. 13: p. 1348-56.
47. Njie, Y.F., et al., N-arachidonylethanolamide-induced increase in aqueous humor outflow facility. Invest Ophthalmol Vis Sci, 2008. 49(10): p. 4528-34.
48. Porcella, A., et al., The human eye expresses high levels of CB1 cannabinoid receptor mRNA and protein. Eur J Neurosci, 2000. 12(3): p. 1123-7.
49. Hingorani, T., et al., Ocular disposition of the hemiglutarate ester prodrug of (9)-Tetrahydrocannabinol from various ophthalmic formulations. Pharm Res, 2013. 30(8): p. 2146-56.
50. Hingorani, T., et al., Effect of ion pairing on in vitro transcorneal permeability of a Delta(9) -tetrahydrocannabinol prodrug: potential in glaucoma therapy. J Pharm Sci, 2012. 101(2): p. 616-26.
51. Ethan B. Russo, F.G., ed. The Handbook of Cannabis Therapeutics: From Bench to Bedside. ed. E.B. Russo. 2006, Haworth Integrative Healing Press: New York.
52. Muchtar, S., et al., A submicron emulsion as ocular vehicle for delta-8-tetrahydrocannabinol: effect on intraocular pressure in rabbits. Ophthalmic Res, 1992. 24(3): p. 142-9.
53. Zhang, J., C. Purdon, and E. Smith, Solid lipid nanoparticles for topical drug delivery. American Journal of Drug Delivery, 2006. 4(4): p. 215-220.
54. Zhou, H.-Y., et al., Nanoparticles in the ocular drug delivery. International Journal of Ophthalmology, 2013. 6(3): p. 390-396.
55. De Campos, A.M., A. Sanchez, and M.J. Alonso, Chitosan nanoparticles: a new vehicle for the improvement of the delivery of drugs to the ocular surface. Application to cyclosporin A. Int J Pharm, 2001. 224(1-2): p. 159-68.
56. Cavalli, R., et al., Solid lipid nanoparticles (SLN) as ocular delivery system for tobramycin. Int J Pharm, 2002. 238(1-2): p. 241-5.
98
57. Yuan, X.-b., H. Li, and Y.-b. Yuan, Preparation of cholesterol-modified chitosan self-aggregated nanoparticles for delivery of drugs to ocular surface. Carbohydrate Polymers, 2006. 65(3): p. 337-345.
58. Ibrahim, H.K., I.S. El-Leithy, and A.A. Makky, Mucoadhesive nanoparticles as carrier systems for prolonged ocular delivery of gatifloxacin/prednisolone bitherapy. Mol Pharm, 2010. 7(2): p. 576-85.
59. Hermans, K., et al., Development and characterization of mucoadhesive chitosan films for ophthalmic delivery of cyclosporine A. Int J Pharm, 2014. 472(1-2): p. 10-9.
60. Attia, M.A., M.A. Kassem, and S.M. Safwat, In vivo performance of [3H]dexamethasone ophthalmic film delivery systems in the rabbit eye. International Journal of Pharmaceutics, 1988. 47(1–3): p. 21-30.
61. Hippalgaonkar, K., et al., Indomethacin-loaded solid lipid nanoparticles for ocular delivery: development, characterization, and in vitro evaluation. J Ocul Pharmacol Ther, 2013. 29(2): p. 216-28.
62. Levy, M.Y. and S. Benita, Design and characterization of a submicronized o/w emulsion of diazepam for parenteral use. International Journal of Pharmaceutics, 1989. 54(2): p. 103-112.
63. Thumma, S., et al., Preformulation Studies of a Prodrug of Δ(9)-Tetrahydrocannabinol. AAPS PharmSciTech, 2008. 9(3): p. 982-990.
64. Flom, M.C., A.J. Adams, and R.T. Jones, Marijuana smoking and reduced pressure in human eyes: drug action or epiphenomenon? Invest Ophthalmol, 1975. 14(1): p. 52-5.
65. Bary, A.R., I.G. Tucker, and N.M. Davies, Considerations in the use of hydroxypropyl-beta-cyclodextrin in the formulation of aqueous ophthalmic solutions of hydrocortisone. Eur J Pharm Biopharm, 2000. 50(2): p. 237-44.
66. Loftsson, T., et al., Dexamethasone delivery to posterior segment of the eye. Journal of Inclusion Phenomena and Macrocyclic Chemistry, 2007. 57(1-4): p. 585-589.
67. Valls, R., et al., Transcorneal Permeation in a Corneal Device of Non-Steroidal Anti-Inflammatory Drugs in Drug Delivery Systems. The Open Medicinal Chemistry Journal, 2008. 2: p. 66-71.
68. Bloomfield, S.E., et al., Soluble gentamicin ophthalmic inserts as a drug delivery system. Arch Ophthalmol, 1978. 96(5): p. 885-7.
69. Baeyens, V., et al., Optimized release of dexamethasone and gentamicin from a soluble ocular insert for the treatment of external ophthalmic infections. J Control Release, 1998. 52(1-2): p. 215-20.
70. Bensinger, R., et al., Pilocarpine ocular inserts. Invest Ophthalmol, 1976. 15(12): p. 1008-10. 71. Khurana, G., S. Arora, and P.K. Pawar, Ocular insert for sustained delivery of gatifloxacin
sesquihydrate: Preparation and evaluations. Int J Pharm Investig, 2012. 2(2): p. 70-7. 72. Sankar, A.K.C.V., and Durga, S., Design and evaluation of diclofenac sodium ophthalmic inserts.
Acta Pharm. Sci., 2006. 48: p. 5-10. 73. Theng, J.T., et al., Pharmacokinetic and toxicity study of an intraocular cyclosporine DDS in the
anterior segment of rabbit eyes. Invest Ophthalmol Vis Sci, 2003. 44(11): p. 4895-9. 74. Calvo, P., J.L. Vila-Jato, and M.J. Alonso, Comparative in vitro evaluation of several colloidal
systems, nanoparticles, nanocapsules, and nanoemulsions, as ocular drug carriers. J Pharm Sci, 1996. 85(5): p. 530-6.

99
75. Contreras-Ruiz, L., et al., Intracellular trafficking of hyaluronic acid-chitosan oligomer-based nanoparticles in cultured human ocular surface cells. Mol Vis, 2011. 17: p. 279-90.
76. de la Fuente, M., B. Seijo, and M.J. Alonso, Novel hyaluronic acid-chitosan nanoparticles for ocular gene therapy. Invest Ophthalmol Vis Sci, 2008. 49(5): p. 2016-24.
77. Enriquez de Salamanca, A., et al., Chitosan nanoparticles as a potential drug delivery system for the ocular surface: toxicity, uptake mechanism and in vivo tolerance. Invest Ophthalmol Vis Sci, 2006. 47(4): p. 1416-25.
78. Pignatello, R., et al., Eudragit RS100 nanosuspensions for the ophthalmic controlled delivery of ibuprofen. Eur J Pharm Sci, 2002. 16(1-2): p. 53-61.
79. Pignatello, R., et al., Flurbiprofen-loaded acrylate polymer nanosuspensions for ophthalmic application. Biomaterials, 2002. 23(15): p. 3247-55.
80. Vega, E., et al., Flurbiprofen loaded biodegradable nanoparticles for ophtalmic administration. J Pharm Sci, 2006. 95(11): p. 2393-405.
81. Yuan, X.B., et al., Preparation of rapamycin-loaded chitosan/PLA nanoparticles for immunosuppression in corneal transplantation. Int J Pharm, 2008. 349(1-2): p. 241-8.
82. Bhatt, S., et al., The effect of malaria control on Plasmodium falciparum in Africa between 2000 and 2015. Nature, 2015. 526(7572): p. 207-11.
83. Velarde-Rodriguez, M., et al., Origin of malaria cases: a 7-year audit of global trends in indigenous and imported cases in relation to malaria elimination. Glob Health Action, 2015. 8: p. 29133.
84. O'Brien, S.F., et al., The Epidemiology of Imported Malaria and Transfusion Policy in 5 Nonendemic Countries. Transfus Med Rev, 2015. 29(3): p. 162-71.
85. Update: malaria, U.S. Armed Forces, 2014. MSMR, 2015. 22(1): p. 2-6. 86. Luthi, B. and P. Schlagenhauf, Risk factors associated with malaria deaths in travellers: a
literature review. Travel Med Infect Dis, 2015. 13(1): p. 48-60. 87. Carter, R. and K.N. Mendis, Evolutionary and historical aspects of the burden of malaria. Clin
Microbiol Rev, 2002. 15(4): p. 564-94. 88. Bray, R.S. and P.C. Garnham, The life-cycle of primate malaria parasites. Br Med Bull, 1982.
38(2): p. 117-22. 89. Flegel, K.M., Symptoms and signs of malaria. Can Med Assoc J, 1976. 115(5): p. 409-10. 90. Ejov, M.N., et al., Response of falciparum malaria to different antimalarials in Myanmar. Bull
World Health Organ, 1999. 77(3): p. 244-9. 91. Nosten, F. and E. Ashley, The detection and treatment of Plasmodium falciparum malaria: time
for change. J Postgrad Med, 2004. 50(1): p. 35-9. 92. White, N.J., Antimalarial drug resistance. J Clin Invest, 2004. 113(8): p. 1084-92. 93. Garner, P. and P.M. Graves, The benefits of artemisinin combination therapy for malaria extend
beyond the individual patient. PLoS Med, 2005. 2(4): p. e105. 94. Nosten, F., et al., Treatment of multidrug-resistant Plasmodium falciparum malaria with 3-day
artesunate-mefloquine combination. J Infect Dis, 1994. 170(4): p. 971-7. 95. Yin, J.Y., et al., Subchronic toxicological study of two artemisinin derivatives in dogs. PLoS One,
2014. 9(4): p. e94034.

100
96. Efferth, T. and B. Kaina, Toxicity of the antimalarial artemisinin and its dervatives. Crit Rev Toxicol, 2010. 40(5): p. 405-21.
97. Shahbazfar, A.A., et al., Effects of different concentrations of artemisinin and artemisinin-iron combination treatment on Madin Darby Canine Kidney (MDCK) cells. Interdiscip Toxicol, 2012. 5(1): p. 30-7.
98. Das, A.K., Anticancer Effect of AntiMalarial Artemisinin Compounds. Ann Med Health Sci Res, 2015. 5(2): p. 93-102.
99. Gordi, T., et al., Artemisinin pharmacokinetics and efficacy in uncomplicated-malaria patients treated with two different dosage regimens. Antimicrob Agents Chemother, 2002. 46(4): p. 1026-31.
100. Kaiser, M., et al., Peroxide bond-dependent antiplasmodial specificity of artemisinin and OZ277 (RBx11160). Antimicrob Agents Chemother, 2007. 51(8): p. 2991-3.
101. Wright, P.W., et al., Initial clinical assessment of the comatose patient: cerebral malaria vs. meningitis. Pediatr Infect Dis J, 1993. 12(1): p. 37-41.
102. Stocker, R., et al., Production of luminol-reactive oxygen radicals during Plasmodium vinckei infection. Infect Immun, 1984. 45(3): p. 708-12.
103. Kushwaha, H.N., et al., Pharmacokinetic study and bioavailability of a novel synthetic trioxane antimalarial compound 97/63 in rats. Malar Res Treat, 2014. 2014: p. 759392.
104. O'Neill, P.M. and G.H. Posner, A Medicinal Chemistry Perspective on Artemisinin and Related Endoperoxides. Journal of Medicinal Chemistry, 2004. 47(12): p. 2945-2964.
105. Edwards, D.A., R.G. Luthy, and Z. Liu, Solubilization of polycyclic aromatic hydrocarbons in micellar nonionic surfactant solutions. Environmental Science & Technology, 1991. 25(1): p. 127-133.
106. Chiou, W.L., S.J. Chen, and N. Athanikar, Enhancement of dissolution rates of poorly water-soluble drugs by crystallization in aqueous surfactant solutions I: Sulfathiazole, prednisone, and chloramphenicol. J Pharm Sci, 1976. 65(11): p. 1702-4.
107. Sareen, S., G. Mathew, and L. Joseph, Improvement in solubility of poor water-soluble drugs by solid dispersion. International Journal of Pharmaceutical Investigation, 2012. 2(1): p. 12-17.
108. Zhu, L.Z. and C.T. Chiou, Water solubility enhancements of pyrene by single and mixed surfactant solutions. J Environ Sci (China), 2001. 13(4): p. 491-6.
109. Zhu, Q., et al., Pluronic F127-modified liposome-containing tacrolimus-cyclodextrin inclusion complexes: improved solubility, cellular uptake and intestinal penetration. J Pharm Pharmacol, 2013. 65(8): p. 1107-17.
110. A., K., Absorption of fat soluble vitamins. Vol. 2. CRC Press. 65-86. 111. Tarr, B.D. and S.H. Yalkowsky, Enhanced intestinal absorption of cyclosporine in rats through the
reduction of emulsion droplet size. Pharm Res, 1989. 6(1): p. 40-3. 112. Khoo, S.M., et al., A conscious dog model for assessing the absorption, enterocyte-based
metabolism, and intestinal lymphatic transport of halofantrine. J Pharm Sci, 2001. 90(10): p. 1599-607.
113. Porter, C.J. and W.N. Charman, Intestinal lymphatic drug transport: an update. Adv Drug Deliv Rev, 2001. 50(1-2): p. 61-80.

101
114. Porter, C.J. and W.N. Charman, In vitro assessment of oral lipid based formulations. Adv Drug Deliv Rev, 2001. 50 Suppl 1: p. S127-47.
115. Yang, S., et al., Body distribution of camptothecin solid lipid nanoparticles after oral administration. Pharm Res, 1999. 16(5): p. 751-7.
116. Chen, C.C., et al., Effects of lipophilic emulsifiers on the oral administration of lovastatin from nanostructured lipid carriers: physicochemical characterization and pharmacokinetics. Eur J Pharm Biopharm, 2010. 74(3): p. 474-82.
117. Nepal, P.R., H.K. Han, and H.K. Choi, Preparation and in vitro-in vivo evaluation of Witepsol H35 based self-nanoemulsifying drug delivery systems (SNEDDS) of coenzyme Q(10). Eur J Pharm Sci, 2010. 39(4): p. 224-32.
118. Makwana, V., et al., Solid lipid nanoparticles (SLN) of Efavirenz as lymph targeting drug delivery system: Elucidation of mechanism of uptake using chylomicron flow blocking approach. Int J Pharm, 2015. 495(1): p. 439-46.
119. Ansari, M.J., et al., Enhanced oral bioavailability of insulin-loaded solid lipid nanoparticles: pharmacokinetic bioavailability of insulin-loaded solid lipid nanoparticles in diabetic rats. Drug Deliv, 2015: p. 1-8.
120. Bhalekar, M.R., et al., In-vivo bioavailability and lymphatic uptake evaluation of lipid nanoparticulates of darunavir. Drug Deliv, 2015: p. 1-6.
121. Sangsen, Y., et al., Modification of oral absorption of oxyresveratrol using lipid based nanoparticles. Colloids Surf B Biointerfaces, 2015. 131: p. 182-90.
122. Battani, S., H. Pawar, and S. Suresh, Evaluation of oral bioavailability and anticancer potential of raloxifene solid lipid nanoparticles. J Nanosci Nanotechnol, 2014. 14(8): p. 5638-45.
123. Andey, T., et al., Lipid nanocarriers of a lipid-conjugated estrogenic derivative inhibit tumor growth and enhance cisplatin activity against triple-negative breast cancer: pharmacokinetic and efficacy evaluation. Mol Pharm, 2015. 12(4): p. 1105-20.
124. Khan, S., et al., Chlorogenic acid stabilized nanostructured lipid carriers (NLC) of atorvastatin: formulation, design and in vivo evaluation. Drug Dev Ind Pharm, 2015: p. 1-12.
125. Elmowafy, M., et al., Enhancement of Bioavailability and Pharmacodynamic Effects of Thymoquinone Via Nanostructured Lipid Carrier (NLC) Formulation. AAPS PharmSciTech, 2015.
126. Qi, R., et al., G5-PEG PAMAM dendrimer incorporating nanostructured lipid carriers enhance oral bioavailability and plasma lipid-lowering effect of probucol. J Control Release, 2015. 210: p. 160-8.
127. Rashid, R., et al., Comparative study on solid self-nanoemulsifying drug delivery and solid dispersion system for enhanced solubility and bioavailability of ezetimibe. Int J Nanomedicine, 2015. 10: p. 6147-59.
128. Nekkanti, V., Z. Wang, and G.V. Betageri, Pharmacokinetic Evaluation of Improved Oral Bioavailability of Valsartan: Proliposomes Versus Self-Nanoemulsifying Drug Delivery System. AAPS PharmSciTech, 2015.
129. Subramanian, N., et al., Lacidipine self-nanoemulsifying drug delivery system for the enhancement of oral bioavailability. Arch Pharm Res, 2015.

102
130. Perrone, M.G., et al., Comparative evaluation of two dye probes in the rat everted gut sac model for unambiguous classification of P-gp substrate and inhibitor. J Pharmacol Toxicol Methods, 2013. 67(1): p. 5-8.
131. Gaillard, T., M. Madamet, and B. Pradines, Tetracyclines in malaria. Malar J, 2015. 14(1): p. 445. 132. Baraka, V., et al., High-level Plasmodium falciparum sulfadoxine-pyrimethamine resistance with
the concomitant occurrence of septuple haplotype in Tanzania. Malar J, 2015. 14(1): p. 439. 133. Boggild, A.K., et al., Failure of atovaquone-proguanil malaria chemoprophylaxis in a traveler to
Ghana. Travel Med Infect Dis, 2015. 13(1): p. 89-93. 134. Winstanley, P., Coping with malaria in the face of resistance. Int J Infect Dis, 2002. 6(4): p. 246-
52. 135. Rathod, P.K., T. McErlean, and P.C. Lee, Variations in frequencies of drug resistance in
Plasmodium falciparum. Proc Natl Acad Sci U S A, 1997. 94(17): p. 9389-93. 136. Luxemburger, C., et al., Mefloquine for multidrug-resistant malaria. Lancet, 1991. 338(8777): p.
1268. 137. Nosten, F., et al., Mefloquine-resistant falciparum malaria on the Thai-Burmese border. Lancet,
1991. 337(8750): p. 1140-3. 138. White, N.J., Preventing antimalarial drug resistance through combinations. Drug Resist Updat,
1998. 1(1): p. 3-9. 139. White, N.J., Delaying antimalarial drug resistance with combination chemotherapy.
Parassitologia, 1999. 41(1-3): p. 301-8. 140. Haynes, R.K., et al., Artesunate and dihydroartemisinin (DHA): unusual decomposition products
formed under mild conditions and comments on the fitness of DHA as an antimalarial drug. ChemMedChem, 2007. 2(10): p. 1448-63.
141. Manning, J., et al., Randomized, double-blind, placebo-controlled clinical trial of a two-day regimen of dihydroartemisinin-piperaquine for malaria prevention halted for concern over prolonged corrected QT interval. Antimicrob Agents Chemother, 2014. 58(10): p. 6056-67.
142. Hosoya, K., et al., Comparison of high-dose intermittent and low-dose continuous oral artemisinin in dogs with naturally occurring tumors. J Am Anim Hosp Assoc, 2014. 50(6): p. 390-5.
143. Nontprasert, A., et al., Assessment of the neurotoxicity of oral dihydroartemisinin in mice. Trans R Soc Trop Med Hyg, 2002. 96(1): p. 99-101.
144. Posobiec, L.M., et al., Dihydroartemisinin (DHA) treatment causes an arrest of cell division and apoptosis in rat embryonic erythroblasts in whole embryo culture. Birth Defects Res B Dev Reprod Toxicol, 2013. 98(6): p. 445-58.
145. Shah, F., et al., In vitro erythrocytic uptake studies of artemisinin and selected derivatives using LC-MS and 2D-QSAR analysis of uptake in parasitized erythrocytes. Bioorg Med Chem, 2009. 17(14): p. 5325-31.
146. Vyas, N., et al., Carrier-mediated partitioning of artemisinin into Plasmodium falciparum-infected erythrocytes. Antimicrob Agents Chemother, 2002. 46(1): p. 105-9.
147. Krishna, S., A.C. Uhlemann, and R.K. Haynes, Artemisinins: mechanisms of action and potential for resistance. Drug Resist Updat, 2004. 7(4-5): p. 233-44.
103
VITA
Bachelors of Pharmacy Sri Venkateshwara College of Pharmacy
Osmania University
Summer Intern Merck Research Laboratories, Merck & Co., Summit, NJ
Achievements Inductee – The Rho Chi Honor Society – 2013