Linking Instructional Practices to Value-added Student Learning
22
Linking Instructional Linking Instructional Practices to Value-added Practices to Value-added Student Learning Student Learning Minneapolis Public Schools Minneapolis Public Schools November, 2001 November, 2001 www.mpls.k12.mn.us/REA/ www.mpls.k12.mn.us/REA/
-
Upload
ingrid-kane -
Category
Documents
-
view
23 -
download
0
description
Linking Instructional Practices to Value-added Student Learning. Minneapolis Public Schools November, 2001 www.mpls.k12.mn.us/REA/. Minneapolis Public Schools Measuring Up Against High Standards. MPS developed standards-based reading and math tests - Northwest Achievement Levels Tests (NALT). - PowerPoint PPT Presentation
Transcript of Linking Instructional Practices to Value-added Student Learning
Linking Instructional Practices to Linking Instructional Practices to Value-added Student LearningValue-added Student Learning
Minneapolis Public SchoolsMinneapolis Public Schools
November, 2001November, 2001
www.mpls.k12.mn.us/REA/www.mpls.k12.mn.us/REA/

Minneapolis Public SchoolsMinneapolis Public SchoolsMeasuring Up Against High StandardsMeasuring Up Against High Standards MPS developed standards-based reading and
math tests - Northwest Achievement Levels Tests (NALT). All students participate Sensitive to growth Predictive of high stakes outcomes
Developed indicators in concert with stakeholders who are internal and external to the district.
Indicators of school performance are based on multiple indicators. 33 for elementary and middle schools 24 for high schools

Linking Assessments to High Linking Assessments to High Standards:Standards: Choose items for the assessment bank which Choose items for the assessment bank which
directly link to the standards. Use your directly link to the standards. Use your teacher experts, curriculum specialists, and teacher experts, curriculum specialists, and assessment personnel to create the bankassessment personnel to create the bank
““All Means ALL” - create levels of the All Means ALL” - create levels of the assessment which allow for 98% of students assessment which allow for 98% of students being assessedbeing assessed
Find out where the State benchmarks locate Find out where the State benchmarks locate on the scale (linking studies)on the scale (linking studies)
Measure continuous progress towards the Measure continuous progress towards the Standard Standard

Criteria for IndicatorsCriteria for Indicators
Meyer (1996)Meyer (1996) Indicators must measure things that matter Indicators must measure things that matter
or are valued by society (MCA, MBST).or are valued by society (MCA, MBST). Indicators must be able to avoid being Indicators must be able to avoid being
“corrupted.”“corrupted.” inclusion v. exclusion criteriainclusion v. exclusion criteria
Indicators must be able to measure the Indicators must be able to measure the unique contribution schools “add” for each unique contribution schools “add” for each measured outcome.measured outcome.

Northwest Achievement Levels Test Validity Northwest Achievement Levels Test Validity Coefficients with Minnesota State TestsCoefficients with Minnesota State Tests
Grade/Measure Grade 3ReadingMCA
Grade 3MathMCA
Grade 5ReadingMCA
Grade 5MathMCA
Grade 8ReadingMBST
Grade 8 MathMBST
Grade 2 NALTa (n/a) .80(n= 3219)
Grade 3 NALTb .87(n=3785)
.87(n=3640)
Grade 4 NALTa .85(n= 3153)
.86(n=3097)
Grade 5 NALTb .88(n=3533)
.89(n=3484)
Grade 7 NALTc .82(n= 2608)
.88(n= 2631)
aNALT April, 1998 correlation with MCA March, 1999 for same subject area (predictive validity)bNALT April, 1999 correlation with MCA March, 1999 for same subject area (concurrent validity)cNALT April, 1998 correlation with MBST February, 1999 for same subject area (predictive validity)

Linkage with State StandardsLinkage with State Standards
NALT Scale Score Which Predicts Passage of theMinnesota Basic Standards Test (MBST) in 8th Grade
Grade Reading Scale Score Reading Scale Score
3 190 1994 197 2065 204 2146 209 2187 213 2258 218 232

True gain model: Growth True gain model: Growth CurvesCurves
Class of 2005 Longitudinal Reading Gains
190
200
210
220
230
Grade 3
Grade 4
Grade 5
Grade 6
Grade 7
Grade 8
Grade 9
Grade 10
Grade 11
Grade 12
NA
LT
Sc
ale
Sc
ore
(R
as
ch
Mo
de
l)
High Standard
Basic Standard
Class of 2005 (n=2006)

Improving Student Performance Improving Student Performance One Student at a TimeOne Student at a Time
180
190
200
210
220
230
240
250
Grade 2
Grade 4
Grade 6
Grade 8
Grade 10
Grade 12
Josh (AI)
Fahim (AA)
High Standard
Basic Standard

Correlation of Poverty and Math NALT ScoresCorrelation of Poverty and Math NALT Scores
R2 = 0.7901
30
40
50
60
70
0% 10% 20% 30% 40% 50% 60% 70% 80% 90% 100%
Percent free or reduced price lunch
NA
LT M
ath
Ave
rage
NC
E
School P = 44.4 nce

Distribution of school average mathematics gain Distribution of school average mathematics gain scores on the 1999 NALT by free or reduced price scores on the 1999 NALT by free or reduced price
lunch percentages.lunch percentages.
R2 = 0.0074
-3-2-10123456789
10
0% 10% 20% 30% 40% 50% 60% 70% 80% 90% 100%
Percent free or reduced price lunch
NA
LT
Mat
h N
CE
Gai
n
School P = 6.3 nce gain

Percent of Students Making About One Percent of Students Making About One Year Growth or More on NALT Math Year Growth or More on NALT Math
by Racial/Ethnic Categoryby Racial/Ethnic Category
51% 48%53% 53%
60%58% 56%
66% 63% 64%
0%
20%
40%
60%
80%
100%
AmericanIndian
AfricanAmerican
AsianAmerican
HispanicAmerican
WhiteAmerican
Per
cent
age
of S
tude
nts
2000
2001National Norm = 57%

Elementary/Middle QPA Elementary/Middle QPA 33 Indicators33 Indicators
37%
33%
6%
6%
6%
6%6%
Reading
Math
Writing
Behavior
Climate
Attendance
Programs

Special Recognition SchoolsSpecial Recognition Schools www.mpls.k12.mn.us/REA/www.mpls.k12.mn.us/REA/ Meeting Standards 2 years in a row:Meeting Standards 2 years in a row:
Armatage, Bancroft, Barton, Armatage, Bancroft, Barton, Bethune, Bryn Mawr, Bethune, Bryn Mawr, Burroughs, Dowling, Downtown Burroughs, Dowling, Downtown Open, Emerson, Ericsson, Open, Emerson, Ericsson, Field, Hale, Howe, Keewaydin, Field, Hale, Howe, Keewaydin, Kenny, Kenwood, Lake Harriet Kenny, Kenwood, Lake Harriet Upper & Lower, Lincoln, Lind, Upper & Lower, Lincoln, Lind, Longfellow, Loring, Lyndale, Longfellow, Loring, Lyndale, Marcy, Mill City, Pillsbury, Marcy, Mill City, Pillsbury, Seward, Tuttle, Waite Park, Seward, Tuttle, Waite Park, WindomWindom
Meeting Standards first yearMeeting Standards first year Cooper, Hamilton, Northrop, Cooper, Hamilton, Northrop,
Wenonah, WillardWenonah, Willard
““Beat the Odds” Beat the Odds” High ELL, PovertyHigh ELL, Poverty Bancroft, Bethune, Bryn Bancroft, Bethune, Bryn
Mawr, Cooper, Hamilton, Mawr, Cooper, Hamilton, Lincoln, Jenny Lind, Lincoln, Jenny Lind, Longfellow, Lyndale, Longfellow, Lyndale, Tuttle, WillardTuttle, Willard

Characteristics of “Needs Characteristics of “Needs Improvement Schools” in MPSImprovement Schools” in MPS One school in this category two years in One school in this category two years in
a row:a row: Student Stability 78% Student Stability 78% Staff Stability 33% (14/21 new staff)Staff Stability 33% (14/21 new staff) Three principals in three yearsThree principals in three years Low parent choice Low parent choice Higher Poverty (84%)Higher Poverty (84%) Large ELL Population (32%)Large ELL Population (32%)

Characteristics of Characteristics of “Distinguished School” in MPS“Distinguished School” in MPS One school in this category two years in One school in this category two years in
a row:a row: Student Stability 94% Student Stability 94% Staff Stability 87% (3/23 new staff)Staff Stability 87% (3/23 new staff) One principals in three yearsOne principals in three years High parent choice (waiting list)High parent choice (waiting list) Lower Poverty (40%)Lower Poverty (40%) Moderate ELL Population (20%)Moderate ELL Population (20%)

Structured interviews with 3 Structured interviews with 3 Schools that “Beat the Odds”Schools that “Beat the Odds” Process: Interviewed 16 teachers at 3 sites (Lincoln, Lyndale,
Sanford). The teachers were selected by the principal of each site and represented teachers early in their careers, mid-career teachers and veterans.
Key Factors: Staff Stability Administrative Cohesion Unity of purpose Collective Decisionmaking School investment in instruction (mentors, reduced class size) Administrator as instructional leader (principal observations) Direct Instruction/ Mastery Learning Extended class day
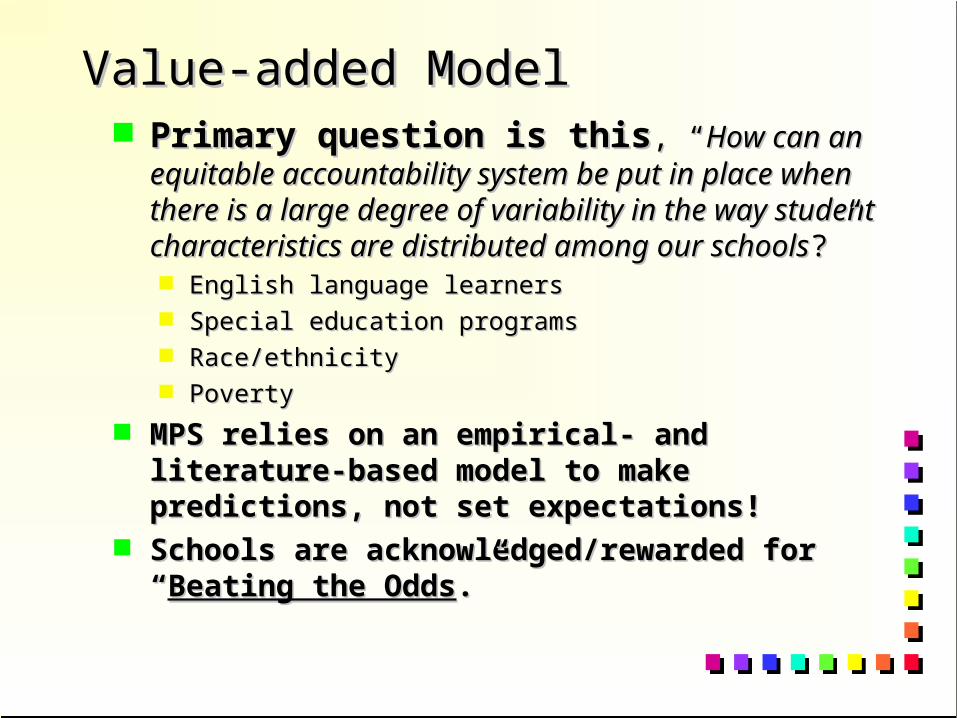
Value-added ModelValue-added Model Primary question is thisPrimary question is this, “, “How can an equitable How can an equitable
accountability system be put in place when there is a accountability system be put in place when there is a large degree of variability in the way student large degree of variability in the way student characteristics are distributed among our schoolscharacteristics are distributed among our schools?”?” English language learnersEnglish language learners Special education programsSpecial education programs Race/ethnicityRace/ethnicity PovertyPoverty
MPS relies on an empirical- and literature-based MPS relies on an empirical- and literature-based model to make predictions, not set expectations! model to make predictions, not set expectations!
Schools are acknowledged/rewarded for “Schools are acknowledged/rewarded for “Beating Beating the Oddsthe Odds.”.”

Value-added Teacher EffectsValue-added Teacher Effects
Post-test reading score=Post-test reading score= Pretest reading scorePretest reading score + Free or reduced price lunch+ Free or reduced price lunch + Racial/ethnic code+ Racial/ethnic code + Neighborhood poverty concentration+ Neighborhood poverty concentration + Lives with both parents code+ Lives with both parents code + Limited English Proficiency status+ Limited English Proficiency status + Special Education status+ Special Education status + Teacher effects+ Teacher effects

Teachers who “beat the odds” in Teachers who “beat the odds” in second grade reading reported: second grade reading reported:
more use of small group instructionmore use of small group instruction more development of word attack skillsmore development of word attack skills more individual student oral readingmore individual student oral reading more guidance during initial practicemore guidance during initial practice more explicit and direct phonics more explicit and direct phonics
instructioninstruction more use of systematic motivation more use of systematic motivation
strategiesstrategies

Current Study: Value-added Math Current Study: Value-added Math and Reading by Grade by School for and Reading by Grade by School for
Students of ColorStudents of ColorEarly Reading (k-3) Reading 3-6 Reading 6-8 Groups Early Math (k-3) Math 3-6 Math 6-8
BARTON X X AA, Hisp X XBETHUNE X AA
BURROUGHS X X AA, Hisp X XDOWLING X AA XDOWNTOWN OPEN AA XEMERSON X Hisp X XHALE X AA,Asian XHOWE X AA X XJEFFERSON X Hisp
KENWOOD Asian XLINCOLN X AA X XLONGFELLOW X AA,AI X XLORING X X AI, Asian
LYNDALE X X AA, Hisp, Asian X XMARCY X AA XOLSON X AA
PILLSBURY AA,AI XSANFORD X AA
SEWARD X AI XSHERIDAN X X AI
WENONAH X AA

Measurement RecommendationsMeasurement Recommendations
Measure students on standards-based Measure students on standards-based assessments as soon as they enter schoolassessments as soon as they enter school
Continuously monitor student progress Continuously monitor student progress towards the standardstowards the standards
Produce individual student growth curvesProduce individual student growth curves Use data to monitor the effectiveness of Use data to monitor the effectiveness of
interventionsinterventions Identify schools and teachers who make Identify schools and teachers who make
exceptional progress with “at risk” studentsexceptional progress with “at risk” students
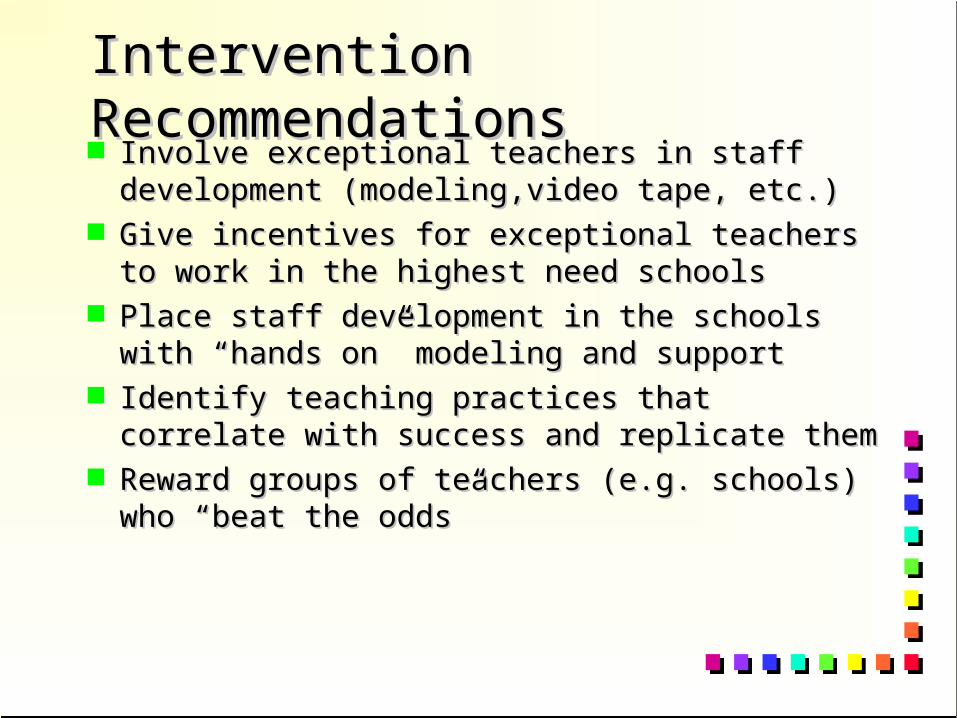
Intervention RecommendationsIntervention Recommendations Involve exceptional teachers in staff development Involve exceptional teachers in staff development
(modeling,video tape, etc.)(modeling,video tape, etc.) Give incentives for exceptional teachers to work in Give incentives for exceptional teachers to work in
the highest need schoolsthe highest need schools Place staff development in the schools with “hands Place staff development in the schools with “hands
on” modeling and supporton” modeling and support Identify teaching practices that correlate with Identify teaching practices that correlate with
success and replicate themsuccess and replicate them Reward groups of teachers (e.g. schools) who Reward groups of teachers (e.g. schools) who
“beat the odds”“beat the odds”