
Linking Data and Process Perspectives for Conformance...
57
Linking Data and Process Perspectives for Conformance Analysis Mahdi Alizadeh * , Xixi Lu, Dirk Fahland, Nicola Zannone, Wil M. P. van der Aalst Eindhoven University of Technology, Eindhoven, Netherlands Abstract The detection of data breaches has become a major challenge for most organizations. The problem lies in that fact that organizations often lack proper mechanisms to control and monitor users’ activities and their data usage. Although several auditing approaches have been proposed to assess the compliance of actual executed behavior, existing approaches focus on either checking data accesses against security policies (data perspective) or checking user activities against the activities needed to conduct business processes (process perspective). Analyzing user behavior from these perspectives independently may not be sufficient to expose security incidents. In particular, security incidents may remain undetected or diagnosed incorrectly. This paper proposes a novel auditing approach that reconciles the data and process perspectives, thus enabling the identification of a large range of deviations. In particular, we analyze and classify deviations with respect to the intended purpose of data and the context in which data are used, and provide a novel algorithm to identify non-conforming user behavior. The approach has been implemented in the open source framework ProM and was evaluated through both controlled experiments and a case study using real-life event data. The * Corresponding author Email addresses: [email protected] (Mahdi Alizadeh), [email protected] (Xixi Lu), [email protected] (Dirk Fahland), [email protected] (Nicola Zannone), [email protected] (Wil M. P. van der Aalst) Preprint submitted to Elsevier September 6, 2017
Transcript of Linking Data and Process Perspectives for Conformance...

Linking Data and Process Perspectives for ConformanceAnalysis
Mahdi Alizadeh∗, Xixi Lu, Dirk Fahland, Nicola Zannone, Wil M. P. van der Aalst
Eindhoven University of Technology, Eindhoven, Netherlands
Abstract
The detection of data breaches has become a major challenge for most organizations.
The problem lies in that fact that organizations often lack proper mechanisms to control
and monitor users’ activities and their data usage. Although several auditing approaches
have been proposed to assess the compliance of actual executed behavior, existing
approaches focus on either checking data accesses against security policies (data
perspective) or checking user activities against the activities needed to conduct business
processes (process perspective). Analyzing user behavior from these perspectives
independently may not be sufficient to expose security incidents. In particular, security
incidents may remain undetected or diagnosed incorrectly. This paper proposes a novel
auditing approach that reconciles the data and process perspectives, thus enabling the
identification of a large range of deviations. In particular, we analyze and classify
deviations with respect to the intended purpose of data and the context in which data
are used, and provide a novel algorithm to identify non-conforming user behavior. The
approach has been implemented in the open source framework ProM and was evaluated
through both controlled experiments and a case study using real-life event data. The
∗Corresponding authorEmail addresses: [email protected] (Mahdi Alizadeh), [email protected] (Xixi Lu),
[email protected] (Dirk Fahland), [email protected] (Nicola Zannone),[email protected] (Wil M. P. van der Aalst)
Preprint submitted to Elsevier September 6, 2017

results show that the approach is able to accurately identify deviations in both data usage
and control-flow, while providing the purpose and context of the identified deviations.
1. Introduction
Large amounts of sensitive data (e.g., customer personal data, corporate secrets) are
often collected and stored by organizations to carry out their businesses. Data are a
valuable asset for organizations and, thus, need to be protected from unauthorized access
and illegitimate usage. Organizations often use process models and security policies
to describe the normative behavior of their IT systems and legitimate usages of data.
However, in practice, organizations may allow users to deviate from the prescribed
behavior in order to efficiently deal with unanticipated circumstances. For example, IT
systems of hospitals often employ the “break-the-glass” functionality to deal with
emergency situations. However, such a functionality can be abused, increasing the risks
of harmful data breaches. Moreover, a user may exploit its credentials to access sensitive
information for personal or financial gain.
Data breaches can have severe financial and legal consequences as well as decrease
a company’s competitive advantages over other companies. For instance, according to a
study conducted by the Ponemon Institute in 350 companies in 2015, the average cost of
data breaches is $3.79 million per incident [42]. Many legal regulations and best practices
such as HIPAA in healthcare, Basel III in finance, and COBIT for IT governance have
been proposed to mitigate the risks of security incidents. These regulations require orga-
nizations to implement internal controls and constantly monitor their business processes
to detect security incidents and respond to them. Moreover, organizations need to learn
from earlier incidents to improve security policies and prevent data breaches in the future.
The continuous monitoring of processes has enabled the collection of event data
that show, for example, which activities users performed, when users accessed certain
2

data and which operations they executed on the data. Alongside process monitoring,
several auditing solutions have been proposed to assist organizations in the analysis
of user behavior (recorded in event logs) with respect to security policies and regulations.
These solutions assess compliance of user behavior either (i) with respect to the access
and usage of sensitive data (data perspective) or (ii) with respect to the activities
performed by users (process perspective). Auditing techniques that operate at the data
level [18, 24, 27, 45] analyze whether a user had the right to perform certain operations
on the data. However, data operations are typically verified individually. This does
not allow for the verification of data protection policies, such as purpose control, that
require analyzing the observed behavior as a whole [39]. On the other hand, techniques
that operate at the process level [11, 12, 19, 39, 46] usually analyze whether a user has
performed the right activity as prescribed by the organization’s processes. In particular,
these techniques focus on the process control-flow and they do not analyze how data
are used within the execution of the process.
Analyzing the observed behavior with respect to the data perspective or the process
perspective alone has therefore two main drawbacks: (i) deviations can remain undetected
and (ii) diagnostics may not provide an understanding of the deviations that occurred,
thus making it difficult for a security analyst to take the measures necessary to respond
to security infringements. These issues are even more critical when considering insider
threats (i.e., security threats originating from within the organization being attacked or
targeted). In fact, without knowing the context in which data are accessed and used, it is
difficult, if not impossible, to discriminate between legitimate and illegitimate behaviors.
In this work, we propose an auditing approach that reconciles the data and process
perspectives, thus enabling the identification of deviations that otherwise would remain
undetected, and providing accurate diagnostics of those deviations. In particular, the
usage of data is analyzed within both the context (defined with respect to the process
control-flow) and the purpose (defined in terms of process activities) for which data were
3

Process model
CRUD matri
x
Compute inter-level alignments
System log
Alignments Inter-level alignments
Observed behaviorModeled behavior
Process perspective
Dataperspective
a4a2 a5a1
a3
e3e2e1 e5e4
e3e2e1 e5e4
Dc
Dr
Mr
Tc
Tu
a4
a3
0a1 a2 a5
Dc
Dr
Tc
Tu Taxonomy
Diagnose
e4
a3
e3e2e1 e5
Dc
TcD
rT
c
Mr T
u
a4a2a1 a5
Compute control-flow alignments
Process log
1
3
2
4
56
7
Figure 1: An overview of the proposed approach, showing how the data and process perspectives are
reconciled.
used. Fig. 1 shows an overview of our approach together with its inputs and outputs. As
shown in the figure, for the analysis of the process perspective, we rely on the notion
of control-flow alignments (º) and, in particular, partially ordered alignments [33],
which provide a robust way to pinpoint the causes of non-conformity between a process
execution recorded in a process log (·) and a process model (¶). The diagnostics
provided by control-flow alignments show the validity of the context in which operations
on data are executed. Moreover, by linking data operations, recorded in a system log
(¹), to control-flow alignments (º), we can check whether the purpose (i.e., the activity)
of a data operation is valid according to the intended usage of data (modeled using a
CRUD matrix (¸) [23]).
By leveraging this reconciled view of the two perspectives, we introduce the notion
of composite moves, representing pairwise matching between activities recorded in a
log and activities in a process model along with the required operations on the data, and
define a taxonomy of the different sorts of composite moves (¼). This taxonomy provides
the basis for an analysis of the causes of non-conformity. Moreover, we propose an
4

algorithm to construct inter-level alignments (»), i.e. alignments consisting of composite
moves, by linking the operations on data recorded in a system log to activities in the
control-flow alignment. Such inter-level alignments enable the analysis of operations
on the data with respect to the context in which those operations are executed. This way
we can provide more accurate diagnostic information about non-conformity taking into
account the purpose of data operations. To the best of our knowledge, this is the first work
that proposes an auditing technique reconciling both the data and process perspectives.
It is worth noting that in this work we assume that the observed behavior is
recorded at both the data and process level. We argue that this assumption is realistic as
demonstrated by BPM platforms like FLOWer (now called Lexmark Case Management)
[48] and Activiti (http://activiti.org/), which provide such functionality.
Also in many other information systems both database updates and activity executions
are recorded (see the change logs in ERP systems and the redo logs in database systems).
Our technique has been implemented as a plug-in of the open source process-mining
framework ProM and evaluated using both synthetic and real-life datasets.
The remainder of the paper is organized as follows. The next section presents
the basic concepts used to represent the process and data perspectives and introduces
background on alignments. Section 3 investigates data breaches and identifies types
of insider threats relating to the data and process perspectives. Section 4 presents a
taxonomy of composite moves and discuss how the identified threats can be captured
in terms of composite moves. Section 5 formally defines inter-level alignments and
presents our approach to construct such alignments. Experimental results are presented
in Section 6. Finally, Section 7 discusses related work, and Section 8 concludes the
paper and provides directions for future work.
5

2. Preliminaries
In this section, we introduce the main concepts and notation used to model the
process and data perspectives of an IT system. An overview of these perspectives and
their interconnections is shown in Fig. 1. Moreover, we introduce preliminaries on
partially ordered alignments [33], which is the basis of the proposed approach.
2.1. Process Perspective
The normative behavior of a system is often described using process models.
Intuitively, a process model describes the activities to be performed to reach a certain
business goal. In this paper, we represent process models using Petri nets.
Definition 1 (Process model). A process model N = (P, T, F, τi, τf ) is a marked
Petri net where P is a set of places; T is a set of transitions; F ⊆ (P × T ) ∪ (T × P )
is the flow relation connecting places and transitions; τi is the initial marking; and τf is
the final marking.
The state of a process model is represented by a marking, i.e. a multiset of tokens on
the places of the net. A process model has an initial marking τi and a final marking τf .
A transition is enabled if each of its input places contains at least a token. When an
enabled transition is fired (i.e., executed), a token is taken from each of its input places
and a token is added to each of its output places. The set of transitions represents the set
of activities in the business process.
Let E denote the universe of all identifiable process-events. A process-event can be
endowed with attributes that provide additional information about the event. Hereafter,
U denotes the universe of attribute names. Given an attribute attr ∈ U , we use partial
function πattr : E 9 Domattr to represent the value of attr for a process-event from
its domain Domattr. In this work, we assume that U includes at least the following
attributes for a process-event ε ∈ E : case, which denotes the process instance in which
6

ε was executed; act, which is used to represent the activity (transition) associated to ε;
and start and complete, which denote the start and completion time of ε respectively.
We assume that πstart(ε) ≤ πcomplete(ε).1
A process model formally describes all possible runs (called process-runs) as
intended by the model, whereas actual process executions (called process-traces) are
recorded in process logs. Hereafter, we refer to a process-event in a process-run as
run-event and to a process-event in a process-trace as trace-event. To distinguish these
events, by convention, we use a to represent run-events and e to represent trace-events.
Definition 2 (Process run). A process-run of a process model N = (P, T, F, τi, τf )
is a partial order2 ϕ = (Aϕ, <ϕ) of run-events Aϕ ⊆ E such that, for each event
a ∈ Aϕ, πact(a) ∈ T and transition πact(a) is enabled after firing all its predecessors
{a′ ∈ Aϕ | a′ <ϕ a}, starting in τi. After firing all a ∈ Aϕ following <ϕ, the final
marking τf should be reached. In addition, for all a, a′ ∈ Aϕ, πcase(a) = πcase(a′).
Given a process model N , we use Σ(N) to denote the (possibly infinite) set of all
possible process-runs of N .3
Fig. 2 shows a process model describing a healthcare process of a hospital for
handling patients. In this net, τi = [p0] and τf = [p11] are the initial and final marking,
respectively. The process starts with the identification of a patient (ip). Then, the patient
is admitted to the hospital (ad ). Next, the patient is visited by its treating doctor (vi ).
The doctor can request basic lab tests (bt) and advanced tests such as MRI scans (at),
1In a classical setting, events are assumed to be atomic. In this paper, however, a process event
is used to represent an activity instance, which encompasses both the start and complete events of the
activity performed.2A partial order is a binary relation ≺ over a set S which is reflexive, antisymmetric and transitive.3In this paper, we are only interested in non-isomorphic runs, i.e. the actual case ids are irrelevant and
just used to group events.
7

rr SynchronousProcess move
r Process move on model
r Process moveon log
evbt trad di
at
( , )( , )
(≫, )
(≫, )
( ,≫)( , )( , )
ctbtadin
ditrip
(≫, )( ,≫)
vivi
lala
vivi
( , )( , )
( , 8)
in
evat
ad
bt
co
Admission
Basic lab test
Consultrequest
Inter-colleague consultation
Evaluate
Advancedtests
P0 Place
Transition
trTreatment prescription
diDischarge and billing
p1
p9
p5
p8
p10
p7 p6
p11ipIdentify patient
p2 viVisit
p3
laLab
appointment
p4
Figure 2: An example of healthcare treatment process.
in
evat
adbt
co
Admission
Basic lab test
Consultrequest
Inter-colleague consultation
Evaluate
Advancedtests
P0 Place
Transition tr
Treatment prescription
di
Discharge and billing
p1
p7
p10
p8
p9
p11
p5 p6
p12
ipIdentify patient
p2 viVisit
p3 laLab
appointment
p4
evbt trad di
ctviad in dir Trace-event ei with
activity “r”
Ordering between trace-events
at
tr
r Run-event ai labeled with “r” in run
Ordering between run-events
ip vi la vi
la bt vi
ctbtad in di
Dc
Dr
Mr
Tc
Tu
Mr
Mr
Mu
Mr
System-event si accessed data D using crudDcrud
r Trace-event ei with activity “r”time
Vc
trvi
Mr
la vi
Tr
Mr
Dr
(a) Process-run
in
evat
adbt
co
Admission
Basic lab test
Consultrequest
Inter-colleague consultation
Evaluate
Advancedtests
P0 Place
Transition tr
Treatment prescription
di
Discharge and billing
p1
p7
p10
p8
p9
p11
p5 p6
p12
ipIdentify patient
p2 viVisit
p3 laLab
appointment
p4
evbt trad di
ctviad in dir Trace-event ei with
activity “r”
Ordering between trace-events
at
tr
r Run-event ai labeled with “r” in run
Ordering between run-events
ip vi la vi
la bt vi
ctbtad in di
Dc
Dr
Mr
Tc
Tu
Mr
Mr
Mu
Mr
System-event si accessed data D using crudDcrud
r Trace-event ei with activity “r”time
Vc
trvi
Mr
la vi
Tr
Mr
Dr
(b) Process-trace
Figure 3: An example of process-run and process-trace.
for which the patient has to make an appointment (la). The results of the lab tests are
evaluated by a specialist (ev). Based on this evaluation, the patient’s treating doctor may
request inter-colleague consultation (co followed by in), request more lab tests, or
prescribe a treatment plan (tr). Finally, the patient is discharged, and a bill is created
and sent to the patient’s insurance company (di).
Fig. 3a shows a process-run ϕ = (Aϕ, <ϕ) of the model, in which Aϕ =
{a1, ..., a10} and the <ϕ relation is defined as follows: a1 <ϕ a2, a2 <ϕ a3,
a3 <ϕ a4, a4 <ϕ a5, a4 <ϕ a6, a5 <ϕ a7, a6 <ϕ a7, a7 <ϕ a8, a8 <ϕ a9 and
a9 <ϕ a10 (and their transitive closure). For example, transition ev = πact(a7) is
enabled after firing πact(a5) = bt and πact(a6) = at, which in turn are enabled after
firing πact(a4) = la. Note that in a process-run all choices have been resolved. Such a
process run is also known as a partially ordered run of a marked Petri net [33].
8

The actual recording of a process execution is called a process-trace.
Definition 3 (Process trace, log). A process-trace σ = (Eσ, <σ) is a partial order
of trace-events Eσ ⊆ E related to a single process execution, i.e. for all e, e′ ∈
Eσ, πcase(e) = πcase(e′), and if e <σ e′, then πcomplete(e) ≤ πstart(e′). A process
log Lp is a set of process-traces.
We assume any two process-traces have disjoint sets of trace-events. Fig. 3b shows
a process-trace σ = (Eσ, <σ), in which Eσ = {e1, ..., e9} and the <σ relation is
defined as follows: e1 <σ e2, e2 <σ e3, e3 <σ e4, e4 <σ e5, e5 <σ e6, e6 <σ e7,
e7 <σ e8 and e8 <σ e9 (and their transitive closure). Note that a process-trace can
deviate from the process model. We will discuss this in more detail in Section 2.3.
2.2. Data Perspective
Data are essential for the execution of business activities. In particular, the execution
of an activity may require performing certain operations on data objects. In this work,
we assume that operations on data objects are always executed in the context of process
activities. This relation is often represented using a CRUD matrix [23]. Intuitively, a
CRUD matrix relates the process logic to the data layer by indicating which operations
on a given data object must or may be executed in order to complete a given activity.
Definition 4 (CRUD). Let T be the set of transitions in a Petri net, Obj a set of data
objects, Op a set of operations on data objects and Mode = {mandatory , optional}
the set of modes. A CRUD matrix Θ consists of a set of CRUD-entries; each entry
q ∈ Θ is a tuple (t, obj, op,mode) ∈ T ×Obj ×Op×Mode.
It is worth noting that certain operations may be required to perform a certain activity
while others may be optional. We capture this using the mode. In particular, the mode
for a CRUD-entry indicates whether a given operation on a data object is “mandatory”
9

Data object
Activity Demographics Lab Test Medical Treatment Invoice Identity
(D) Results (T) History (M) Plan (P) (V) (I)
Identify patient(ip) – – – – – R
Admission (ad) crud – – – – –
Visit (vi) – r r – – –
Lab appointment (la) – – – – – –
Basic lab test (bt) – Cru – – – –
Advanced tests (at) – Cru – – – –
Evaluate (ev) – ru r – – –
Consult request (co) – – – – – –
Inter-colleague consultation (in) – r r – – –
Treatment prescription (tr) – r ru Cru – –
Discharge and billing (di) – – – – Cru –
Clinical trial (ct) – – – – – –
Table 1: CRUD matrix showing the interaction between the activities of the net in Fig. 2 and data objects
with respect to operations create (c), read (r), update (u) and delete (d). Capital letters indicate mandatory
operations and small letters optional operations.
or “optional” to complete a certain activity. Hereafter, we extend the π notation to
CRUD matrices to retrieve the elements of a CRUD-entry, i.e. given a CRUD-entry q =
(t, obj, op,mode), πact(q) = t, πobj(q) = obj, πop(q) = op and πmode(q) = mode.
Table. 1 shows an example of CRUD matrix for the process model in Fig. 2. Four
basic operation types are considered in this matrix, i.e. create (c), read (r), update (u)
and delete (d). Upper-case and lower-case letters indicate whether data operations
are mandatory and optional respectively (i.e., the mode). For instance, when activity
discharge and billing (di) is performed, an invoice must be created for the patient. This
information can be (optionally) read and/or updated during the execution of di.
Operations on data objects are typically recorded by the IT system. Hereafter, we
refer to a recorded operation as system-event and use S to denote the set of all possible
10

evbt trad di
ctviad in dir Trace-event ei with
activity “r”
Ordering between trace-events
at
tr
r Run-event ai labeled with “r” in run
Ordering between run-events
ip vi la vi
la bt vi
ctbtad in di
Dc
Dr
Mr
Tc
Tu
Mr
Mr
Mu
Mr
System-event si accessed data D using crudDcrud
r Trace-event ei with activity “r”time
trvi
Mr
la vi
Tr
Mr
Tr
in
evat
ad
bt
co
Admission
Basic lab test
Consultrequest
Inter-colleague consultation
Evaluate
Advancedtests
P0 Place
Transition
trTreatment prescription
diDischarge and billing
p1
p9
p5
p8
p10
p7 p6
p11ipIdentify patient
p2 viVisit
p3
laLab
appointment
p4
rr SynchronousProcess move
r Process move on model
r Process moveon log
evbt trad di
at
( , )( , )
(≫, )
(≫, )
( ,≫)( , )( , )
ctbtadin
ditrip
(≫, )( ,≫)
vivi
lala
vivi
( , )( , )
( , 8)
Tu
Figure 4: Example of the process-trace and system-trace recorded for a patient that undergoes the healthcare
process in Fig. 2; the events of the two traces are ordered based on its time of execution.
system-events. System-events can be endowed with a set of attributes from the attribute
universe U . In particular, for a system-event s ∈ S , we consider the following attributes:
pur , which is used to relate s to a purpose (in our case, to a process activity); case, which
indicates the process instance in which s was executed; obj, which denotes the data
object on which the operation was performed; op, which denotes the operation that was
executed; and time , which indicates the time s was executed. Similarly to process-events,
we use notation πattr(s) to represent the value of attribute attr for a system-event s.
Definition 5 (System trace, log). A system-trace β = 〈s1, . . . , sn〉 ∈ S∗ is a se-
quence of system-events related to the same case, i.e., for all s, s′ ∈ Sβ , πcase(s) =
πcase(s′) where Sβ = {s1, . . . , sn} ⊆ S denotes the set of system-events occurring in
β. A system event log Ls is a set of system-traces.
Fig. 4 exemplifies a process-trace and the corresponding system-trace. The se-
quence of diamonds, i.e. 〈s1, s2, · · · , s14〉, shows a system-trace consisting of fourteen
system-events. System-event s1 records that an instance of demographic information
(D) has been created, i.e. πop(s1) = c and πobj(s1) = D; s2 records that D has been
read, i.e. πop(s2) = r and πobj(s2) = D; s3 records that the corresponding medical
history (M ) has been read, i.e. πop(s3) = r and πobj(s3) = M . These operations
were executed while trace-event e1 was performed, e.g. πpur (s3) = πact(e1) = ad .
Similar information is visualized for other system-events and trace-events. It is worth
11

noting that in the system-trace medical history (M ) has been read and updated (s7
and s14, respectively), but no activity at the process level was executed concurrently.
2.3. Alignment-based Conformance Checking
Control-flow alignments provide a robust approach to conformance checking. In
this work, we adopt partially ordered alignments [33]. We choose to use partially
ordered alignments rather than sequential alignments [11, 15] because partially ordered
alignments make it possible to explicitly represent concurrency. This allows us to choose
the context for system-events more accurately.
Conceptually, a control-flow alignment relates the events in a process-trace
(Eσ, <σ) to the events in a process-run (Aϕ, <ϕ), thus pinpointing the deviations
causing nonconformity. If a process-trace perfectly fits a Petri net, each “move” in the
process-trace, i.e. an event observed in the process-trace, can be mimicked by a “move”
in the model, i.e. an instance of a transition fired in the net. In cases where deviations
occur, some moves in the process-trace cannot be mimicked by the net or vice versa.
Hereafter, we explicitly denote “no move” by� and use X� = X ∪ {�} to include
the no move in set X . Control-flow alignments consist of three types of process moves
(hereafter called legal moves):
• (e, a) is a synchronous move, if a ∈ Aϕ and e ∈ Eσ;
• (e,�) is a move on log, and e ∈ Eσ;
• (�, a) is a move on model, and a ∈ Aϕ.
Definition 6 (Control-flow alignment). Let σ = (Eσ, <σ) be a process-trace
and ϕ = (Aϕ, <ϕ) a process-run of a process model N . A control-flow alignment
γ = (Mγ , <γ) of σ and ϕ is a partial order, in which Mγ ⊆ E�σ ×A�ϕ \{(�,�)}
is a set of process moves, such that
(1) For all trace-events e ∈ Eσ, there is one and only one (e′, x) ∈Mγ such that
e = e′.
12

rr SynchronousProcess move
r Process move on model
r Process moveon log
evbt trad di
at
( , )( , )
(≫, )
(≫, )
( ,≫)( , )( , )
ctbtadin
ditrip
(≫, )( ,≫)
vivi
lala
vivi
( , )( , )
( , 8)
Figure 5: An example of control-flow alignment between the process-trace in Fig. 3b and the process-run in
Fig. 3a.
(2) For all run-events a ∈ Aϕ, there is one and only one (y, a′) ∈Mγ such that
a = a′.
(3) The ordering <γ respects both <σ and <ϕ, i.e., for each pair of moves
(e, a), (e′, a′) ∈ Mγ , ((e, a) <γ (e′, a′)) ⇔ (((e <σ e′) ∨ (a <ϕ a
′)) and
(e <σ e′)⇒ (a′ 6<ϕ a)).
(4) For each synchronous move (e, a) ∈Mγ , πact(e) = πact(a).
A control-flow alignment between a process-trace and a process model is a partial
order of legal moves such that, ignoring all occurrences of�, the projection on the
first element yields the process-run and the projection on the second element yields
the process-trace.
Fig. 5 shows an example of a control-flow alignment between the process-trace in
Fig. 3b and the process-run in Fig. 3a. The alignment comprises: seven synchronous
moves including (e1, a2) and (e2, a3); two model moves, namely (�, a6) and (�, a7);
and two log moves, namely (e5,�) and (e8,�). In this paper, we assume that control-
flow alignments correctly capture the deviations from the specifications and refer
interested readers to [10, 14, 15] for heuristics to compute reliable alignments.
3. Threat Model
In the security research community and industry, there is consensus that a large
percentage of data breaches that occur in organizations is caused by insider threats.
13

An insider is typically defined as an individual who has some privileged access to
an organization’s IT system [22, 30, 40]. Accordingly, an insider can be a current
employee or officer of the organization but can also be a discharged employee whose
system credentials have not yet been revoked, a masquerader who finds a computer
logged in, or a business partner with access to the system. Malicious, negligent and
accidental behaviors of these users are referred to as insider threats. By misusing their
privileges, insiders can pose serious security threats to an organization driven by various
motivations, e.g. for profit, revenge or curiosity. Insider threats are often considered
more critical than external attacks because insiders have more knowledge about the IT
system than external attackers and have direct access to the organization’s sensitive
information through the information systems they daily use. This makes insider threats
more difficult to detect and prevent.
Several taxonomies have been proposed for insiders and insider threats [21, 31, 41,
43]. Bishop et al. [21] categorize insiders based on their access privileges and their
ability to damage an organization. Predd et al. [43] propose four dimensions, namely
the organization (expressed policy), the environment (laws, economics, ethics), the
individual (perceived policy and intent), and the system (embedded policy) to understand
and categorize the risk of insider threats. Phyo and Furnell [41] classify insider threats
based on the system level (i.e., network, operating system, application, and data) these
threats may be detected and/or monitored.
Based on a literature review and notable security incidents from the past, we have
identified different types of insider threats relating to the process and data levels that can
put an organization at risk:
1. Unauthorized data access: Insiders abuse their privileges and access data for
curiosity or malicious purposes [17, 47]. A typical example of this type of threat
is insider snooping into patient records.
14

2. Unauthorized data modification: Insiders replace or alter existing valid data, or
introduce false data into a file or a database for personal or financial gain. An
example of this type of threat is medical fraud, which involves the payment of
treatment never rendered [29].
3. Data update omission: Insiders accidentally or intentionally do not update the data
as required. This type of threat results in outdated data, which has an impact on
the quality of data and, consequently, on the decisions taken based on these data.
4. Security and privacy control bypass: Insiders circumvent the security and privacy
policies and controls currently in place to access sensitive information or to
perform critical activities. These controls can be required to complete an activity
or be a prerequisite for performing other activities; skipping such steps may
indicate that the opportunity for a fraud or a privacy violation (e.g., processing
personal data without the informed consent of the data subject involved) exists.
5. Secondary usage of data (also called data re-purposing): Insiders process data
for purposes other than those for which the data were originally collected without
data subject consent [28, 39]. Note that this threat differs from an unauthorized
data access (insider threat type 1) because the user is authorized to access the
data but uses these data in a way not allowed.
We now exemplify these threats using the healthcare treatment process in Fig. 2 and
the CRUD matrix in Table 1. In order to handle a patient, healthcare workers involved in
the treatment process should execute the prescribed activities and, in order to complete
these activities, they must or may need to perform certain data operations as defined in
the CRUD matrix. The processing of data should be performed according to security
policies and controls in place. Insiders, however, can circumvent these policies and
controls by misusing their privileges as illustrated by the representative scenarios below:
Scenario 1a. A curious receptionist accesses the medical information of a high-profile
15

patient such as a celebrity or a politician while the patient is being admitted to the
hospital (insider threat type 1) [6]. This information might then be transmitted to the
media, thus, violating the patient’s privacy. This unauthorized access to data (typically
called ‘insider snooping’) can be observed in Fig. 4 by noting that the reading of the
patient’s medical history (M ), recorded by system-event s3, is not allowed for patient
admission (ad) according to the CRUD matrix.
Scenario 1b. A doctor is persuaded by a marketing or pharmaceutical company to
sell medical information of patients. To this end, the doctor retrieves a massive amount
of patient medical records (insider threat type 1) [7, 8]. To cover his actual intent
and thus avoid detection, he accesses the data (M ) for consultation purposes (in),
which is allowed by the CRUD matrix in Tab. 1 and therefore does not raise any
alarm from a data perspective. Nevertheless, this unauthorized access to data can be
detected in Fig. 4 by observing that consultation happened (e8) without being requested
(i.e., a process-event recording the execution of activity ‘in’ can only occur after a
process-event recording the execution of activity ‘co’).
Scenario 2. A nurse intending to harm a patient or obtain reimbursements alters the
patient’s medical record (insider threat type 2) [4]. For example, the nurse may change
blood type and drug allergies or add medical services that were never received by the
patient to the medical records. Such erroneous information could impact care quality or
cause some problems to obtain medical, life or disability insurance. This unauthorized
modification of data can be observed in Fig. 4 by noting that the nurse updates the
medical history (M ) of the patient (s14) without an apparent reason (i.e., no process
activities are executed concurrently).
Scenario 3. Hospitals usually require doctors to create a new treatment plan after
visiting a patient, which is stored in the patient’s medical record. A doctor negligently
16
forgets to update a patient’s medical record with the prescribed treatment (insider threat
type 3) [47]. The missing information may cause other doctors to prescribe conflicting
medication to the patient. This omission can be detected in Fig. 4 by observing that
the treatment plan (P ) has not been created when the treatment is prescribed (e7) as
required by the CRUD matrix of Table 1.
Scenario 4. A patient without medical insurance intending to get expensive medical
care such as complicated surgeries or organ transplants impersonates a well-insured
individual. A receptionist admits the patient to the hospital without verifying her identity
(insider threat type 4) [5, 3]. The hospital provides full-service care and charges the
victim for all the services obtained by the patient. Beyond financial losses, this can cause
other personal consequences for the victim. In particular, the modification of its medical
record with another patient’s lab test results and prescribed treatments can be life
threatening and difficult to erase, which resembles an insider threat of type 2. This threat
can be detected in Fig. 4 by observing that the patient is admitted (ad) to the hospital
(e1) without being previously identified (ip) as required by the process model (Fig. 2).
Scenario 5. A doctor accesses patient information for providing medical treatment,
but later uses this information to conduct a clinical trial (ct) without patients’ consent
and approval of the ethical medical committee of the hospital (insider threat type 5)
[39]. This case of secondary usage of data can be detected in Fig. 4 by observing that,
after some unjustified access to patient medical history (M ), recorded by system-event
s7, the doctor performs a clinical trial (e5), which among others does not contribute
to the fulfillment of the treatment process as defined in Fig. 2.
It is worth noting that the detection and diagnosis of the insider threats described
in the scenarios above requires both control-flow and data perspectives together; one
perspective alone is not sufficient. For instance, the threat in Scenario 1b can only be
17

detected by relating the access to data (recorded by system-events s11 and s12) to activity
in (recorded by trace-event e8). As shown in the next section, looking at control-flow
and data together allows establishing a larger context for deviations, making it possible
to identify richer patterns than when considering each perspective in isolation.
4. Taxonomy of Composite Moves
In order to detect deviations more accurately and provide contextual information for
diagnosis, we relate the four basic elements discussed in Section 2, namely trace-events,
run-events, system-events and CRUD-entries to each other. In particular, we introduce
the notion of composite move, which connects these elements thus reconciling the
process and data perspectives. A trace-event e and a run-event a constitute a control-flow
alignment move (also called process move) that provides the context for a system-event
s, while a CRUD-entry q associates a system-event to a process-event thus providing the
purpose for data operations. Note that different system-events could be associated with
the same context (process move). We define composite moves ((s, q), (e, a)) as follows:
Definition 7 (Composite move). Let Aϕ be the set of run-events in a given process-
run ϕ, Eσ the set of trace-events in a given process-trace σ, Sβ the set of system-events
in a given system-trace β and Θ a CRUD matrix. Let γ = (Mγ , <γ) be a control-flow
alignment defined over Eσ and Aϕ. A composite move is a tuple ((s, q), (e, a)) ∈
(S�β ×Θ�)×M (�,�)γ (with M (�,�)
γ = Mγ ∪ {(�,�)}) such that:
1. if (e, a) = (�,�), then (s, q) = (x,�) with x ∈ Sβ .
2. if q 6=�, then either (a 6=� and πact(q) = πact(a)) or (e 6=� and πact(q) =
πact(e)).
3. if s =� and q 6=�, then πmode(q) = mandatory.
Note that the first if-statement denotes system-events s that may be unrelated to any
process move, for which we use (�,�) (hereafter called no process move) in the
18

definition of composite moves; thus, ((s,�), (�,�)).
Given a composite move ((s, q), (e, a)), we refer to process move (e, a) as the
context in which s is executed. Moreover, we call the activity associated to the process
move (i.e., πact(a) or πact(e)) the purpose of the system-event s. Intuitively, the
purpose denotes the activity for which the data operation is executed [39].
The purpose and context of an operation on data are used to assess its conformity
with the specification. The (non)conformity at the process level provides contextual
information for system-events. In particular, the context determines whether an operation
on the data occurred in accordance with the expected control-flow as defined by the
process model. On the other hand, the (non)conformity of a system-event with respect
to the CRUD matrix is used to determine the validity of the purpose associated to an
operation on the data, i.e. whether an operation is performed for the intended purpose.
Based on the definition of composite moves above, we can distinguish 13 types of
composite moves. Fig. 6 shows a graphical representation of these moves. Hereafter, we
use the row and column number to refer to move types (e.g., (1,2) refers to the move
type located in row one and column two). It is worth noting that move types (1,4), (2,4),
and (4,4) do not correspond to any legal composite moves, as is indicated by the dashes.
Composite moves can be grouped in three categories with respect to data operations:
Legitimate Operations. This group of move types (denoted by a green full line rectangle
in Fig. 6) indicates fully compliant behavior, i.e. an operation on the data was executed
for a valid purpose under a valid context. This group comprises only moves of type (1,1).
Missing Operations. Move types in this group (denoted by a blue dashed line rectangle
in Fig. 6) capture the cases where a mandatory operation on data expected to accomplish
a certain purpose (activity) was not executed (i.e., a system-event is missing). The
missing operation may correspond to a data update or a security check, indicating that an
insider threat of type 3 or 4 (Section 3) occurred respectively. In particular, skipping a
19

Synchronous
Process Move
(e, a)
Process Move
on Model
(�, a)
Process Move
on Log
(e,�)
No Process
Move
(�,�)
Synchronous
Data Move
(s, q)
Synchronous Move(e, a)Move on Model(>>, a)
Move on Log(e, >>)No Move(>>, >>)
CRUD Match(s, r) -MissingAction(>>, r) -CRUD Mismatch(>>, r)
No Required Action -
((s, q), (e, a))
Synchronous Move(e, a)Move on Model(>>, a)
Move on Log(e, >>)No Move(>>, >>)
CRUD Match(s, r) -MissingAction(>>, r) -CRUD Mismatch(>>, r)
No Required Action -
((s, q), (�, a))
Synchronous Move(e, a)Move on Model(>>, a)
Move on Log(e, >>)No Move(>>, >>)
CRUD Match(s, r) -MissingAction(>>, r) -CRUD Mismatch(>>, r)
No Required Action -
((s, q), (e,�))
—
Data Move
on Model
(�, q)
Synchronous Move(e, a)Move on Model(>>, a)
Move on Log(e, >>)No Move(>>, >>)
CRUD Match(s, r) -MissingAction(>>, r) -CRUD Mismatch(>>, r)
No Required Action -
((�, q), (e, a))
Synchronous Move(e, a)Move on Model(>>, a)
Move on Log(e, >>)No Move(>>, >>)
CRUD Match(s, r) -MissingAction(>>, r) -CRUD Mismatch(>>, r)
No Required Action -
((�, q), (�, a))
Synchronous Move(e, a)Move on Model(>>, a)
Move on Log(e, >>)No Move(>>, >>)
CRUD Match(s, r) -MissingAction(>>, r) -CRUD Mismatch(>>, r)
No Required Action -
((�, q), (e,�))
—
Data Move
on Log
(s,�)
Synchronous Move(e, a)Move on Model(>>, a)
Move on Log(e, >>)No Move(>>, >>)
CRUD Match(s, r) -MissingAction(>>, r) -CRUD Mismatch(>>, r)
No Required Action -((s,�), (e, a))
Synchronous Move(e, a)Move on Model(>>, a)
Move on Log(e, >>)No Move(>>, >>)
CRUD Match(s, r) -MissingAction(>>, r) -CRUD Mismatch(>>, r)
No Required Action -((s,�), (�, a))
Synchronous Move(e, a)Move on Model(>>, a)
Move on Log(e, >>)No Move(>>, >>)
CRUD Match(s, r) -MissingAction(>>, r) -CRUD Mismatch(>>, r)
No Required Action -((s,�), (e,�))
Synchronous Move(e, a)Move on Model(>>, a)
Move on Log(e, >>)No Move(>>, >>)
CRUD Match(s, r) -MissingAction(>>, r) -CRUD Mismatch(>>, r)
No Required Action -((s,�), (�,�))
No Data
Move
(�,�)
Synchronous Move(e, a)Move on Model(>>, a)
Move on Log(e, >>)No Move(>>, >>)
CRUD Match(s, r) -MissingAction(>>, r) -CRUD Mismatch(>>, r)
No Required Action -
((�,�), (e, a))
Synchronous Move(e, a)Move on Model(>>, a)
Move on Log(e, >>)No Move(>>, >>)
CRUD Match(s, r) -MissingAction(>>, r) -CRUD Mismatch(>>, r)
No Required Action -
((�,�), (�, a))
Synchronous Move(e, a)Move on Model(>>, a)
Move on Log(e, >>)No Move(>>, >>)
CRUD Match(s, r) -MissingAction(>>, r) -CRUD Mismatch(>>, r)
No Required Action -
((�,�), (e,�))
—
Figure 6: Taxonomy of composite moves. Yellow diamonds represent system-events (s), green diamonds
CRUD-entries (q), yellow squares trace-events (e), and blue squares run-events (a). The full line linking a
process move to a CRUD-entry indicates that the operation is allowed by the CRUD matrix; the dashed line
linking a process move to a system-event indicates that the operation is not allowed by the CRUD matrix.
Composite moves enclosed in a green full line rectangle represent legitimate operations; composite moves
enclosed in a blue dashed line rectangle represent missing operations; composite moves enclosed in a red
dotted line rectangle represent illegitimate operations; composite moves enclosed in a grey rectangle
represent composite moves not involving data.
security control can signal that the opportunity for a fraud exists, whereas skipping a
data update indicates that data may not be reliable.
A move of type (2,1) indicates that the context, in which the missing operation
should have been executed, is valid, i.e. the expected activity was performed. However,
as the required operation was not executed, the corresponding activity has not been
successfully accomplished. For example, consider the normative behavior defined in the
net of Fig. 2 and the CRUD matrix of Table 1. As specified, whenever activity discharge
and billing (di) is executed, an invoice (V) must be created. Skipping this operation
20

may indicate that the provided treatment has not been paid. Moreover, move type (2,1)
captures the threat described in Scenario 3. Here, the doctor executed activity treatment
prescription (tr) as required by the net in Fig. 2 (represented by synchronous process
move (e7, a9) in Fig. 5). However, at the data level, the treatment plan (P) is not created
as demanded by the CRUD matrix in Table 1, resulting in a data move on model.
Move types (2,2) and (2,3) show that the context, in which the missing operation
should have been executed, is also invalid. In particular, a move of type (2,2) indicates
that the expected activity was not executed. This move type can be used to capture the
threat described in Scenario 4. In this scenario, a receptionist may have skipped activity
patient identification (ip) along with the required data operation (i.e., read Identity (I)).
This behavior is captured as a move on log at both process and data level, which is
encoded by move type (2,2). On the other hand, a move of type (2,3) indicates that the
performed activity should not have been performed. In this case, even if we assume that
the operation on data should have been executed to deal with an exceptional situation,
the executed activity would not have been successfully accomplished, thus raising
suspicion about the execution of that activity.
Illegitimate Operations. This group of move types (denoted by a red dotted line
rectangle in Fig. 6) captures illegitimate data operations. A data operation is illegitimate
if it is executed to accomplish an activity for which the operation is not allowed or it
is executed within an invalid context (or a combination of the two). Move types in
this group can be used to capture unauthorized data accesses (insider threat type 1),
unauthorized data modifications (insider threat type 2) and secondary usage of data
(insider threat type 5).
A move of type (3,1) indicates that an activity was executed as prescribed by the
process model (i.e., the context is valid), but the executed operation on data is not
allowed for that activity according to the CRUD matrix. This corresponds, for instance,
21

to the situation described in Scenario 1a. The recorded behavior in Fig. 4 shows that
the receptionist read the patient’s medical history (M), as indicated by system-event
s3, when admitting the patient to the hospital (trace-event e1). While admission was
performed as expected (denoted by synchronous process move (e1, a2) in Fig. 5), the
data operation recorded by s3 is not allowed for patient admission according to the
CRUD matrix in Table 1. Thus, this move type can reveal cases of insider snooping, in
which a user performs an unauthorized access to data within the execution of its duties.
Move types (1,2) and (1,3) indicate that the context is invalid and, thus, the operation
on data is illegitimate. For example, move type (1,3) can be used to capture the situation
described in Scenario 1b. As shown in Fig. 4, the doctor accessed the medical history
(M) and lab test results (T) of several patients (recorded by system-events s11 and s12
respectively) for inter-colleague consultation (in). These data operations are allowed for
inter-colleague consultation (in) according to the CRUD matrix. However, activity in,
recorded by trace-event e8, was executed illegally as shown by log move (e8,�) of the
control-flow alignment in Fig. 5. Therefore, the context of system-events s11 and s12 is
invalid. The doctor may have faked (a portion of) the process execution, in this case
inter-colleague consultation (in), to justify the data access.
Move type (3,3) captures the cases in which both the context and the purpose of
an operation on the data are invalid. Move type (3,2) is similar to move type (3,3),
but in this case the expected activity has not been executed. In contrast, a move of type
(3,4) indicates that the purpose of the executed operation on the data does not match any
control-flow alignment move. Therefore, this operation was performed out of context.
Move type (3,4) can be used, for instance, to capture what happened in Scenario 2. As
shown in Fig. 4, a patient’s medical history (M) was updated by a nurse (system-event s14)
after the patient was discharged (trace-event e9). This operation cannot be linked to any
process move and, thus, its execution cannot be justified. Move type (3,4) can also provide
evidence of other threats like unauthorized data access and secondary usage of data. For
22

instance, in Scenario 5 a doctor accessed a patient’s medical history (M) without an ap-
parent reason (i.e., out of context) while providing medical treatment, denoted by system-
event s7, and at a later time conducted a medical trial using those data (trace-event e5).
It is worth noting that move types (4,1), (4,2) and (4,3) correspond to situations in
which no operation on data is required to be executed according to the CRUD matrix.
For these composite moves, the observed behavior at the data level coincides with the
specification. At the process level, they correspond to control-flow alignment moves (see
Section 2.3). Specifically, move type (4,1) is a synchronous move not involving data.
Move types (4,2) and (4,3) represent the standard process moves on model and process
moves on log (without any data access) respectively.
One can easily observe that some types of deviations identified in Fig. 6 may remain
undetected if the data and process perspectives are not reconciled. Consider, for instance,
moves of type (2,1). This type of moves encompasses a synchronous process move and,
thus, complies with the specifications from the process perspective. On the other hand,
auditing techniques operating at the data level only assess the compliance of operations
on data that have been executed and are not able to detect that a certain operation was
not executed. Therefore, moves of type (2,1) would remain undetected by considering
the data and process perspectives independently. For similar reasons, the other types of
missing operations (i.e., move types (2,2) and (2,3)) cannot be diagnosed properly
and, in particular, cannot be distinguished from other deviation types (e.g., from move
types (1,2) and (1,3) respectively). More in general, it is easy to observe that auditing
techniques operating at the data level are not able to detect missing operations and some
cases of illegitimate operations, namely moves of types (1,2) and (1,3). On the other
hand, using auditing techniques operating at the process level moves of type (2,1), (3,1)
and (3,4) may be considered as a legitimate behavior. We argue that, only through
identifying the context and purpose in which operations on data are executed, one can
23

gain a clear understanding of the infringements that occurred.
It is worth noting that there is not a one-to-one relation between the insider threats
identified in Section 3 and the composite moves in Fig. 6. Different threat types might
be captured by the same composite move, and a threat of a certain type might be
captured by different composite moves. Moreover, threats can manifest as combination
of composite moves (e.g., Scenario 5). Actually, composite moves pinpoint where
the observed behavior differs from the specification and provide richer diagnostic
information about deviations. The interpretation of non-conforming behavior and, thus,
the identification of the type of threat that occurred, however, requires knowledge of the
application domain and, in particular, of the activities and data operations involved in the
composite moves. For instance, data update omission (insider threat type 3) involves the
skipping of update operations, whereas security and privacy control bypass (insider
threat type 4) requires the skipping of security and privacy controls. In essence, our
approach does not aim to replace the role of the auditors in the auditing process. Rather,
it aims to assist auditors in the analysis of non-conforming behavior by providing a
better understanding of deviations and thus in choosing appropriate mitigation actions.
5. Inter-Level Alignments
Composite moves reconcile the process and data perspectives, thus enabling the
identification of deviations that otherwise would remain undetected, and providing
accurate diagnostics of those deviations. As discussed in the previous section, diagnostic
information provided by composite moves provides a valuable support to analysts in the
identification of several insider threats as the ones described in Section 3. However,
determining which composite moves should be used to capture the actual usage of data
requires knowledge of the process model and of the process execution at hand. To this
end, as illustrated in Fig. 1, we assume that diagnostic information at the process level
24

(in form of control-flow alignments) is available. Intuitively, this information is used to
drive the analysis of system logs. This design choice is motivated by the fact that the
context (represented by control-flow alignment moves) can help establish which data
operations are expected to be executed in order to successfully complete the execution of
the business process.
To check the compliance of system-traces with respect to control-flow alignments
(thus verifying their contexts) and a CRUD matrix (thus verifying their purposes),
we introduce the notion of inter-level alignments and then discuss the approach for
computing them.
5.1. Defining Inter-Level Alignments
An inter-level alignment is a sequence of composite moves, associating the system-
events in a system-trace to the moves of a control-flow alignment and entries in a CRUD
matrix.
Definition 8 (Inter-level alignment). Let β be a system-trace, Sβ a set of system-
events in β, Θ a CRUD matrix and γ = (Mγ , <γ) a control-flow alignment between
a process-trace σ and a Petri net N . An inter-level alignment ψ is a sequence of
composite moves 〈(w1,m1), ..., (wi,mj), ..., (wn,mk)〉, with (wi,mj) = ((si, qi),
(ej , aj)) ∈ (S�β ×Θ�)×M (�,�)γ , such that
1) for each system-event s ∈ Sβ , there is one and only one composite move
((si, qi), (ej , aj)) ∈ ψ such that si = s;
2) for each process move m ∈ Mγ , there is at least one composite move
((si, qi), (ej , aj)) ∈ ψ such that (ej , aj) = m;
3) for each mandatory CRUD-entry x ∈ Θ, if there is a move (e, a) ∈Mγ such
that πact(x) = πact(e) or πact(x) = πact(a), then there is ((s, q), (e, a)) ∈ ψ
with q = x;
25

4) composite moves respect the ordering of system-events in β;
5) composite moves respect the ordering <γ of Mγ , i.e., for 1 ≤ x < y ≤ k,
my 6<γ mx.
To properly link the data and process perspectives, we introduce a set of criterion
functions Λ and a cost function κ: criterion functions are used to assess the legality of
composite moves, whereas the cost function is used to assess their quality.
Definition 9 (Legal inter-level alignment). A criterion function λ is a Boolean
function of arity at least 1 where the first parameter is a composite move and the other
parameters are additional inputs needed to verify the validity of the composite move
against a given criterion. Let λ be a criterion function of arity m+ 1 (with m ≥ 0);
λ((w,m), x1, . . . , xm) returns true if composite move (w,m) is legal according to
the criterion defined by λ and false otherwise. Let Λ = {λ1, · · ·λn} denote a set
of criterion functions. An inter-level alignment 〈(w1,m1), ..., (wn,mk)〉 is legal if
and only if each of its composite moves (wi,mj) is legal according to every criterion
function in Λ, i.e., for all λk ∈ Λ, λk((wi,mj), x1, . . . , xm) = true (with m+ 1 the
arity of λk).
In essence, we use criterion functions to assess the legality of linked system-events
and process moves. Note that, besides a composite move, a criterion function can
rely on other artifacts (e.g., control-flow alignments) depending on the criterion used
to determine the legality of composite moves. For example, if events have timestamps,
we can define a criterion function λtime to assess whether system-events are associated
with trace-events that happened concurrently. This function takes two parameters:
a composite move and a control-flow alignment. Let w = (s, q) and m = (e, a);
λtime((w,m), γ) = true if πstart(e) ≤ πtime(s) ≤ πcomplete(e), otherwise false .
Here, the control-flow alignment γ is needed to estimate the time attributes of process
26

(e, a) (�, a) (e,�) (�,�)
(s, q) 0 2 2 –
(�, q) 1 2 2 –
(s,�) 3 4 4 5
(�,�) 0 1 1 –
Table 2: An example of a cost function that assigns a cost to each composite move according to the move
types in Fig 6.
moves on model. As no trace-event is associated to these moves, their start and
completion time cannot be derived from any process-event directly. However, we
can assume that these missing activities should have been executed after the previous
trace-event and before the next trace-event. Using this assumption, criterion function
λtime determines the validity of potential links between system-events and these moves.
Moreover, if system-events have attribute pur indicating the purpose (activity) for which
a certain operation on data was executed, we can define a unary criterion function λpur
where λpur ((w,m)) = true if πpur (s) = πact(e) ∨ πpur (s) = πact(a), otherwise
false . Criterion functions will help us select legal composite moves while leveraging
event attributes. The cost function is then used to define optimal inter-level alignments.
Definition 10 (Optimal inter-level alignment). Let Ψ denote the set of all legal
possible inter-level alignments between a system-trace β, a control-flow alignment
γ and a CRUD matrix Θ. A cost function κ assigns a predefined cost to each type
of composite move. An inter-level alignment ψ ∈ Ψ is optimal if and only if for all
ψ′ ∈ Ψ, κ(ψ) ≤ κ(ψ′).
Table 2 exemplifies the standard cost function used in this paper. The number in
each cell represents the cost assigned to the composite move in the same cell in Fig. 6.
Let us consider the control-flow alignment in Fig. 5, the system-traces in Fig. 4 and the
CRUD matrix in Table 1. Fig. 7 shows two inter-level alignments ψ1 and ψ2, proposing
27

ad
rr SynchronousProcess move
r Process move on model
r Process moveon log
evbt trad di
at
( , )( , )
(≫, )
(≫, )
( ,≫)( , )( , )
ctbtadin
ditrip
(≫, )( ,≫)
vivi
lala
vivi
( , )( , )
( , 8)
in
evat
ad
bt
co
Admission
Basic lab test
Consultrequest
Inter-colleague consultation
Evaluate
Advancedtests
P0 Place
Transition
trTreatment prescription
diDischarge and billing
p1
p9
p5
p8
p10
p7 p6
p11ipIdentify patient
p2 viVisit
p3
laLab
appointment
p4
ctbt di
( , 2)
c
( , 3)( ,≫)
r
( , 5)( , 6) ( , 8)
( , 11)M
( ,≫)
u
trvi
( , 4)
la vi
T( , 9)
( , 10) ( , 14)
r
evbtip la vi
Dr
DrM cT
uT
c rM
ditrr
TrM
cP
rM V
cM
adrM
inc
T
at
(≫, 7)(≫, 12)
( , 13)(≫, 15)
( , ) ( , )( ,≫)
( , ) ( , )(≫, ) ( ,≫)( , ) ( , ) ( , 8)
vi(≫, )
ad
(≫, )
ctbt
( , 2)
c
( , 3)( ,≫)
r
( , 5)( , 6) ( , 8)
( , 11)
trvi
( , 4)
la vi
T( , 9)
( , 10)
evbtip la vi
Dr
DrM cT
uT
c rM
trr
TrM
cP
rMM
adc
T
at
(≫, 7)(≫, 12)
( , 13)
( , ) ( , ) ( , )(≫, ) ( ,≫)( , ) ( , ) ( , 8)
vi(≫, )
(a) Inter-level alignment
(b) Inter-level alignment
rI
rI T
uT
( ,≫)
di
( , 14)
r
dicr
M
in( ,≫)
( , )
Tu
T( ,≫)
(≫, 1)
(≫, 1)
M( ,≫)
uV
(≫, 15)
Figure 7: Construction of two inter-level alignments, each as a sequence of composite moves between the
net in Fig. 2 and the recorded events in Fig. 4; the differences between the two are highlighted using red
rectangles.
a sequence of composite moves.4 For example, for ψ1, system-event s6 can be linked
to synchronous process move (e4, a5) based on the timestamps and then associated with
CRUD-entry q6 = (bt, T, u, optional), which results in ((s6, q6), (e4, a5)), a syn-
chronous composite move on both perspectives with cost 0 according to the cost function
in Table 2. However, it is also legal to associate s6 to model move (�, a6), resulting in
composite move ((s6, q6), (�, a6)). The total cost of ψ1 and ψ2 is 25 and 27 respec-
tively. Let assume πpur (s6) = bt, then criterion function λpur would make ψ2 illegal.
Such inter-level alignments provide for each system-event its purpose and con-
text, allowing for more accurate diagnosis. Consider, for example, composite move
((s3,�), (e1, a2)) ∈ ψ1. This move shows that, although the read operation on M
has a valid context, it is not allowed by the CRUD matrix and, thus was executed
without a legitimate purpose. A possibly more severe deviation is composite move
((s13,�), (e8,�)), which not only is performed for an illegitimate purpose, but also
4The number of the CRUD-entries in Fig. 5 reflects their order of appearance in the alignment and is not
related to their appearance in the CRUD matrix of Table 1.
28
in an invalid context (process move on log). The fact that the activity of e8 (in) was
not allowed during that phase of the process makes s13 more suspicious. In addition
to more accurate diagnosis, leveraging the context, our approach can detect deviations
that otherwise would remain undetected. For example, if we consider composite
move ((s12, q14), (e8,�)), the read operation on T was allowed by the CRUD matrix;
without considering the context (e8,�), one may consider such an operation to be
legitimate. However, the process move on log (e8,�) shows that the context, in which
s12 was executed, is actually invalid as the activity should not have been performed.
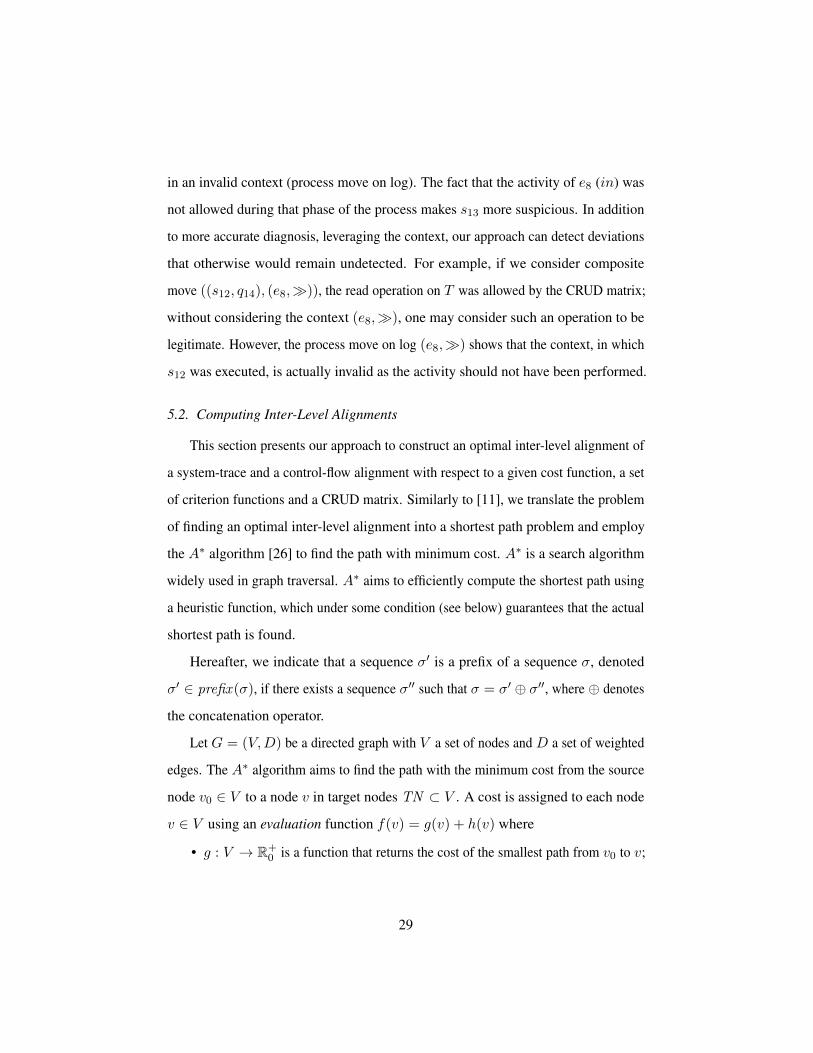
5.2. Computing Inter-Level Alignments
This section presents our approach to construct an optimal inter-level alignment of
a system-trace and a control-flow alignment with respect to a given cost function, a set
of criterion functions and a CRUD matrix. Similarly to [11], we translate the problem
of finding an optimal inter-level alignment into a shortest path problem and employ
the A∗ algorithm [26] to find the path with minimum cost. A∗ is a search algorithm
widely used in graph traversal. A∗ aims to efficiently compute the shortest path using
a heuristic function, which under some condition (see below) guarantees that the actual
shortest path is found.
Hereafter, we indicate that a sequence σ′ is a prefix of a sequence σ, denoted
σ′ ∈ prefix (σ), if there exists a sequence σ′′ such that σ = σ′ ⊕ σ′′, where ⊕ denotes
the concatenation operator.
Let G = (V,D) be a directed graph with V a set of nodes and D a set of weighted
edges. The A∗ algorithm aims to find the path with the minimum cost from the source
node v0 ∈ V to a node v in target nodes TN ⊂ V . A cost is assigned to each node
v ∈ V using an evaluation function f(v) = g(v) + h(v) where
• g : V → R+0 is a function that returns the cost of the smallest path from v0 to v;
29

• h : V → R+0 is a heuristic function that estimates the cost of the path from v to
its preferred target node.
Function h is said to be admissible if it returns a value that is guaranteed to under-
estimate the cost of a path from a node v′ ∈ V to any target node v′′ ∈ TN , i.e.
g(v′) + h(v′) ≤ g(v′′). If h is admissible, then A∗ guarantees that the path found
by the algorithm has the minimum cost.
The algorithm also requires that the number of paths with zero cost between nodes
in the graph to be finite. To solve this problem, we use a pragmatic approach to ensure
that each edge in the graph has cost greater than zero along the lines suggested in [9].
Given a cost function κ1, a new cost function κ2 is generated by adding a negligibly
small constant ε > 0 to every cost as defined in κ1. Then, the algorithm uses κ2 to find
the path with minimum cost. Note that ε should be significantly lower than all non-zero
costs in the original cost function, otherwise the obtained path may not be the one with
minimal cost. Once the path ν with minimal cost is found, its cost with respect to κ1 can
be simply obtained by subtracting the additional cost introduced by κ2, i.e. |ν| × ε, from
the obtained cost. For the sake of clarity, hereafter, we omit ε and use the cost function
in Table 2 in the example. However, our implementation of the approach automatically
transforms this cost function as described above to find optimal inter-level alignments.
Employing A∗ to find the optimal inter-level alignment between a system-trace and
a control-flow alignment requires defining an appropriate search space:
Definition 11 (Search space). Let β be a system-trace, γ = (Mγ , <γ) the control-
flow alignment between a process-trace σ and a Petri net N , Θ a CRUD matrix and Ψ
be the set of all possible legal inter-level alignments between β and γ. The search space
is a graph G = (V,D) where V is the set of all prefixes of inter-level alignments:
V = {µ | ψ ∈ Ψ ∧ µ ∈ prefix (ψ)}.
and D is the set of edges (µ′, µ′′) ∈ V × V , where µ′′ is obtained by adding one
30

composite move to µ′ such that µ′′ is a prefix of an inter-level alignment:
D = {(µ′, µ′′) | ∃(w,m) ∈ ((S�β ×Θ�)×M (�,�)γ ) s.t.
µ′′ = µ′ ⊕ 〈(w,m)〉 ∧ ψ ∈ Ψ ∧ µ′′ ∈ prefix (ψ)}.
In this search space, the source node is the empty sequence v0 = 〈〉 and the target
nodes are all possible legal inter-level alignments, i.e. TN = Ψ. As each node in the
graph is associated with a prefix of an inter-level alignment and vice versa, we use this
prefix to refer to that node. The cost associated to a path leading from the source node to
µ ∈ V is defined as follows:
g(µ) =∑
(w,m)∈µκ((w,m)).
where κ denotes the cost of each composite move according to the given cost function
(see Table 2).
To guide the state space exploration of theA∗ algorithm, a heuristic function needs to
be defined. We can observe that each system-event in a system-trace must appear in some
composite move associated to a target node. Thus, the number of steps required to reach
an inter-level alignment from a certain state is lower bounded by the number of system-
events that have not been considered in the sequence of composite moves associated
to that state. These remaining system-events may appear in various move types, i.e. the
move types shown in the first and third rows of Fig. 6. The heuristic function employed
in this work estimates the cost of reaching a target node by multiplying the minimum
cost associated to these moves (according to a given cost function) by the number
of system-events that still need to be replayed. (Recall that a heuristic function is only
admissible if it underestimates the cost of a path from a node to a target node.)
Algorithm 1 represents how the A∗ algorithm computes an optimal inter-level
alignment. The algorithm keeps a priority queue of nodes to be visited: higher
priority is given to nodes with lower costs. First, the queue is initialized with the
31

Algorithm 1: Compute an optimal inter-level alignmentInput :control-flow alignment γ, system-trace β, CRUD matrix Θ, set of criterion
functions Λ, cost function k
Output : inter-level alignment with the lowest total cost
1 priorityQueue.enqueue(〈〉, 0);
2 while priorityQueue.size 6= 0 do
3 µ← priorityQueue.dequeue();
4 if µ ∈ Ψ then
5 return µ;
6 foreach µ′ ∈ successorγ,β,Θ,Λ(µ) do
7 f(µ′)← g(µ′) + h(µ′);
8 priorityQueue.enqueue(µ′, f(µ′));
9 end
10 end
source node (line 1). Then, in each iteration, the node µ with the lowest cost is
taken from the priority queue (line 3). If µ belongs to the target set, the algorithm
ends returning node µ (lines 4-6). Otherwise, its direct successors are explored.
We use function successorγ,β,Θ,Λ(µ) to identify the set of all successors of node
µ = 〈((s1, q1), (e1, a1)), . . . , ((sm, qm), (em, am))〉. This set consists of all nodes
µ′ that can be obtained by adding one composite move ((sn, qn), (en, an)) ∈ (S�β ×
Θ�)×M (�,�)γ to µ such that:
1) the sequence 〈s1, . . . , sm, sn〉, ignoring all occurrences of�, is a prefix of β;
2) (en, an) = (�,�) or, for each ((s, q), (e, a)) ∈ µ, (en, an) 6<γ (e, a) and for
all (e, a) ∈Mγ , if (e, a) <γ (en, an) then (e, a) ∈ {(e1, a1), . . . , (em, am)};
3) (en, an) = (�,�) or, for each ((s, q), (e, a)) ∈ µ such that (e, a) <γ
(en, an) and for each mandatory CRUD-entry q ∈ Θ such that πact(q) = πact(e)
or πact(q) = πact(a), there exists at least one ((si, qi), (e, a)) ∈ µ with qi = q;
32

4) for all λ ∈ Λ, λ(((sn, qn), (en, an)), x1, . . . , xk) = true.
Intuitively, the direct successors of a node is the set of nodes µ′ that can be obtained
by adding one (legal) composite move to µ according to a given set of criterion functions.
After associating a cost to each of these nodes, they are inserted into the priority queue
(lines 7-10) and the search continues until a target node is reached.
Fig. 8 shows the portion of the search space that Algorithm 1 constructs to find
the optimal inter-level alignment of the system-trace in Fig. 4 and the alignment in
Fig. 5 according to the cost function in Table 2. Each node, represented by a circle,
represents the cost assigned to the node itself. The nodes are also associated with
an index, i.e. #0, . . . ,#12, indicating the order in which they are visited. An edge
between two nodes µ′ and µ′′ is labeled with the move ((s, q), (e, a)) with which µ′
has been extended, i.e. µ′′ = µ′ ⊕ 〈((s, q), (e, a))〉.
To speed up the computation, we prune the search space. This optimization follows
from the observation that the same composite moves but with different ordering may
appear in different constructed inter-level alignments. In particular, this happens when
the sequence contains composite moves corresponding to missing operations. In fact,
composite moves indicating missing operations can be observed before, between or after
other composite moves with the same alignment moves. This re-ordering does not change
the cost of inter-level alignments. Hence, it is not necessary to consider all these cases
when we search for the shortest path. Thus, we only consider one of these possibilities,
i.e. the case where the composite moves corresponding to missing operations appear
after other composite moves in a certain order. For instance, consider the search space
in Fig. 8. According to our optimization, as the node associated with #11 contains
((�, q7), (�, a6)), it is not allowed to be extended with ((s6, q6), (�, a6)). A node
with these composite moves is explored if and only if ((s6, q6), (�, a6)) appeared
before ((�, q7), (�, a6)) in the sequence. This way, we avoid exploring the paths
33

f = 0#0
((�,q1),(�,a1))
��f = 2
#1
((s1,�),(�,�))
vv
((s1,q2),(e1,a2))
��f = 7 f = 2
#2
((s2,�),(�,�))
vv
((s2,q3),(e1,a2))
��f = 7 f = 2
#3
((s3,�),(�,�))
vv
((s3,�),(e1,a2))
��f = 7 f = 5
#4
((s4,�),(�,�))
vv
((s4,q4),(e2,a3))
��f = 7 f = 5
#5
((�,�),(e3,a4))
��f = 5
#6
#9
((�,q5),(e4,a5))
tt
((�,q7),(�,a6))
}} #7
((s5,q5),(e4,a5))
!!((s5,q7),(�,a6))��
((s5,�),(�,�))
**f = 6
((�,q7),(�,a6))
��
((s5,�),(�,�))
!!
f = 7 f = 7 f = 5
#10((s6,q6),(�,a6))
!!#11
((�,q7),(�,a6))
}} #8
((s6,q6),(e4,a5))
��
((s6,�),(�,�))
((
f = 10
f = 8 f = 11 f = 7
((s6,q6),(e4,a5))
vv
((s6,q6),(�,a6))
}}((s6,�),(�,�))��
f = 5
#12
((�,q7),(�,a6))
��
f = 6
((�,q7),(�,a6))
��
f = 10
f = 7 f = 8 f = 12 f = 7
((s7,q8),(�,a7))
��((s7,�),(�,�))
""
f = 8
. . . . . .
Figure 8: Portion of the search space constructed to find an optimal inter-level alignment of the system-trace
in Fig. 4 and the control-flow alignment in Fig. 5 based on the cost function in Table 2. Nodes in the search
space are represented by circles, which are labeled with the cost assigned to them by the evaluation function
f . Numbers associated to nodes represent the order in which they are visited. Gray circles represent pruned
nodes.
consisting of the permutations of composite moves that have already been considered,
speeding up the search for the shortest path.
34

Figure 9: Screenshot of the implemented approach in ProM, showing the inter-level alignment constructed
between the control-flow alignment in Fig. 5 and the system-trace in Fig. 4
6. Evaluation
We implemented the approach illustrated in Fig. 1 as a plug-in named Inter-
Level Replayer for the Security package within the ProM framework (http://
www.promtools.org). The plug-in takes as input control-flow alignments, a
system event log and a CRUD matrix, and computes an inter-level alignment for each
system-trace and its corresponding control-flow alignment. The output of the plug-in
consists of the computed inter-level alignments and can be used by other plug-ins for
visualization or further analysis. Fig. 9 shows a screenshot of the ProM plug-in.
We evaluated the proposed approach using both synthetic and real-life logs. The aim
of the evaluation with the synthetic data is to perform controlled experiments with a
known ground truth and assess the accuracy of the obtained diagnostics. We used a
real-life case study to show that the approach provides useful insights into deviations and
is robust to logs and models with real-life complexity. The experiments were performed
using a machine with 3.4 GHz Intel Core i7 processor and 16 GB of memory.
6.1. Synthetic Data
For the experiments with synthetic data, we designed the process model in Fig. 2
using CPN tools (http://cpntools.org) and generated 10000 process-traces
and 10000 system-traces consisting of 96994 trace-events and 140999 system-events
35

Case 1 Case 7
P: 0% P: 10%
R: 0% R: 0%
Case 8
P: 10%
R: 5%
Case 2 Case 3 Case 4 Case 5 Case 6
P: 0% P: 5% P: 10% P: 15% P: 20%
R: 10% R: 10% R: 10% P: 10% R: 10%
Case 9
P: 10%
R: 15%
Case 10
P: 10%
R: 20%
Figure 10: Experiment Settings. P indicates the percentage of attack patterns and R the percentage of
random noise.
respectively (available at [1]). Trace- and system-events both carry timestamps (ac-
cording to the same global clock in the simulation). Moreover, for system-events we also
recorded the activity of the generating trace-event (i.e., the pur attribute of Section 5.1).
In order to assess the capability of detecting deviations and the accuracy of the obtained
diagnostics, we manipulated the generated process-traces and system-traces. In particular,
we inserted attack patterns corresponding to the threat scenarios 1a, 1b, 2,. . . , 5 described
in Section 3 along with random noise (i.e., adding or removing some events). In a
series of experiments, we varied the percentage of attack patterns in the traces (denoted
by P: 0%, 5%, 10%, 15%, 20%) while leaving the random noise constant (denoted
by R: 10%). In a second series of experiments, we increased the percentage of random
noise (R: 0%, 5%, 10%, 15%, 20%) while leaving the percentage of attack patterns
unchanged (P: 10%). We also considered the case where no attack patterns and random
noise were introduced in the log, which will serve as the reference case. In total, we
analyzed ten cases, which are illustrated in Fig. 10.
36

Control-flow alignments reflecting the noise introduced in the process-traces were
constructed. We computed the inter-level alignments for every constructed control-flow
alignment and its corresponding system-trace. To determine the legality of composite
moves, we considered the two criterion functions described in Section 5.1. The first
criterion function (λtime ) links system-events to alignment moves using the time
attribute of system-events ensuring that they fall between the start and completion
time of process moves. The second criterion function (λpur ) uses the pur attribute
of system-events to ensure that the purpose of system-events coincides with the activity
associated to the process move. For the experiments, we used two sets of criterion
functions: CF 1 = {λtime , λpur} and CF 2 = {λtime}. In the experiments, we used
the cost function described by Table 2.
To assess the approach’s capability of detecting deviations and the accuracy of
the obtained diagnostics, we computed precision, recall and the F1-measure. Following
standard practice [38], precision is computed as the fraction of the detected deviations that
are actual deviations, whereas recall is computed as the fraction of the inserted deviations
(which is known since deviations were introduced artificially) that are detected. The
F1-measure is the harmonic mean of precision and recall. For each case, the percentage
of the detected attack patterns was assessed. We also measured the time needed to
construct an inter-level alignment (after the control-flow alignment had been computed).
Table 3 reports the results of the experiments for different levels of noise. Overall,
the results show a high precision and recall, varying between 0.98 and 0.99 for CF 1
and between 0.93 and 0.95 for CF 2. We can observe that using both the time and
pur attributes (CF 1) provides more accurate results compared to using only the time
attribute (CF 2). The main reason is that, in the presence of concurrent process moves,
the time of system-events can fall between the start and completion time of more than
one process move. Without the pur attribute, it is easy to establish incorrect links
between system-events and process moves. For example, consider the control-flow
37

CF 1 (time and pur ) CF 2 (time)
Noise (P,R) Precision Recall F1-MeasureDetected Computation
Precision Recall F1-MeasureDetected Computation
Patterns (%) Time (ms) Patterns (%) Time (ms)
Case 1 (0%, 0%) 1.00 1.00 1.00 - 0.28 0.97 0.97 0.97 - 0.80
Case 2 (0%, 10%) 0.99 0.99 0.99 - 0.58 0.95 0.95 0.95 - 1.97
Case 3 (5%, 10%) 0.99 0.99 0.99 99 0.36 0.95 0.95 0.95 95 3.08
Case 4 (10%, 10%) 0.99 0.99 0.99 99 0.45 0.94 0.95 0.94 94 4.24
Case 5 (15%, 10%) 0.99 0.99 0.99 99 0.40 0.94 0.95 0.94 94 9.01
Case 6 (20%, 10%) 0.99 0.99 0.99 99 0.46 0.94 0.94 0.94 94 15.12
Case 7 (10%, 0%) 0.99 0.99 0.99 99 0.25 0.97 0.97 0.97 97 1.41
Case 8 (10%, 5%) 0.99 0.99 0.99 99 0.31 0.95 0.96 0.95 96 2.35
Case 9 (10%, 15%) 0.98 0.98 0.98 99 0.42 0.94 0.94 0.94 94 9.80
Case 10 (10%, 20%) 0.98 0.98 0.98 99 0.54 0.93 0.94 0.93 93 16.47
Table 3: Results of experiments on synthetic data.
(a) An example of a control-flow alignment and a system-trace.
(b) Inter-level alignment that can be obtained
using CF 1 and CF 2
(c) Inter-level alignment that can be obtained
using CF2
Figure 11: An example of the constructed inter-level alignments using two different criterion functions.
alignment and process-trace in Fig. 11a. We can observe that s6 occurred between
the start and completion time of m6 and m7. Thus, this event can be linked to either
of these process moves according to CF 2 (Fig. 11b and Fig. 11c). On the other hand,
as the pur attribute of s6 matches with the activity associated to m7, this event can
38

only be linked to m7 using CF 1 (Fig. 11b). It is worth mentioning that, even if CF 1 is
used, a system-event can be linked to different concurrent process moves with the same
activity name. For instance, in Fig. 11a, CF 1 allows linking s2 to either m2 or m3.
In addition to concurrent process moves, the presence of process moves on model may
also increase the complexity of finding actual links between system-events and process
moves. As discussed in Section 5.1, the start and completion time of process moves on
model cannot be derived from any process-event directly. Criterion function λtime finds
potential links between system-events and these moves using the control-flow alignment.
For instance, in Fig. 11a, suppose that we want to identify the purpose of s8 using
CF 2. In this case, as s8 occurs after the completion of m8 and before the start of m11,
either m9 or m10 can be chosen as the purpose of this system-event. This uncertainty
plays an important role when identifying the purpose of system-events and is the reason
that in some cases the approach was not able to identify all the deviations correctly.
Table 4 shows an in-depth analysis of the results for Case 3 (P:5%,R:10%) with
respect to attack patterns representing the threat scenarios presented in Section 3. We can
observe in the table that the threat described in Scenario 1a may not be detected when
CF 2 is used. This is due to the fact that, if a data operation falls between the start and
completion time of two process moves, the system-event may be linked to either of these
process moves. A similar observation applies to the attack pattern corresponding to the
threat of Scenario 1b. We can observe in Table 4 that the recall for Pattern 1b is lower than
for Pattern 1a. This is because moves on log are penalized more than synchronous moves
(i.e., the cost assigned to a move on log is higher than the one assigned to synchronous
moves). Therefore, if another activity expected according to the process model is executed
concurrently (thus resulting in a synchronous process move) and the CRUD matrix allows
the execution of the data operation for that activity, the system-event is linked to the
synchronous move, thus not detecting the violating move type (1,3) described in Section 4
which reveals Pattern 1b. Moreover, threats involving operations executed out of context
39

CF 1 (time and pur ) CF 2 (time)
Pattern # Recall Precision F1-Measure Recall Precision F1-Measure
1a 1.00 1.00 1.00 0.99 0.99 0.99
1b 0.98 1.00 0.99 0.89 0.99 0.94
2 1.00 1.00 1.00 0.98 1.00 0.99
3 1.00 1.00 1.00 1.00 1.00 1.00
4 1.00 1.00 1.00 1.00 1.00 1.00
5 1.00 1.00 1.00 0.98 1.00 0.99
Table 4: Analysis of detected attack patterns corresponding to the threat scenarios 1a, 1b, 2,. . . , 5 in
Section 3 for Case 3 (P:5%,R:10%)
may not be detected when the pur attribute is not used as a criterion function. According
to the cost function in Table 2, operations executed out of context have the highest
cost. Therefore, system events are linked to process moves whenever it is possible, i.e.
the employed criterion functions allow linking the system event to a process move. In
particular, if a system event falls between the start and completion time of a process move,
the event is linked to that move. Finally, we can observe that missing operations, which
characterize the threats described in Scenarios 3 and 4 are always detected correctly.
Table 5 presents an overview of the composite moves identified in Case 3
(P:5%,R:10%) when the criterion functions in CF 1 were used. It is worth not-
ing that several deviations would not have been detected or accurate diagnostics obtained
using control-flow alignment techniques (see Section 2.3) like [11, 12, 15, 33]. For
instance, these techniques are not able to distinguish move types (2,1) and (3,1) from
(1,1) and (4,1), and would mark all of them as legal moves. As a consequence, 5714
missing operations and 5166 illegitimate operations would remain undetected. Moreover,
control-flow alignments are not able to capture moves of type (4,4),5 leaving additional
3078 illegal operations undetected. The deviations corresponding to the remaining six
5As discussed in Section 2.3, “no process moves” (�,�) cannot occur in control-flow alignments.
40
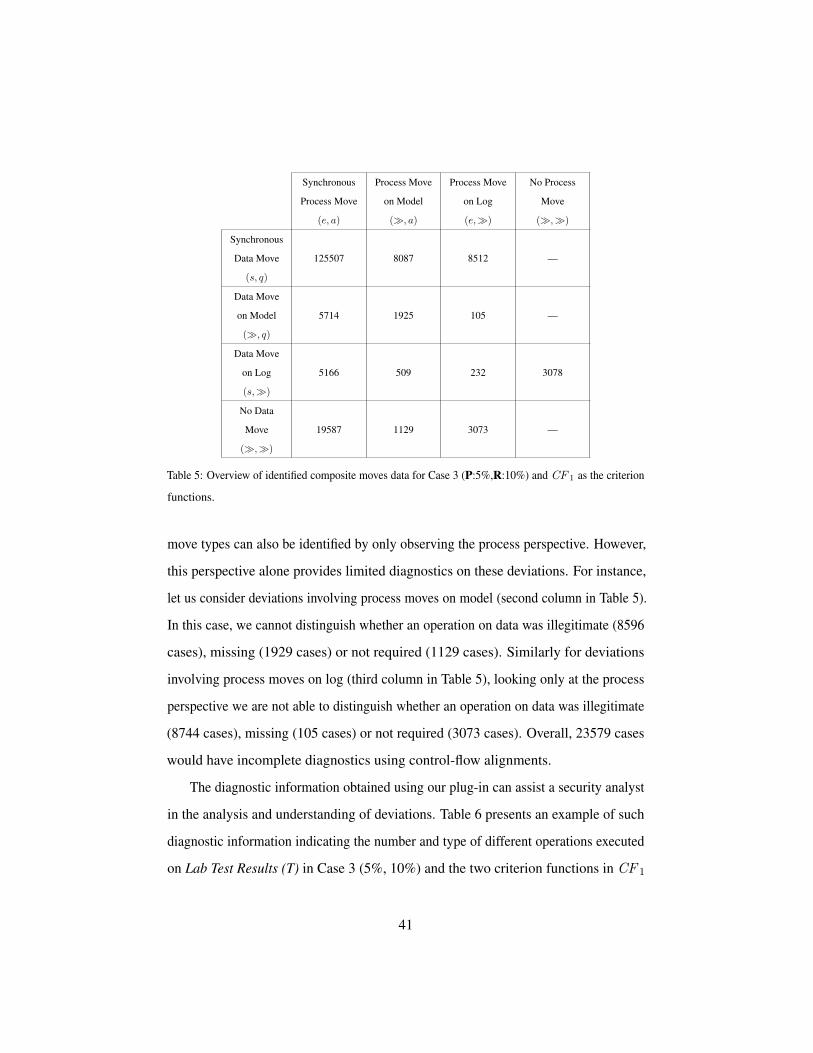
Synchronous
Process Move
(e, a)
Process Move
on Model
(�, a)
Process Move
on Log
(e,�)
No Process
Move
(�,�)
Synchronous
Data Move
(s, q)
125507 8087 8512 —
Data Move
on Model
(�, q)
5714 1925 105 —
Data Move
on Log
(s,�)
5166 509 232 3078
No Data
Move
(�,�)
19587 1129 3073 —
Table 5: Overview of identified composite moves data for Case 3 (P:5%,R:10%) and CF 1 as the criterion
functions.
move types can also be identified by only observing the process perspective. However,
this perspective alone provides limited diagnostics on these deviations. For instance,
let us consider deviations involving process moves on model (second column in Table 5).
In this case, we cannot distinguish whether an operation on data was illegitimate (8596
cases), missing (1929 cases) or not required (1129 cases). Similarly for deviations
involving process moves on log (third column in Table 5), looking only at the process
perspective we are not able to distinguish whether an operation on data was illegitimate
(8744 cases), missing (105 cases) or not required (3073 cases). Overall, 23579 cases
would have incomplete diagnostics using control-flow alignments.
The diagnostic information obtained using our plug-in can assist a security analyst
in the analysis and understanding of deviations. Table 6 presents an example of such
diagnostic information indicating the number and type of different operations executed
on Lab Test Results (T) in Case 3 (5%, 10%) and the two criterion functions in CF 1
41

Lab Test Results (T)
Activity Create Read Update Delete
LO IO MO LO IO MO LO IO MO LO IO MO
Identify patient (ip) 0 25 0 0 29 0 0 30 0 0 17 0
Admission (ad) 0 22 0 0 21 0 0 17 0 0 19 0
Visit (vi) 0 41 0 7752 753 0 0 37 0 0 43 0
Lab appointment (la) 0 27 0 0 12 0 0 20 0 0 13 0
Basic lab test (bt) 5688 753 840 3142 411 0 3173 417 0 0 20 0
Advanced tests (at) 5743 745 796 3172 372 0 3200 401 0 0 18 0
Evaluate (ev) 0 18 0 3145 399 0 0 19 0 0 21 0
Consult request (co) 0 12 0 0 8 0 0 10 0 0 15 0
Inter-colleague consultation (in) 0 20 0 3030 416 0 0 13 0 0 21 0
Treatment prescription (tr) 0 31 0 4587 580 0 0 22 0 0 35 0
Discharge and billing (di) 0 28 0 0 24 0 0 32 0 0 22 0
Clinical trial (ct) 0 3 0 0 5 0 0 2 0 0 5 0
No activity (out of context) 0 9 0 0 9 0 0 14 0 0 5 0
Total 11431 1734 1636 24828 3039 0 6373 1034 0 0 254 0
Table 6: Analysis of the operations executed on Lab Test Results (T) for Case 3 (5%, 10%) and CF 1 as the
criterion functions. LO indicates legitimate operations; IO indicates illegitimate operations; and MO
indicates missing operations.
were used. The results indicate that 1636 expected operations were skipped and 6061
illegitimate operations were executed on this data object. Recall that an operation is
considered illegitimate if it is executed to accomplish an activity for which the operation
is not allowed or it is executed within an invalid context (or a combination of the two).
That is why we still observe illegitimate operations, even though they are allowed by the
CRUD matrix (e.g., 753 Lab Test Results (T) were created with purpose Basic lab test
(bt) within an invalid context). Among these illegitimate operations, 37 of them were
executed out of context or for accomplishing a purpose for which they are not allowed
to be executed. For example, 24 times Lab Test Results (T) were read for the purpose of
discharge and billing (di), which is not allowed according to the CRUD matrix in Table 1.
It is worth noting that missing operations and operations with invalid or no context
42

(4473 operations in this case) may remain undetected if system-events are analyzed
without considering their contexts. This again demonstrates that the combination of
both levels helps revealing problems that would otherwise remain undetected.
On average, the construction of optimal inter-level alignments required 0.36 ms
per case (i.e., a system-trace and the corresponding control-flow alignment) when CF 1
is used, so in total 3.6 s. When CF 2 is used, the construction of optimal inter-level
alignments required on average 3.32 ms per case, so in total 33.2 s. As CF 2 allows more
linking between system-events and process moves in comparison to CF 1, its search
space is typically much larger. This explains why finding optimal inter-level alignments
using CF 2 required more time than using CF 1. We, thus, conclude observing that
both the accuracy and performance of the approach depend on the information used
to link the process and data perspective together.
6.2. Real-life Logs
For the experiments with real-life logs, we used a dataset taken from a road traffic
fine management system of the Italian police (available at [2]). As we aim to analyze
only cases that are complete, we used the heuristic proposed in [35] to filter out
incomplete cases. Then, by splitting activities and data operations from the original
dataset, we obtained a process event log and a system event log. The resulting process
event log and system event log contain 550021 trace-events and 917693 system-events
respectively. These log data were recorded for managing 145800 road traffic offense
cases. Each case starts by recording a traffic fine, followed by sending it to the offender.
After receiving the notification, the offender may appeal against a fine to prefecture
and/or judge. If the appeal is successful, the case ends. Otherwise, the offender is
notified about the result of the decision. The fine has to be paid within 180 days.
Otherwise, a penalty is added. If the fine is not paid fully by the offender, the case ends
by asking for credit collection. The execution of these activities may require performing
43

ActivityData object
Points Amount Expenses Payment Amount Total Payment Amount Dismissal
Create Fine U C – – C C
Send Fine – – C – – –
Notification – – – – – –
Payment – – – U U –
Add Penalty – U – – – –
Appeal to Judge – – – – – U
Send for Credit Collection – – – – – –
Appeal to Prefecture – – – – – –
Send Appeal – – – – – U
Receive Result – – – – – –
Notify Offender – – – – – –
Table 7: CRUD matrix showing the interaction between the activities of the road traffic fine management
process and data objects.
certain operations on data objects. The relationship between activities and operations on
data was obtained from the insights reported in [35] and is shown in Table 7.
To construct the control-flow alignments between process-traces and the process
model, we used the work presented in [33], which is implemented as a plug-in named
Partial-Order Aware Replayer in the ProM framework. Then, we applied our approach
to compute inter-level alignments of the constructed control-flow alignments and the
system event log using the CRUD matrix in Table 7, the cost function in Table 2 and the
set of criterion functions CF 1. On average, the construction of optimal inter-level
alignments from the system logs and control-flow alignments required 1.17 ms per case.
Table 8 reports the number of different composite moves identified in the analysis of
the log. In total, we identified 139 missing operations and 3306 illegitimate operations.
All missing operations correspond to potential cases of data update omission (insider
threat type 3). In 33 cases, we observed that the amount of the fine was not recorded
when activity create fine was executed. In 21 cases, after applying the penalty, the amount
44
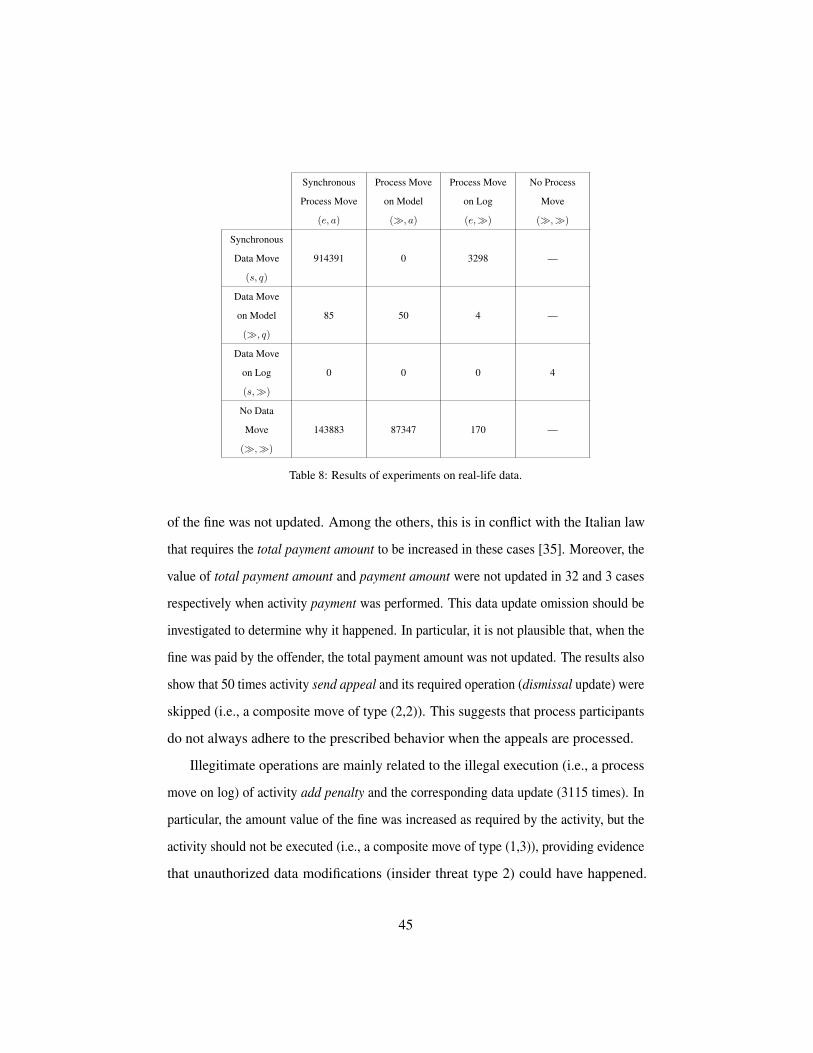
Synchronous
Process Move
(e, a)
Process Move
on Model
(�, a)
Process Move
on Log
(e,�)
No Process
Move
(�,�)
Synchronous
Data Move
(s, q)
914391 0 3298 —
Data Move
on Model
(�, q)
85 50 4 —
Data Move
on Log
(s,�)
0 0 0 4
No Data
Move
(�,�)
143883 87347 170 —
Table 8: Results of experiments on real-life data.
of the fine was not updated. Among the others, this is in conflict with the Italian law
that requires the total payment amount to be increased in these cases [35]. Moreover, the
value of total payment amount and payment amount were not updated in 32 and 3 cases
respectively when activity payment was performed. This data update omission should be
investigated to determine why it happened. In particular, it is not plausible that, when the
fine was paid by the offender, the total payment amount was not updated. The results also
show that 50 times activity send appeal and its required operation (dismissal update) were
skipped (i.e., a composite move of type (2,2)). This suggests that process participants
do not always adhere to the prescribed behavior when the appeals are processed.
Illegitimate operations are mainly related to the illegal execution (i.e., a process
move on log) of activity add penalty and the corresponding data update (3115 times). In
particular, the amount value of the fine was increased as required by the activity, but the
activity should not be executed (i.e., a composite move of type (1,3)), providing evidence
that unauthorized data modifications (insider threat type 2) could have happened.
45

Moreover, 4 system-events recording an update operation on the amount value were
executed out of context, i.e. they were not linked to any process moves (composite move
of type (3,4)). These operations were executed for the purpose of adding a penalty (i.e.,
their pur attribute is equal to add penalty) but the order in which they were recorded in
the system event log does not make it possible to link them to any alignment move. This
could indicate some synchronization issues in the recording of events at different levels,
but it could also indicate an unauthorized modification of data (insider threat type 2).
Our work is not the first that analyze the traffic fine management dataset. Alizadeh
et al. [14] analyze this dataset using control-flow alignments. However, as discussed in
Section 6.1, control-flow alignments only consider the process perspective. Thus, they
are unable to capture moves of type (2,1), (3,1), and (3,4) and cannot provide accurate
diagnostics for moves of types (1,2), (2,2), (3,2), (4,2), (1,3), (2,3), (3,3) and (4,3).
Specifically, if control-flow alignments are used for the analysis, in total, 89 illegitimate
operations would remain undetected and the diagnostics obtained for 90869 deviations
would not provide additional information on the use of data.
Another work that analyzes the traffic fine management dataset is the one by
Mannhardt et al. [35], who use data-aware alignments. Similarly to our work, Mannhardt
et al. consider the data perspective in the analysis by treating system-events as data
attributes of trace-events. However, although some of the conclusions obtained using our
approach are similar to the ones that can be obtained using data-aware alignments,
these two approaches have different goals and underlying assumptions. In particular,
data-aware alignments assume that the link between the process and data perspectives is
available and detect deviations in the control-flow based on the modification of attribute
values of trace-events. In contrast, our approach aims to discover such a link and exploits
this information to diagnose the usage of data and provide insights into the detected
deviations. In addition, the inability of analyzing data operations independently from
process activities makes data-aware alignments unable to capture a number of move
46

types identified in Figure 6, namely (1,2), (3,2), and (3,4). One may observe in Table 8,
that only few composite moves of these types were identified in our experiments. The
main reason lies in the way the dataset used for the experiments was constructed. In the
original log [2], data operations are attributes of trace-events, which were then extracted
to create a system event log. By doing so, all operations on data can be potentially
linked to trace-events, which was, for instance, not ensured for the synthetic log of
Section 6.1. The results in Table 8 show that our approach is capable to reconstruct the
links between system-events and trace-events.
7. Related Work
Existing auditing techniques can be classified in three categories based on the
layer(s) in which they operate: data layer, process layer or both.
Data Layer. Several auditing approaches have been proposed to detect illegitimate
data access and usage (see [44] for a survey). Agrawal et al. [13] propose an auditing
framework to verify whether a database system complies with privacy policies.
Differently from our work, the focus of this framework is on minimizing the information
to be disclosed and identifying suspicious queries rather than verifying data usage. Other
researchers have proposed methods for a-posteriori policy compliance [18, 20, 24].
For instance, Cederquist et al. [24] present a framework that allows users to construct
justification proofs for their actions. Azkia et al. [18] propose an auditing framework
to check the compliance of recorded actions with respect to security policies that may
depend on contextual conditions. However, these frameworks can only deal with a
limited range of policies and do not consider the purpose for which a data operation is
executed. Moreover, these frameworks usually analyze each data operation individually
and do not take into account the order in which data operations are executed to determine
their context. Kveler et al. [32] consider the purpose for which a data operation is
47

executed in order to detect policy infringements. However, in this work the purpose is
treated as a label and, consequently, it does not make it possible to analyze the context in
which a data operation is executed. Petkovic et al. [39] address this issue by linking the
intended purpose of data to the business processes of an organization and detect privacy
infringements by determining whether the data have been processed for their intended
purposes. However, this technique is only able to detect whether a deviation from
the specifications occurred and does not explicitly identify which deviation occurred.
In contrast, this work uses the purpose and context of data operations to provide
fine-grained diagnostic information capable of pinpointing the deviations that occurred.
Process Layer. From a process perspective, several researchers developed techniques
to check compliance between normative behavior of a process and the recorded behavior
in a process log [11, 12, 15, 33, 35, 46]. Rozinat et al. [46] propose to replay observed
behavior by firing recorded events in the process model and count the number of
remaining tokens and missing tokens to assess deviations. However, this approach is not
able to pinpoint the exact deviating behavior in a model. Banescu et al. [19] extend
the work in [46] to identify and classify deviations by analyzing the configuration
of missing and remaining tokens using deviation patterns. However, token-based
approaches may allow behavior that is not allowed by the model and thus may provide
incorrect diagnostics. Adriansyah et al. [11] propose an approach based on the so-called
alignment notion relating observed events in the process event log to runs of the model.
This approach has been extended in various ways. For example, the work in [33]
generalizes sequential alignments to partial orders handling concurrency between
trace-events and process moves, which is used in this work to derive process moves.
Alizadeh et al. [15] propose to use historical data to derive probable alignments. The
work in [12] extends alignments to detect high-level deviation patterns. However, all the
aforementioned techniques only focus on the process perspective. Our work extends and
48

complements those techniques by taking into account other perspectives than only the
control-flow, i.e. the name of activities and their ordering, and, thus, providing richer
diagnostics. As discussed in Section 6, only considering a process perspective does not
allow distinguishing move types (2,1), (3,1) from legitimate operations (i.e., move type
(1,1)) and identifying illegitimate operations of type (3,4). Moreover, it does not make it
possible to discriminate and provide detailed diagnostics for a number of move types
such as (1,2), (2,2), (3,2) and (4,2) (and similarly for (1,3), (2,3), (3,3) and (4,3)).
Similarly to our work, de Leoni et al. [25] extend the alignment approach to handle
the data perspective in which control-flow is aligned first and then data are considered.
Mannhardt et al. [35] propose a more balance approach in which data-aware Petri nets
and process logs are aligned to find violations with respect to data-related business rules
and guards. Specifically, these approaches analyze the executed activities and the data
values written by these activities to determine whether case variables are set correctly
and activities are executed as prescribed by the model. This allows the verification of
routing decisions during process executions, time related constraints and user restrictions
on the execution of activities. However, data-aware alignments require that the link
between the process and data perspective is already established. In contrast, our approach
aims to discover such a link and exploits this information to diagnose the usage of data
and provide insights into the detected deviations. Even if the link between the process
and data perspectives is provided, the techniques in [25, 35] are not to identify all
the composite moves presented in Figure 6. The main problem lies in the fact that these
approaches analyze violations only from a process perspective where system-events are
treated as data attributes of process events. As a result, data-aware alignments are unable
to consider the data perspective separately and diagnose system-events independently
from trace-events. For example, these techniques fail to identify move types (1,2),
(3,2) and (3, 4) as they neglect data accesses executed outside of trace-events.
49

Inter-Data-Process Layer. A large body of research has focused on modeling
interactions between processes and data to align IT implementations and business
strategies. One popular approach is the use of a CRUD matrix to relate process activities
to data accesses [34, 36, 37]. However, to the best of our knowledge, no approaches
have been proposed to check compliance between recorded and modeled behavior
from both process and data perspectives in a reconciled way. The work in this paper
leverages the CRUD artifact and proposes a novel way to reconcile the process and data
perspectives to obtain more comprehensive diagnostics of data misuse.
8. Conclusion
In recent years, many auditing techniques have been proposed to analyze the
observed behavior recorded by information systems. These techniques typically focus
on either the process or data perspective. Focusing on a single perspective, however,
may not be sufficient to detect threats posed by insiders who have knowledge of the
information system and security controls in place and can misuse their privileges and
this knowledge for malicious purposes. In addition, diagnostics obtained using these
techniques may not provide fine-grained insights required to understand the detected
deviations. This makes it difficult to decide appropriate mitigation actions. In this paper,
we propose a novel auditing approach that analyzes the observed behavior with respect to
both the data and process perspectives. We have illustrated how the obtained diagnostics
can assist auditors in the detection and identification of common insider threats that can
only be revealed by analyzing deviations in-between both perspectives. Moreover,
experiments have shown that our approach can detect such deviations accurately and is
able to provide valuable insights into deviations.
In practice, a (possibly infinite) number of control-flow alignments may exist
between a process-trace and a process model. In this work, we used the control-flow
50

alignment that is preferable from the process perspective for the analysis of data
operations. However, by considering other control-flow alignments, we may able to
find an inter-level alignment with lower total cost than the one we constructed using the
selected control-flow alignment [35]. An interesting research direction for future work
is to develop techniques that efficiently consider all possible control-flow alignments
in the analysis and provide diagnostics with respect to them.
Similar to the existence of multiple control-flow alignments, several inter-level
alignments may exist between a system-trace and a control-flow alignment. These
inter-level alignments provide different explanations for non-conformity and the quality
of the provided explanations typically is evaluated using a cost function. Following
common practice in control-flow alignment techniques [11, 12, 15, 33, 35], among
possible explanations of non-conformity we have considered the explanation that
is optimal with respect to the given cost function. However, an optimal inter-level
alignment may not necessarily represent what actually happened in the system. To
this end, various heuristics have been proposed to compute probable control-flow
alignments [15] or to handle also non-optimal control-flow alignments in the analysis
[16]. However, the study of these heuristics and methods is orthogonal to the scope
of this work and represent an interesting direction for future work.
In this work, we showed that reconciling the data and process perspectives allows
for a more fine grained analysis of the observed behavior. Considering other process
perspectives in the auditing process can enhance detection capabilities even further and
provide even more accurate diagnostics of deviations. For instance, accounting for the
user perspective (i.e., which user/role performed a certain activity and data operation) can
enable the verification of separation of duty and binding of duty constraints. Therefore,
in future work, we plan to extend our auditing framework by incorporating other
perspectives and, in particular, the user perspective to provide auditors with more
comprehensive diagnostics for the investigation of security incidents.
51

Acknowledgments. This work has been funded by the NWO CyberSecurity programme
under the PriCE project.
References
[1] Healthcare treatment process. https://svn.win.tue.nl/
repos/prom/Packages/Security/Trunk/example/
healthcareProcess/.
[2] Road traffic fine management process. http://dx.doi.org/10.4121/
uuid:270fd440-1057-4fb9-89a9-b699b47990f5.
[3] Diagnosis: Identity theft. https://www.bloomberg.com/news/
articles/2007-01-07/diagnosis-identity-theft, 2006. Ac-
cessed: 2017-03-23.
[4] Las vegas pharmacist charged with health care fraud and unlawful distribution of
controlled substances. https://www.justice.gov/archive/usao/
nv/news/2007/02232007.html, 2006. Accessed: 2017-03-23.
[5] Medical ID theft leads to lengthy recovery. http://triblive.com/
x/pittsburghtrib/news/regional/s_476326.html, 2006. Ac-
cessed: 2017-03-23.
[6] Clooney proves private health records not so private. http://abcnews.go.
com/US/story?id=3714207, 2007. Accessed: 2017-03-23.
[7] 6 face charges in Miami over fraud of Medicare. http://articles.
sun-sentinel.com/2008-04-02/news/0804010517_1_
medicare-court-files, 2008. Accessed: 2017-03-23.
52

[8] UK ICO fines Pharmacy2U Ltd for privacy breach.
https://privacybrief.net/2015/11/01/
uk-ico-fines-pharmacy2u-ltd-for-privacy-breach,
2015. Accessed: 2017-03-23.
[9] A. Adriansyah. Aligning observed and modeled behavior. PhD thesis, Eindhoven
University of Technology, 2014.
[10] A. Adriansyah, J. Munoz-Gama, J. Carmona, B. F. van Dongen, and W. M. P.
van der Aalst. Measuring precision of modeled behavior. Inf. Syst. E-Business
Management, 13(1):37–67, 2015.
[11] A. Adriansyah, B. F. van Dongen, and W. M. P. van der Aalst. Memory-efficient
alignment of observed and modeled behavior. BPM Center Report BPM-03-03,
BPMcenter.org, 2013.
[12] A. Adriansyah, B. F. van Dongen, and N. Zannone. Controlling break-the-
glass through alignment. In Proceedings of International Conference on Social
Computing, pages 606–611. IEEE, 2013.
[13] R. Agrawal, R. Bayardo, C. Faloutsos, J. Kiernan, R. Rantzau, and R. Srikant.
Auditing compliance with a Hippocratic database. In Proceedings of International
Conference on Very Large Data Bases, pages 516–527. VLDB Endowment, 2004.
[14] M. Alizadeh, M. de Leoni, and N. Zannone. History-based construction of
alignments for conformance checking: Formalization and implementation. In
Data-Driven Process Discovery and Analysis, LNBIP 237, pages 58–78. Springer,
2014.
[15] M. Alizadeh, M. de Leoni, and N. Zannone. Constructing probable explanations of
53

nonconformity: A data-aware and history-based approach. In Proceedings of IEEE
Symposium Series on Computational Intelligence, pages 1358–1365. IEEE, 2015.
[16] M. Alizadeh and N. Zannone. Risk-based analysis of business process executions.
In Proceedings of the Sixth ACM Conference on Data and Application Security
and Privacy, pages 130–132. ACM, 2016.
[17] A. Appari and M. E. Johnson. Information security and privacy in healthcare:
current state of research. International Journal of Internet and Enterprise
Management, 6(4):279–314, 2010.
[18] H. Azkia, N. Cuppens-Boulahia, F. Cuppens, G. Coatrieux, and S. Oulmakhzoune.
Deployment of a posteriori access control using IHE ATNA. International Journal
of Information Security, 14(5):471–483, 2014.
[19] S. Banescu, M. Petkovic, and N. Zannone. Measuring privacy compliance using
fitness metrics. In Business Process Management, LNCS 7481, pages 114–119.
Springer, 2012.
[20] A. Barth, A. Datta, J. C. Mitchell, and H. Nissenbaum. Privacy and contextual
integrity: framework and applications. In Proceedings of Symposium on Security
and Privacy, pages 184–198. IEEE, 2006.
[21] M. Bishop, S. Engle, S. Peisert, S. Whalen, and C. Gates. Case studies of an
insider framework. In Proceedings of 42nd Hawaii International Conference on
System Sciences, pages 1–10. IEEE, 2009.
[22] M. Bishop and C. Gates. Defining the insider threat. In Proceedings of 4th
Annual Workshop on Cyber Security and Information Intelligence Research, pages
15:1–15:3. ACM, 2008.
54

[23] D. Brandon Jr. CRUD matrices for detailed object oriented design. Journal of
Computing Sciences in Colleges, 18(2):306–322, 2002.
[24] J. G. Cederquist, R. Corin, M. A. Dekker, S. Etalle, J. I. den Hartog, and G. Lenzini.
Audit-based compliance control. International Journal of Information Security,
6(2-3):133–151, 2007.
[25] M. de Leoni, W. M. P. van der Aalst, and B. F. van Dongen. Data- and resource-
aware conformance checking of business processes. In Business Information
Systems, LNBIP 117, pages 48–59. Springer, 2012.
[26] R. Dechter and J. Pearl. Generalized best-first search strategies and the optimality
of A*. Journal of the ACM, 32:505–536, 1985.
[27] M. Dekker and S. Etalle. Audit-based access control for electronic health records.
Electronic Notes in Theoretical Computer Science, 168:221–236, 2007.
[28] P. Guarda and N. Zannone. Towards the development of privacy-aware systems.
Information & Software Technology, 51(2):337–350, 2009.
[29] M. E. Johnson. Data hemorrhages in the health-care sector. In Financial
Cryptography and Data Security, LNCS 5628, pages 71–89. Springer, 2009.
[30] M. Kandias, A. Mylonas, N. Virvilis, M. Theoharidou, and D. Gritzalis. An insider
threat prediction model. In Trust, Privacy and Security in Digital Business, LNCS
6264, pages 26–37. Springer, 2010.
[31] D. Kotz. A threat taxonomy for mHealth privacy. In Proceedings of 3rd
International Conference on Communication Systems and Networks (COMSNETS
2011), pages 1–6. IEEE, 2011.
55

[32] K. Kveler, K. Bock, P. Colombo, T. Domany, E. Ferrari, and A. Hartman.
Conceptual framework and architecture for privacy audit. In Privacy Technologies
and Policy, LNCS 8319, pages 17–40. Springer, 2012.
[33] X. Lu, D. Fahland, and W. M. P. van der Aalst. Conformance checking based on
partially ordered event data. In Business Process Management Workshops, LNBIP
202, pages 75–88. Springer, 2014.
[34] D. Lunsford and M. Collins. The CRUD security matrix: a technique for
documenting access rights. In Proceedings of Annual Security Conference, pages
2–4, 2008.
[35] F. Mannhardt, M. de Leoni, H. A. Reijers, and W. M. P. van der Aalst. Balanced
multi-perspective checking of process conformance. Computing, 98(4):407–437,
2016.
[36] J. Martin. Managing the data base environment. Prentice Hall PTR, 1983.
[37] J. Pereira, J. Martins, V. Santos, and R. Goncalves. Crudi framework proposal:
financial industry application. Behaviour & IT, 33(10):1093–1110, 2014.
[38] J. W. Perry, A. Kent, and M. M. Berry. Machine literature searching x. machine
language; factors underlying its design and development. American Documentation,
6(4):242–254, 1955.
[39] M. Petkovic, D. Prandi, and N. Zannone. Purpose control: Did you process the
data for the intended purpose? In Secure Data Management, LNCS 6933, pages
145–168. Springer, 2011.
[40] C. P. Pfleeger. Reflections on the insider threat. In Insider attack and cyber
security, Advances in Information Security 39, pages 5–16. Springer, 2008.
56

[41] A. Phyo and S. Furnell. A detection-oriented classification of insider it misuse. In
Proceedings of 3rd Security Conference, 2004.
[42] Ponemon Institute. 2015 Cost of data breach study: global analysis. www.ibm.
com/security/data-breach, 2015. Accessed: 2016-09-3.
[43] J. Predd, S. L. Pfleeger, J. Hunker, and C. Bulford. Insiders behaving badly. IEEE
Security & Privacy, 6(4):0066–70, 2008.
[44] J. Reuben, L. Martucci, and S. Fischer-Hubner. Automated log audits for privacy
compliance validation: a literature survey, pages 312–326. IFIP AICT 476.
Springer, 2016.
[45] E. Rissanen, B. S. Firozabadi, and M. Sergot. Discretionary overriding of access
control in the privilege calculus. In Formal Aspects in Security and Trust, IFIPAICT
173, pages 219–232. Springer, 2005.
[46] A. Rozinat and W. M. P. van der Aalst. Conformance checking of processes based
on monitoring real behavior. Information Systems, 33(1):64–95, 2008.
[47] S. Sinclair and S. W. Smith. Preventative directions for insider threat mitigation
via access control. In Insider Attack and Cyber Security, Advances in Information
Security 39, pages 165–194. Springer, 2008.
[48] W. M. P. van der Aalst, M. Weske, and D. Grunbauer. Case handling: a new
paradigm for business process support. Data Knowl. Eng., 53(2):129–162, 2005.
57


