Linking biodiversity to mutualistic networks – woody
26
53 Ann. For. Res. 56(1): 53-78, 2013 ANNALS OF FOREST RESEARCH www.e-afr.org Linking biodiversity to mutualistic networks – woody species and ectomycorrhizal fungi E. Fodor Fodor E., 2013. Linking biodiversity to mutualistic networks – woody species and ectomycorrhizal fungi. Ann. For. Res. 56(1): 53-78, 2013. Abstract. Mutualistic interactions are currently mapped by bipartite net- works with particular architecture and properties. The mycorrhizae con- nect the trees and permit them to share resources, therefore relaxing the competition. Ectomycorrhizal macrofungi associated with woody species ( Quercus robur, Q. cerris, Q. petraea, Tilia tomentosa, Carpinus betulus, Corylus avellana, and Q. pubescens ) growing in a temperate, broadleaved mixed forest, from a hilly area near the city of Cluj–Napoca, central Roma- nia were included in a bipartite mutualistic network. Community structure was investigated using several network metrics, modularity and nestedness algorithms in conjunction with C-score index cluster analysis and nonmet- ric multidimensional scaling (the Kulczynski similarity was index used as most appropriate metric selected by minimal stress criterion). The results indicate that the network presents high asymmetry (hosts are outnumbered by mycobionts at a great extent), high connectance, low modularity, and high nestedness, competition playing a secondary role in community as- semblage (non significant difference between simulated and observed C- score). The nestedness pattern is non-random and is comparable to previ- ously published results for other similar interactions containing plants. In the proposed network, woody species function exclusively as generalists. Modularity analysis is a finer tool were identifying species roles than cen- trality measures, however, the two types of algorithms permit the separation of species according to their roles as for example connectors (generalist spe- cies) and ultraperipheral species (specialists). Supergeneralist woody spe- cies function as hubs for the diverse ectomycorrhizal community while su- pergeneralist ectomycorrhizal fungi glue the hubs into a coherent aggregate. Keywords temperate broadleaved mixed forest, ectomycorrhizal fungi, mu- tualistic bipartite networks, nestedness, modularity, connectance, C-score cluster analysis, non metric multidimensional scaling. Author. Ecaterina Fodor ([email protected]) University of Oradea, Fac- ulty of Environmental Protection, Forestry Department, Gen. Magheru 26, Oradea, Romania. Manuscript received May 18, 2012; revised November 01, 2012; accepted Novem- ber 12, 2012; online first November 16, 2012.
Transcript of Linking biodiversity to mutualistic networks – woody

53
Ann. For. Res. 56(1): 53-78, 2013 ANNALS OF FOREST RESEARCH www.e-afr.org
Linking biodiversity to mutualistic networks – woody species and ectomycorrhizal fungi
E. Fodor
Fodor E., 2013. Linking biodiversity to mutualistic networks – woody species and ectomycorrhizal fungi. Ann. For. Res. 56(1): 53-78, 2013.
Abstract. Mutualistic interactions are currently mapped by bipartite net-works with particular architecture and properties. The mycorrhizae con-nect the trees and permit them to share resources, therefore relaxing the competition. Ectomycorrhizal macrofungi associated with woody species (Quercus robur, Q. cerris, Q. petraea, Tilia tomentosa, Carpinus betulus, Corylus avellana, and Q. pubescens) growing in a temperate, broadleaved mixed forest, from a hilly area near the city of Cluj–Napoca, central Roma-nia were included in a bipartite mutualistic network. Community structure was investigated using several network metrics, modularity and nestedness algorithms in conjunction with C-score index cluster analysis and nonmet-ric multidimensional scaling (the Kulczynski similarity was index used as most appropriate metric selected by minimal stress criterion). The results indicate that the network presents high asymmetry (hosts are outnumbered by mycobionts at a great extent), high connectance, low modularity, and high nestedness, competition playing a secondary role in community as-semblage (non significant difference between simulated and observed C-score). The nestedness pattern is non-random and is comparable to previ-ously published results for other similar interactions containing plants. In the proposed network, woody species function exclusively as generalists. Modularity analysis is a finer tool were identifying species roles than cen-trality measures, however, the two types of algorithms permit the separation of species according to their roles as for example connectors (generalist spe-cies) and ultraperipheral species (specialists). Supergeneralist woody spe-cies function as hubs for the diverse ectomycorrhizal community while su-pergeneralist ectomycorrhizal fungi glue the hubs into a coherent aggregate. Keywords temperate broadleaved mixed forest, ectomycorrhizal fungi, mu-tualistic bipartite networks, nestedness, modularity, connectance, C-score cluster analysis, non metric multidimensional scaling.
Author. Ecaterina Fodor ([email protected]) University of Oradea, Fac-ulty of Environmental Protection, Forestry Department, Gen. Magheru 26, Oradea, Romania.Manuscript received May 18, 2012; revised November 01, 2012; accepted Novem-ber 12, 2012; online fi rst November 16, 2012.

54
Ann. For. Res. 56(1): 53-78, 2013 Research article
Introduction
Biodiversity became an iconic topic in theo-retical and applied ecology during the last dec-ades, everything being under the paradigmatic statement “nature is complex” (May & Oster 1976). The way of species co-existence within infracommunities and metacommunities is also a major issue in community ecology, al-ternative hypotheses being proposed and tested with time: species are randomly distributed, a phenomenon driven by stochastic processes or are non-randomly distributed as a consequence of niche partitioning, phylogenetic signal or environmental fi ltering (Webb 2000, Leibold 2006). Assembly rules determine the struc-ture of natural communities (Weiher & Keddy 1999), generating hypothetical patterns of spe-cies distributions within metacommunities: nested subsets of species within regional pool, checkerboard distribution of species, Clement-sian and Glesonian gradiens, evenly spaced gradient and random pattern (Leibold 2002). Among those, commonly occurring patterns of species distributions are: checkerboards of exclusive replacement meaning less species co-occurrence than expected by chance (Dia-mond 1975, Connor & Simberloff 1979, Go-telli & McCabe 2002) and the opposite, nested assemblages when species composing smaller sets of local communities or infracommunities are subsets of richer assemblages (Patterson & Atmar 1986). Extracting community structure which in-corporates biodiversity and assembly rules became a main trend generating a plethora of quantitative approaches. By using this inter-esting new and promising modeling tool, eco-logical networks have emerged during the last few years. Network theory brings order to an apparently orderless world, reducing complex problems to a series of relationships that can be mapped. It became obvious that information on species interactions and the quantitative ap-proach to this ecological topic could improve the predictions on the fate biodiversity (In-
gram & Steel 2010), since species interactions were playing important roles in community persistence and structure (Fortuna et al. 2010). Ecological networks incorporate trophic webs, mutualistic and parasitic interactions as well other types of biotic and abiotic interactions. The information provided by network analysis comes to widen our understanding on commu-nity pattern and species assemblage rules. Graph theory facilitated the study of com-plex systems in many areas where the con-fi guration of the interactions was important in understanding system behavior (Lurgi & Rob-ertson 2011). Network analysis is connected to ecological complexity, a basic property of the biological world (Jordano 2010), defi ned in terms of the number of interacting species and the frequency of their interactions (May 1972). One of the fi rst approaches pioneering in the area of graph theory applications to the study of biological systems was performed by May (1972), who constructed a random network of N nodes (species) and C links with an average interaction strength of σ as a model in the con-text of complexity-stability debate. A network / graph is defi ned as a set of ver-tices connected by a set of links or edges. An edge is a line emanating from a vertex i to the vertex j. The mutualistic interactions are depicted by bipartite networks, with interac-tions occurring between two groups of species generally between two trophic levels, but not within each group (Williams 2011). During the last decade, the area of plant-animal mutualistic interactions using network representation and analysis registered a rapid pace. Host – parasite / mutualist interactions are set in a community context and are sub-jected to ecological pressures in a similar way to prey-predator interaction or facilitation type interactions (Thrall et al. 2006) traditionally subjected to network analyses. Plant-pathogen and plant-mutualistic networks including fungi as partners are still emerging areas of scientifi c interest (Vacher et al. 2010, Fodor 2011) and less information has been accumulated on their

55
Fodor Linking biodiversity to mutualistic networks ...
topologies and properties. Bipartite mutualistic networks were em-ployed to study interactions such as those between plants and their pollinators, seed dis-persers (Donatti et al. 2011), pathogens, oc-casionally mycorrhizal partners (Montesinos-Navarro et al. 2012), between insects and their parasitoids, plant facilitation relationships (Saavedra et al. 2008) or cleaning mutualism (Sazima et al. 2010). One of the main conclu-sions are that mutualistic and parasitic net-works are more stable in their evolution than predator-prey networks which are more fl ex-ible (Scotti et al. 2007), these traits being evi-dent from the network architecture analysis. A common feature for all ecological net-works is their heterogeneity in terms of the ar-chitecture of links (number of links per vertex) and non-randomness in species assemblage. However, mutualistic networks are character-ized by several properties which make them different from trophic webs: strong interaction asymmetry in interaction strength, nestedness, highly skewed degree distribution with many species showing few lenfs and few species diplaying many links (Jordano et al. 2003, Bascompte et al. 2006, Vázquez et al. 2009, Thébault & Fontaine 2010), high interaction diversity, low connectance (Olesen et al. 2005, Williams 2011, Verdú & Valiente-Banuet 2008, Gonzáles et al. 2010) and modularity meaning that distinct subsets of species interact more strongly among themselves than with spe-cies from other modules (Olesen et al. 2007, Fortuna et al. 2010). The role of each species in these diverse assemblages depends on the number of interactions it establishes with po-tential partner species (Jordano 2010). Trees function as ecosystem engineers since they provide multiple resources (Jones et al. 1994) and they strongly modify biotic and abi-otic conditions (Olff et al. 2009). Mycorrhizae represent one of the key mutualistic relation-ships that shape terrestrial ecosystems. In for-est ecosystems, ectomycorrhizae are dominant within mycorrhizal communities associated
with woody species, and encompass an im-portant share of biodiversity. Woody species from fam. Fagaceae, Pinaceae, Salicaceae, Betulacee, Tiliaceae in holarctic and temper-ate regions harbor ectomycorrhizal fungi, the majority being placed in the orders Pezizales, Helotiales, Boletales, Agaricales, Telepho-rales, Russulales, Phallales, Polyporales & Cantharelalles (De Roman et al. 2005, Teder-soo et al. 2010). Modern approaches to com-munity ecology put greater emphasis on the distribution of resources and partition among plants and mycorrhizae seem to reduce the dominance of more aggressive plant competi-tors in plant communities (Wilkinson 1998). Depending on the circumstances, woody spe-cies may share common mycorrhizal taxa, hence, a common mycorrhizal network also in a physical sense. Therefore, a new perspective on plant communities derives from the study of the diverse mycorrhizal networks (Selosse et al. 2006), because trees have the peculiar attribute of accumulating high levels of bio-diversity during their long lifetime (Petit & Hamper 2006), mycorrhizal partners included. They also share a long co-evolutionary history with their mutualists (Tedersoo et al. 2010). It is considered true that mutualistic rela-tionships at large have molded biodiversity (Thomson 1994, Bascompte et al. 2006) and the growing interest in their study is motivated by the increasing extinction threats affecting mutualistic species (Bascompte & Jordano 2007, Campbell et al. 2011) . The interaction between mycorrhizal partners is an indirect trophic relationship with different currencies for each member: nutrients and water versus energy (Hooper et al. 2005, Perry & Choquette 1987). Inclusion of ECM fungi in model eco-systems is of fundamental importance because they mediate most important interactions be-tween primary producers and detrital food webs (Southworth et al. 2005). In forest ecosystems, the richness and diversity of ECM communi-ties contrasts strongly with the low number of tree species, given the number of identifi ed as-

56
Ann. For. Res. 56(1): 53-78, 2013 Research article
sociates of the trees in the present study. The ECM fungi differ in their ability to exploit soil nutrients; this diversity may explain their distribution within different ecological niches (Bruns 1995). In bipartite networks, diversity of species within each group may be linked to important network properties that can be translated into community level properties: for instance, net-work centrality measures help with the identi-fi cation of the most infl uential species in terms of association, competition or resource use. Nestedness is an effective tool for analyz-ing interaction diversity (Dyer et al. 2010), the later being defi ned as the number of interac-tions linking species in a dynamic community (Thomson 1994), an important concept go-ing beyond the classical frame of document-ing species and their diversity (Tylianakis et al. 2007). The concept was fi rst defi ned in the frame of biogeography: small communities forming proper subsets of larger communi-ties (Atmar & Patterson 1993). It was point-ed out that mutualistic networks are nested (Bascompte & Jordano 2007). Nested subset structure was documented in host-parasite sys-tems (Patterson et al. 2009) facilitation plant networks (Verdu & Valiente-Banuet 2008), ant–plant mutualistic networks (Rico-Gray et al. 2011) and is only at the beginning to be ap-proached in the study of mycorrhizal systems (Southwood et al. 2005, Montesinos-Navar-ro et al. 2012). Nestedness has an important property; it makes the community more robust against extinction (Memmott et al. 2004). In mutualistic networks competition is relaxed ei-ther among host or among mutualists (Bastolla et al. 2009) and has a positive effect on the sta-bility of mutualistic communities (Okuyama & Holland 2008). Modularity is another feature to be inves-tigated in bipartite networks and it quantifi es the extent, relative to the null network model, to which vertices representing species cluster into community groups (Barber 2007). Bio-logical systems are modular in the sense that
they are composed of quasi-independent parts that not only are tightly integrated but also exhibit a certain degree of interdependence (Schlosser & Wagner 2004). The modular structure of complex networks plays a critical role in their function (Newman 2006, Guimera & Amaral 2005) meaning that different groups of nodes perform different functions with some degree of independence. The investiga-tions on modularity are of the same category as hierarchical clustering performed with clas-sical clustering algorithms. Modularity was documented for mutualistic networks such as seed dispersal (Donatti et al. 2011, Mello et al. 2011 a,b) plant-pollination (Olesen et al. 2007, Valdovinos et al. 2009, Ramos–Jiliberto et al. 2010) and arbuscular mycorrhizae-plants in-teractions (Montesinos-Navarro et al. 2012). Alternative algorithms for testing community structure, based on presence-absence matrices, can be employed in order to have a different perspective or in order to compare them with network analysis results: guild proportionality or nestedness which we have already men-tioned (Patterson & Atmar 1986), Diamond’s (1975) competition induced checkerboards are methods commonly used to test community assemblage rules. One of the frequently em-ployed indices is C-score developed by Stone & Roberts (1990). It measures the degree to which species co-occur in competition driven communities. The present paper addresses the topological complexity of the system consisting of several woody species (hosts) and their ectomycor-rhizal associates, in a forest at the city edge of the city of Cluj-Napoca, in central Romania. The community structure of ectomycorrhizal macromycetes associated with several woody hosts was investigated using both classical ap-proaches in community analysis (cluster anal-ysis, non dimensional scaling, C-score) and bipartite network descriptors (connectivity, asymmetry, centrality measures, nestedness and modularity). The study addresses the following issues: (i)

57
Fodor Linking biodiversity to mutualistic networks ...
the association of the mycobionts with their plant hosts is non-random and nested. Species play different functional roles in the commu-nity, (ii) the association is more intimate than mutualistic relationships which have been described elsewhere, a property that can be quantifi ed in terms of network connectivity, nestedness and modularity. The community structure of ectomycorrhizal macromycetes is not competition driven and macrofungal spe-cies play different roles within the community, (iii) the network architecture is characteristic of the partnership between trees and shrubs as hosts and ectomycorrhizal macromycetes and is comparable to other mutualistic networks which have been described elsewhere. Net-work metrics complement the information ob-tained from other classical quantitative meth-ods. The analyzed matrix of ectomycorrhizal fun-gi and their selected list of hosts are considered a metacommunity if hosts are viewed as equiv-alents to sites to conform to the metacommuni-ty defi nition as a set of ecological communities at different sites (Leibold & Mikelson 2002). Network analysis was meant to unravel structural aspects of macrofungal diversity ex-plaining the differences in acquisition of mutu-alists between tree and shrub species, based on the explanatory power of network metrics.
Materials and methods
Study site
The observations were performed in a typical temperate broadleaved mixed forest in a hilly region managed by the Forestry District Cluj-Napoca, forest production unit IV, known lo-cally as Hoia forest covering 295 ha. Hoia hill covered by the investigated forest stand reaches altitudes varying in the range of 506-548 m and is situated at 46°46’ N, 23°30’ E. The annual average temperature oscillates around +8° C, the minimum annual average
is recorded in January (from -2° C to +5° C) while the maxima are recorded in July (from +15° C to +20° C). The average annual precip-itations are situated in the range 670-1000 mm/m2. The forest types are characteristic for hilly areas, mainly Transsylvanian Quercus petraea and Carpinus betulus forests, on clay illuvial brown soils (preluvosoils), with mesophytic graminicolous herbaceous cover. Except for small natural islands of Quercus pubescens, the stands are former coppices transformed into high forest, in the range of 55-100 years (Anonymous 1999). According to functional classifi cation of for-est stands, it is considered as recreational for-est consisting of a mosaic of stands dominated by Quercus petraea (Matt.) Liebl mixed with Quercus robur L. or Quercus cerris L., stands dominated by Carpinus betulus L. and natural stands consisting of Quercus pubescens Mill., a thermophilous species forming forest patches in different areas of Transylvania. [At Hoia, on southern slopes, stands with Q. pubescens cov-er 6.2 ha but scattered individuals can be found at he forest edge of other stands on the south-ern slopes.] Other important woody species with ectomycorrhizae, endoectomycorrhizae and arbuscular mycorrhizae found in Hoia for-est are: Tilia tomentosa Moench., Tilia cordata Mill., Corylus avellana L, Sorbus torminalis (L.) Crantz, Crategus monogyna Jacq., Rosa canina L., Ligustrum vulgare L., Viburnum lantana L., Sambucus nigra L., Cornus san-guinea L., Euonymus europaea L., Acer camp-estre L., Fraxinus excelsior L., Acer pseudo-platanu L., scattered trees of Fagus sylvatica L., Prunus avium L. and Robinia pseudacacia L. Selected ectomycorrhizal woody species chosen for the current study were Quercus cerris, Q. robur, Q. petraea., Tilia tomentosa / Tilia cordata, Carpinus betulus, Corylus avel-lana and Q. pubescens. Concerning Tilia spe-cies, the most frequently encountered species is Tilia tomentosa considered under the present study as characteristic host for ectomycorrhiz-al mycobionts.

58
Ann. For. Res. 56(1): 53-78, 2013 Research article
The forest patch with Q. pubescens is a protected area (Work Group NATURA 2000, 2008), with high conservation value due to the fact that it is included in the rare forest and habitat types classifi ed as: 91HO Panno-nian woods with Q. pubescens, according to NATURA 2000 and 41.7373 intra-Carpathian insular Quercus virgiliana woods, according to Palearctic Habitats and R4160 Quercus pu-bescens Dacian forests and woodlands with Lithospermum purpurocoeruleum L. according to Romanian Habitats (Doniţă et al. 2005). The site covers 8 ha on Southern and South-West-ern slopes of the Hoia forest, being represented by a mixture of forest and pasture patches, har-boring conservation important plant species as Adonis vernalis L., Cephalaria radiata Griseb. et Schenk., Stipa pulcherrima K.Koch, Salvia transsylvanica (Schur ex Griseb.) Schur., Cen-taurea atropurpurea Waldst. et Kit. and Viola jooi Janka.
Data collection
A detailed species list is provided for mycor-rhizal macromycetes, the result of surveys between 1999 and 2011, being attached to Supplementary information. Nomenclature follows the online Index Fungorum. Only aboveground fructifi cations were considered in assigning mycobionts. However, the soil inhabiting, cosmopolitan and generalist my-cobiont Coenococcum geophilum found in all samples containing Quercus spp. assimilative roots (Fodor et al. 2011, Şesan et al. 2010) and also associated to other broadleaved species roots investigated during the present study was considered. Ectomycorrhizal fungi were collected on slopes dominated by Quercus spp. and on the forest plateau. Anthropogenic stress is rep-resented in the area by expanding real estate business leading to new constructions placed near the forest edge, overexploitation due to the fact that many forest areas are now private properties, the pressure of week-end tourism
and grazing by sheep and cows.
Network construction
The observations were organized in an adja-cency matrix of presence/absence data, con-taining species of plants (woody host spe-cies) and ectomycorrhizal macrofungi. The proposed ecological network is a bipartite (2 mode) mutualistic network containing trees such as: Quercus cerris, Q. robur, Q. petraea, Tilia cordata, Carpinus betulus, Corylus avel-lana, Q. pubescens. The second group of the bipartite network is represented by ectomyc-orrhizal macrofungi with aboveground car-pophores, with the one exception, being the ubiquitous and underground forming sclerotia, Coenococcum geophilum Fr. The network was constructed for the analysis of direct, pair-wise interactions and was based on a presence/ab-sence community matrix considered as the fundamental unit in community ecology and biogeography (McCoy & Heck 1987). It was used also for the calculation of several char-acteristic community indices (C-score, nested-ness) where hosts stand for distinct sites and associated mutualistic mycorrhizal fungi, for local communities. Network metrics and ectomycorrhizal com-munity structure assessment
For the detection of community structure, sev-eral network specifi c metrics were employed (node degree listing, connectance, link den-sity, network diameter and size, node degree, betweenness, closeness centrality and node centralization) several classical community structure metrics in network context (nested-ness and modularity) and classical structure assessment metrics such as C-score and clus-ter analysis and non metric multidimensional scaling. Node degree (Di) is the number of edges per vertex. Node degrees are summarized in the adjacency matrix which is the same with
59
Fodor Linking biodiversity to mutualistic networks ...
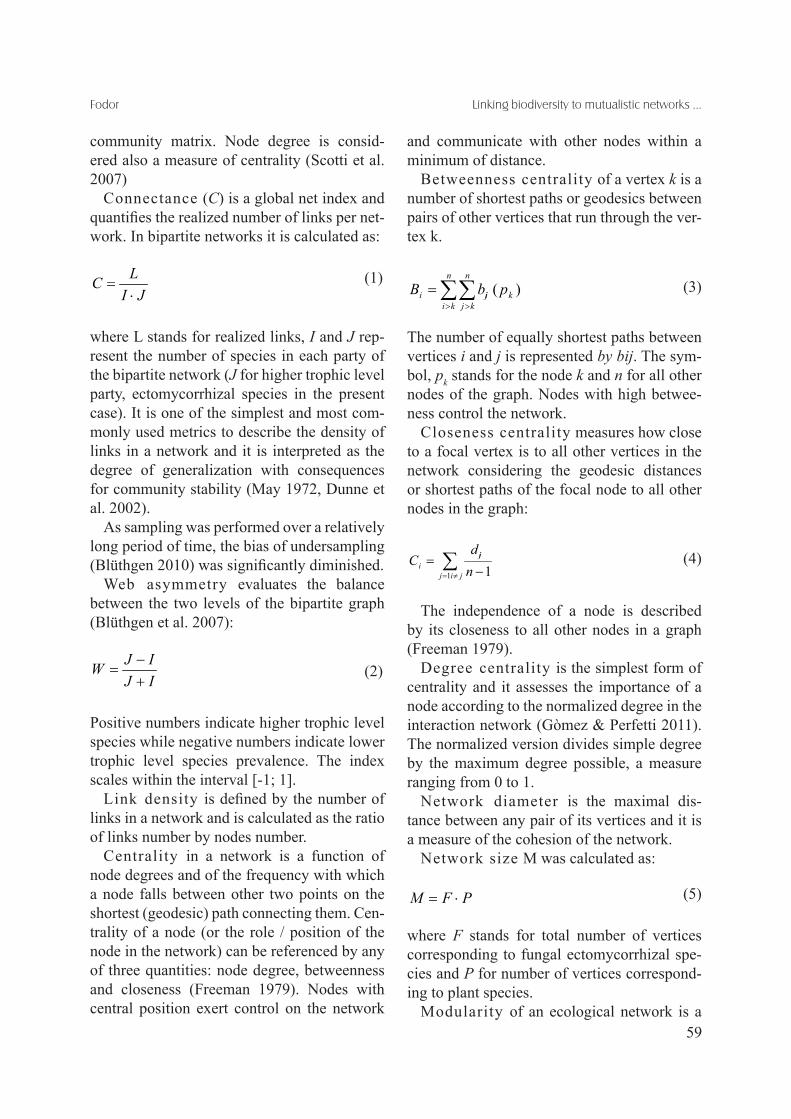
community matrix. Node degree is consid-ered also a measure of centrality (Scotti et al. 2007) Connectance (C) is a global net index and quantifi es the realized number of links per net-work. In bipartite networks it is calculated as:
JILC⋅
=
where L stands for realized links, I and J rep-resent the number of species in each party of the bipartite network (J for higher trophic level party, ectomycorrhizal species in the present case). It is one of the simplest and most com-monly used metrics to describe the density of links in a network and it is interpreted as the degree of generalization with consequences for community stability (May 1972, Dunne et al. 2002). As sampling was performed over a relatively long period of time, the bias of undersampling (Blüthgen 2010) was signifi cantly diminished. Web asymmetry evaluates the balance between the two levels of the bipartite graph (Blüthgen et al. 2007):
IJIJW
+−
=
Positive numbers indicate higher trophic level species while negative numbers indicate lower trophic level species prevalence. The index scales within the interval [-1; 1]. Link density is defi ned by the number of links in a network and is calculated as the ratio of links number by nodes number. Centrality in a network is a function of node degrees and of the frequency with which a node falls between other two points on the shortest (geodesic) path connecting them. Cen-trality of a node (or the role / position of the node in the network) can be referenced by any of three quantities: node degree, betweenness and closeness (Freeman 1979). Nodes with central position exert control on the network
and communicate with other nodes within a minimum of distance. Betweenness centrality of a vertex k is a number of shortest paths or geodesics between pairs of other vertices that run through the ver-tex k.
∑∑> >
=n
ki
n
kjkiji pbB )(
The number of equally shortest paths between vertices i and j is represented by bij. The sym-bol, pk stands for the node k and n for all other nodes of the graph. Nodes with high betwee-ness control the network. Closeness centrality measures how close to a focal vertex is to all other vertices in the network considering the geodesic distances or shortest paths of the focal node to all other nodes in the graph:
∑≠= −
=jij
iji n
dC
1 1
The independence of a node is described by its closeness to all other nodes in a graph (Freeman 1979). Degree centrality is the simplest form of centrality and it assesses the importance of a node according to the normalized degree in the interaction network (Gòmez & Perfetti 2011). The normalized version divides simple degree by the maximum degree possible, a measure ranging from 0 to 1. Network diameter is the maximal dis-tance between any pair of its vertices and it is a measure of the cohesion of the network. Network size M was calculated as:
PFM ⋅=
where F stands for total number of vertices corresponding to fungal ectomycorrhizal spe-cies and P for number of vertices correspond-ing to plant species. Modularity of an ecological network is a
(1)
(2)
(3)
(4)
(5)

60
Ann. For. Res. 56(1): 53-78, 2013 Research article
signature of heterogeneous link distribution (Olesen et al. 2007) modules are composed of species having many interactions among themselves and few interactions with species from other modules. It is the degree of species organization into densely connected modules, a surrogate for guild structure (Mello et al. 2011 a). Modules can be detected at topologi-cal level, at the smallest scale being defi ned as subgraphs. The methodology is based on node connectivity surmising that nodes are con-nected according to their role in the network (Guimera & Atmar 2005). There are several al-gorithms proposed to optimally separate mod-ules: simulated annealing (Guimera & Atmar 2005) or spectral properties of the network (Newman 2006). In the present study the algo-rithm of simulated annealing which is a Monte Carlo procedure provided by Guimera & At-mar (2005) and incorporated in the software NETCARTO, was employed. Modularity was calculated, according to the equation:
where: Q stands for modularity, ms represents the number of links in module s, ds represents the sum of degrees ki of the vertices in the module s, m stands for the number of links in the neywork. It is worth to mention that modu-larity, as the amount of clustering based on net-work connectance, dictates the basic buiding blocks of the network (Olesen et al. 2007) Given a partition of a network m in com-munity, the aim is to improve the partition by computing a new one with a high degree of modularity. Given a partition of a network one can improve the partition by computing a new one with a higher value of modularity. The identifi cation process of modules consists of maximizing the network modularity by simulated annealing (a stochastic optimization technique which enables one to fi nd the low-cost confi guration in the network). It enables
the operator to perform an exhaustive search without an a priori specifi cation of the mod-ules number. It is hence plausible to consider that nodes in the network are connected ac-cording to their roles. It must be stressed that modularity is a global index addressing whole network. Guimera & Amaral (2005) suggest that the global role of nodes assessed by modu-larity is a better indicator of their importance than the node degree. The rationale of the in-dex dwells in minimizing the number of links between modules and maximizing the number of links within modules. It is recommended that the network be tested repeatedly. The need for repeated runs is dictated by the heuristic nature of the algorithm (Fortuna et al. 2010). Topological properties of the nodes can be em-ployed to defi ne roles: these are participation coeffi cient and within module degree z. The role of a node is assessed using the par-ticipation coefficient which is also a meas-ure of connectivity among modules (Olesen et al. 2007) and defi nes how a node is positioned within its own module and with respect to other modules (Guimera & Amaral 2005). The coeffi cient is calculated for each node. It de-fi nes how well distributed the links of a node are among different modules according to the equation:
where: kis represents the number of links node i shares with other nodes in module si, ki stands for the degree of node i and Nm stands for number of modules. The index takes values in the range 0 and 1: 0 means that all links are within a given module and 1 that all links are distributed uniformly among modules. Within module degree z is a descriptor derived from modularity assessment which measures how well a node is connected to other nodes in the module: it distinguishes the hub from non-hub nodes and is calculated ac-
(6)
(7)
2
2ms dsQm m
⎡ ⎤⎛ ⎞= −⎢ ⎥⎜ ⎟⎝ ⎠⎢ ⎥⎣ ⎦
∑
21
1
kNm isPi kS i
⎛ ⎞⎜ ⎟⎜ ⎟⎝ ⎠
= − ∑=

61
Fodor Linking biodiversity to mutualistic networks ...
cording to the equation (Guimera & Amaral 2005):
where: ki stands for the number of links of node I to other nodes within own module si, ksi mean stands for the mean over all nodes in module si and σsi is the standard deviation of k in si. High values of zi indicate high within module degree and accordingly an important role. Nodes with z ≥ 2.5 are classifi ed as module hubs (highly linked to other nodes) and nodes with z < 2.5 are classifi ed as non-hubs. Hub and non-hub nodes can be further characterized using participation coeffi cient values. Within z = P parameter space 7 regions are delimited ac-cording to the roles palyed by the nodes. The non-hub nodes can be partitioned among four different regions: R1 contains ultra-peripheral nodes, nodes with all their links within module at p ≤ 0.05, R2 contains peripheral nodes with most of the links confi ned to their module with 0.05 <p ≤ 0.62, R3 contains non-hub connec-tor nodes with many links to other modules with 0.62 < p ≤ 0.80 and R4 contains non-hub, kinless nodes with links distributed among all modules. The other three regions conyain hub modules: R5 that contains provincial hubs with most of their links within own hub with p ≤ 0.30 and R6 that contains connector hubs with many links to other hubs with 0.30 < p ≤ 0.75 and R7 containing kinless nodes with links distributed homogenously among hubs (p > 0.75). Nestedness is a community descriptor which can also be employed as network de-scriptor because in both situations a presence / absence matrix is employed. It depicts a par-ticular type of asymmetry in interactions. The method quantifying the nestedness was fi rst employed in biogeography to quantify the de-gree in which smaller islands represent a sub-set of species found in larger ones. This pat-tern was defi ned as nested and represented by
a triangular shape of the distribution of ones in the adjacency matrix after rows and columns have been reordered by increasing number of links. The calculation was performed us-ing the most popular temperature estimator proposed by Atmar & Patterson (1993). This index is constructed using the median line in the ranked adjacency matrix, a null model pro-vided for comparison with observed data. This line equally separates holes and full cells in the matrix (zeros and ones). The ”temperature” is a measure of the dispersion of holes with re-spect to the median. Nestedness was calculated as N = (100-T)/100 in which T is the matrix temperature, a measure of how the presence / absence pattern departs from perfect nestedness. T calcula-tion was performed with software Binmatnest (Rodríguez-Gironés, & Santamaría 2006). A genetic algorithm was employed by the au-thors to calculate the temperature specifying a population size (30 possible solutions with the best selected for subsequent variation), a tour size of 7 as recommended by authors, and 2000 generations. This metric depends on the matrix size meaning that larger matrices are more reliable in assessing nestedness (Ul-rich & Gotelli 2007). Two null models were run using simulated matrices which preserve the marginals from the observed matrix. Null models are pattern generating models based on randomization of ecological data (Gotelli & Graves 1996). The models answer to the question whether the observation data appear non-random when compared to simulated data meaning that randomization produces a pattern that would be expected in the absence of a par-ticular process. The approach, initially largely used in biogeography resembles hypothesis testing in conventional statistics. In some respects, nestedness is testing the same thing as Cscore, however, C score is a better descriptor of species communities as-sembled by competition by considering the checkerboard model presumably generated by competition as defi ning community structure.
(8)_k ki si meanZisiσ
−=
62
Ann. For. Res. 56(1): 53-78, 2013 Research article
Interaction richness is analogous sim-ply the total number of links in the network (Tylianakis et al. 2007). The unipartite projection of the bipartite graph (Gómez & Perfetti 2011) was generated considering links which depict shared mutual-ists among trees. That is, in the unipartite ver-sion, two tree species are linked and weighted by shared ectomycorrhizal species and another representation links fungal species according to their connections to hosts. The unimodal projection of fungi was employed for the cal-culation of betweeness, closeness and normal-ized degree centrality since most of network descriptors are defi ned for those (Borgatti & Everett 1997, Olesen et al. 2007). Unimodal projections can be particularly useful in map-ping community but the information loss as-sociated with the transformation is inevitable (Padrón et al. 2011). The bipartite and unipar-tite networks were analyzed and graphically generated with and Pajek software (Batajeli & Mrvar 2010). Modularity was assessed using the software NETCARTO. Modules were generated in Pa-jek. The signifi cance of patterns in null models are tested using randomization tests: describe a pattern by a single index then compare the observed value of the index to the distribu-tion of index values from simulated matrices (Manly 1991, Gotelli & Entsminger 2001). The randomizations for the tested indices, co-occurrence, nestedness and modularity were performed by the programs used.
Additional community structure assessment: Co-occurrence, similarity
Species co-occurrence function of shared (or not shared) hosts was tested using one of the most reliable co-occurrence indices, C-score in order to fi nd whether assemblage of the ectomycorrhizal community was random or assembled by interspecifi c competition (Dia-mond 1975). A null model considering ran-
dom species co-occurrence is tested on a large number of null communities, usually 1000. The position of the observed index in the fre-quency distribution of simulated data is then used to assign a probability value to the pattern (Manly 1991, Gotelli 2001). Both metrics were calculated using Ecosim7 software (Gotelli & Entsminger 2001). The C-score is the average of all possible checkerboard pairs, calculated for species which occur at least once in a pres-ence / absence matrix. In competitively struc-tured communities or structured by some other interaction type the C-score should be signifi -cantly larger than expected by chance (Gotelli & McCabe 2002). A standardized effect size (SES) is calculated: a value greater than 2 and lesser than -2 is statistically signifi cant with a tail probability less than 0.05 and stands for a signifi cance test for accepting or rejecting the null hypothesis (of random species assembly). The calculated SES uses z-transformed scores of the original data and can be employed to compare results from different matrices and algorithms (Gotelli & Mc Cabe 2002). In order to assess similarities between woody species in terms of ectomycorrhizal associates, several similarity indices were tested and the fi nal decision was taken as function of the best cophenetic correlation result (Legendre & Leg-endre 1998). The Kulczynski similarity index yielded the best results, with cophenetic cor-relation of 0.8189. Similarity analysis in terms of shared ectomycorrhizal species by seven woody species was performed using pair-wise clustering algorithm. For a better understand-ing of similarity distances among host species in terms of ectomycorrhizal mutualists, two di-mensional non metric multidimensional scal-ing was employed as ordination algorithm; the Kulczynski similarity index [2C/(N1 + N2 – 2C) with C = common species of site N1 and N2] was the best choice for the ordination yielding the lowest stress of 0.163. Values around 0.1 are considered appropriate for goodness-of-fi t test (Borgatti & Everett 1997). The calcula-tions and graphical representations were per-

63
Fodor Linking biodiversity to mutualistic networks ...
formed using the software PAST (Hammer et al. 2001).
Results
The generated network is an undirected, un-weighted and qualitative bipartite graph de-picting the mutualist relationships between trees and ectomycorrhizal macrofungi (fi g. 1). The topology analysis and C score result reveal the non random assemblage of the network of trees and ectomycorrhizal macromycetes; the network is asymmetric, highly connected, nested and modular. The descriptors displayed in Table 1 are size dependent and are a good background for the comparison with other mutualistic networks described by different authors. The network (Table 1) is characterized by large size (609 potential links) and also its high connectance (0.42), unusually large as compared to other mutualistic networks: plant
facilitation networks (0.24), described by Verdù and Valiente-Banuet (2008), pollination networks, about 0.043-0.070 (Ramos-Jiliberto et al. 2010), 0.11 (Olesen et al. 2006). 0.086 (Hegland et al. 2010), 0.043 to 0.070 (Ramos-Jiliberto et al 2010), 0.15 and 0.24 (de Men-doça Santos et al. 2010) or 0.026 (Petanidou et al. 2008) but comparable with plant pollination networks published earlier such as 0.40 in bog plants and their pollinators (Douglas 1983) or hummingbirds as pollinators and plants in Colombia (Snow & Snow 1980). High con-nectance is explained by the low number of considered hosts, previous studies showing that connectivy decreases exponentially as the number of hosts increases (Poulin 2010). It is currently considered that low con-nectance indicates highly specialized com-munities (Dyer et al. 2010), the ectomycor-rhizal network indicating the opposite at the level of woody species group (average node degree of 29.57). Trees acquire a great num-ber of ectomycorrhizal partners during their
Table 1 Network metrics of the bipartite graph depicting links between forest tree species in the Hoia rec-reational forest, of the city of Cluj and ectomycorrhizal fungi
Network summaryTrees-ectomycorrhizal fungi mutualistic network(94 vertices, 246 links)
Interaction richness = number of links 246Species richness = number of nodes 7 host species, 87 mycobiontsConnectance 0.42Richness ratio 12Web asymmetry 0.85Network size, M 609Bipartite network diameter 4Average distance between reachable pairs 2.47Average link density 2.63
Average node degree 29.57 for hosts2.63 for mycobionts
Whole network average node degree 5.106Statistics for closeness centrality (unipartite network of ectomycorrhizal fungi)
min = 0.6277; max = 1, mean = 0.810 ± 0.1160
Statistics for betweenness centrality (unipartite network of ectomycorrhizal fungi)
min = 0; max = 0.0048; mean = 0.00019 ± 0.0022
Statistics for normalized degree centrality (unipartite network of ectomycorrhizal fungi)
min = 0.4069; max = 1; mean = 0,8202 ± 0.1655

64
Ann. For. Res. 56(1): 53-78, 2013 Research article
life time sharing these species. Hosts with the largest numbers of ectomycorrhizal partners expressed as node degree are Quercus petraea (68) and Carpinus betulus (46). It is currently considered that generalists maintain the stabil-ity of a network (Diaz - Castelazo et al. 2010). Specialists have lower node degree than gen-eralists (Dormann 2011), many macromycetes being linked to one, two or three tree species (average node degree = 2.63). All considered hosts are generalists while almost half of the identifi ed mycobionts are specialists, a charac-teristic of the described ectomycorrhizal net-work. Low network diameter (4) differs from re-ported diameters of pollination networks be-tween 7 and 8 (Petanidou et al. 2008) sustain-ing high cohesion of the web. The network presents high asymmetry (0.85), with the prev-alence of the higher trophic level species, the ectomycorrhizal fungi. For the few selected tree species there are many mycobionts, the ratio of tree species to ectomycorrhizal fungi (richness ratio) is 12.42, also an indication of asymmetry. For trees, node degree depicts the actual number of mycobionts functioning as a proxy for spe-cies richness. For ectomycorrhizal fungi, node degree separates mycobiont generalists ver-sus specialists in what concerns the number of hosts. The maximum number of associated hosts (also maximum node degree) is 7 for ectomycorrhizal fungi. The average distance between reachable pairs is small, 2.47, a com-mon characteristic for mutualistic bipartite networks (Bezerra et al. 2009). In the unipartite network version centered on macromycetes (not illustrated), 49 fungal species display betweeness centrality, BC > 0 playing the role of connectors (Gonzales et al. 2010), connecting areas of the network otherwise sparsely linked. They are generalist species important for the cohesiveness of the network and account for 56.32% of the spe-cies in the network, remarkably higher rep-resentation than in seed dispersal networks,
11.9% (Spotswood at al. 2012) but close to plant-pollination networks as 57% (Inoue and Pyke 1988)). Examples of ectomycorrhi-zal fungi playing the role of connectors are: Boletus chrysenteron Bull, Hebeloma crustu-liniforme (Bull.) Quél, Tricholoma virgatum (Fr.) P. Kumm, Boletus aestivalis (Paulet) Fr., Laccaria laccata (Scop.) Cooke, Amanita pan-therina (DC.) Krombh, Boletus edulis Bull., Coenococcum geophilum Fr., Amanita phal-loides (Vaill. ex Fr.) Link, Russula cyanoxan-tha (Schaeff.) Fr., Lactarius. piperatus (L.) Pers, Russula foetens (Pers.) Pers., and others. Coenococcum geophilum is the most frequent-ly identifi ed species on roots being responsible for linking different hosts in a mycorrhizal net-work (Valentine et al. 2004). The remaining 38 fungal nodes are pend-ing, being isolated and connected to just one host and are to be considered ultra-peripheral. However, the largest participation in terms of betweenness centrality is demonstrated by 24 fungal species (0.0048). All nodes display large values for closeness centrality (CC ex-treme values: maximum of 1 for the same 24 fungal species as for betweenness centrality and minimum of 0.6277 for Boletus edulis). Among mycobionts with high closeness cen-trality (CC) values are Coenococcum geophi-lum, Amanita phalloides, Lactarius piperatus, Lacaria laccata and Hebeloma crustuliforme. The highest normalized degree signifi es the highest linking capacity for 24 fungal species (maximum value of 1), same species as for be-tweenness and closeness centrality. The unipartite projection shows that all se-lected woody species are linked by ectomycor-rhizal mutualists, their network is completely connected; connectance = 1, a situation de-scribed for several pollination networks and parasite – metazoans networks (Poulin 2010). The unipartite projection centered on hosts is a surrogate for niche overlap, highest number of links between hosts refl ecting the level of mutualist share among woody species (fi g.1). Nestedness analysis shows a highly sig-

65
Fodor Linking biodiversity to mutualistic networks ...
nifi cant difference of the observed matrix temperature as compared to null model I and II simulated matrix temperatures (T = 16.78, mean simulated T for null model I = 38.29, mean simulated T for null model II = 31.63) N = 0.83, corresponds to relatively high nest-edness of the ectomycorrhizal network. It im-plies also a higher nestedness degree for the observed matrix as expected from the null model runs. The nested matrix (Fig. 3) illus-
trates the deviation from random pattern and the closeness of the observation data to a per-fectly packed array of presence / absence cells. The fi nal pattern after re-arrangements of the matrix rows and columns is with most of the interactions mapped in the lower half of the matrix. Nested patterns typically yield a core of species (generalists) as a cluster for other peripheral species, showing a structured archi-tecture compared to random networks.
On the left, bipartite network of main woody species and ectomycorrhizal associates in broad-leaved mixed forest, Hoia recreational forest, Forestry District Cluj-Napoca. On the right, the unipartite version of the same network. Notations: Qc - Quercus cerris L., Qr - Q. robur L., Qp - Q. petraea (Matt.) Liebl., Tc - Tilia tomentosa Miller, Cb - Carpinus betulus L., Ca - Corylus avellana L., Qpb - Q. pubescens Mill. Fungal partners are listed in the appendix. Figures attached to unipartite graph represent the number of shared ectomycorrhizal species
Figure 1

66
Ann. For. Res. 56(1): 53-78, 2013 Research article
The nestedness as a community property in the ectomycorrhizal bipartite network displays similar trend which are comparable to other mutualistic networks such as plant facilitation network-0.876 (Verdú and Valiente-Banuet 2008), seed dispersal - 0.843 or pollination networks - from 0.853 to 0.982 (Bascompte et al 2003: Petanodou et al. 2008), cleaning
mutualist networks, 0.82 (Sazima et al. 2010) or ectoparasite-vertebrate networks-from 0.48 to 0.97 (Graham et al. 2009). It is commonly interpreted as specialization asymmetry: spe-cialists (species with few links, ectomycorrhi-zal fungi in this case) interact with generalists (species with many links, woody hosts in this case) (Blüthgen et al. 2008).
Left, cluster ordination using Kulczynski similarity index and pair-wise algorithm. Right, two di-mensional non metric multidimensional scaling ordination with minimum spanning tree distances among hosts in terms of ectomycorrhizal partners: A - Quercus cerris, B - Q. robur, C - Q. petraea, D - Tilia tomentosa, E - Carpinus betulus, F - Corylus avellana, G - Q. pubescens
Figure 2
Nested, packed adjacency matrix of the bipartite network (trees-ectomycorrhizal macrofungi)Figure 3

67
Fodor Linking biodiversity to mutualistic networks ...
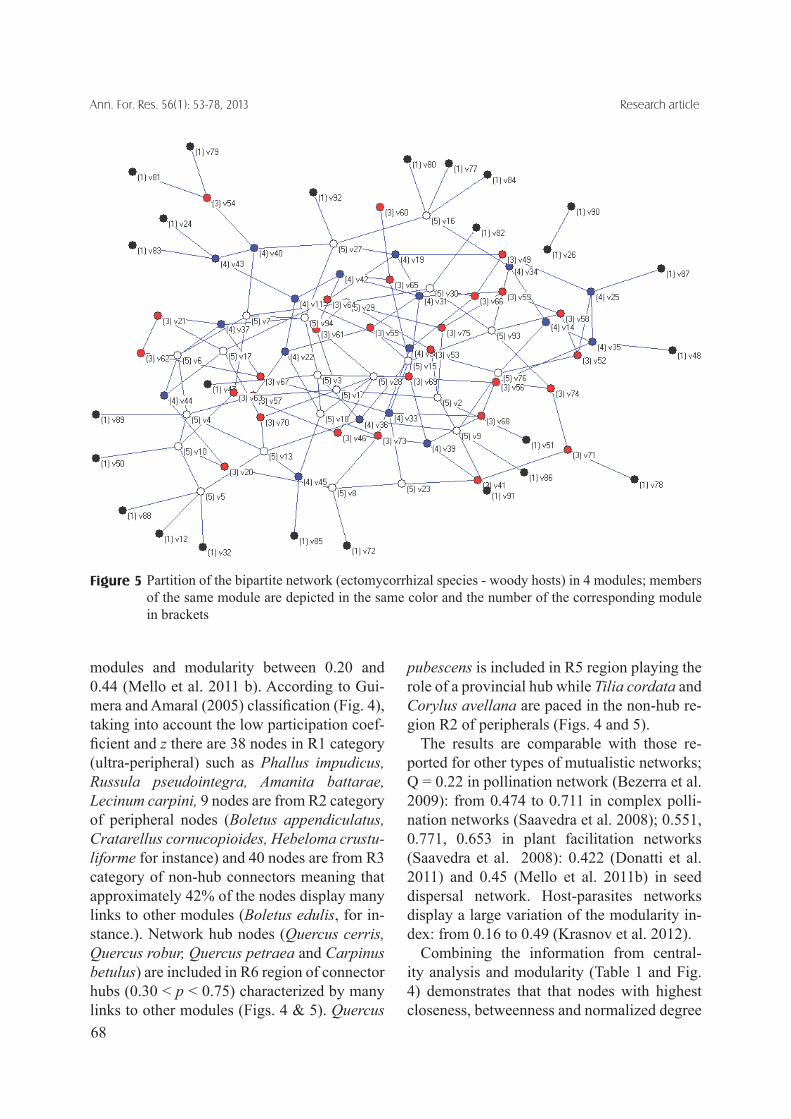
On the other hand, host specifi city must be taken into consideration as a factor affecting the extent of nestedness, previously illustrated for host-parasite interaction networks (Patter-son et al. 2009). This property mirrors network asymmetry with generalist species interacting with other generalists as well as with special-ists and specialists displaying few links gen-erally with generalists from the other network group (Graham et al. 2009). However, the association with only one host in the case of ectomycorrhizal networks is questionable as being determined by specialization since there are multiple possibilities for same fungal spe-cies being associated with other woody species not considered here. Modularity analysis yielded four modules that were identifi ed after running the NET-CARTO package on the original presence / absence matrix, using repeated runs (between 50 and 100 randomizations). The highest value obtained for modularity index reported is (Q
= 0.2417), together with the model that mini-mizes the number of links between modules. The mean of the simulated index by repeated randomizations is signifi cantly higher than the observed index (0.2643 ± 0.0056). There are 25 species in fi rst module including Carpi-nus betulus, 28 species in the second module including Quercus petraea, 18 species in the third module including Quercus robur, and 23 species in the forth module including Quercus cerris, Tilia cordata, Corylus avellana and Quercus pubescens (Fig. 5). A modularity in-dex of 0.2417 indicates low modularity of the bipartite network, many links being external-ized among modules instead of being maxi-mized within modules also many nodes are pending, a situation favorable for linkage to other potential hosts not included in the pres-ent study. For comparison, pollination networks dis-play at average 8.8 modules (Olesen et al. 2007) seed dispersal network display 4 to 5
Participation coeffi cient-within module degree z space (classifi cation of nodes according to their roles) representation of the bipartite mutualistic network: ectomycorrhizal fungi-woody hosts in Hoia forest
Figure 4
-1
0
1
2
3
4
5
6
0 0.1 0.2 0.3 0.4 0.5 0.6 0.7 0.8
Participation coeficient-modularity
With
in m
odul
e de
gree
z
68
Ann. For. Res. 56(1): 53-78, 2013 Research article
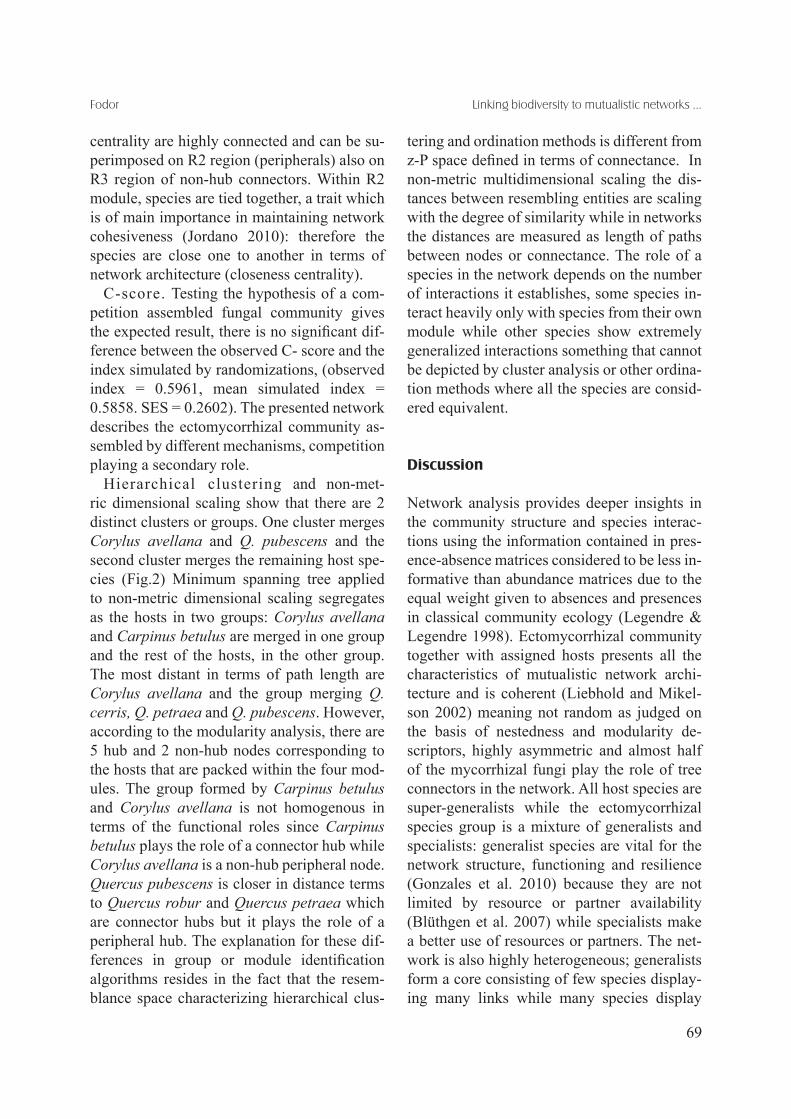
modules and modularity between 0.20 and 0.44 (Mello et al. 2011 b). According to Gui-mera and Amaral (2005) classifi cation (Fig. 4), taking into account the low participation coef-fi cient and z there are 38 nodes in R1 category (ultra-peripheral) such as Phallus impudicus, Russula pseudointegra, Amanita battarae, Lecinum carpini, 9 nodes are from R2 category of peripheral nodes (Boletus appendiculatus, Cratarellus cornucopioides, Hebeloma crustu-liforme for instance) and 40 nodes are from R3 category of non-hub connectors meaning that approximately 42% of the nodes display many links to other modules (Boletus edulis, for in-stance.). Network hub nodes (Quercus cerris, Quercus robur, Quercus petraea and Carpinus betulus) are included in R6 region of connector hubs (0.30 < p < 0.75) characterized by many links to other modules (Figs. 4 & 5). Quercus
pubescens is included in R5 region playing the role of a provincial hub while Tilia cordata and Corylus avellana are paced in the non-hub re-gion R2 of peripherals (Figs. 4 and 5). The results are comparable with those re-ported for other types of mutualistic networks; Q = 0.22 in pollination network (Bezerra et al. 2009): from 0.474 to 0.711 in complex polli-nation networks (Saavedra et al. 2008); 0.551, 0.771, 0.653 in plant facilitation networks (Saavedra et al. 2008): 0.422 (Donatti et al. 2011) and 0.45 (Mello et al. 2011b) in seed dispersal network. Host-parasites networks display a large variation of the modularity in-dex: from 0.16 to 0.49 (Krasnov et al. 2012). Combining the information from central-ity analysis and modularity (Table 1 and Fig. 4) demonstrates that that nodes with highest closeness, betweenness and normalized degree
Partition of the bipartite network (ectomycorrhizal species - woody hosts) in 4 modules; members of the same module are depicted in the same color and the number of the corresponding module in brackets
Figure 5
69
Fodor Linking biodiversity to mutualistic networks ...
centrality are highly connected and can be su-perimposed on R2 region (peripherals) also on R3 region of non-hub connectors. Within R2 module, species are tied together, a trait which is of main importance in maintaining network cohesiveness (Jordano 2010): therefore the species are close one to another in terms of network architecture (closeness centrality). C-score. Testing the hypothesis of a com-petition assembled fungal community gives the expected result, there is no signifi cant dif-ference between the observed C- score and the index simulated by randomizations, (observed index = 0.5961, mean simulated index = 0.5858. SES = 0.2602). The presented network describes the ectomycorrhizal community as-sembled by different mechanisms, competition playing a secondary role. Hierarchical clustering and non-met-ric dimensional scaling show that there are 2 distinct clusters or groups. One cluster merges Corylus avellana and Q. pubescens and the second cluster merges the remaining host spe-cies (Fig.2) Minimum spanning tree applied to non-metric dimensional scaling segregates as the hosts in two groups: Corylus avellana and Carpinus betulus are merged in one group and the rest of the hosts, in the other group. The most distant in terms of path length are Corylus avellana and the group merging Q. cerris, Q. petraea and Q. pubescens. However, according to the modularity analysis, there are 5 hub and 2 non-hub nodes corresponding to the hosts that are packed within the four mod-ules. The group formed by Carpinus betulus and Corylus avellana is not homogenous in terms of the functional roles since Carpinus betulus plays the role of a connector hub while Corylus avellana is a non-hub peripheral node. Quercus pubescens is closer in distance terms to Quercus robur and Quercus petraea which are connector hubs but it plays the role of a peripheral hub. The explanation for these dif-ferences in group or module identifi cation algorithms resides in the fact that the resem-blance space characterizing hierarchical clus-
tering and ordination methods is different from z-P space defi ned in terms of connectance. In non-metric multidimensional scaling the dis-tances between resembling entities are scaling with the degree of similarity while in networks the distances are measured as length of paths between nodes or connectance. The role of a species in the network depends on the number of interactions it establishes, some species in-teract heavily only with species from their own module while other species show extremely generalized interactions something that cannot be depicted by cluster analysis or other ordina-tion methods where all the species are consid-ered equivalent.
Discussion
Network analysis provides deeper insights in the community structure and species interac-tions using the information contained in pres-ence-absence matrices considered to be less in-formative than abundance matrices due to the equal weight given to absences and presences in classical community ecology (Legendre & Legendre 1998). Ectomycorrhizal community together with assigned hosts presents all the characteristics of mutualistic network archi-tecture and is coherent (Liebhold and Mikel-son 2002) meaning not random as judged on the basis of nestedness and modularity de-scriptors, highly asymmetric and almost half of the mycorrhizal fungi play the role of tree connectors in the network. All host species are super-generalists while the ectomycorrhizal species group is a mixture of generalists and specialists: generalist species are vital for the network structure, functioning and resilience (Gonzales et al. 2010) because they are not limited by resource or partner availability (Blüthgen et al. 2007) while specialists make a better use of resources or partners. The net-work is also highly heterogeneous; generalists form a core consisting of few species display-ing many links while many species display

70
Ann. For. Res. 56(1): 53-78, 2013 Research article
few links, unlike random networks which in contrast, have a more even distribution of links (Jordano et al. 2003). Hosts (trees and shrubs) playing the role of super-generalists function as hubs for ectomycorrhizal mycobionts in the network adding the interactions that connect different modules (Jordano 2010). The ectomycorrhizal community is charac-terized by relatively high connectance, high nestedness and low modularity, a combination of network properties stressed by other authors as a general trait for mutualistic networks (For-tuna et al. 2010, Olesen et al. 2007). The prop-erty of high heterogeneity (uneven distribution of node degrees), contrasting with more even distribution in random networks indicates that the network is robust to random disturbances but sensitive to directed losses of nodes (Al-bert et al. 2000). High connectance is appar-ently linked to low network size, a property re-ported previously for plant-pollinator networks (Olesen & Jordano 2002). This is the explana-tion for the organizational characteristic of any mutualistic network around a core of general-ist species that can be reasonably robust to dis-turbances directed randomly (Jordano 2010). The nested structure of ectomycorrhizal com-munities relaxes competition as it was previ-ously observed in pollinator / plant systems (Bastolla et al. 2009: Ramos-Jiliberto et al. 2010) favoring coexistence. The basic idea stressed by this study is that the ectomycor-rhizal macrofungi species pool contains sub-sets which are nested, the dominating tree spe-cies harboring the most species rich subset of mutualists. The community assembly is not driven mainly by competition (as in checker-board model) but by some other mechanisms that generate the nested model. Network architecture is dominated by high numbers of ectomycorrhizal fungi and low number of the host species, a characteristic en-countered in cleaning mutualist assemblages in coral reefs (Guimarães et al. 2006) as the richness species ratio (number of fungal spe-cies/number of woody host species) is high,
equal to 12.42. This trait affects the degree of nestedness considered to be high in cleaning mutualistic assemblages and also in ectomy-corrhizal network, compared to other plant-animal assemblages of similar species rich-ness, mutualistic networks which show less marked patterns of nestedness (Guimarães et al. 2006). Centrality measures and modularity work together in clarifying the roles of species within the ectomycorrhizal fungi community. Modularity analysis is a fi ner tuned tool in the assessment of species roles than betweenness centrality (BC). Species with BC > 0 consid-ered connectors in centrality space, are include in different categories according to participa-tion coeffi cient-z score space: low z and high participation coeffi cient (C) place the species in connector R3 region while species high in both C and z scores high are super-generalist species or network hubs (the seven host spe-cies). There are 40 connector species which can be considered generalists and 38 ultra-pe-ripheral macromycetes which can be consid-ered specialists and only 9 peripheral species. However, species roles can change in a larger species richness context if additional data on ectomycorrhizal morphotypes and species identifi ed by molecular tools are collected. A low level of modularity in ectomycorrhizal mutualistic network is explained by the high intimacy of the interaction, a trait which af-fects network architecture in a similar way as in plant-animal mutualistic networks (Fontaine et al. 2011). The cause of so many mutualists associated with same host is partially explained by insur-ance hypothesis (Hooper at al. 2005). An al-ternate explanation comes from graph theory consisting in the property of the preferential at-tachment of new nodes to an existing network where densely connected nodes tend to acquire more links, colloquially rendered by the ex-pression ”rich get richer” (Barabasi & Albert 1999, Jordano et al. 2003). Quercus petraea is a dominant, climax species in the hilly mixed

71
Fodor Linking biodiversity to mutualistic networks ...
broadleaved forests therefore it acquires many mutualists (68 ectomycorrhizal species). The second species in terms of associated mycobi-onts (46 species) is hornbeam (Carpinus betu-lus) which is currently replacing the dominant Quercus species as a consequence of the inter-play of several natural and anthropogenic fac-tors.. The interactions within mutualistic networks are long termed when compared to interac-tions occurring in food-webs; mutualistic net-works are more nested than trophic networks (Thébault & Fontaine 2010) also more con-nected. In fact, larger mutualistic networks were shown that were both nested and modu-lar also, nestedness being complementary to modularity (Olesen et al. 2007). As connectiv-ity increases, less specialization is expected to characterize the nodes (species) and modular-ity decreases since this network property de-picts the degree of specialization. An ectomyc-orrhizal network is highly connected due to the high representation of macromycetes general-ists. Having a nested structure, the network is highly asymmetric and there is a core of spe-cies with a high interaction density, separating two categories: generalists versus specialists. Generalist plant species tend to interact with generalist macrofungi. Rare ectomycorrhizal fungi (for example, Amanita battarae) tend to interact with generalist plants gaining greater chances for survival. The degree of intimacy is higher in ecto-mycorrhizal networks than in pollination or facilitation networks. It is worth to stress the fact that nestedness is in closer association with mutualistic interactions such as pollina-tion networks (Genini et al. 2010) and plant-ant networks (Guimarães et al. 2006) which are non-intimate mutualistic relationships than modular networks which are associated with antagonistic communities and intimate mutu-alism (Fontaine et al. 2011). Both nestedness and modularity provide benefi ts for communi-ties (May 1972, Bastolla et al. 2009). The su-pergeneralist species (the trees in ectomycor-
rhizal network) are hubs and connect different modules whicht is a characteristic pattern in mutualistic webs (Jordano 2010) Modularity is a global level topological prop-erty of a complex network and it reveals in the case of ectomycorrhizal network the relation-ships among trees mediated by mycorrhizal fungal species. Modularity analysis shows that this system is weakly modular: compared to other published mutualistic bipartite networks, the value of the calculated woody species-ec-tomycorrhizal fungi bipartite network modu-larity index (0.2417) is small. Hierarchical clustering results produced two main clusters while modularity assessment produced four distinct modules where nodes were affi liated according to their roles in z-P parameter space. In the case of clustering, the affi liation of species to clusters is performed according to the similarity among woody spe-cies in the way they share mycobionts within the resemblance space. Clustering and non-metric dimensional scaling produced similar results: there are two main groups of clusters of host species separated by similarity (clus-tering) or distance (non-metric dimensional scaling) in terms of ectomycorrhizal mutual-ists. When considering the modular structure of the network, the hosts are included in differ-ent modules and play different roles. Two host species are non-hub peripherals (Tilia cordata and Corylus avellana), one host is a provin-cial hub (Quercus pubescens) and the other four remaining hosts play the role of connec-tor hubs. However, they are placed in different clusters or groups according to their degree of similarity in sharing mutualist fungi. Modules refl ect in a more accurate way the structure of the ectomycorrhizal community in the context of the mutualist relationship with their woody hosts given the possibility to identify the roles played by the species. The ectomycorrhizal community displays particular structural features not confi rming competition hypothesis of the community as-sembly. The assembly model is not a checker-

72
Ann. For. Res. 56(1): 53-78, 2013 Research article
board as assessed by C-score since the result show that ectomycorrhizal fungi are not par-titioned according to this model in a random manner as function of their hosts which also means that competition is not the main driv-ing force in community shaping. A better result was obtained assuming that fungal mutualistic community is assigned to hosts according to the nested model of community assembly. It is worth mentioning that nodes which are highly connected or central are easy targets in case of perturbations (Jordan & Scheuring 2004) and the extirpation of these nodes affect the properties of whole network. In the case of preferential tree extraction, for instance Q. petraea has a greater economical value than Carpinus betulus, therefore the more valuable tree is exposed to greater exploitation pressure. The mycorrhizal fungi community is relatively resilient and many species, the generalists can switch to different hosts, however, overexploi-tation by picking of mycorrhizal species linked to multiple tree hosts may cause major pertur-bation of the network. To state a concluding remark, all mutualistic networks display comparable topologies, ecto-mycorrhizal fungi-woody host being included. Generally, when compared to antagonistic networks, these exhibit higher nestedness and lower modularity. For a particular group of mutualistic networks, those exhibiting a great-er intimacy between partners, low connect-ance, high modularity and low nestedness are characteristic (Bascompte et al. 2003, Fontaine et al. 2011). The presented bipartite mutualistic network shows particular traits such as: high species asymmetry, generalist nature of trees and sev-eral ectomycorrhizal fungi, the approximately equal amount of generalists and specialists among ectomycorrhizal partners combined with highly dissimilar traits compared to other mutualistic networks, high nestedness, high connectance and low modularity. This combination of network properties makes the ectomycorrhizal network singular among mu-
tualistic bipartite networks due to the unique characteristic of the ectomycorrhizal fungi: they interconnect the trees.
References
Albert R., Jeong H., Barabási A.L., 2000. Error and attack tolerance of complex networks. Nature 406: 378-382.
Anonymous, 1999. Amenajamentul UP IV Făget, O.S. Cluj, jud Cluj, Proiectant. S.C. Silva, Dan Company, Piteşti (Forest management of the forestry unit, IV Făget, Forestry District Cluj, in Romanian).
Atmar W., Patterson B.D., 1993. The measure of order and isorder in the distribution of species in fragmented habi-tat. Oecologia (Berlin) 96: 373–382.
Barabási A.L., Albert R., 1999. Emergence of scaling in random networks. Science 286(5439): 509-512.
Barber M.J., 2007. Modularity and community detection in bipartite networks. Physical Review E 76(6): 66102. American Physical Society.
Bascompte J., Jordano P., 2007. Plant-Animal Mutualis-tic Networks: The Architecture of Biodiversity. Annual Review of Ecology, Evolution, and Systematics 38(1): 567-593.
Bascompte J., Jodano P., Olesen J.M., 2006. Asymmetric coevolutionary networks facilitate biodiversity mainte-nance. Science 312: 431-433.
Bascompte J., Jordano P., Melián C., Olesen J.M., 2003. The nested assembly of plant-animal mutualistic net-works. Proceedings of the National Academy of Sci-ences of the USA 100: 9383–9387.
Bastolla U., Fortuna M.A., Pascual-Garcia A.B., Ba-scompte J., 2009. The architecture of mutualistic net-works minimizes competition and increases biodiver-sity. Nature 458: 1018-1020.
Batagelj V. Mrvar A., 2010. Pajek: program for analysis and visualization of large networks. Department of Mathematics, University of Ljubliana.
Bezerra E.L.S., Machado I.C., Mello M.A.R., 2009. Pol-lination networks of fl owers: a tiny world within the smallest of all words. Journal of Animal Ecology 78: 1096-1101.
Blüthgen N., 2010. Why network analysis is sometimes disconnected from community ecology: A critique and an ecologist’s guide. Basic and Applied Ecology 11: 185-195.
Blüthgen N., Menzel F., Hoverstadt T., Fiala B., 2007. Specialization, constraints and confl icting interests in mutualistic networks. Current Biology 17: 1-6.
Blüthgen N., Fründ J., Vásquez D.P., Menzel F., 2008. What do interaction network metrics tell us about spe-cialization and biological traits? Ecology 89(21): 3367-3399.
Borgatti S.P., Everett M.G., 1997. Network analysis of 2-mode data. Social Networks 19: 243-269.

73
Fodor Linking biodiversity to mutualistic networks ...
Bruns T.D., 1995. Thoughts on the process that maintain local species diversity of ectomycorrhizal fungi. Plant Soil 170: 63-73.
Campbell C., Yang S., Albert R., Shea K., 2011. A net-work model for plant-pollinator a community assembly. PNAS 108(1): 197-202.
Connor E.F., Simberloff D., 1979. The assemblage of species communities. Chance or competition. Ecology 60(6): 1132-1140.
De Roman M., Claveria V., De Miguel A.M., 2005. A revi-sion of the descriptions of ectomycorrhizas published since 1961. Mycological Research 109(10): 1063-1104.
Diamond J.M., 1975. Assembly of species communities. In: Cody M.L., Diamond J.M., (eds), Ecology and evo-lution of communities. Harvard University Press, pp. 342–444.
Donatti C.I., Guimarães P.R., Galetti M., Pizo M.A., Marquetti F.M.d., Dirzo R., 2011. Analysis of a hyper-diverse seed dispersal network: modularity and under laying mechanisms. Ecology Letters 14(8): 773-781.
Doniţă N., Popescu A., Paucă-Comanescu M., Mihailescu S., Biriş I.A., 2005. Habitatele din România [The habi-tats of Romania] Ed. Tehnică Silvică, Bucureşti.
Dormann C.F., 2011. How to be a specialist? Quantifying specialization in pollination networks. Network Biolo-gy 1(1): 1-20.
Dormann C.F., Fründ J., Blüthgen N., Gruber B., 2009. Indices, graphs and null models: Bipartite ecological networks. The Open Ecology Journal 2: 7-24.
Douglas S., 1983. Floral color patterns and pollination at-traction in bog habitats. Canadian Journal of Botany 61: 3494-3501.
Dunne J.A., Williams R.J., Martinez N.D., 2002. Network structure and biodiversity loss in food webs: robustness increases with connectance. Ecology Letters 5: 558-567.
Dyer L.A., Walla T.R., Greeney H.F., Stireman III J.O., Hazen R.F., 2010. Diversity of interactions: a metric for studies of biodiversity. Biotropica 42(3): 281-289.
Fodor E., Timofte A., Geambaşu T., 2011. Mycorrhizal status of several Quercus species in Romania (Quercus cerris, Q. frainetto, Q. robur) and the optimization per-spective of growth conditions for in vitro propagated plants transplanted in the fi eld. Annals of Forest Re-search 54(1): 57-72.
Fodor E., 2011. Ecological niche of plant pathogens. An-nals of Forest Research 54(1): 3-21.
Fontaine C., Guimarães P.R.Jr., Kéfi S., Loeuille N., Mem-mott J., van der Putten W.H., van Veen F.J.F., Thébault E., 2011. The ecological and evolutionary implications of merging different types of networks. Ecology Letters 14: 1170-1181.
Fortuna M.A, Stouffer D.B., Olesen J.M., Jordano P., Mouillot D., Krasnov B.R., Poulin R., Bascompte J., 2010. Nestedness versus modularity in ecological net-works: two sides of the same coin? Journal of Animal Ecology 79(4): 811-817.
Freeman L.C., 1979. Centrality in social networks: Con-ceptual clarifi cation. Social Networks 1: 215-239.
Genini J., Morellato L.P.C., Guimarães P.R., Olesen J.M., 2010. Cheaters in mutualistic networks. Biology Letters 6: 494-497.
Gòmez J.M., Perfetti F., 2011. Fitness consequences of centrality in mutualistic individual-based networks. Pro-ceedings Biological Science 279(1734): 1754-1760.
Gonzáles A.M.M., Dalsgaard B.J.M., 2010. Centrality measures and the importance of generalist species in pollination networks. Ecological Complexity 7: 36-43.
Gotelli N.J., Graves G.R., 1996. Null models in ecology. Smithsonian Institution, Washington, D. C., U.S A.
Gotelli N.J., 200. Research frontiers in null model analy-sis. Global Ecology and Biogeography 10: 337-343.
Gotelli N.J., Entsminger G.L., 2001. EcoSim: Null models software for ecology. Version 7.0. Acquired Intelligence Inc. & Kesey-Bear. Web: http://homepages.together.net/~gentsmin/ecosim.htm. Accesed: March 2012.
Gotelli N.J., Entsminger G.L., 2001. Swap and fi ll algo-rithms in null model analysis: rethinking the knight’s tour. Oecologia 129: 281-291.
Gotelli N.J., McCabe D.J., 2002. Species co-occurrence: a meta-analysis of J.M. Diamond’s assembly rules model. Ecology 83(8): 2091-2096.
Graham S.P., Hassan H.K., Burkett-Cadena N.D., Guyer C., Unnasch T.R., 2009. Nestedness of ectoparasite-ver-tebrate host networks. PLos One 4(11): e7873.
Guimarães P.R.Jr., Sazima C., Furtado dos Reis S., Sazima I., 2006. The nested structure of marine cleaning sym-bioses: is it like fl owers and bees? Biology Letters.
Guimerà R., Amaral L.A.N., 2005. Functional cartography of complex metabolic networks. Nature 433: 895-898.
Hammer Ø., Harper D.T., Ryan P.D., 2001. PAST: paleon-tological statistics software package for education and data analysis. Paleontologia Electronica: http://palaeo-electronica. Org.
Hegland S.J., Dunne J., Nielsen A., Memmott J., 2010. How to monitor ecological communities cost-effi cient-ly: The example of plant-pollinator networks. Biologi-cal Conservation 143: 2092-2101.
Hooper D.U., III, Ewel F.S.C., Hector J.J., Inchausti A., Lavorel P., Lawton S., Lodge J.H., Loreau D.M., Naeem M., Schmidt S., Setälä B., Symstad H., Vandermeer A.J., Wardle D.A., 2005. Effects of biodiversity on eco-system functioning: a consensus of current knowledge. Ecological Monograph 75: 3-35.
Ingram T., Steel M., 2001. Modeling the unpredictability of future biodiversity in ecological networks. Journal of Theoretical Biology 264: 1047-1056.
Inoue D.W., Pyke R., 1988. Pollination biology in the snowy mountains of Australia: comparisons with mon-tane Colorado. Australian Journal of Ecology 13: 191-210.
Jones C.C., Lawton J.H., Shachak M., 1994. Organisms as ecosystem engineers Oikos. 69: 373-386.
Jordán F., Scheuring I., 2004. Network ecology: topologi-cal constraints on ecosystem dynamics. Physics of Life

74
Ann. For. Res. 56(1): 53-78, 2013 Research article
Reviews I: 139-172Jordano P., 2010. Coevolution in multispecies interactions
among free-living species. Evolution: Education and Outreach 3: 40-46.
Jordano P., Bascompte J., Olesen J.M., 2003. Invariant properties in coevolutionary networks of plant-animal interactions. Ecology Letters 6(1): 69-81.
Krasnov B.R., Fortuna M.A., Mouillot D., Khokhlova, I.S., Shenbrot G.I., Poulin R., 2012. Phylogenetic sig-nal in module composition and species connectivity in compartimentalized host-parasite networks. The Amer-ican Naturalist 179(4): 501-511.
Legendre P., Legendre L., 1998. Numerical Ecology. IInd. ed., Elsevier.
Leibold M.A., Mikkelson G.M., 2002. Coherence, species turnover and boundary clumping; elements of meta-community structure. Oikos 97: 237–250.
Leibold M.A., 2006. Similarity and local co-existence of species in regional biotas. Evolutionary Ecology 12(1): 45-110.
Lurgi M., Robertson D., 2011. Automated experimenta-tion in ecological networks. Automated Experimenta-tion : 3:1http://www.aejournal.net/content/3/1/1.
Manly B.F.J., 1991. Randomization and Monte Carlo Methods in Biology. Chapman & Hall, London.
May R.M., 1972. Stability and complexity in model eco-systems. Princeton University Press.
May R.M., Oster G., 1976. Bifurcation and dynamic com-plexity in simple ecological models. American Natural-ist 110(974): 573-599.
McCoy E.D., Heck Jr., K.L., 1987. Some observations on the use of taxonomic similarity in large-scale biogeog-raphy. Journal of Biogeography 14: 79-87.
Mello M.A.R., Marquitti F.M.D., Guimarães P.R.Jr., Kalko E.K.V., Martinez de Aguilar M.A., 2011a. The modular-ity of seed dispersal: differences in structure and robust-ness between bat- and bird – networks. Oecologia 167: 131-140.
Mello M.A.R., Marquitti F.M.D., Guimarães P.R.Jr., Kalko E.K.V., Martinez de Aguilar M.A., 2011b. The missing part of seed dispersal networks: structure and robust-ness of bat-fruit interactions. PlosOne 8(2) e17395.
Memmott J., Waser N.M., Price M.V., 2004. Tolerance of pollination networks to species extinctions. Proceed-ings of the Royal Society B: Biological Sciences 271: 2605–2611.
de Mendoça Santos G., Lima Aguilar C. M., Mello M. A. R., 2010. Flower visiting guild associated with caatinga fl ora: trophic interaction networks formed by social bees and social wasps with plants. Apidologie 41: 466-475.
Montesinos-Navarro A., Segarra-Moragues J.G., Valiente-Banuel A., Verdu M., 2012. The network structure of plant arbuscular mycorrhizal fungi. New Phytologist 194: 536-547.
Newman M.E.J., 2006. Modularity and community struc-ture in networks. PNAS. 103 (23): 8577-8582.
Okuyama T., Holland J.N., 2008. Network structural prop-erties mediate stability of mutualistic communities.
Ecology Letters 11: 208-216.Olesen J. M. Jordano, P. 2002. Geographic patterns in
plant-pollination networks. Ecology 83(9): 2416-2424.Olesen J. M., Bascompte J., Dupont Y.L., Jordano P.,
2006. The smallest of all worlds: Pollination networks. Journal of Theoretical Biology 240: 270-276.
Olesen J. M., Bascompte J., Dupont Y.L., Jordano P., 2007. The modularity of pollination networks. PNAS 104(50): 19891-19896.
Olff H., Alonso D., Berg M.P., Eriksson K.B., Loreau M., Piersma T., Rooney N., 2009. Parallel ecological net-works in ecosystems. Philosophical Transactions of the Royal Society 364: 1755-1779.
Padrón B., Nogales M., Traveset A., 2011. Alternative ap-proaches of transforming bimodal into unimodal mutu-alistic networks. The usefulness of preserving weighted information. Basic and Applied Ecology 12: 713-721.
Patterson B.D., Atmar W., 1986. Nested subsets and the structure of insular mammalian faunas and archipelagos. Biological Journal of the Linnean Society 28: 65-82.
Patterson B.D., Dick C.W., Dittmar K., 2009. Nested dis-tribution of bat fl ies (Dipera; Streblidae) on Neotropi-cal bats: artifact and specifi city in host-parasite studies. Ecography 32: 481-487.
Perry D.A., Choquette C., 1987. Alellopathic effects on mycorrhiza. In ACS symposium series, vol 300. Alello-chemicals – Role in Agriculture and Forestry. American Chemistry Society 185-194
Petanidou T., Kallimanis A.S., Tzanopoulos J., Sgardelis S.P., Pantis J.D., 2008. Long-term observation of pol-lination network: fl uctuation in species and interactions, relative invariance of network structure and implica-tions for estimates and specialization. Ecology Letters 11: 564-575.
Petit R.J., Hampe A., 2006. Some Evolutionary Conse-quences of Being a Tree. Annual Review of Ecology, Evolution, and Systematics 37(1): 187-214.
Poulin, R. 2010. Network analysis shining light on para-site ecology and diversity. Trends in Parasitology 26 (10): 492-498.
Ramos-Jiliberto R., Dominguez D., Espinoza C., Lopez G., Valdovinos F.D., Bustamante R.O., Medel R., 2010. Topological change of Andean-pollinator networks along an altitudinal gradient. Ecological Complexity 7: 86-90.
Rico-Gray V., Diaz-Castelazo C., Ramirez-Hernández A., Guimarães P.R. Jr., Holland N.J., 2011. Abiotic factors shape temporal variation in the structure of an ant-plant network. Arthropod-Plant Interactions 1-7.
Rodríguez-Gironés M.A., Santamaría L., 2006. A new algorithm to calculate the nestedness temperature of presence-absence matrices. Journal of Biogeography 33: 924-935.
Saavedra, Serguei, Felix Reed-Tsochas, Brian Uzzi, 2008. A simple model of bipartite cooperation for ecological and organizational networks. Nature 457(7228): 463-466.

75
Fodor Linking biodiversity to mutualistic networks ...
Sazima C., Guimarães P.R.Jr., dos Reis S.F., Sazima I. 2010. What makes a species central in a cleaning mutu-alism network? Oikos 119: 1319–1325.
Scotti M., Podani J., Jordàn F., 2007. Weighting, scale de-pendence and indirect effects in ecological networks: a comparative study. Ecological Complexity 4: 148-159.
Selosse M.-A., Richard F., He,X., Simard S.N., 2006. My-corrhizal networks: des liaisons dangereuses? Trends in Ecology and Evolution 21(11): 621-628.
Schlosser G., Wagner G.P., 2004. Modularity in Develop-ment and Evolution. The University of Chicago Press.
Snow D.W., Snow B.K., 1980. Relationships between hummingbirds and fl owers in the Andes of Colombia. Bull.Br.Mus. Natural History, Zool. 38: 105-139.
Southwood D., He X.-H., Swensson W., Bledsoe C.S., Horwath W.R., 2005. Application of network theory to potential mycorrhizal networks. Mycorrhiza 15: 589-595.
Spotswood E.N., Meyer J.I., Bartolome W.J., 2012. An invasive tree alters the structure of seed dispersal net-works between birds and plants in French Polynesia. Journal of Biogeography.
Stone L., Roberts A., 1990. The checkerboard score and species distributions. Oecologia 85: 74-76-79.
Şesan T. E., Oancea F., Toma C., Matei G.M., Matei S., Chira F., Chira D., Fodor E., Mocan C., Ene M., Alex-andru M., 2010. Approaches to the study of mycorrhi-zas in Romania. Symbiosis 52: 75-85.
Tedersoo L., May T.W., Smith M.E., 2010. Ectomycor-rhizal lifestyle in fungi: global diversity distribution and evolution of phylogenetic lineages. Mycorrhiza 20: 217-263.
Thébault E., Fontaine C., 2010. Stability of Ecological communities and the architecture of mutualistic and trophic networks. Science 329: 853-856.
Thomson J.N., 1994. The Coevolutionary Process. Uni-versity of Chicago Press, Chicago.
Thrall P.H., Hochberg M.E., Burdon J.J., Bever J.D., 2006. Coevolution of symbiotic mutualists and parasites in a community context. Tree 2(3): 120-126.
Tylianakis J.M., Tschanrke T., Lewis O.T., 2007. Habitat
modifi cation alters the structure of tropical host-parasit-oid food webs. Nature 445: 202-205.
Vacher C., Daudin J.-J., Piou D., Desprez-Lousteau M.-L., 2010. Ecological integration of alien species into tree-parasitic fungus network. Biol. Invasions 12(9): 3249-3259.
Valdovinos F.S., Ramos-Jiloberto R., Flores J.D., Espino-za C., Lopez G., 2009. Structure and dynamics of pol-lination networks: the role of alien plants. Oikos 118: 1190-1200.
Valentine L.L., Fiedler T.L., Hart H.N., Petersen C.A., Berhihghausen H.K., Southwood D., 2004. Diversity of ectomycorrhizas associated with Quercus garryana in Southern Oregon. Canadian Journal of Botany 82: 123-135.
Vasas V., Jordan F., 2006. Topological keystone species in ecological interaction networks: Considering link qual-ity and non-trophic effects. Ecological Modelling 196: 365-378.
Vázquez D.P., Chacoff N.P., Cagnolo L., 2009. Evaluating multiple determinants of the structure of plant-animal mutualistic networks. Ecology 90(8): 2039-2046.
Verdù M., Valiente-Banuet A., 2008. The nested assembly of plant facilitation networks prevents species extinc-tion. The American Naturalist 172(6): 000-000.
Ulrich W., Gotelli, N.J., 2007. Null model analysis of spe-cies nestedness patterns. Ecology 88:1824–1831.
Webb O., 2000. Exploring the phylogenetic structure of ecological communities: An example for rain forest trees. American Naturalist 156(2): 145-155.
Weiher E., Keddy P., 1999. Ecological assembly rules: perspectives, advances, retreats. Cambridege Univer-sity Press, Cambridge.
Wilkinson D.M., 1998. The evolutionary ecology of my-corrhizal networks. Oikos 82(2): 407-410.
Williams R.J., 2011. Biology, Methodology or Chance? The Degree Distributions of Bipartite Ecological Net-works. PLoS ONE 6(3): e17645.
Work Group NATURA 2000, 2008. Pădurea de stejar pufos de la Hoia [Pubescent oak forest from Hoia]. Monitorul Ofi cial al României, part I, Nr.98 bis/7, II: 907-909.

76
Ann. For. Res. 56(1): 53-78, 2013 Research article
Appendix
Table 1 Presence-absence matrix of ectomycorrhizal community, Hoia forest, 1999-2011Fungal species (v8 - v94) v1-
Quer-cus cerris
v2 - Q. robur
v3- Q. pe-tra-ea
v4- Tilia tomen-tosa
v5- Carpi-nus betulus L
v6 - Cory-lus ave-llana
v7- Q. pubes-cens
v8 - Coenococcum geophilum Fr. 1 1 1 1 1 1 1 v9 - Lactarius circellatus (Battara) Fr. 1 1 1 1 1 1 1v10 - Amanita rubescens (Pers. Fr.) Gray 1 1 1 1 1 1 1v11 - A. phalloides (Vaill. ex Fr.) Link 0 0 1 1 1 0 0v12 - Leccinum duriusculum (Schulzer ex Kalchbr.) Singer 0 0 0 0 1 0 0v13 - Russula foetens (Pers.) Pers. 1 1 1 0 1 1 1v14 - R. cyanoxantha (Schaeff.) Fr. 1 1 1 1 1 1 1v15 - Lactarius quietus (Fr.) Fr. 0 0 1 0 1 1 0v16 - Russula fragilis sensu Cooke 0 0 1 0 0 0 0v17- R. subfoetens sensu Rea 0 0 0 0 1 0 0v18 - Lactarius vellereus (Fr.) Fr. 0 1 1 1 1 0 1v19 - R. delica Fr. 0 1 1 0 1 0 0v20 - Boletus chrysenteron Bull. 1 1 1 1 1 0 1v21 - B. appendiculatus Schaeff. 1 1 1 0 0 0 1v22 - B. porosporus Imler ex. Watling 0 1 1 1 0 0 1v23 - R. velenovsky Melzer & Zvara 0 0 0 0 1 0 0v24 - R. mairei Singer 0 0 1 0 1 1 0v25 - R. consobrina (Fr.) Fr. 0 0 1 0 1 0 0v26 - R. rosea Pers. 0 0 0 0 1 0 0v27 - Boletus. aestivalis (Paulet) Fr. 1 1 1 1 1 0 1v28 - B. queleti Schulzer 0 0 1 1 0 0 0v29 - B. luridus Sowerby 1 1 1 0 0 0 1v30 - Gyroporus castaneus (Bull.) Quél. 0 0 1 0 0 0 0v31 - L. piperatus (L.) Pers. 1 1 1 1 1 1 1v32 - L. volemus (Fr.) Fr. 0 0 1 0 0 0 0v33 - Craterellus cornucopioides (L. ex Fr.) Pers. 1 1 1 0 1 1 0v34 - Inocybe fastigiata (Schaeff.) Quél. 1 1 1 1 1 0 0v35 - Scleroderma citrinum Pers. 1 1 1 0 0 0 1v36 - R. cessans Pers. 0 0 1 0 0 0 0v37 - B. subtomentosus sensu Bolton. 0 0 1 0 0 0 0v38 - A. vaginata sensu Stevenson 1 1 1 0 0 0 0v39 - R. virescens (Schaeff.) Fr. 0 1 1 0 1 0 0v40 - Tricholoma saponaceum (Fr.) P. Kumm. 0 1 1 0 0 0 1v41 - Leccinum carpini (R.Schulz) M.M. Moser 0 0 0 0 1 0 0v42 - R. clarofl ava Grove 0 1 1 0 0 0 0v43 - R. fellea (Fr.) Fr. 0 1 0 0 0 0 0v44 - Hygrophorus eburneus (Bull.) Fr. 0 0 1 0 0 0 0v45 - R. vesca Fr. 0 1 1 0 1 0 0v46 - R. carpini R. Girard & Heinem. 0 0 0 0 1 0 0v47 - A. citrina sensu Stevenson 0 0 0 0 1 0 0

77
Fodor Linking biodiversity to mutualistic networks ...
Table 1 (continuation)Fungal species (v8 - v94) v1-
Quer-cus cerris
v2 - Q. robur
v3- Q. pe-tra-ea
v4- Tilia tomen-tosa
v5- Carpi-nus betulus L
v6 - Cory-lus ave-llana
v7 - Q. pubes-cens
v48 - Laccaria laccata (Scop.) Cooke 1 1 1 1 1 1 1v49 - Laccaria amethystina (Huds.) Cooke 0 1 1 1 1 0 0v50 - Hebeloma crustuliniforme (Bull.) Quél. 1 1 1 1 1 0 1v51 - R. pectinatoides Peck 0 0 1 0 1 0 0v52 - B. satanas Lenz 1 1 0 0 0 0 1v53 - Cortinarius sp. 0 0 1 0 0 0 0v54 - Amanta lividopallescens (Secr. ex Boud.) Kühner & Romagn 0 0 1 0 0 0 0
v55 - Amanita battarrae (Boud.) Bon. 0 0 0 0 1 0 0v56 - Russula lepida Fr. 0 0 1 0 0 0 0v57 - Russula aeruginea Fr. 0 1 1 0 0 0 0v58 - Paxillus involutus (Batsch) Fr. 0 1 1 0 1 1 0v59 - Inocybe rimosa Britzelm 1 0 1 0 0 0 0v60 - Tricholoma virgatum (Fr.) P. Kumm. 0 1 1 1 1 1 1v61 - Leccinum quercinum Pilat 0 0 1 0 0 0 0v62 - R. nigricans Fr. 1 1 1 1 1 0 0v63 - L. chrysorrhaeus Fr. 0 0 1 0 0 0 0v64 - L. camphoratus (Bull.) Fr. 0 0 1 0 0 0 0v65 - Amanita echinocephala (Vittad.) Quél. 0 0 1 0 0 0 0v66 - R. romellii Maire 1 0 1 0 0 0 0v67 - R. ionochlora Romagn. 1 0 1 0 0 0 0v68 - R. atropurpurea (Krombh.) Britzelm. 0 1 0 0 1 1 0v69 - Amanita virosa (Fr.) Bertill. 0 1 1 1 1 0 0v70 - A. ceciliae (Berk. & Broome) Bas. 0 0 1 0 0 0 0v71 - A. pantherina (DC.) Krombh. 1 1 1 1 1 1 1v72 - L. fulvissimus Romagn. 0 0 1 0 0 0 0v73 - R. brunneoviolacea Crawshay 0 0 1 0 0 0 0v74 - R. alutacea (Fr.) Fr. 0 0 0 0 1 0 0v75 - R. lepida Fr. 0 0 0 0 1 0 0v76 - Scleroderma areolatum Ehrenb. 0 1 1 0 0 0 0v77 - R. pelargonia Niolle 0 0 0 0 1 0 0v78 - R. pseudointegra Arnould & Goris 0 0 0 0 1 0 0v79 - Mutinus caninus (Huds.) Fr. 0 0 0 0 1 0 0v80 - Phallus impudicus L. 0 0 0 0 1 0 0v81 - Inocybe geophylla (Fr.) P. Kumm. 0 0 0 1 1 0 0v82 - B. impolitus Fr. 0 0 1 0 0 0 0v83 - R. heterophylla (Fr.) Fr. 0 0 1 0 0 0 0v84 - Hydnum repandum L. 1 1 1 0 1 0 0v85 - Ramaria stricta (Pers.) Quél. 1 1 1 0 1 1 0v86 - L. blennius (Fr.) Fr. 0 0 1 0 0 0 0v87 - R. aurea Pers. 0 0 1 0 0 1 0v88 - B. pulverulentus Opat. 0 0 1 0 0 0 0v89 - Russula decolorans (Fr.) Fr. 0 0 1 0 0 0 0

78
Ann. For. Res. 56(1): 53-78, 2013 Research article
Table 1 (continuation)Fungal species (v8 - v94) v1-
Quer-cus cerris
v2 - Q. robur
v3- Q. pe-tra-ea
v4- Tilia tomen-tosa
v5- Carpi-nus betulus L
v6 - Cory-lus ave-llana
v7- Q. pubes-cens
v90 - L. scrobiculatus (Scop.) Fr. 0 0 1 0 0 0 0v91 - Suillus granulatus (L.) Roussel 0 1 1 1 0 0 0v92 - R. laurocerasi Melzer 1 1 1 0 0 0 0v93 - B. edulis Bull. 1 1 0 1 0 0 0v94 - Entoloma lividum (Bull.) Quél. 1 1 1 1 1 1 0


![Mutualistic Growth of the SulfateReducer Desulfovibrio ...digital.csic.es/bitstream/10261/79980/1/Mutualistic growth of the... · Meyerhof–Parnas pathway [9, 10], the degradation](https://static.fdocuments.us/doc/165x107/5e68148dbef0cd325b1073c5/mutualistic-growth-of-the-sulfatereducer-desulfovibrio-growth-of-the-meyerhofaparnas.jpg)