
Linkages and Economic Development -...
21
L INKAGES AND E CONOMIC DEVELOPMENT Dominick Bartelme & Yuriy Gorodnichenko University of Michigan & UC Berkeley World Bank Conference on The Rise of the South May 16, 2016
Transcript of Linkages and Economic Development -...

LINKAGES AND ECONOMIC DEVELOPMENT
Dominick Bartelme & Yuriy Gorodnichenko
University of Michigan & UC Berkeley
World Bank Conference on The Rise of the SouthMay 16, 2016

RESEARCH QUESTION
How are intermediate goods linkages related to economic development?
I Demand externalities and poverty traps for early development theorists(e.g. Hirschman 1958)
I More recently, underlying domestic distortions can reduce productivitythrough reduced intermediate use (Jones 2011)
I Little empirical work on domestic input-output tables and development

WHAT WE DO
I New and extensive panel dataset of input-output tablesI Document new facts regarding the empirical relationship between
aggregate productivity and intermediate goods linkagesI Industry levelI Aggregate level
I Theoretical framework for understanding how domestic distortionsaffect input-output tables and productivity
I Computes the implied productivity losses from domestic distortions in asimple Cobb-Douglas neoclassical growth model

DATA
I Cross-section is GTAP7 in 2004: 91 countries, 56 sectors, standardizedformat
I Additional IO data from a variety of sources going back to the 1950sI UN agencies and commissions, OECD, country websitesI Over 100 countries total, over 70 countries with 2 or more observationsI We aggregate these to 4x4 for consistency: Agriculture, Manufacturing,
Services and Other (Mining, Construction, Utilities)I Output per worker from PWT 8.1 (updated from the paper)

TABLE: Panel: Observations by Region and Time Period
Africa Asia Latin Eastern Europe Western EuropeAmerica & Transition & Offshoots
1950 0 0 2 0 01955 0 0 2 0 01960 1 2 5 4 111965 1 1 2 6 151970 6 6 8 2 181975 6 7 4 5 141980 1 4 1 0 71985 1 4 1 0 91990 1 3 0 0 91995 2 13 6 13 242000 2 14 6 13 242005 16 19 15 21 242010 2 13 6 13 24

MEASUREMENT
How do we measure the “strength” of “linkages?”
Direct linkages based on the entries of country c’s observed IO matrix Bc
I bijc is the value of intermediates that industry j buys from industry i,divided by industry j’s gross output
I Backward linkages in industry j country c by∑
i bijc
I Forward linkages in industry i by∑
j bijc
I “Mean Direct Linkage”
MDLc =
∑i
∑j bijc
J
where J is the number of industries

MEASUREMENT
What about indirect linkages or “network effects?”
I Based on the Leontief inverse of Bc:
Lc = (I−Bc)−1
which satisfies (in a closed economy)
Gross Output = L · Final Demand
I Interpretation: bij is the amount of gross output in industry i needed toproduce one unit of final demand in industry j
I This matrix takes all second round, third round, etc. effects into account

INCLUDING INDIRECT LINKAGES
L = (I−B)−1
I Backward linkages: total gross output required to produce a unit of finaldemand in industry j, ∑
i
`ij
I Forward linkages: total gross output in industry i required to produce aunit of final demand in every industry j,∑
j
`ij
I Aggregate linkages: the “Average Output Multiplier” (AOM)
AOMc =
∑i
∑j `ij
J

DIRECT LINKAGES AND OUTPUT/WORKER
PDR
WHT
GROV_FOSD
C_BPFB
OCRCTLOAP
RMKWOLFRSFSH
CMTOMT
VOL
MIL
PCRSGROFD
B_T
TEXWAP
LEALUMPPP
P_CCRPNMMI_SNFMFMP
MVHOTNELE
OMEOMF
COA
OILGASOMN
ELY
GDT
WTR
CNSTRDOTP
WTPATP
CMN
OFIISR
OBSROS
OSG
PDR
WHTGROV_F
OSDC_B
PFBOCRCTLOAP
RMK
WOLFRSFSH
CMTOMTVOL
MIL
PCRSGR
OFD
B_TTEX
WAPLEA
LUM
PPP
P_C
CRP
NMMI_SNFM
FMP
MVHOTNELEOME
OMFCOAOIL
GASOMN
ELYGDT
WTR
CNSTRDOTP
WTPATP
CMN
OFI
ISR
OBS
ROSOSG
-.50
.5-.5
0.5
0 20 40 60
A: Direct Backward Linkages
B: Direct Forward Linkages
corr, sector == Agriculture corr, sector == Manufacturingcorr, sector == Other corr, sector == Services
Industry Number

TABLE: IO coefficient correlations with output/worker, panel
Panel B: Correlations with log output/worker, (N = 402)Using Sector
Agriculture Manufacturing Services Other
Ag. 0.03 -0.52* -0.56* -0.25Man. 0.37* 0.05 -0.39* -0.17*Serv. 0.40* 0.18* 0.57* 0.19*Other 0.26* -0.06* -0.04 0.24*
Panel C: Correlations with fixed effects (N = 374, Countries= 71)
Ag. -0.09* -0.14* -0.14* 0.04*Man. 0.03 0.06* -0.07* -0.12*Serv. -0.03* 0.01 0.10* 0.00Other 0.05* -0.01 0.05* 0.05*

TABLE: IO coefficient correlations with output/worker, panel
Panel B: Rich Countries, (N = 174, Countries = 27)Using Sector
Agriculture Manufacturing Services Other
Ag. -0.10* -0.27* -0.08* 0.02Man. 0.18* 0.20* 0.06 0.01Serv. 0.04 0.06 0.09 0.01Other 0.08 0.12* 0.00 0.00
Panel C: Poor Countries (N = 200, Countries= 44)
Ag. -0.14* -0.12* -0.18* 0.09*Man. -0.02 0.07 -0.12* -0.17*Serv. -0.07* -0.10* 0.16* 0.10*Other -0.07* -0.04 0.09 00.02*
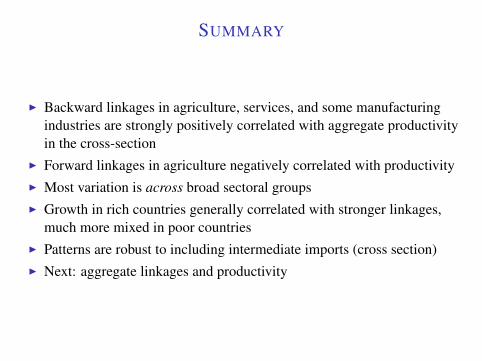
SUMMARY
I Backward linkages in agriculture, services, and some manufacturingindustries are strongly positively correlated with aggregate productivityin the cross-section
I Forward linkages in agriculture negatively correlated with productivityI Most variation is across broad sectoral groupsI Growth in rich countries generally correlated with stronger linkages,
much more mixed in poor countriesI Patterns are robust to including intermediate imports (cross section)I Next: aggregate linkages and productivity
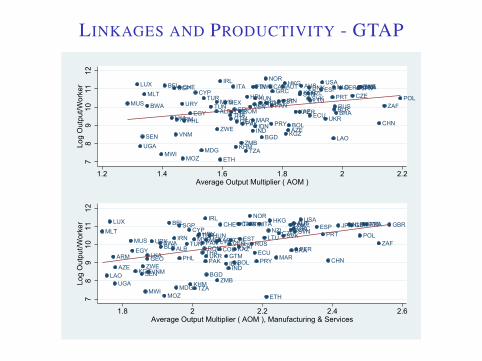
LINKAGES AND PRODUCTIVITY - GTAP
ALBARG
ARM
AUSAUT
AZE
BEL
BGD
BLR
BOL
BRABWA
CANCHE
CHL
CHN
COLCRI
CYP CZEDNK
ECUEGY
ESP
EST
ETH
FIN FRAGBR
GEO
GERGRC
GTM
HKG
HRVHUN
IDNIND
IRL
IRN
ITA JPN
KAZ
KGZ
KHM
KOR
LAO
LKA
LTU
LUX
LVA
MAR
MDG
MEXMLT
MOZ
MUS
MWI
MYS
NLDNOR
NZL
PAK
PANPER
PHL
POLPRT
PRY
ROMRUS
SEN
SGP
SVKSVN
SWE
THATUN
TUR
TWN
TZAUGA
UKR
URY
USA
VEN
VNM
ZAF
ZMB
ZWE
78
910
1112
Log
Out
put/W
orke
r
1.2 1.4 1.6 1.8 2 2.2Average Output Multiplier ( AOM )
ALBARG
ARM
AUSAUT
AZE
BEL
BGD
BLR
BOL
BRABWA
CANCHE
CHL
CHN
COL CRI
CYP CZEDNK
ECUEGY
ESP
EST
ETH
FIN FRA GBR
GEO
GERGRC
GTM
HKG
HRVHUN
IDNIND
IRL
IRN
ITA JPN
KAZ
KGZ
KHM
KOR
LAO
LKA
LTU
LUX
LVA
MAR
MDG
MEXMLT
MOZ
MUS
MWI
MYS
NLDNOR
NZL
PAK
PANPER
PHL
POLPRT
PRY
ROMRUS
SEN
SGP
SVKSVN
SWE
THATUN
TUR
TWN
TZAUGA
UKR
URY
USA
VEN
VNM
ZAF
ZMB
ZWE
78
910
1112
Log
Out
put/W
orke
r
1.8 2 2.2 2.4 2.6Average Output Multiplier ( AOM ), Manufacturing & Services

TABLE: Productivity and Linkages, PanelFixed Effects
Panel A: Rich CountriesAll Sectors Man. & Services
AOM MDL AOM MDL
FE 0.13* 0.16* 0.67* 0.20*(0.02) (0.03) (0.12) (0.04)
Panel B: Poor Countries
FE -0.09* -0.11* 0.06 0.04(0.04) (0.04) (0.10) (0.05)

SUMMARY
I Very strong correlation between AOM and productivity in thecross-section
I Small or negative correlation of linkages with growth in poor countries,positive for rich countries (especially for manufacturing and servicelinkages)
I Strong positive time trends in bothI Robust to controls (openness, institutions, technology adoption,
etc)...need to look at imported inputs more carefully

WHAT DOES IT MEAN?
I Countries might endogenously adopt different production techniques asthey develop, become more or less intensive in intermediates as anoutcome of “natural” economic development
I Poor countries have distorted intermediate input markets and can gaintoday by correcting these distortions, holding technology fixed
I Explore second option using a calibrated growth model

A SIMPLE THEORETICAL FRAMEWORK
I With Cobb-Douglas production functions and competitive input markets,the observed ijth entry of the input-output matrix B is
bij =σijtij
where σij represents the Cobb-Douglas exponent on inputs fromindustry i (“technology”) and tij represents domestic distortions
I tij reflects anything not recorded in the reported transaction price thatnonetheless discourages transactions outside the plant or firm
I Formal taxes on intermediate goods and/or sales (usually small)I Implicit taxes: corruption, costly contract enforcement, costly or
unreliable transportation

PRODUCTIVITY EFFECTS OF DISTORTIONS
bij =σijtij
I Theory shows how to aggregate sectoral distortions into aggregateproductivity losses
I Each distortion generates a multiplier effect: each intermediate is taxedmultiple times because of input-output loops
I Distortions are more costly in more connected industriesI Subsidies are also distortions that can lead to overuse of intermediate
inputs

SEPARATING TECHNOLOGY FROM DISTORTIONS
bijc =σijctijc
I We use rich country variation in bij to “predict” the technology of poorcountries that are closest to them in terms of population, openness,sectoral specialization, etc.
I For example, more open economies tend to use less domestic and moreimported inputs→ assign that to “technology”
I Assign prediction error to domestic distortions tijcI Compute implied productivity losses using the model (Cobb-Douglas
neoclassical growth model)

FIGURE: TFP Gains from Removing Distortions - Adjusted Technology Panel
ALB
ARGARGARG
ARGARG
ARM
AZEBGDBGDBGD
BLR
BOL
BOL
BRA
BRA
BRABRA BWABWA
CHLCHLCHL
CHLCHL
CHNCHN
CIV
COLCOL
COLCOLCRI
CYPCZECZE
ECUECUECU
EGY
EGYESPESP
ESP ESP
ESTEST
ETH
GEO
GHAGRC
GRC
GRCGRCGRC
GTMGTM
HRV
HUN
HUNHUN
IDNIDNIDNIDN
IDNIDN
INDINDIND
IND
IRNISRISR
ISR ISR
JPNJPN
JPNJPNJPN
JPNJPNJPN
KAZ
KEN KENKENKGZ
KHM
KOR
KORKORKOR
KORKOR
KOR
LAO
LKALKA
LTULVA
LVA
MAR
MARMAR
MDGMDG
MEXMEXMEX
MEX MEX
MLT
MLT
MOZMOZ
MUS
MWI MWI
MYSMYSMYSMYS
MYSMYSNZLNZL
PAK
PAN
PERPERPERPER
PHL
PHLPHLPOL
POLPOL
PRTPRT
PRT
PRTPRT
PRY
ROMRUSRUS
SEN
SVKSVKSVNSVN
THA
THATHA
TUN
TURTUR
TURTUR
TZA
TZATZA UGA
UGA
UKR
URYURYVEN VEN
VNMVNM
ZAFZAF ZAFZAFZAFZAF
ZMB
ZMBZMB
ZWEZWE
78
910
11Lo
g O
utpu
t/Wor
ker
0 .1 .2 .3 .4Total Gains
ALB
ARGARGARG
ARGARG
ARM
AZEBGDBGDBGD
BLR
BOL
BOL
BRA
BRA
BRABRA BWABWA
CHLCHLCHL
CHLCHL
CHNCHN
CIV
COLCOL
COL COLCRI
CYPCZECZE
ECUECUECU
EGY
EGYESP
ESP
ESPESP
ESTEST
ETH
GEO
GHAGRC
GRC
GRCGRCGRC
GTMGTM
HRV
HUN
HUNHUN
IDNIDN
IDNIDNIDNIDN
INDIND
IND
IRNISRISR
ISRISR
JPNJPN
JPNJPNJPN
JPNJPNJPN
KAZ
KEN KEN KENKGZ
KHM
KOR
KORKORKOR
KORKOR
KOR
LAO
LKALKA
LTULVA
LVA
MAR
MARMAR
MDGMDG
MEXMEX MEX
MEXMEX
MLT
MLT
MOZMOZ
MUS
MWIMWI
MYS MYSMYSMYS
MYSMYSNZLNZL
PAK
PAN
PERPERPERPER
PHL
PHLPHL
POL
POLPOL
PRTPRT
PRT
PRTPRT
PRY
ROMRUSRUS
SEN
SVKSVKSVNSVN
THA
THATHA
TUN
TURTUR
TURTUR
TZA
TZATZAUGA
UGA
UKR
URYURYVENVEN
VNMVNM
ZAFZAFZAFZAFZAFZAF
ZMB
ZMBZMB
ZWEZWE
78
910
11Lo
g O
utpu
t/Wor
ker
0 .02 .04 .06 .08 .1Gains from Agriculture
ALB
ARGARGARG
ARGARG
ARM
AZEBGDBGDBGD
BLR
BOL
BOL
BRA
BRA
BRABRA BWACHLCHLCHL
CHLCHL
CHNCHN
CIV
COLCOL
COLCOL CRI
CYPCZE CZE
ECUECUECU
EGY
EGYESP
ESP
ESP ESP
ESTEST
ETH
GEO
GHAGRC
GRC
GRCGRCGRC
GTMGTM
HRV
HUN
HUNHUN
IDNIDN
IDN
IDNIDN
INDINDIND
IND
IRNISRISR
ISR ISR
JPN
JPNJPN
JPNJPNJPN
JPN JPN
KAZ
KEN KENKENKGZ
KHM
KOR
KORKORKOR
KORKOR
KOR
LTULVA
LVA
MAR
MARMAR
MDGMDG
MEXMEXMEX
MEXMEX
MLT
MLT
MOZ
MUS
MWI MWI
MYSMYSMYSMYS
MYSMYSNZLNZL
PAK
PAN
PERPERPER PER
PHLPHL
POL
POLPOL
PRTPRTPRT
PRTPRT
PRY
ROMRUSRUS
SEN
SVKSVKSVNSVN
THA
THATHA
TUN
TURTUR
TURTUR
TZA
UKR
URYURYVENVEN
VNMVNM
ZAFZAF ZAFZAFZAF ZAF
ZMB
ZMBZMB
ZWE
ZWE
78
910
11Lo
g O
utpu
t/Wor
ker
0 .02 .04 .06 .08 .1Gains from Manufacturing
ALB
ARG ARGARG
ARGARG
ARM
AZEBGDBGDBGD
BLR
BOL
BOL
BRA
BRA
BRA BRABWABWA
CHL CHLCHL
CHL CHL
CHNCHN
CIV
COLCOLCOL COLCRI
CYPCZECZE
ECUECUECU
EGY
EGYESP
ESP
ESPESP
ESTEST
ETH
GEO
GHAGRC
GRC
GRCGRCGRC
GTMGTM
HRV
HUN
HUNHUN
IDNIDN
IDNIDNIDNIDN
IND INDIND
IND
IRNISRISR
ISR ISR
JPNJPN
JPNJPNJPN
JPNJPNJPN
KAZ
KENKEN KENKGZ
KHM
KOR
KORKORKOR
KORKOR
KOR
LAO
LKALKA
LTULVA
LVA
MAR
MARMAR
MDGMDG
MEXMEXMEX
MEX MEX
MLT
MLT
MOZMOZ
MUS
MWI MWI
MYSMYSMYSMYS
MYSMYSNZLNZL
PAK
PAN
PERPERPER PER
PHL
PHLPHL
POL
POLPOL
PRTPRT
PRT
PRTPRT
PRY
ROMRUSRUS
SEN
SVKSVKSVNSVN
THA
THA THA
TUN
TURTUR
TURTUR
TZA
TZATZA UGA
UGA
UKR
URYURYVENVEN
VNM
ZAFZAFZAFZAFZAF ZAF
ZMB
ZMBZMB
ZWEZWE
78
910
11Lo
g O
utpu
t/Wor
ker
0 .02 .04 .06 .08Gains from Services
FIGURE: *
Notes

CONCLUSION
I Intermediate linkages and productivity are robustly positively correlatedin the cross-section, and in the time series for rich countries
I Historically, growth in poor countries has not necessarily beenassociated with increased domestic linkages
I Significant but modest gains from eliminating distortions in poorcountries, with a balance between agricultural, manufacturing andservices
I Domestic supply chains still matter - even today


