LINK Technical Guide
33
LINK Technical Guide MEETING TARGETS AND MAINTAINING EPIDEMIC CONTROL (EPIC) PROJECT COOPERATIVE AGREEMENT NO. 7200AA19CA00002 AN ELECTRONIC CLIENT FEEDBACK SYSTEM FOR HIV PROGRAMS JANUARY 2021
Transcript of LINK Technical Guide

LINK Technical Guide
MEETING TARGETS AND MAINTAINING EPIDEMIC CONTROL (EPIC) PROJECT
COOPERATIVE AGREEMENT NO.
7200AA19CA00002
AN ELECTRONIC CLIENT FEEDBACK
SYSTEM FOR HIV PROGRAMS JANUARY 2021

EpiC. LINK technical guide: An electronic client feedback system for HIV programs. Durham
(NC): FHI 360; 2021.
This technical resource was made possible by the generous support of the American people
through the United States Agency for International Development (USAID) and the U.S.
President’s Emergency Plan for AIDS Relief (PEPFAR). The contents are the responsibility of
the EpiC project and do not necessarily reflect the views of USAID, PEPFAR, or the United
States Government. EpiC is a global cooperative agreement (7200AA19CA00002) led by FHI
360 with core partners Right to Care, Palladium International, Population Services International
(PSI), and Gobee Group.
This guide was written by Benjamin Eveslage. Input and comments of EpiC staff and
consultants are gratefully acknowledged, with particular thanks to Chris Akolo, Tiffany Lillie,
Meghan DiCarlo, Purvi Shah, and Shanthi Noriega.
3 L I N K – A N E L E C T R O N I C C L I E N T F E E D B A C K S Y S T E M F O R H I V P R O G R A M S
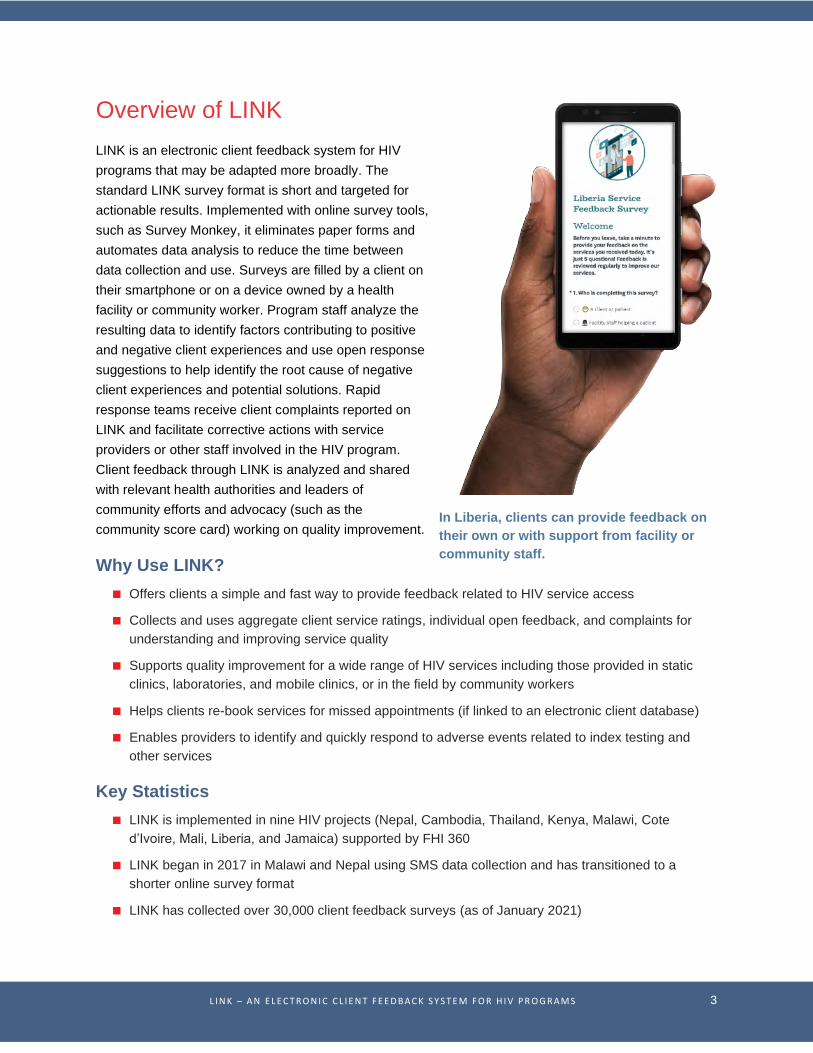
Overview of LINK
LINK is an electronic client feedback system for HIV
programs that may be adapted more broadly. The
standard LINK survey format is short and targeted for
actionable results. Implemented with online survey tools,
such as Survey Monkey, it eliminates paper forms and
automates data analysis to reduce the time between
data collection and use. Surveys are filled by a client on
their smartphone or on a device owned by a health
facility or community worker. Program staff analyze the
resulting data to identify factors contributing to positive
and negative client experiences and use open response
suggestions to help identify the root cause of negative
client experiences and potential solutions. Rapid
response teams receive client complaints reported on
LINK and facilitate corrective actions with service
providers or other staff involved in the HIV program.
Client feedback through LINK is analyzed and shared
with relevant health authorities and leaders of
community efforts and advocacy (such as the
community score card) working on quality improvement.
Why Use LINK?
Offers clients a simple and fast way to provide feedback related to HIV service access
Collects and uses aggregate client service ratings, individual open feedback, and complaints for
understanding and improving service quality
Supports quality improvement for a wide range of HIV services including those provided in static
clinics, laboratories, and mobile clinics, or in the field by community workers
Helps clients re-book services for missed appointments (if linked to an electronic client database)
Enables providers to identify and quickly respond to adverse events related to index testing and
other services
Key Statistics
LINK is implemented in nine HIV projects (Nepal, Cambodia, Thailand, Kenya, Malawi, Cote
d’Ivoire, Mali, Liberia, and Jamaica) supported by FHI 360
LINK began in 2017 in Malawi and Nepal using SMS data collection and has transitioned to a
shorter online survey format
LINK has collected over 30,000 client feedback surveys (as of January 2021)
In Liberia, clients can provide feedback on
their own or with support from facility or
community staff.

4 L I N K – A N E L E C T R O N I C C L I E N T F E E D B A C K S Y S T E M F O R H I V P R O G R A M S
The Simple Survey Tool
The LINK client feedback tool is presented in full in Annex 1, or you can try it on your browser here. The
tool is optimized for high response and completion rate, leverages multiple data collection methods, and
produces actionable client feedback. The survey is by default anonymous and responses cannot be
attributed to individual clients, however, clients who submit a client complaint may provide their email or
phone number to be contacted about their complaint. The standard format includes four components:
Client satisfaction scores: Three multiple-choice questions for clients to provide feedback on the
service they received. The first measures the client’s likelihood to promote the service to others
using the Net Promoter Score (NPS) framework, the second allows the client to identify the leading
factor impacting their NPS score; and the third measures the client’s likelihood to return for this
same service in the future.
Open feedback: An open-ended question for clients who provided a low or high score on the NPS,
which asks them to explain the one thing they liked or think could be improved with the service.
Client complaint form: Five multiple-choice questions for a client to report a more detailed account
of a negative experience related to their service access. The form collects important details useful in
identifying how quality improvement or correction action should be directed.
Missed appointment rebooking: This optional screen is shown to clients who booked but missed
their appointment. A multiple-choice question gives clients a way to indicate the main reason for
their missed appointment and then they are directed to re-book on an external page (such as if the
program uses an Online Reservation App or QuickRes).
Figure 1. LINK client feedback survey: (1) satisfaction rating, (2) open feedback, (3) complaint form

5 L I N K – A N E L E C T R O N I C C L I E N T F E E D B A C K S Y S T E M F O R H I V P R O G R A M S
Data Collection
LINK client feedback data can be collected several ways (described below). HIV programs may combine
multiple data collection methods to suit their implementation needs and client preferences.
Sent to client phone Tablet-based at
service point
During community
outreach
Call-back phone
survey
Clients are sent an
email or SMS with link to
the online client feedback
survey to open and fill on
their own device after their
service access.
Clients offered to
provide their feedback on
a facility-based tablet or
other device at the end of
their service access.
Community outreach
workers offer clients the
option to provide feedback
based on a recent service
access during their routine
outreach activities.
A client’s case
manager calls them after
service access to offer the
feedback survey and may
help them take the survey
over the phone.
Pros: No provider bias;
does not take any staff
time; can be done
virtually; can be
automated (see below)
Pros: High response rate;
facilitates more equitable
access to feedback
Pros: No provider bias;
facilitates more equitable
access to feedback
Pros: Can be done
virtually; no provider bias;
facilitates more equitable
access to feedback
Cons: Has lower
response rate; only works
for clients with a
smartphone
Cons: Takes provider
time; potential provider
bias; potential cost to
procure tablets (may use
existing facility tablets if
available)
Cons: Inaccuracy of
feedback due to time lag
after service access;
requires physical contact
with clients
Cons: Takes staff time;
clients must have phone
number
CONNECT
Automating collection of client feedback
An electronic client database such as the online reservation and case
management app (ORA) or QuickRes can be programmed to automatically send
clients a link to provide feedback by SMS and can track when someone on the
program team has offered the feedback survey to clients on ORA.

6 L I N K – A N E L E C T R O N I C C L I E N T F E E D B A C K S Y S T E M F O R H I V P R O G R A M S
Data Use
LINK produces two kinds of data useful for quality improvement: (1) routine client satisfaction and (2)
client complaints. Here are recommendations for HIV programs on how to secure, analyze, and respond
to the data to support quality improvement.
Securing Client Feedback Data
The LINK survey tool is anonymous and therefore results cannot be attributed back to an individual client.
If clients submit a complaint, however, they have the choice to leave their contact information so HIV
program staff can contact them to learn more about their negative experience to better direct quality
improvement efforts and provide the client with follow-up services if needed. HIV programs may decide to
make the survey entirely anonymous and remove this optional question from the survey. Survey Monkey
has several data security features for data that is collected in the system.
Data security on Survey Monkey:
All client feedback data is stored on Survey Monkey’s server and accessed through a secure
password-protected login with two-factor authentication.
Clients or data collectors who access the online survey on Survey Monkey do so through a Secured
Sockets Layer (SSL), which means the data is encrypted from their device to the Survey Monkey
server.
Static client survey data stored on the Survey Monkey server is encrypted.
HIV programs may use Survey Monkey’s integrations and plug-ins to share their client survey data
with other applications (such as Power BI). In these cases, the security of those other applications
should also be reviewed and ensured.
More about Survey Monkey data security is available on their website.
Important data security measures to be taken by HIV program staff:
Limit access to Survey Monkey login to one or two key HIV program staff and allow others to view
results on the shared data analysis pages (no login needed).
Ensure shared data analysis pages only include the data required for the intended audience. For
instance, hide individual responses and hide client complaints from the shared data analysis pages
for facilities.
Inform clients in the survey introduction who will have access to view their responses. For instance,
inform clients that their satisfaction scores and open feedback may be shared directly back to facility
management, but client complaints will only be viewed by central HIV program staff.
When setting up facility or community-based tablets for collecting client feedback surveys, turn off
the browser’s “autofill” to prevent the browser from saving earlier survey responses and suggesting
them for subsequent surveys. (See this guide for disabling autofill in Google Chrome.)

7 L I N K – A N E L E C T R O N I C C L I E N T F E E D B A C K S Y S T E M F O R H I V P R O G R A M S
Data Analysis and Outputs
HIV programs can use Survey Monkey to customize and present LINK results for various stakeholders.
These results are presented on a webpage, which can be accessed by a link that can be shared with
others. Similar kinds of analyses, dashboards, and presentation formats may be created with other data
collection tools.
Standard types of LINK data analyses:
Aggregate (all facilities) analysis page: Shows all client satisfaction feedback across all facilities
as charts and tables that summarize the responses to each survey question. This does not include
client complaints or other open feedback.
Aggregate (facility comparison) analysis page: Shows all client satisfaction feedback across all
facilities as charts and tables that compare results of each survey question by facility. This does not
include client complaints or other open feedback.
Facility-specific analysis page: Shows all client satisfaction feedback for a single facility as charts
and tables that summarize the responses to each survey question. This analysis page can later be
edited to include a filter for only data collected during a certain period (e.g., monthly or quarterly).
This typically includes open feedback but does not include client complaints.
Facility-specific dashboard: Shows all client satisfaction feedback for a single facility as charts
and tables that summarize the responses to key survey questions, some are segmented by high-
scoring and low-scoring feedback. This typically includes open feedback but does not include client
complaints.
Individual complaints log: Shows individual client complaints and name of corresponding clinic or
service but does not include the other client feedback responses. This log should be kept
confidential and only accessed by the client complaint coordinator because it may contain client
contact information.
PRO TIP
Prioritizing analysis of client feedback data
When LINK is used to collect client feedback across many facilities, it may be
time-consuming to analyze data and support quality improvement for each
individual facility. Programs can prioritize their efforts by using these methods:
Only analyzing client feedback at facilities with more than 20 surveys in the
month or quarter
Only analyzing client feedback at low performing facilities, such as facilities
with the lowest net promoter score or highest number of complaints.

8 L I N K – A N E L E C T R O N I C C L I E N T F E E D B A C K S Y S T E M F O R H I V P R O G R A M S
Process for Data Use
HIV programs should use LINK data regularly to support their ongoing quality improvement efforts and to
reinforce community-led quality improvement activities (such as the community score card).
Suggested process for data analysis and use:
Weekly: Review and respond to any new client complaints and track responses with Annex 4:
Client Complaint Tracker. Adverse events or violence experienced by clients should be immediately
communicated to staff who can respond to the client with first-line response and referral for post-
violence services.
Monthly: Review LINK surveys collected and
create an analysis page that compares results
across all facilities using Annex 2: All Facility
Client Feedback Report (Monthly or
Quarterly). Identify urgent issues and
communicate these with facility quality
improvement teams for immediate action.
Facilities with fewer than 20 surveys per
month should be supported to offer their
survey to more clients.
Quarterly: Review volume of LINK client
satisfaction data collected and analyze results
for each facility with more than 20 surveys in
the quarter using Annex 3: Facility-Specific
Client Feedback Report (Quarterly).
Annually or biannually: Share LINK data
with community stakeholders. For instance,
use client feedback and complaint data
collected on LINK to prioritize discussion
topics during community-facility interface
meetings and to guide and reinforce facility
action plans developed through the
Community Score Card (CSC) process.
Regular site visits: Review client feedback
presented in Annex 2: All Facility Client
Feedback Report (Monthly or Quarterly),
Annex 3: Facility-Specific Client Feedback
Report (Quarterly), and complaints for that
facility stored in Annex 4: Client Complaint
Tracker. Develop a facility quality improvement
plan using Annex 5: Action Planning Form and
review progress and outstanding actions
during subsequent facility visits.
A nurse at Clara Town Health Centre in Liberia
views aggregate client feedback collected
using LINK. (Photo credit: Ben Eveslage)

9 L I N K – A N E L E C T R O N I C C L I E N T F E E D B A C K S Y S T E M F O R H I V P R O G R A M S
The standard process for using LINK client feedback data is shown below in Figure 2. It shows live or
weekly review of client complaints (red), monthly or quarterly facility-level data analysis and use for
routine client feedback (light blue), and biannual or annual data sharing with community stakeholders for
a deep-dive to explore service quality issues and advocate for service improvements (dark blue).
Figure 2. LINK data collection and use process
CONNECT
Sharing results with community and facility stakeholders
HIV programs can produce facility-specific analysis pages compiling de-identified
aggregate client feedback for each facility. These analysis pages can be shared
with stakeholders using these methods:
Bring to community-facility interface meetings printed copies of the analysis
pages or devices (such as tablets) for viewing pages online.
Add shortcut on the home screen of facility-based tablets to open their
facility-specific analysis page in an internet browser. This allows facility staff
to access live aggregate client feedback results whenever they want.

10 L I N K – A N E L E C T R O N I C C L I E N T F E E D B A C K S Y S T E M F O R H I V P R O G R A M S
Responding to Client Complaints
HIV program staff can adapt and follow this standard process for reviewing and responding to client
complaints submitted on LINK:
View the individual complaints log to identify new complaints weekly or more frequently.
Enter each complaint on a client complaint tracker (see Annex 4: Client Complaint Tracker) that can
be viewed by other team members (using a document-sharing system such as Microsoft OneDrive).
Determine if the complaints are valid (anything that can be improved or corrected by the HIV
program or at the facility level is a valid complaint).
For all valid complaints, follow this process:
o If client provides contact information on their complaint, contact the client and inform
them you received their complaint and ask questions about their negative experience to
help complete the story about what happened.
o If a complaint mentions violence or risk of violence (emotional, physical, sexual, or
economic), ensure the staff member contacting the client has been trained to provide
first-line support and have referrals ready for post-violence services.
o Report the complaint to the appropriate facility response teams or directly to someone in
facility management who can respond (be sure to exclude any information that could be
used to identify the client information).
Return to the client complaint tracker and update the status of each complaint, including additional
details of the experience provided by the client, the support given to the client, and the specific
responses taken by the facility. Update the status as “closed” if no further action is required or leave
as “open” until a later date when all actions are completed. Leave client identifying information out
of the client complaint tracker to maintain the client’s anonymity when documenting their case and
follow-up. See more safe data storage protocols for reports of violence here.
Contact clients who provided their contact information on their complaint and inform them of how
their complaint was addressed. (This step may not be necessary for complaints not requiring action
at the facility level, such as reports of violence not related to facility service access).
PRO TIP
Ways to ensure rapid review and response to client complaints:
Set weekly reminder to check for new client complaints.
Set automated email alert when new client complaints are submitted (use
Survey Monkey or other online survey platform).
Create a group chat on Teams or WhatsApp with the client complaint
coordinator(s) and other members of the facility quality improvement team.
The client complaint coordinator reports on the number of new complaints
received each week and responses provided.

11 L I N K – A N E L E C T R O N I C C L I E N T F E E D B A C K S Y S T E M F O R H I V P R O G R A M S
Setup
Requirements
Budget: For devices and mobile data for data collectors and facility-based data collection, a Survey
Monkey subscription (or other online survey software), and technical assistance for LINK start-up
support (10 days) and ongoing support (5 days per year). Additional assistance may be required to
set up and use LINK in more than 20 facilities or when engaging the Ministry of Health.
Staff capacity: Training to use Survey Monkey or other survey/data analysis tool.
Roles/responsibilities: Program and clinic staff integrate LINK data into their existing program
performance review meetings and reporting duties. Additional dedicated effort for LINK will be
required by a data manager and client complaint coordinator (may be the same person) while others
integrate LINK implementation into their daily work (see “key personnel involved” below).
Mandate: Ensure the owner of LINK (such as the HIV program or civil society organization has the
authority and mandate to support quality improvement at clinics/services being assessed on LINK.
Key personnel involved
Data manager: Accesses the central database of client feedback and creates analyses and reports
used by other team members (see samples in Annex 2: All Facility Client Feedback Report (Monthly
or Quarterly) and Annex 3: Facility-Specific Client Feedback Report (Quarterly).
Complaint coordinator: Views and logs client complaints reported on LINK weekly or more
frequently, facilitates responses, and communicates resolutions back to clients. This person should
be trained in first-line response for violence and may also be the data manager.
Facility quality improvement team: HIV program staff who are notified of new client complaints,
coordinate responses, and meet with various stakeholders to review client feedback and develop
joint action plans and monitor progress.
Data collectors: Individuals based at health facilities or in the community who manage a device
and offer to clients the option of feedback and may help them to read and enter responses.
Health facility management: Management staff of health facilities where client feedback is
collected using LINK who are responsible for managing the facility’s service quality. Typically,
management staff are not also the service providers.
Technical assistance (TA) provider: Specialist in electronic data collection systems and client
feedback who supports the HIV program to set up and use LINK.
CONNECT
Supporting broader quality improvement with LINK data
HIV programs can share their LINK data with other existing mechanisms or
entities that monitor service quality, such as representatives of community
networks or relevant national health authorities who can advocate for service
improvements.

12 L I N K – A N E L E C T R O N I C C L I E N T F E E D B A C K S Y S T E M F O R H I V P R O G R A M S
Rollout Process
HIV program staff managing the design and implementation of LINK should consider the general
implementation steps below. It may take three months for all preparation and before starting routine data
collection, which is followed by routine and regular data use and quality improvement (see Figure 3.
Sample timeline for setup and rollout of LINK in an HIV program).
1. Adapt Link to Context
Review existing community monitoring and feedback systems used among HIV program partners
(or related HIV or other health services) and consider expanding or integrating with their efforts.
Develop a plan for rolling out LINK and adapting tools to the program and population context.
Consider prioritizing data collection methods, determining how they can be integrated into the HIV
program, and any adaptations to the survey tool (see notes in Annex 1).
Engage stakeholders including representatives from the target audience (clients of HIV services
such as key populations and people living with HIV); health facility management, and Ministry of
Health staff responsible for overseeing HIV service quality. Present to these stakeholders the LINK
plan and survey tool (Annex 1) and revise as necessary until consensus is reached.
Establish a quality improvement team composed of HIV program staff. Connect this team to other
community/government stakeholders or support these other stakeholders to participate in the HIV
program’s quality improvement team.
2. Procure Technology and Devices
Consider the number and type of devices that should be purchased to support data collection. If
facility-based data collection will be used, additional tablets may need to be purchased. Typically,
one tablet per facility is sufficient unless clients access two different parts of the same facility for
certain services. For instance, if one health facility has separate receptions for HIV testing and ART
services, then two tablets may be required.
Procure devices and any software subscriptions, typically only survey software such as Survey
Monkey but may include other survey software such as Open Data Kit and analysis software such
as Power BI or Excel.
Format devices using the HIV program’s branding and other program-specific requirements. Also
add shortcuts on the tablet home screen to useful resources such as the LINK survey page/app and
aggregate-only results of client feedback.
3. Launch Link Survey
Load adapted LINK survey tool onto Survey Monkey or other electronic survey software.
Pretest survey functionality with members of the target audience, HIV program staff, and any data
collectors. Collect feedback and revise the tool as necessary, while ensuring standardized
measures are not affected.

13 L I N K – A N E L E C T R O N I C C L I E N T F E E D B A C K S Y S T E M F O R H I V P R O G R A M S
4. Train Staff and Users
Train HIV program staff on how to use Survey Monkey or other software to view LINK survey
results, including how data can be analyzed in Survey Monkey or in Excel.
Develop training materials for any clinic or community data collectors. This may include a standard
operating procedure or PowerPoint slides for a half-day training that guides data collectors on how
to administer surveys to clients confidentially (also see notes in Annex 1: Standard LINK Service
Feedback Form).
Host rollout training with facility management and any data collectors, which should cover survey
administration process, device management and security, and process for facilities to review client
feedback and plan quality improvement activities.
Designate one HIV program staff member as the LINK focal point and provide their contact
information to all data collectors and participating health facilities. Or, consider creating a group chat
(on WhatsApp or another messenger app) where all data collectors, relevant facility management,
and HIV program staff can join to address issues or questions, or to view updated guidance for
LINK rollout.
5. Start Routine Data Collection
If data collectors are supporting survey administration, hand over devices to data collectors
(smartphones or tablets), and ensure they have Wi-Fi or mobile data connectivity. Instruct data
collectors when or how to start data collection. Ensure data collectors understand how to submit test
surveys for practice and how to submit real client responses. For instance, set a date after which all
submitted surveys will be considered real. Alternatively, create a unique web link for the survey for
testing purposes and create another link for routine implementation so responses on the testing link
can be easily filtered out during analysis (this function is available on Survey Monkey).
If using an automated method of data collection, then program the existing client management
database so that it can send clients an SMS with a link to the online survey after their clinic
visit/appointment.
HIV program staff are on call to address any issues or questions from data collectors or health
facility management during LINK rollout.
6. Analyze and Use Link Data
Review collected data after the first week of implementation to identify any data collection errors or
possible misunderstandings of the survey tool from clients or data collectors. Address any errors
and share updates or changes to the tool or implementation procedure with any data collectors and
health facility managers (use WhatsApp group or other communication channel).
Monitor the monthly survey response rate for each facility and support data collectors to ensure a
high volume of data is collected, ideally over 20 surveys per facility per month. Increase response
rate by reminding data collectors, offering client feedback opportunity to more clients, or adding a
lucky draw prize for clients who provide feedback on their own device.
Train HIV program staff on how to analyze LINK survey results and create data outputs (such as
dashboards and analysis pages) after some facilities have at least 20 surveys completed.

14 L I N K – A N E L E C T R O N I C C L I E N T F E E D B A C K S Y S T E M F O R H I V P R O G R A M S
Develop each data analysis output and share with intended stakeholders to inform their quality
improvement plans. This should include sharing aggregate facility-specific results and de-identified
client complaints with facilities during the facility’s regular management or performance review
meetings and any community-facility interface meetings.
Designate a client complaint coordinator from among HIV program staff to continuously review and
respond to complaints reported on LINK (find the standard protocol on page 10 for Responding to
Client Complaints).
Figure 3. Sample timeline for setup and rollout of LINK in an HIV program
Contracting FHI 360 for Technical Assistance
HIV programs may engage FHI 360 for technical assistance to adapt and roll out LINK through these
methods:
A USAID mission can buy in to the EpiC project or request FHI 360 to provide technical assistance
through an existing global or bilateral project implemented by FHI 360. Contact EpiC Agreement
Officer Representative (AOR), Judy Chen ([email protected])
Other organizations interested in technical assistance from FHI 360 should contact:

15 L I N K – A N E L E C T R O N I C C L I E N T F E E D B A C K S Y S T E M F O R H I V P R O G R A M S
Annex
Annex 1: Standard LINK Service Feedback Form
1 Welcome Helpful Notes
Welcome! Please take a minute to provide your
feedback confidentially. It is just a few questions!
Feedback is reviewed by [specify person’s title
and/or organization] regularly to improve our
services.
This feedback form is implemented by
[organization/entity] with support from [donors].
*Questions with an asterisk by the question number
require a response.
▪ Purpose: Short intro that avoids the common lengthy participant consent form used in research studies/data collection.
▪ Notes for data collectors: Inform the client that their responses are confidential. Their response can also be anonymous if they submit a complaint without contact information. Explain who views their responses and how they are used to inform quality improvement.
1* Who is completing this form?
⚪ A client or patient
⚪ Service provider on behalf of client
⚪ Community worker on behalf of a client
▪ Purpose: To see if the survey administrator has an impact on client feedback. This question can be removed if there is only one type of data collector or if clients always complete the survey on their own.
▪ Notes for data collectors: Simply select whoever is inputting responses on the survey. If clients are taking the survey themselves, instruct them to select “a client or patient”.
2* For which service do you want to provide
feedback?
⚪ Government health facility
⚪ Private health facility
⚪ Lab services
⚪ Community clinic
⚪ Drop-in center
⚪ Outreach or mobile services (not in a facility)
⚪ ❌ I did not receive services yet
⚪ Other
▪ Purpose: When clients can choose between many service providers to provide feedback this question is helpful to break the full list into a shorter list that can be shown in Q3. This question can present categories such as service provider type or district, which helps determine the type of service provider to then present in a shorter list of relevant facilities in Q3. If there are 20 or fewer facilities, list the names here and remove Q3.
▪ Notes for data collectors: Select only one service for which to provide feedback, such as the main purpose for the client’s visit. The client will then be asked the rest of the survey questions about this specific service. The survey can be repeated to provide feedback on another service.
Skip
logic
Q2 = “❌ I did not receive services yet” > page 5
All others > page 2

16 L I N K – A N E L E C T R O N I C C L I E N T F E E D B A C K S Y S T E M F O R H I V P R O G R A M S
2 Service Satisfaction Helpful Notes
3* 3a- Please select a city clinic to provide
feedback:
[insert list of city clinics]
3b- Please select a private health facility to
provide feedback:
[insert list of ART sites]
3c- Please select a lab service to provide
feedback:
[insert list of ART sites]
3d- Please select a community clinic to
provide feedback:
[insert list of community clinics]
3e- Please select a drop-in center to provide
feedback:
[insert list of drop-in centers]
3f- Please select a mobile services provider
to provide feedback:
[insert list of drop-in centers]
3g- What other service or facility would you like to provide feedback about? Please specify the name.
[Open response]
▪ Purpose: To determine the specific facility name. Only one version of this question is presented depending on Q2 response.
4* For which health service do you want to provide
feedback? You may repeat this survey to provide
feedback on another service.
⚪ HIV testing
⚪ HIV treatment (ART)
⚪ Pre-exposure prophylaxis (PrEP)
⚪ STI services
⚪ TB services
⚪ Outreach education or counseling
⚪ Other (please specify): ________
▪ Purpose: Feedback is provided for only one health service per survey. Survey can be repeated for other health services accessed. Programs may add or remove categories based on health services that are planned to receive client feedback from LINK.

17 L I N K – A N E L E C T R O N I C C L I E N T F E E D B A C K S Y S T E M F O R H I V P R O G R A M S
5* How likely is it that you would recommend [this
service] to a friend or colleague?
⚪ 0 not at all likely
⚪ 1
⚪ 2
⚪ 3
⚪ 4
⚪ 5
⚪ 6
⚪ 7
⚪ 8
⚪ 9
⚪ 10 extremely likely
▪ Purpose: Net Promoter Score (NPS): This question helps compare across facilities, and segment respondents into promoters, passive, and detractors. This question cannot be changed except for the label in grey.
▪ Responses are coded as: 0-6 detractors; 7-8 passive; and 9-10 promoters.
▪ Notes for data collectors: The rating can range from 0-10. Scores 0-6 mean the client would not recommend this facility to others and may want to provide suggestions for quality improvement; scores 7-8 mean the client may or may not recommend; and scores 9-10 mean the client would recommend the facility to others and may want to explain what they liked about the service.
6* What most impacted your score above?
⚪ Location
⚪ Operating hours
⚪ ✨ Cleanliness
⚪ Privacy
⚪ Wait time
⚪ Availability of services
⚪ Confidentiality of health info
⚪ Staff friendliness and professionalism
⚪ Staff knowledge and skills
⚪ Other (please specify): ______
▪ Purpose: Allows programs to identify drivers of high and low ratings (e.g., promoters and detractors in Q5)
▪ Notes for data collectors: Patients should only choose one factor that most impacted their score in the previous question. Clients should only choose the worst factor if they scored 0-6; the best factor if they scored 9-10. If they marked 7-8 (passive) then their responses on this question will not be analyzed. If the most impactful factor is not listed the client can write a new factor under “other”.
7* How likely is it that you would return to this
same service for your future sexual health or
HIV service needs?
⚪ Not likely
⚪ Not sure
⚪ Likely
▪ Purpose: To see how patient experience affects their own retention. This is not a perfect measure of patient satisfaction because their likelihood to return to the facility may likely be impacted by other factors.
Skip
logic
Q5 responses = 9-10 (promoters) > page 3 (skip Q9)
Q5 responses = 0-6 (detractors) > page 3 (skip Q8)

18 L I N K – A N E L E C T R O N I C C L I E N T F E E D B A C K S Y S T E M F O R H I V P R O G R A M S
Q5 responses 7-8 (passives) > page 3 (skip Q8, Q9)
3 Open Feedback & Demographics Helpful Notes
8 Seems you were happy with the services!
Please explain the thing you liked most.
[open response]
▪ Purpose: This question is optimized for high response rate and focused, open feedback providing more detail about what contributed to the client’s positive experience. It provides additional insight into the root cause of high scorers on Q5 and the factor chosen in Q6.
▪ Notes for data collectors: Clients can describe in more detail the one thing they liked the most. Do not include unspecific feedback or suggestions such as “no feedback” or “it was fine”.
9 Seems you were unsatisfied with the services.
Please explain one thing we can improve.
[open response]
▪ Purpose: This question is optimized for high response rate and focused, open feedback providing more detail about what contributed to the client’s negative experience. It provides additional insight into the root cause of low scorers on Q5 and the factor chosen in Q6.
▪ Notes for data collectors: Clients can describe in more detail the one thing they liked the least. Do not include unspecific feedback or suggestions such as “bad” or repeat the factor from Q5 “cleanliness”.
10* Do you want to submit a complaint for this
service?
⚪ Yes
⚪ ❌No
▪ Purpose: Offers clients the option to submit a more detailed complaint if they provided a low score on Q5.
(Optional) More about you
Your responses to these optional questions are kept
confidential. Your responses help us ensure that
everyone feels welcome accessing health services.
▪ Purpose: To identify patterns in client experience based on population type that may be a result of provider bias, stigma, or discrimination. These categories match common population disaggregations by PEPFAR. Additional population categories can be added to match those served by the HIV program.
▪ Notes for data collectors: If patients take the survey on their own, let the patient know that this question is optional, and they can select all that apply, none, or rather not say. If the administrator is helping the patient, then the administrator can explain each emoji, turn the tablet to the client, and let them choose privately and tap done, and then tap done again at the bottom to submit.
11 How old are you?
⚪ Younger than 10 years
⚪ 10-14 years
⚪ 15-19 years
⚪ 20-24 years
⚪ 25-29 years
⚪ 30-34 years
⚪ 35-39 years
⚪ 40-44 years
⚪ 45-49 years
⚪ 50 years or older

19 L I N K – A N E L E C T R O N I C C L I E N T F E E D B A C K S Y S T E M F O R H I V P R O G R A M S
12 What sex were you assigned at birth?
⚪ Male
⚪ Female
⚪ Other
13 Are you a member of any of these populations?
Select all that apply.
⬜ ➕ Person living with HIV
⬜ Gay man or other man who has sex with
men
⬜ Sex worker
⬜ Person who paid for sex recently
⬜ Person who injects drugs
⬜ ⚧️ Transgender person
Skip
logic
Q10 = yes > go to page 4
Q10 = no > end survey
4 Client Complaint Form Helpful Notes
Instructions: You have the right to receive services that respect your needs as a person and that are free of discrimination. If you feel like your rights have not been respected or that you received inadequate health services, we ask that you complete this form so that we can improve our services.
▪ Purpose: Allows clients to provide a more detailed account of a negative experience while accessing services, including reporting an adverse event or experience of violence.
14* Which negative experience did you have? Select all that apply or explain under “other”.
⬜ I was prevented from accessing treatment or
other services
⬜ I was forced to disclose personal information
⬜ I was asked for sensitive information without my
consent
⬜ I was stigmatized by providers or other staff
⬜ My medical or personal information was shared
with others
⬜ Other (please specify): _________________
▪ Purpose: This question determines the type of negative event that occurred. The options provided match with the categories of “adverse events” described by PEPFAR in guidance for HIV programs seeking to monitor adverse events.
15 (Optional) Please tell us in detail about what happened:
▪ Purpose: Provides clients the option to detail their negative experience.

20 L I N K – A N E L E C T R O N I C C L I E N T F E E D B A C K S Y S T E M F O R H I V P R O G R A M S
[Open response]
16 (Optional) Which provider or other staff were involved in your negative experience above? Please write the name or title of the person.
[Open response]
▪ Purpose: If not described in Q14, this allows the adverse event to be attributed to a certain person or staff cadre where quality improvement or correction actions can be directed.
17* Was your negative experience related to index testing or because staff wanted you to refer your partners for HIV testing?
⚪ Yes
⚪ ❌ No
⚪ Not sure
▪ Purpose: A clear way to know if the client had a negative experience based on index testing, a priority of PEPFAR programs.
18 Do you want us to contact you in case we have further questions to help resolve your complaint? If yes, write your email or phone number below. Leave blank to submit an anonymous complaint.
[Open response]
▪ Purpose: Provides the HIV program a way to contact the client to gather additional information about the incident and inform the client about any resolution or corrective action taken.
▪ Other notes: HIV programs can decide to remove this question for an entirely anonymous survey. However, because clients commonly leave out important information in their complaint, providing clients the option to leave their email or phone will allow the HIV program to follow up with the client directly, learn more about the incident, and make more targeted and useful quality improvement efforts.
Complaints are reviewed weekly, but if you would like immediate support, such as counseling and support accessing violence response, please call, text, or flash the client compliant coordinator at [project name country name] at [phone number]
▪ Purpose: To allow clients to immediately contact someone for support in case of experience of violence. This text is adapted to the program context.
Skip
logic
All responses end survey here.
If client enters phone or email on Q15, program staff will contact the client to complete the “beneficiary
abuse disclose and response form”, which is available in a forthcoming guidance by FHI 360 on community
monitoring for accountable and responsive services.
5 Follow-Up for Missed Services Helpful Notes
19 Any reasons you did not make it in for services?
Select all that apply.
⬜ Could not find clinic
⬜ Clinic location inconvenient
⬜ Opening hours inconvenient
⬜ Worried other people will see me there
⬜ I was too busy or something came up
▪ Purpose: Provides some insight into the reasons why people may not be showing up for services they were referred for.

21 L I N K – A N E L E C T R O N I C C L I E N T F E E D B A C K S Y S T E M F O R H I V P R O G R A M S
⬜ I was too nervous about knowing my HIV
status
⬜ Worried about the confidentiality or
friendliness of clinic staff
⬜ Other (please specify): ____
20 Would you like to re-book an appointment on
[name of website or page to access services]?
⚪ Yes
⚪ Not now
▪ Purpose: To re-direct a client back to a website or page where they can request services again. This is helpful for programs using an Online Reservation App. If no such app exists this can link to the social media page of the HIV program or to a chat on Messenger or WhatsApp where someone can help the client access services.
Skip
logic
Q19=yes > End survey and re-direct client to website to re-book an appointment
Q19=not now > End survey

22 L I N K – A N E L E C T R O N I C C L I E N T F E E D B A C K S Y S T E M F O R H I V P R O G R A M S
Annex 2: All Facility Client Feedback Report (Monthly or Quarterly)
All Facility Comparison Report LINK [country]
Q4 FY20 Jul 1 to Sep 30, 2020
Volume Key messages
1. Number of survey responses per facility in the last quarter (all facilities)
780 surveys were
completed in Q4 across
all facilities (of 2,030 total
surveys)
7 facilities over threshold
(20 surveys)
9 facilities under
threshold, need to
reinforce data collection
efforts there
3 facilities have 0 surveys
in Q4: Govt clinic 2, 6, 9,
and DIC 1
Govt clinic 9 and DIC 1: 0
surveys total
2. Monthly data collection trend over the last year (all facilities)
Volume of surveys dipped
in April and May, likely a
result of COVID-19
lockdown
Volume picked up steadily
in Q4, but driven by only a
few high-volume sites

23 L I N K – A N E L E C T R O N I C C L I E N T F E E D B A C K S Y S T E M F O R H I V P R O G R A M S
Client feedback Key messages
3. Monthly average likelihood of recommending the service to others over last year (Net Promoter Score) – all facilities
The average net promoter
score across facilities
varied greatly over the
course of FY20
Net promoter score was
originally very low at
certain high-volume sites
in early FY20 because
staff misunderstood the 0-
10 rating scale of NPS
4. Average Net Promoter Score per facility, compared to global health care benchmark (only facilities with over 20 surveys)
Govt clinic 7 Govt clinic 5
Govt clinic 8 DIC 1
Govt clinic 9 Govt clinic 10
Govt clinic 6 Healthcare benchmark
3 facilities performed
better than the health
care standard, including
Govt Clinic 9, 8, and DIC
1
2 facilities did not meet
the industry benchmark
including Govt Clinic 10
and 6
2 facilities were within the
industry benchmark
including Govt Clinic 5
and 7

24 L I N K – A N E L E C T R O N I C C L I E N T F E E D B A C K S Y S T E M F O R H I V P R O G R A M S
5. Likelihood for clients to return to facility (only facilities with over 20 surveys)
39% of Govt Clinic 10’s
clients report being
unlikely to return to the
facility for services in the
future, indicating potential
loss to follow-up
The program should focus
efforts on Govt Clinic 10
to improve client
experience and increase
likelihood of returning to
the service
Other facilities, such as
Govt Clinic 5 and 6
should also be explored
to identify issues causing
clients to not want to
return
Open feedback Key messages
Guide: When analyzing open feedback, start with an analysis of most common terms, and then open individual open
feedback responses to identify trends and major themes, and write thoughtful recommendations and outcomes below.
Use these data visualizations and key messages to start a conversation about clients’ open feedback and remain open
to different interpretations and root cause of positive and negative feedback identified.
6. Most common terms used in negative open feedback 😔 (all facilities)
Very little actionable
feedback received
Most responses contain
“no problem”
It is likely that clients are
selecting the “auto-fill”
response on the tablets
Clients should be
encouraged to explain in
more detail what they
liked, or skip the question

25 L I N K – A N E L E C T R O N I C C L I E N T F E E D B A C K S Y S T E M F O R H I V P R O G R A M S
7. Most common terms used in positive open feedback 😀 (all facilities)
Very little actionable
positive feedback
received
Open feedback commonly
repeats the same word or
factor used in the
question above
Clients should be
encouraged to explain in
more detail what they
liked, or skip the question
Client complaints Key messages
8. New complaints reported in the quarter (all facilities)
17-Aug- Client was stigmatized by providers or other staff
18-Aug- Client wanted counseling services improved at facility
20-Aug- Client was forced to disclose personal information
25-Aug- Client was afraid of disclosing status
1-Sep- Client has not had any negative experience
2-Sep- Client was forced to disclose personal information
2-Sep- Client was prevented from accessing treatment or other services
3-Sep- Timing for test was too long
3-Sep- No STI services at health facility
3-Sep- No STI services at health facility
8-Sep- Client's medical or personal information was shared with others
10-Sep- Client was exposed to HIV could not get PrEP services at health
facility
17-Sep- Client was afraid of disclosing status
Call each client who
provides phone number in
their complaint (thank and
explore the complaint
more)
13 total complaints: 9
resolved, 4 unresolved

26 L I N K – A N E L E C T R O N I C C L I E N T F E E D B A C K S Y S T E M F O R H I V P R O G R A M S
How to create each of the charts in Survey Monkey:
Table 1: Go to original view > question summaries > add time-period filter > go to Q2 > select customize >
display options > select data table > screenshot data table
Chart 2: Go to original view > go to “insights and data trends” > go to the first chart > edit (1) “trend by” and select
“months” and (2) edit “zoom” and select “12 months” > screenshot
Chart 3: Go to original view > go to “insights and data trends” > go to Q4 chart > edit (1) “trend by” and select
“months” and (2) edit “zoom” and select “12 months” > screenshot
Chart 4: Go to original view > question summaries > add rule to filter by time-period > add rule to compare by
“question and answer” based on Q2 and select only the facilities which have more than 20 surveys > go to Q4 >
select “show benchmark” > screenshot
Chart 5: Go to original view > go to question summaries > add rule to filter by time-period > add rule to compare
by “question and answer” based on Q2 and select only the facilities which have more than 20 surveys > go to Q6
> customize > chart type > select “stacked horizontal bar” > display options > check mark “data in chart” and axis
scale=percentage > screenshot
Chart 6: Go to original view > go to question summaries > add rule to filter by time-period > go to Q10 and review
all feedback to understand the types of feedback received > select “word cloud” > “list view” > screenshot
Chart 7: Follow the same steps in the chart above, but complete for question 9.
List 8: Go to LINK client complaint tracker, filter by country, copy date, and short description of the complaint.

27 L I N K – A N E L E C T R O N I C C L I E N T F E E D B A C K S Y S T E M F O R H I V P R O G R A M S
Annex 3: Facility-Specific Client Feedback Report (Quarterly)
Government Clinic 4 Report LINK [Country]
Q4 FY20 Jul 1 to Sep 30, 2020
Volume Key messages
1. Number of survey responses by week
86 surveys completed
in Q4, but few in recent
weeks
Remind the facility to
regularly offer to clients
the LINK feedback
survey
Govt Clinic 4 started
data collection in Q4,
so no surveys were
collected previously
Client feedback Key messages
2. Average likelihood of clients recommending the service to others
(Net Promoter Score)
The facility scored +42
on the net promoter
score, which is near the
industry standard (51)
The facility ranked 5
out of 7 facilities with a
minimum of 20 surveys
completed
The facility should aim
to improve their NPS

28 L I N K – A N E L E C T R O N I C C L I E N T F E E D B A C K S Y S T E M F O R H I V P R O G R A M S
3. Weekly average Net Promoter Score
The facility shows
increasing NPS scores
over the short time
period of
implementation
4. Most common factors impacting low scorers (detractors) 😔
Confidentiality is the
most reported factor
among low scores
(detractors), followed
by staff friendliness
Use focus groups to
identify the root cause
of confidentiality issues
Explore how operating
hours can be made
more convenient
Explore why
friendliness is a
promoting and
detracting factor,
possibly certain clients
are stigmatized
because of age,
gender, or KP status

29 L I N K – A N E L E C T R O N I C C L I E N T F E E D B A C K S Y S T E M F O R H I V P R O G R A M S
5. Most common factors impacting high scorers (promoters) 😀
Commend the facility
on service availability,
which seems to be a
strong promoting factor
Useful open feedback Key messages
Guide: When analyzing open feedback, review all individual feedback but only present feedback considered to be
useful for informing quality improvement.
6. Useful open feedback among detractors 😔
Very little actionable
feedback received
Most responses contain
“no problem”
Clients may select the
“autofill” response on
the tablets
Clients should be
encouraged to explain
in more detail what they
liked or did not like

30 L I N K – A N E L E C T R O N I C C L I E N T F E E D B A C K S Y S T E M F O R H I V P R O G R A M S
7. Useful open feedback among promoters 😀
Key messages are the
same as shown for
detractors (above)
Client complaints Key messages
8. New complaints in the last quarter
18-Aug- ART client wanted counseling services improved at facility
20-Aug- ART client reported being forced to disclose personal information during
counseling session
25-Aug- ART client was afraid of disclosing status during a counseling session
1-Sep- invalid complaint (not a negative experience)
3 valid complaints
submitted, all related to
counseling for ART
clients
Call each client who
provides phone number
in their complaint
(thank and explore the
complaint more)
Consider focusing on
quality improvement
efforts with the
counselor of the ART
section of this facility

31 L I N K – A N E L E C T R O N I C C L I E N T F E E D B A C K S Y S T E M F O R H I V P R O G R A M S
How to create each of the charts in Survey Monkey:
Chart 1: Go to original view (no filters) > go to “insights and data trends” > add rule to filter by question and
answer, select the facility name > go to the first chart > edit (1) “trend by” and select “months” and (2) edit “zoom”
and select “12 months” > screenshot. (Alternatively, if there is a small time for data collection, you can edit (1)
“trend by” and select “weeks” and (2) edit “zoom” and select “3 months”)
Chart 2: Go to original view > go to “question summaries” > add rule to filter by time-period > add rule to filter by
question and answer, select the facility name > go to Q4 > select show benchmark > select chart type = gauge
chart > screenshot
Chart 3: Go to original view (no filters) > go to “insights and data trends” > add rule to filter by question and
answer, select the facility name > go to Q4 > edit (1) “trend by” and select “months” and (2) edit “zoom” and select
“12 months” > screenshot (Alternatively, if there is a small time for data collection, you can (1) edit “trend by” and
select “weeks” and (2) edit “zoom” and select “3 months” > screenshot)
Chart 4: Go to original view > go to question summaries > add rule to filter by question and answer, select the
facility name > add rule to filter by time-period > add rule to filter by “question and answer” and select Q4 and
select only “Detractors (0-6)” > go to Q5 > change chart type if necessary, go to customize > chart type > select
horizontal bar > screenshot
Chart 5: Repeat the process for chart 4, but edit the rule to filter by question and answer > unselect detractors,
and select promoters > save > screenshot
Chart 6: Go to original view > question summaries > add rule to filter by question and answer, select the facility
name > add rule to filter by time-period > go to Q10 > review all feedback to understand the types of feedback
received > consider the definition for “useful feedback”: includes feedback that describes the root cause of
promoting factors or describes other positive factors not previously listed > select each individual open feedback
that meets this definition of “useful” > select “apply to selected” > add tags > select tag called “useful feedback”
(or create new tag called “useful feedback”) > save > filter by tag > select “useful feedback” > Select “word cloud”
> “list view” > screenshot
Chart 7: Repeat the same steps for the above chart, but for question 9 (promoter feedback).
List 8: Go to LINK client complaint tracker, filter by country, filter by facility, copy date, and short description of
the complaint

32 L I N K – A N E L E C T R O N I C C L I E N T F E E D B A C K S Y S T E M F O R H I V P R O G R A M S
Annex 4: Client Complaint Tracker
# Survey #
Date reported
Facility/Service provider
Short description of complaint
Related to index?
Client contacted?
Status Short description of resolution
Other comments
1 256 11-Nov Govt clinic 5 Client said provider shared their HIV status with partner without their permission
❌ No ✔️ Yes Open Need to contact facility mgmt to identify staff involved and arrange for follow-up training.
Client said they wanted to contact their partner first. No harm from partner reported by client.
2 491 12-Mar DIC 2 Client said facility was dirty
❌ No ❌ No Closed Communicated complaint to facility mgmt
3
4
5
6
7
8
9
10
11

33 L I N K – A N E L E C T R O N I C C L I E N T F E E D B A C K S Y S T E M F O R H I V P R O G R A M S
Annex 5: Action Planning Form
Date:
Name of Site/Health Facility:
Type of Site (select one): KP drop-in center Project-run community clinic Government clinic
Private health facility Mobile services Other: ______________
No. Challenge/Gap Actions to be taken to address the issue
Lead person responsible
Timeline/
due date
Supervisor Status
1
2
3
4
5
For programs using LINK without Community Score Card, consider adding a column to this action plan, after “challenge/gap”, where the root cause of problems identified in the facility may be noted, which can help determine solutions.