Link Performance for a Satellite-Based Communications ...
8
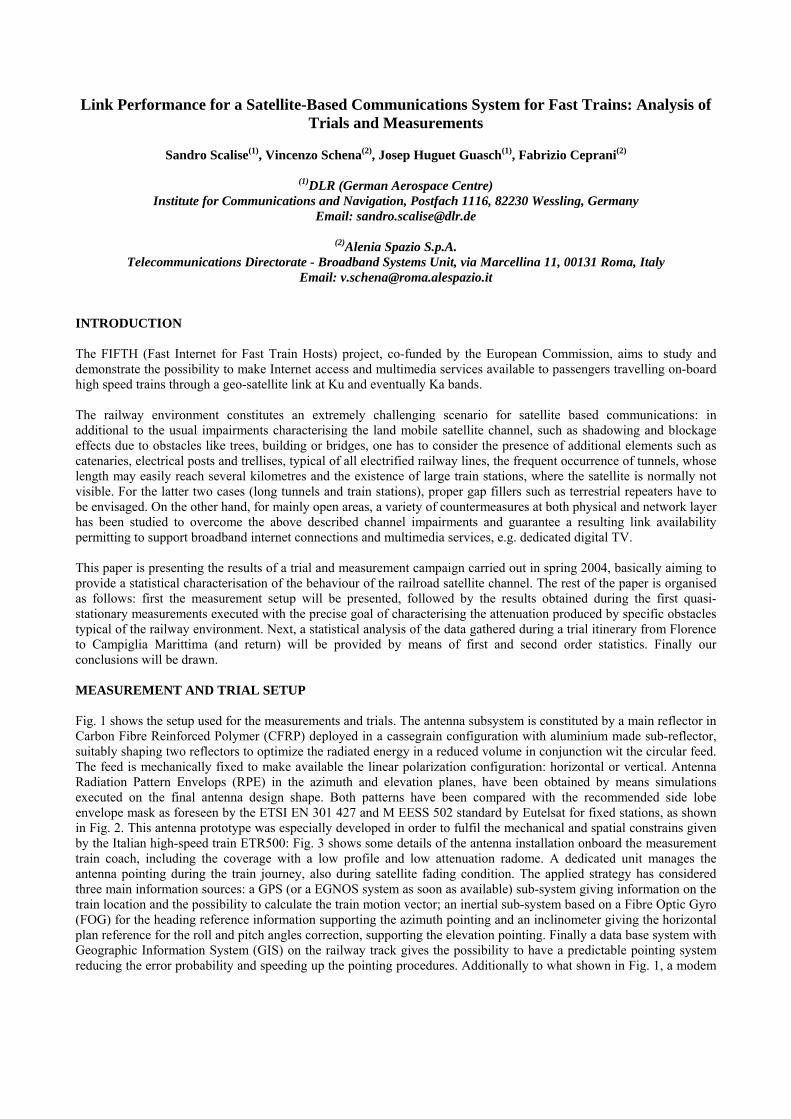
Link Performance for a Satellite-Based Communications System for Fast Trains: Analysis of Trials and Measurements Sandro Scalise (1) , Vincenzo Schena (2) , Josep Huguet Guasch (1) , Fabrizio Ceprani (2) (1) DLR (German Aerospace Centre) Institute for Communications and Navigation, Postfach 1116, 82230 Wessling, Germany Email: [email protected] (2) Alenia Spazio S.p.A. Telecommunications Directorate - Broadband Systems Unit, via Marcellina 11, 00131 Roma, Italy Email: [email protected] INTRODUCTION The FIFTH (Fast Internet for Fast Train Hosts) project, co-funded by the European Commission, aims to study and demonstrate the possibility to make Internet access and multimedia services available to passengers travelling on-board high speed trains through a geo-satellite link at Ku and eventually Ka bands. The railway environment constitutes an extremely challenging scenario for satellite based communications: in additional to the usual impairments characterising the land mobile satellite channel, such as shadowing and blockage effects due to obstacles like trees, building or bridges, one has to consider the presence of additional elements such as catenaries, electrical posts and trellises, typical of all electrified railway lines, the frequent occurrence of tunnels, whose length may easily reach several kilometres and the existence of large train stations, where the satellite is normally not visible. For the latter two cases (long tunnels and train stations), proper gap fillers such as terrestrial repeaters have to be envisaged. On the other hand, for mainly open areas, a variety of countermeasures at both physical and network layer has been studied to overcome the above described channel impairments and guarantee a resulting link availability permitting to support broadband internet connections and multimedia services, e.g. dedicated digital TV. This paper is presenting the results of a trial and measurement campaign carried out in spring 2004, basically aiming to provide a statistical characterisation of the behaviour of the railroad satellite channel. The rest of the paper is organised as follows: first the measurement setup will be presented, followed by the results obtained during the first quasi- stationary measurements executed with the precise goal of characterising the attenuation produced by specific obstacles typical of the railway environment. Next, a statistical analysis of the data gathered during a trial itinerary from Florence to Campiglia Marittima (and return) will be provided by means of first and second order statistics. Finally our conclusions will be drawn. MEASUREMENT AND TRIAL SETUP Fig. 1 shows the setup used for the measurements and trials. The antenna subsystem is constituted by a main reflector in Carbon Fibre Reinforced Polymer (CFRP) deployed in a cassegrain configuration with aluminium made sub-reflector, suitably shaping two reflectors to optimize the radiated energy in a reduced volume in conjunction wit the circular feed. The feed is mechanically fixed to make available the linear polarization configuration: horizontal or vertical. Antenna Radiation Pattern Envelops (RPE) in the azimuth and elevation planes, have been obtained by means simulations executed on the final antenna design shape. Both patterns have been compared with the recommended side lobe envelope mask as foreseen by the ETSI EN 301 427 and M EESS 502 standard by Eutelsat for fixed stations, as shown in Fig. 2. This antenna prototype was especially developed in order to fulfil the mechanical and spatial constrains given by the Italian high-speed train ETR500: Fig. 3 shows some details of the antenna installation onboard the measurement train coach, including the coverage with a low profile and low attenuation radome. A dedicated unit manages the antenna pointing during the train journey, also during satellite fading condition. The applied strategy has considered three main information sources: a GPS (or a EGNOS system as soon as available) sub-system giving information on the train location and the possibility to calculate the train motion vector; an inertial sub-system based on a Fibre Optic Gyro (FOG) for the heading reference information supporting the azimuth pointing and an inclinometer giving the horizontal plan reference for the roll and pitch angles correction, supporting the elevation pointing. Finally a data base system with Geographic Information System (GIS) on the railway track gives the possibility to have a predictable pointing system reducing the error probability and speeding up the pointing procedures. Additionally to what shown in Fig. 1, a modem
Transcript of Link Performance for a Satellite-Based Communications ...
Link Performance for a Satellite-Based Communications System for Fast Trains: Analysis of Trials and Measurements
Sandro Scalise(1), Vincenzo Schena(2), Josep Huguet Guasch(1), Fabrizio Ceprani(2)
(1)DLR (German Aerospace Centre)
Institute for Communications and Navigation, Postfach 1116, 82230 Wessling, Germany Email: [email protected]
(2)Alenia Spazio S.p.A.
Telecommunications Directorate - Broadband Systems Unit, via Marcellina 11, 00131 Roma, Italy Email: [email protected]
INTRODUCTION The FIFTH (Fast Internet for Fast Train Hosts) project, co-funded by the European Commission, aims to study and demonstrate the possibility to make Internet access and multimedia services available to passengers travelling on-board high speed trains through a geo-satellite link at Ku and eventually Ka bands. The railway environment constitutes an extremely challenging scenario for satellite based communications: in additional to the usual impairments characterising the land mobile satellite channel, such as shadowing and blockage effects due to obstacles like trees, building or bridges, one has to consider the presence of additional elements such as catenaries, electrical posts and trellises, typical of all electrified railway lines, the frequent occurrence of tunnels, whose length may easily reach several kilometres and the existence of large train stations, where the satellite is normally not visible. For the latter two cases (long tunnels and train stations), proper gap fillers such as terrestrial repeaters have to be envisaged. On the other hand, for mainly open areas, a variety of countermeasures at both physical and network layer has been studied to overcome the above described channel impairments and guarantee a resulting link availability permitting to support broadband internet connections and multimedia services, e.g. dedicated digital TV. This paper is presenting the results of a trial and measurement campaign carried out in spring 2004, basically aiming to provide a statistical characterisation of the behaviour of the railroad satellite channel. The rest of the paper is organised as follows: first the measurement setup will be presented, followed by the results obtained during the first quasi-stationary measurements executed with the precise goal of characterising the attenuation produced by specific obstacles typical of the railway environment. Next, a statistical analysis of the data gathered during a trial itinerary from Florence to Campiglia Marittima (and return) will be provided by means of first and second order statistics. Finally our conclusions will be drawn. MEASUREMENT AND TRIAL SETUP Fig. 1 shows the setup used for the measurements and trials. The antenna subsystem is constituted by a main reflector in Carbon Fibre Reinforced Polymer (CFRP) deployed in a cassegrain configuration with aluminium made sub-reflector, suitably shaping two reflectors to optimize the radiated energy in a reduced volume in conjunction wit the circular feed. The feed is mechanically fixed to make available the linear polarization configuration: horizontal or vertical. Antenna Radiation Pattern Envelops (RPE) in the azimuth and elevation planes, have been obtained by means simulations executed on the final antenna design shape. Both patterns have been compared with the recommended side lobe envelope mask as foreseen by the ETSI EN 301 427 and M EESS 502 standard by Eutelsat for fixed stations, as shown in Fig. 2. This antenna prototype was especially developed in order to fulfil the mechanical and spatial constrains given by the Italian high-speed train ETR500: Fig. 3 shows some details of the antenna installation onboard the measurement train coach, including the coverage with a low profile and low attenuation radome. A dedicated unit manages the antenna pointing during the train journey, also during satellite fading condition. The applied strategy has considered three main information sources: a GPS (or a EGNOS system as soon as available) sub-system giving information on the train location and the possibility to calculate the train motion vector; an inertial sub-system based on a Fibre Optic Gyro (FOG) for the heading reference information supporting the azimuth pointing and an inclinometer giving the horizontal plan reference for the roll and pitch angles correction, supporting the elevation pointing. Finally a data base system with Geographic Information System (GIS) on the railway track gives the possibility to have a predictable pointing system reducing the error probability and speeding up the pointing procedures. Additionally to what shown in Fig. 1, a modem

to receive IP based traffic over DVB-S air interface [1] using Multi Protocol Encapsulation (MPE) was added in parallel to the digital TV receiver and to spectrum analyser. A 2 Mbps SCPC access via Hot Bird 6™ in transparent mode has been adopted in transmission.
RF Splitter(-5dB)
RS232
Acquisitions Workstation
PAL Video Signal
MicroCamera
SAT DecoderDigital DisplayGyro
Sensor
SpectrumAnalyser Video
Combiner
GPS
FIFTHAntenna
Prototype
AntennaControl Unit
(ADCU)
Video Recorder
Ku GEO Satellite
(HB6)
Fig. 1. Measurement setup
Fig. 2. Measured antenna radiation patterns
Radome Installedon the Coach
Roof
Radome Installedon the Coach
Roof
Fig. 3. Details of FIFTH prototype antenna and radome installation

DETAILED MEASUREMENTS OF PECULIAR OBSTACLES CHARACTERISING THE RAILWAY ENVIRONMENT The first measurements have been dedicated to characterize the effects of the above described peculiar obstacles typical of the railway environment, since the only applicable works found in the literature report the outcomes of a limited trial campaign using a narrowband test signal at 1.5 GHz, performed more than 10 years ago in the north of Spain [2] and those of trials performed in Japan using a DVB-S forward link and a terrestrial return link via GSM. Whereas for 1.5 GHz signal, the attenuation due to electrical post and trellises is between 3 and 5 dB, normally compensable by the link margin and the FEC scheme, at Ku/Ka bands this effect becomes much more significant, as it will be shown next.
Table 1. Link budget for quasi-stationary measurements Value Unit
Satellite EIRP (HB2) 50,00 dBWFrequency 11,919 GHzSpeed of Light 3,00E+08 m/sFree Space Loss 205,52 dBRadome Loss 0,50 dBAdditional Loss (pointing, polarisation) 0,50 dBFIFTH Antenna Gain 34,40 dBiFIFTH Antenna Noise Temperature 164,35 KReceiver Noise Temperature 58,66 KOverall Terminal Noise Temperature 23,48 dBKTerminal G/T 10,92 dBBoltzmann Constant -228,60 dBWs/KC/N0 83,00 dBHzReceiver Bandwidth 33,00 MHzC/N 7,81 dB
Firenze UnitLatitude 43,78 deg NLongitude 11,23 deg ESatellite Position (Atlantic Bird 1) 13,00 deg ECosine of Central Angle 0,72Earth Mean Radius 6378,00 kmAltitude of GEO Satellite 35786,00 kmElevation 39,48 degSlant Range 37820,15 kmFree Space Loss 205,52 dB
Fig. 4 shows the measured attenuation suffered by a standard digital satellite TV signal due to some of the obstacles depicted in Fig. 4 (right uppermost): it can be appreciated that, on the one hand, the effect of the post brackets and of the catenaries is in the order of 1 – 3 dB respectively, that can be easily counteracted by a proper link margin and by FEC schemes. On the other hand, the effect of the electrical trellises result in a deep fade estimated in Fig. 4 in approximately 8 dB attenuation. Theoretical predictions using a knife-edge diffraction model, already presented in [4], led to the conclusion that the effective attenuation can be even 15 dB, not appreciable in Fig. 4 due to a limited link margin of the measurement setup, approximately equal to 8 dB as reported in Table 1. If no specific countermeasure is applied to compensate such an effect, frequent and significant packet losses will occur with space periodicity equal to the separation among subsequent trellises, as reported also in [3], and even TV reception may suffer from apparent degradation, as exemplified in Fig. 5. STATISTICAL ANALYSIS OF FIFTH TRIALS The trial itinerary, connecting Florence with Campiglia Marittima, located on the western coast of Italy has an approximate length of 200 km, and the maximum reached speed during the trials was around 160 km. Furthermore, it can be notice that the first part of the itinerary, from Florence to Pisa, is mainly E-W oriented, whereas the last part, from Pisa to Campiglia Marittima, is mainly N-S oriented. This latter part is also characterised by the presence of some railway tunnels. Nevertheless, since it is foreseen that the connection to and from the train terminal is provided directly via satellite, except in those areas where no satellite visibility conditions can be accounted for, where proper gap-fillers will be deployed, parts of the gathered data referring to large railways stations and long tunnels had not been taken into account in the results presented next.

Fig. 4. Measured attenuation due to electrical trellises, post brackets and catenaries
Fig. 5. Qualitative example of disturbed TV reception in absence of specific countermeasures
Based on the provided navigation data concerning the latitude and the longitude of the train terminal with update rate of 1 sec., the instantaneous position and speed of the train had been computed according to methodology described next. First of all, a local averaging of the datasets containing the latitude and the longitude of the train had to be performed. A sliding window spanning over 5 seconds was considered adequate to get rid of some inaccuracies affecting the navigation data, limited by the precision of the GPS receiver. Without this averaging procedure, unrealistic peaks in the calculated speed were present. Furthermore, the assumption to consider all encountered areas where no GPS data were available as straight was introduced. In other words, given the latitude and the longitude at the beginning and at the end of each area where no GPS signal was available, and the time that the train spent to cover the correspondent distance, a linear interpolation was performed to approximate the instantaneous position of the train. Given this modified datasets containing the latitude and the longitude of train, the covered distance among two pair of subsequent coordinates can be obtained by means simple trigonometric laws, under the usual assumption to consider the Earth as a perfect sphere. Exemplary results are given for the forward and the return path in Fig. 6.

0 10 20 30 40 50 60 70 80 90 100 110 120 130 140 150 1600
10
20
30
40
50
60
70
80
90
100
110
120
130
140
150
160
Elapsed Time [min]
[Km
/h]
0 10 20 30 40 50 60 70 80 90 100 110 1200
10
20
30
40
50
60
70
80
90
100
110
120
130
140
150
160
170
Elapsed Time [min]
[Km
/h]
Fig. 6. Train speed computed from the recorded navigation data from Florence to Campiglia M. and return.
First Order Statistics In Fig. 7, the Probability Density Function (PDF) and the complementary Cumulative Distribution Function (CDF) are shown. By inspecting the PDF, it is easy to identify three peaks around -61 dBm, -71.4 dBm and -74 dBm where the distribution of the received signal level is more concentrated. This effect is due to some repetitive situations along the railway path that will be discussed next. The first zone, around -61 dBm, represents the LOS state. In the following, we will try to identify what is the available link margin in dB to guarantee proper decoding of a DVB-S signal with typical convolutional coderate equal to 3/4. From the log-data obtained by the RX modem, the maximum recorded Eb/N0 at the VA output was equal to 11.9 dB. This corresponds to a maximum Es/N0 equals to 13.7 dB. From [1], the minimum required Es/N0 for Quasi Error Free (QEF) reception turns out to be 6.8 dB, resulting in an available margin of approximately 7 dB. Hence, correct reception can be assumed down to -67 dBm. This calculation does not take into account the fact the noise floor can be slightly higher in NLOS conditions, since this variation is however negligible. In Figure 8, this margin corresponds to a link availability of roughly 80%, in absence of specific countermeasures and ignoring latencies due to resynchronisation after a deep or long fade. The second peak in the PDF, around -71.4 dBm, appears to be a consequence of the “light” obstacles placed next to the train path. This kind of obstacles blocks the signal from the satellite but as they are small some indirect rays may reach the train antenna. Nevertheless, this zone lays under the reception threshold, meaning that no correct reception can be accounted for in absence of specific countermeasures. In case this second “state” could be recovered, an additional 10% of link availability would be gained, leading to 90% overall link availability. We will refer to this state as “shadowed” state. The third peak, around -74 dBm, is due to larger obstacles placed next to the train path or over it. These obstacles can be buildings placed near the train path, bridges or very short tunnels. It has to be pointed out that, due to the limited margin of the measurement setup, the measured signal level is mainly determined by the noise floor, and that the real attenuation is much higher. This third state (referred to as “blocked”) is hence corresponding to deep blockages whose recovery appears extremely challenging if no specific countermeasure is implemented.
-82 -81 -80 -79 -78 -77 -76 -75 -74 -73 -72 -71 -70 -69 -68 -67 -66 -65 -64 -63 -62 -61 -60 -59 -580
0.05
0.1
0.15
0.2
0.25
0.3
0.35
0.4
Signal Level [dBm]
PD
F
-82 -81 -80 -79 -78 -77 -76 -75 -74 -73 -72 -71 -70 -69 -68 -67 -66 -65 -64 -63 -62 -61 -60 -59 -580
0.2
0.4
0.6
0.8
1
Signal Level [dBm]
Com
plem
enta
ry C
DF
-82 -81 -80 -79 -78 -77 -76 -75 -74 -73 -72 -71 -70 -69 -68 -67 -66 -65 -64 -63 -62 -61 -60 -59 -580
0.05
0.1
0.15
0.2
0.25
0.3
Signal Level [dBm]
PD
F
-82 -81 -80 -79 -78 -77 -76 -75 -74 -73 -72 -71 -70 -69 -68 -67 -66 -65 -64 -63 -62 -61 -60 -59 -580
0.2
0.4
0.6
0.8
1
Signal Level [dBm]
Com
plem
enta
ry C
DF
Fig. 7. PDF and complementary CDF of the received power level from Florence to Campiglia M. and return.

Second Order Statistics The following second order statistics are presented in this section: Level Crossing Rate (LCR), Average Fade Duration (AFD), Time Share of Connection (TSC), Time Share of Fades (TSF). For the sake of clarity, the correspondent definitions are recalled below:
• the LCR at level x is defined as the rate at which the fading envelope crosses the given level x in a positive going direction, i.e. the number of times per second (or meter) a certain threshold level is crossed in the upwards direction;
• the AFD at level x is defined as the average time (or length) that the fading envelope remains under the level x after crossing that level in a downward direction. In other words, the AFD tells us what the average duration (or length) of fades under a given threshold is;
• the TSC is the probability that an arbitrary time instant belongs to a connection of duration ≥ Tc, where a connection is defined as a time interval during which the received signal power level stays above a certain threshold;
• the TSF, dually with respect to the TSC, is defined as the probability that an arbitrary time instant belongs to a fade of duration ≥ Tf, where a fade is defined as a time interval during which the received signal power level stays below a certain threshold.
The results are presented in Fig. 8. The LCR and the AFD have been plotted using a spaced-based reference instead of the usual time-based reference. Since the speed of the train can vary in the range from 0 to approximately 160 km/h, as shown in Fig. 6, the rationale behind this approach is to provide the statistics which do not depend on the train speed and can be hence extended to other itineraries, taking into account that the speed of a train is normally following a predefined pattern and it can hence be predicted with a relatively high degree of accuracy. To perform this conversion, the speed of the train has been assumed constant during adjacent intervals of duration 1 second.
10-6 10-5 10-4 10-3 10-2 10-1-82
-80
-78
-76
-74
-72
-70
-68
-66
-64
-62
-60
LCR (Level Crossing Rate) [1/m]
Rec
ived
sig
nal l
evel
[dB
m]
101 102 103-82
-80
-78
-76
-74
-72
-70
-68
-66
-64
-62
-60
AFD (Average Fade Duration) [m]
Rec
ived
sig
nal l
evel
[dB
m]
100 101 1020
0.1
0.2
0.3
0.4
0.5
0.6
0.7
0.8
0.9
1
Tc [sec]
Pro
vabi
lity
of c
onne
ctio
n
-61 dBm-62 dBm-63 dBm-64 dBm-65 dBm-66 dBm-67 dBm-68 dBm-69 dBm-70 dBm-72 dBm-74 dBm-76 dBm-78 dBm
100 101 10210
-4
10-3
10-2
10-1
100
Tf [sec]
Pro
vabi
lity
of fa
de
-61 dBm-62 dBm-63 dBm-64 dBm-65 dBm-66 dBm-67 dBm-68 dBm-69 dBm-70 dBm-72 dBm-74 dBm-76 dBm-78 dBm
Fig. 8. Second order statistics of the received signal power

The following comments are in order: from the LCR, it can be seen that the average occurrence of the “light” obstacles (-71.4 dBm) is 21 seconds / 434 meters and of larger obstacles (-74 dBm) is 50 seconds / 667 meters. On the other hand, the AFD is for 2.9 seconds / 60 m in the first case and 1.95 seconds / 40 m in the latter case. The results under -76 dBm are not significant because they are a consequence of the loss of lock in the RX modem. Concerning the TSC and the TSF, focusing on the threshold at -67 dBm discriminating the limit for QEF reception, it can be appreciated that there is probability of 63.4 % of having a connection over the reception threshold larger than 10 seconds. This probability diminishes up to 24.5 % if we look for connections larger than 100 seconds. Dually, a fade or disconnection larger than 5 seconds will happen with a probability of 12.3 % it. This probability decreases to 9.74 % if we are looking for fades larger than 10 seconds and till 4.4 % if the fade is lager than 50 seconds. Frequency Domain Analysis Fig. 9 shows the estimated Power Spectral Density (PSD) obtained by means of the well known periodogram averaging technique. A sliding Hanning window of length 1024 samples has been used, with an overlapping of 768 samples among each block and the subsequent one, corresponding to 3/4 of the window length. As already done for the second order statistics, this analysis has been carried out in the space domain by interpolating the time-domain fading envelop at suitable time instants with a constant space separation of 1 m. The resulting spaced-based fading enveloped has been used to estimate the PSD, bearing in mind that the correspondent x-axis variable in the Fourier domain is now expressed in 1/m. The underlying idea is that the presence of a space-periodic fading such as that due to the occurrence of the power supply arches (ca every 60-61 meters in the railway path under analysis) shown in Fig. 4 shall be revealed by the PSD in the space-domain by the correspondent harmonics. In fact, the vertical lines in correspondence of the inverses of some multiples of 60 m drawn in Fig. 9 (together with a vertical line at 1 / 120 m, in case that, due to the high speed and to the limited sampling frequency, only 1 out of 2 arches had been detected) show that, given some tolerance to take into account that the spacing among subsequent trellises is not exactly constant, this hypothesis is fulfilled.
10-3 10-2 10-1 100-150
-145
-140
-135
-130
-125
-120
-115
-110
-105
-100
[1/m]
Pow
er S
pect
rum
Den
sity
[dB
m*m
]
1/60 2/60 3/60 1/120
Fig. 9. Estimated fading envelop PSD in the space domain.
CONCLUSION The setup of the FIFTH demonstrator to validate the envisaged solutions to provide internet and multimedia services to passengers travelling on high speed train has been widely described. Furthermore, the results of some trails executed in spring 2004 in central Italy have been presented, mainly highlighting the statistical behaviour of the railroad satellite channel. An overall link availability close to 99% seems a realistic objective, thanks to adequate countermeasures, analysed in details during the FIFTH project, to compensate the typical fading events of the railroad satellite channel, which, as it was shown by means of the second order statistics are characterised by relative frequent occurrence but also by relative short duration (on average, below 3 seconds).
REFERENCES [1] ETSI, “Digital Video Broadcasting (DVB); Framing Structure, Channel Coding and Modulation for 11/12 GHz
Satellite Services”, EN 300 421, 1997.
[2] A. Benarroch and L. Mercader; “Signal Statistics Obtained from a LMSS Experiment with the MARECS Satellite”, IEEE Transactions on Communications, vol. 42, 1994, pp. 1264-1269.
[3] F. Nagasage, J. Mitsugi, M. Nakayama and M. Ueba, “Ku-band Mobile Multimedia Satellite Communications System for Trains”, in Proc. of the 21st International Communications Satellite System Conference & Exhibits(ICSSC03), AIAA, Yokohama, Japan, 2003.
[4] G. Sciascia, S. Scalise, H. Ernst, and R. Mura, "Statistical Characterization of the Railroad Satellite Channel at Ku-Band," in Proc. of the International Workshop of Cost Actions 272 and 280, May 2003.