Linear Algebra and its Applications - Estrada Lab · Linear Algebra and its Applications 488 (2016)...
15
Linear Algebra and its Applications 488 (2016) 249–263 Contents lists available at ScienceDirect Linear Algebra and its Applications www.elsevier.com/locate/laa When local and global clustering of networks diverge Ernesto Estrada Department of Mathematics & Statistics, University of Strathclyde, 26 Richmond Street, Glasgow G1 1HX, UK a r t i c l e i n f o a b s t r a c t Article history: Received 9 August 2015 Accepted 22 September 2015 Submitted by R. Brualdi MSC: 05C50 05C75 05C82 Keywords: Clustering coefficients Windmill graphs Graph spectra Real-world networks Collaboration graphs Citation networks The average Watts–Strogatz clustering coefficient and the net- work transitivity are widely used descriptors for characterizing the transitivity of relations in real-world graphs (networks). These indices are bounded between zero and one, with low values indicating poor transitivity and large ones indicating a high proportion of closed triads in the graphs. Here, we prove that these two indices diverge for windmill graphs when the number of nodes tends to infinity. We also give evidence that this divergence occurs in many real-world networks, especially in citation and collaboration graphs. We obtain analytic ex- pressions for the eigenvalues and eigenvectors of the adjacency and the Laplacian matrices of the windmill graphs. Using this information we show the main characteristics of two dynami- cal processes when taking place on windmill graphs: synchro- nization and epidemic spreading. Finally, we show that many of the structural and dynamical properties of a real-world cita- tion network are well reproduced by the appropriate windmill graph, showing the potential of these graphs as models for certain classes of real-world networks. © 2015 Elsevier Inc. All rights reserved. E-mail address: [email protected]. http://dx.doi.org/10.1016/j.laa.2015.09.048 0024-3795/© 2015 Elsevier Inc. All rights reserved.
Transcript of Linear Algebra and its Applications - Estrada Lab · Linear Algebra and its Applications 488 (2016)...
Linear Algebra and its Applications 488 (2016) 249–263
Contents lists available at ScienceDirect
Linear Algebra and its Applications
www.elsevier.com/locate/laa
When local and global clustering of networks
diverge
Ernesto EstradaDepartment of Mathematics & Statistics, University of Strathclyde, 26 Richmond Street, Glasgow G1 1HX, UK
a r t i c l e i n f o a b s t r a c t
Article history:Received 9 August 2015Accepted 22 September 2015Submitted by R. Brualdi
MSC:05C5005C7505C82
Keywords:Clustering coefficientsWindmill graphsGraph spectraReal-world networksCollaboration graphsCitation networks
The average Watts–Strogatz clustering coefficient and the net-work transitivity are widely used descriptors for characterizing the transitivity of relations in real-world graphs (networks). These indices are bounded between zero and one, with low values indicating poor transitivity and large ones indicating a high proportion of closed triads in the graphs. Here, we prove that these two indices diverge for windmill graphs when the number of nodes tends to infinity. We also give evidence that this divergence occurs in many real-world networks, especially in citation and collaboration graphs. We obtain analytic ex-pressions for the eigenvalues and eigenvectors of the adjacency and the Laplacian matrices of the windmill graphs. Using this information we show the main characteristics of two dynami-cal processes when taking place on windmill graphs: synchro-nization and epidemic spreading. Finally, we show that many of the structural and dynamical properties of a real-world cita-tion network are well reproduced by the appropriate windmill graph, showing the potential of these graphs as models for certain classes of real-world networks.
© 2015 Elsevier Inc. All rights reserved.
E-mail address: [email protected].
http://dx.doi.org/10.1016/j.laa.2015.09.0480024-3795/© 2015 Elsevier Inc. All rights reserved.
250 E. Estrada / Linear Algebra and its Applications 488 (2016) 249–263
1. Introduction
The development of network theory has demanded the definition of several mathe-matical indices that characterize certain aspects of the topology of these usually giant graphs [1–3]. In a seminal paper published in 1998 Watts and Strogatz [4] defined an index nowadays known as the Watts–Strogatz clustering coefficient of a given node in a graph. This index accounts for the ratio of the number of triangles in which the cor-responding node takes place to the number of potential triangles involving that node (see further for a formal definition). The clustering coefficient is bounded between zero and one. An index close to zero indicates that the relative number of transitive relations involving that node is low. A clustering coefficient close to one indicates that this node is involved in as many transitive relations as possible. When studying complex real-world networks it is very frequent to report the average Watts–Strogatz (WS) clustering co-efficient as a characterization of how globally clustered a network is. Bollobás [5] has remarked that: “this kind of ‘average of an average’ is often not very informative”.
An alternative way of characterizing the transitivity of a network is by taking the total number of triangles in the graph divided by the total number of triads existing in the graph. This index was put forward originally by Luce and Perry [6] and then rediscovered by Newman [7] in the context of complex networks. It is commonly referred to as the transitivity index of a (social) network (see for instance [8]). It is straightforwardto realize that the transitivity index is also bounded between zero and one, with small values indicating poor transitivity and values close to one indicating a large one.
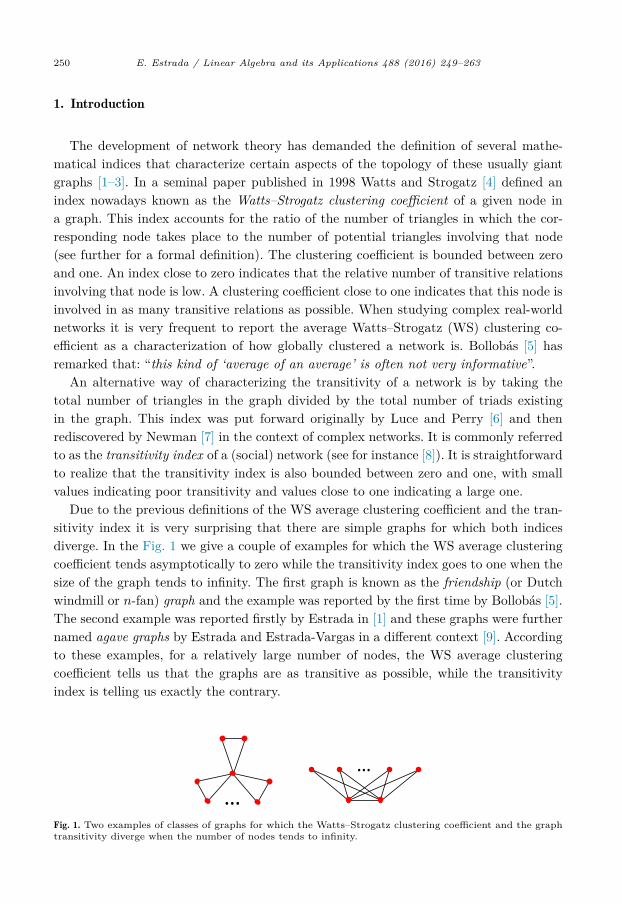
Due to the previous definitions of the WS average clustering coefficient and the tran-sitivity index it is very surprising that there are simple graphs for which both indices diverge. In the Fig. 1 we give a couple of examples for which the WS average clustering coefficient tends asymptotically to zero while the transitivity index goes to one when the size of the graph tends to infinity. The first graph is known as the friendship (or Dutch windmill or n-fan) graph and the example was reported by the first time by Bollobás [5]. The second example was reported firstly by Estrada in [1] and these graphs were further named agave graphs by Estrada and Estrada-Vargas in a different context [9]. According to these examples, for a relatively large number of nodes, the WS average clustering coefficient tells us that the graphs are as transitive as possible, while the transitivity index is telling us exactly the contrary.
Fig. 1. Two examples of classes of graphs for which the Watts–Strogatz clustering coefficient and the graph transitivity diverge when the number of nodes tends to infinity.
E. Estrada / Linear Algebra and its Applications 488 (2016) 249–263 251
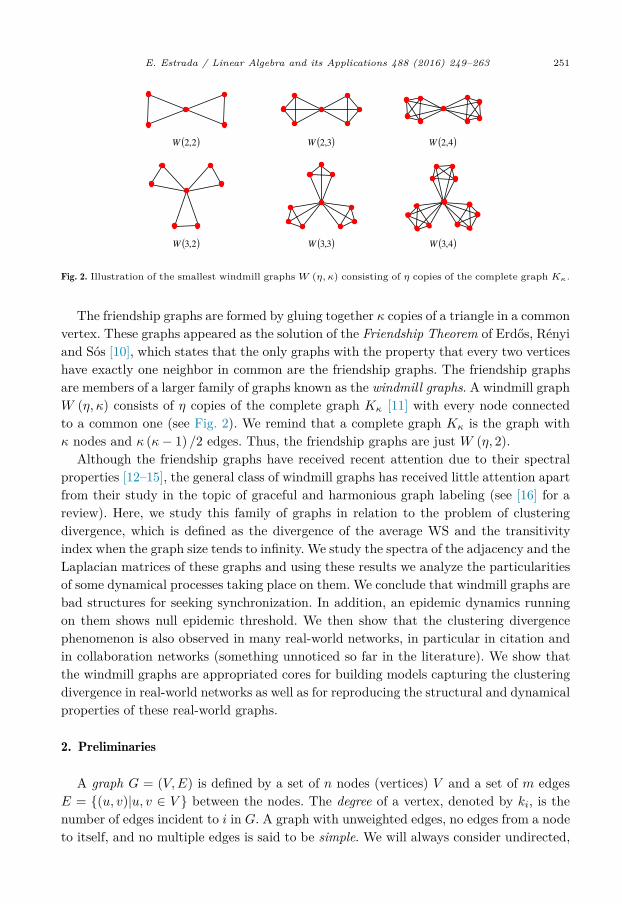
Fig. 2. Illustration of the smallest windmill graphs W (η, κ) consisting of η copies of the complete graph Kκ.
The friendship graphs are formed by gluing together κ copies of a triangle in a common vertex. These graphs appeared as the solution of the Friendship Theorem of Erdős, Rényi and Sós [10], which states that the only graphs with the property that every two vertices have exactly one neighbor in common are the friendship graphs. The friendship graphs are members of a larger family of graphs known as the windmill graphs. A windmill graph W (η, κ) consists of η copies of the complete graph Kκ [11] with every node connected to a common one (see Fig. 2). We remind that a complete graph Kκ is the graph with κ nodes and κ (κ− 1) /2 edges. Thus, the friendship graphs are just W (η, 2).
Although the friendship graphs have received recent attention due to their spectral properties [12–15], the general class of windmill graphs has received little attention apart from their study in the topic of graceful and harmonious graph labeling (see [16] for a review). Here, we study this family of graphs in relation to the problem of clustering divergence, which is defined as the divergence of the average WS and the transitivity index when the graph size tends to infinity. We study the spectra of the adjacency and the Laplacian matrices of these graphs and using these results we analyze the particularities of some dynamical processes taking place on them. We conclude that windmill graphs are bad structures for seeking synchronization. In addition, an epidemic dynamics running on them shows null epidemic threshold. We then show that the clustering divergence phenomenon is also observed in many real-world networks, in particular in citation and in collaboration networks (something unnoticed so far in the literature). We show that the windmill graphs are appropriated cores for building models capturing the clustering divergence in real-world networks as well as for reproducing the structural and dynamical properties of these real-world graphs.
2. Preliminaries
A graph G = (V, E) is defined by a set of n nodes (vertices) V and a set of m edges E = {(u, v)|u, v ∈ V } between the nodes. The degree of a vertex, denoted by ki, is the number of edges incident to i in G. A graph with unweighted edges, no edges from a node to itself, and no multiple edges is said to be simple. We will always consider undirected,

252 E. Estrada / Linear Algebra and its Applications 488 (2016) 249–263
simple, and connected networks. The so-called Watts–Strogatz clustering coefficient of a node i, which quantifies the degree of transitivity of local relations in a network is defined as [4]:
Ci = 2tiki(ki − 1) (1)
where ti is the number of triangles in which the node i takes place. Taking the mean of these values as i varies among all the nodes in G, one gets the average WS clustering coefficient of the network G:
C = 1n
n∑u=1
Cu. (2)
The so-called graph transitivity is defined as [7,8]
C = 3tP2
, (3)
where t is the total number of triangles and P2 =∑n
i=1 ki(ki − 1)/2.Let A = (auv)n×n be the adjacency matrix of the graph. We denote by λ1 > λ2 ≥
· · · ≥ λn the eigenvalues of A and by ψj,p the pth entry of the jth orthonormalized eigenvector �ψj associated with λj . For the whole spectrum of a given matrix M we use the following notation: Sp (M) = {λm} where λ is an eigenvalue and m its algebraic multiplicity.
The adjacency matrix of a windmill graph W (η, κ) can be written as
A (W (η, κ)) =
⎛⎜⎜⎜⎜⎜⎝
0 �1T �1T · · · �1T�1 A (Kκ) 0 · · · 0�1 0 A (Kκ) · · · 0...
......
. . ....
�1 0 0 · · · A (Kκ)
⎞⎟⎟⎟⎟⎟⎠ , (4)
where �1 is an all-ones column vector of length κ and A (Kκ) is the adjacency matrix of Kκ.
Let Δ be a diagonal matrix of the vertex degrees of the graph. Then, the Laplacian matrix of the graph is defined by: L = Δ −A. In the case of the windmill graphs it can be written as
L (W (η, κ)) =
⎛⎜⎜⎜⎜⎜⎝
ηκ −�1T −�1T · · · −�1T−�1 L (Kκ) + Iκ 0 · · · 0−�1 0 L (Kκ) + Iκ · · · 0...
......
. . ....
�
⎞⎟⎟⎟⎟⎟⎠ , (5)
−1 0 0 · · · L (Kκ) + Iκ

E. Estrada / Linear Algebra and its Applications 488 (2016) 249–263 253
where Iκ is the κ × κ identity matrix. We denote by μ1 ≥ μ2 ≥ · · · ≥ μn = 0 the eigenvalues of L. The eigenvalue μn−1 is known as the algebraic connectivity of the graph and the eigenvector associated to it is known as the Fiedler vector [17]. For reviews about spectral properties of graphs the reader is directed to the classic works [18,19].
3. Clustering of windmill graphs
We start here by proving that the average Watts–Strogatz coefficient and the transi-tivity index diverge when the number of nodes increases in a windmill graph.
Theorem 1. Let W (η, κ) be a windmill graph. Then, for a given value of κ the average Watts–Strogatz and the transitivity coefficients diverge when the number of cliques tends to infinity:
limη→∞
C̄ = 1, (6)
limη→∞
C = 0. (7)
Proof. First, we obtain an expression for the Watts–Strogatz clustering coefficient of windmill graphs. The Watts–Strogatz clustering coefficient of the central node in W (η, κ)is
Ci = κ− 1ηκ− 1 , (8)
and the rest of the nodes have Cj = 1. Thus, C̄ = (Ci + ηκCj) /n, which gives
C̄ = 1 − κ (η + 1)(ηκ + 1) (ηκ− 1) . (9)
Now we consider the transitivity index of a windmill graph W (η, κ). The total number of triangles in W (η, κ) is
t = 16ηκ
(κ2 − 1
). (10)
In order to obtain the number of 2-paths we use
P2 = 12ki (ki − 1) + ηκ
2 kj (kj − 1) (11)
in which ki = ηκ and kj = κ. Thus, after substitution we get
C = κ2 − 12 . (12)
κ + ηκ− κ− 1
254 E. Estrada / Linear Algebra and its Applications 488 (2016) 249–263
(a) (b)
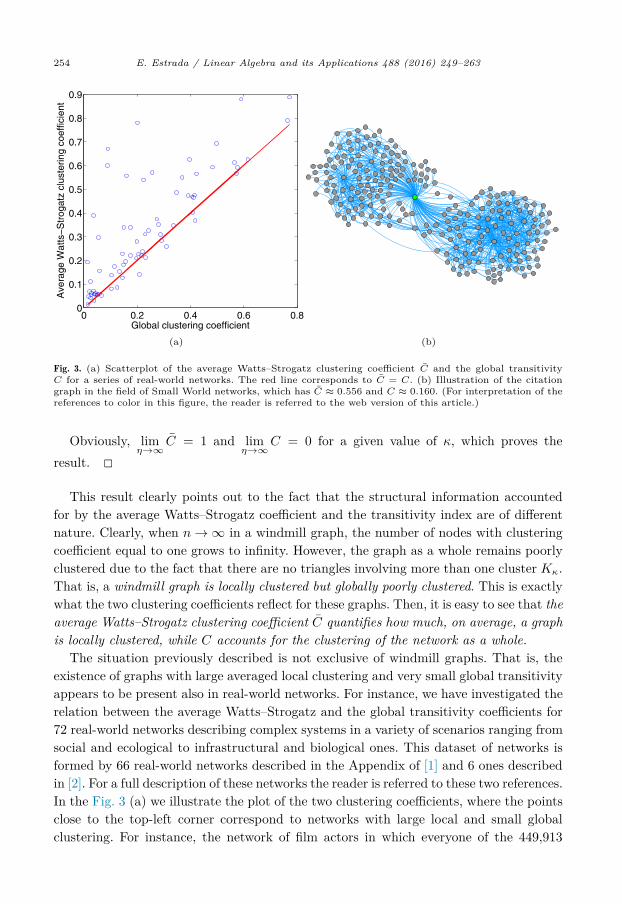
Fig. 3. (a) Scatterplot of the average Watts–Strogatz clustering coefficient C̄ and the global transitivity C for a series of real-world networks. The red line corresponds to C̄ = C. (b) Illustration of the citation graph in the field of Small World networks, which has C̄ ≈ 0.556 and C ≈ 0.160. (For interpretation of the references to color in this figure, the reader is referred to the web version of this article.)
Obviously, limη→∞
C̄ = 1 and limη→∞
C = 0 for a given value of κ, which proves the
result. �This result clearly points out to the fact that the structural information accounted
for by the average Watts–Strogatz coefficient and the transitivity index are of different nature. Clearly, when n → ∞ in a windmill graph, the number of nodes with clustering coefficient equal to one grows to infinity. However, the graph as a whole remains poorly clustered due to the fact that there are no triangles involving more than one cluster Kκ. That is, a windmill graph is locally clustered but globally poorly clustered. This is exactly what the two clustering coefficients reflect for these graphs. Then, it is easy to see that the average Watts–Strogatz clustering coefficient C̄ quantifies how much, on average, a graph is locally clustered, while C accounts for the clustering of the network as a whole.
The situation previously described is not exclusive of windmill graphs. That is, the existence of graphs with large averaged local clustering and very small global transitivity appears to be present also in real-world networks. For instance, we have investigated the relation between the average Watts–Strogatz and the global transitivity coefficients for 72 real-world networks describing complex systems in a variety of scenarios ranging from social and ecological to infrastructural and biological ones. This dataset of networks is formed by 66 real-world networks described in the Appendix of [1] and 6 ones described in [2]. For a full description of these networks the reader is referred to these two references. In the Fig. 3 (a) we illustrate the plot of the two clustering coefficients, where the points close to the top-left corner correspond to networks with large local and small global clustering. For instance, the network of film actors in which everyone of the 449,913
E. Estrada / Linear Algebra and its Applications 488 (2016) 249–263 255
nodes represents an actor and each of the 25,516,482 edges represent a pair of actors that have acted in the same film has C̄ ≈ 0.78 and C ≈ 0.20 [2]. Similarly, the network of collaboration among scientists working in the area of biology, which has 1,520,251 nodes and 11,803,064 edges, displays similar characteristics with C̄ ≈ 0.60 and C ≈ 0.088 [2]. In the Fig. 3 (b) we illustrate the citation network of papers citing Milgram’s 1967 Psychology Today paper or use “Small World” in the title (see [1] for details). The nodes represent papers and two nodes are connected if one paper cites the other (we consider the undirected version of this network only). It consists of 233 papers and 994 citations. This network has C̄ ≈ 0.556 and C ≈ 0.160. The node marked in a different color in the Fig. 3 (b) corresponds to Milgram paper and it is clear that at least two big groups of nodes exist in the network (see further analysis).
4. Spectral analysis of regular windmill graphs
Due to the importance that spectral properties of graphs have on a variety of structural and dynamical properties of graphs we embark here in the analysis of the spectra of windmill graphs. We start by analyzing the spectra of the adjacency matrix of these graphs which is reported using the notation fixed in the previous section.
Theorem 2. The spectrum of the adjacency matrix of a windmill graph W (η, κ) is
Sp (A (W (η, κ))) =
⎧⎨⎩⎛⎝κ− 1
2 ±
√(κ− 1
2
)2
+ ηκ
⎞⎠ , (κ− 1)η−1
,−1η(κ−1)
⎫⎬⎭ . (13)
Proof. Let us consider the vector �γ =[x,
1 − x
ηκ, · · · , 1 − x
ηκ
]Tfor some x < 1.
Then,
A (W (η, κ))
⎛⎜⎜⎜⎜⎜⎜⎝
x1 − x
ηκ...
1 − x
ηκ
⎞⎟⎟⎟⎟⎟⎟⎠
=
⎛⎜⎜⎜⎜⎜⎜⎜⎝
1 − x
x + (κ− 1)(
1 − x
ηκ
)...
x + (κ− 1)(
1 − x
ηκ
)
⎞⎟⎟⎟⎟⎟⎟⎟⎠
. (14)
By equalizing the right-hand side of (2) to λ�γ we obtain
1 − x = λx, (15)
x + (κ− 1)(
1 − x
ηκ
)= λ
(1 − x
ηκ
), (16)
which has solution if
λ2 − λ (κ− 1) − ηκ = 0. (17)

256 E. Estrada / Linear Algebra and its Applications 488 (2016) 249–263
Thus,
λ = κ− 12 ±
√(κ− 1
2
)2
+ ηκ. (18)
Thus, the two values of (18) correspond to two eigenvalues of A (W (η, κ)) both with multiplicity 1.
Let �ϑ = [ 0 α11 · · · α1κα21 · · · α2κ
· · · αη1 · · · αηκ]T be a vector such
that αkj= αk for all k, α1 + α2 + · · · + αη = 0, and αk �= 0 for some k. Then, it is easy
to check that
A�ϑ = (κ− 1) �ϑ. (19)
There are η − 1 orthogonal vectors fulfilling the conditions that �ϑ has. Thus, κ − 1 is an eigenvalue of A (W (η, κ)) with multiplicity η − 1.
Now, let �ν = [ 0 α11 · · · α1κα21 · · · α2κ
· · · αη1 · · · αηκ]T be a vector
such that ∑κ
j=1 αkj= 0 for all k, and αk �= 0 for some k. Then,
A�ν = −�ν. (20)
There are η (κ− 1) orthogonal vectors �ν and so −1 is an eigenvalue of A (W (η, κ))with multiplicity η (κ− 1). So far we have found (η − 1)+η (κ− 1)+2 eigenvalues, which is the total number of eigenvalues existing for A (W (η, κ)), i.e., n = ηκ +1, which proves the result. �Remarks.
• The characteristic polynomial of A (W (η, κ)) is
P (λ) = (λ + 1)η(κ−1) (λ− κ + 1)η−1 (λ2 − (κ− 1)λ− (n− 1)
). (21)
• The number of triangles in W (η, κ) is given by
t = 16
n∑j=1
λ3j = 1
6ηκ(κ2 − 1
). (22)
• The eigenvector centrality (see for instance [1,3] for definition and uses of centrality measures) of a windmill graph W (η, κ) is a vector proportional to:
�γ =[x,
1 − x
ηκ, · · · , 1 − x
ηκ
]T. (23)

E. Estrada / Linear Algebra and its Applications 488 (2016) 249–263 257
We now turn our analysis to the spectrum of the Laplacian matrix of windmill graphs. The Laplacian matrix, which is the discrete analogous of the Laplace–Bertrami operator, plays a fundamental role in the analysis of dynamical processes on networks.
Theorem 3. The Laplacian spectrum of a windmill graph W (η, κ) is
Sp (L (W (η, κ))) ={
(ηκ + 1) , (κ + 1)η(κ−1), 1η−1, 0
}. (24)
Proof. The fact that the Laplacian matrix has a zero eigenvalue is well-known and easy to prove—just post-multiply L by the vector �1—and because the windmill graph is connected the multiplicity of this eigenvalue is one. Now, let us consider the vector �γ = [ ηκy, −y, · · · , −y ]T for some y > 0. Then,
L (W (η, κ))
⎛⎜⎜⎜⎝
ηκy
−y...
−y
⎞⎟⎟⎟⎠ =
⎛⎜⎜⎜⎝
((ηκ)2 + ηκ
)y
−y (ηκ + 1)...
−y (ηκ + 1)
⎞⎟⎟⎟⎠ = (ηκ + 1)
⎛⎜⎜⎜⎝
ηκy
−y...
−y
⎞⎟⎟⎟⎠ , (25)
proving that n = ηκ + 1 is an eigenvalue of L (W (η, κ)) with multiplicity one.Using similar techniques as for the Theorem 2 we have the following. Let �ϑ =
[ 0 α11 · · · α1κα21 · · · α2κ
· · · αη1 · · · αηκ]T be a vector such that αkj
=αk for all k, α1 + α2 + · · · + αη = 0, and αk �= 0 for some k. Then, it is easy to check that
L�ϑ = �ϑ. (26)
Because, there are η − 1 orthogonal �ϑ vectors, one is an eigenvalue of L (W (η, κ))with multiplicity η − 1.
Now, let �ν = [ 0 α11 · · · α1κα21 · · · α2κ
· · · αη1 · · · αηκ]T be a vector
such that ∑κ
j=1 αkj= 0 for all k, and αk �= 0 for some k. Then,
L�ν = (κ + 1)�ν. (27)
There are η (κ− 1) orthogonal vectors �ν and so κ + 1 is an eigenvalue of L (W (η, κ))with multiplicity η (κ− 1), which finally proves the result. �Remarks.
• The algebraic connectivity of a windmill graph W (η, κ) is 1.• The Fiedler vector of a windmill graph W (η, κ) is a vector proportional to:
�ϑ = [ 0 α11 · · · α1κα21 · · · α2κ
· · · αη1 · · · αηκ]T , (28)
such that αkj= αk for all k, α1 + α2 + · · · + αη = 0, and αk �= 0 for some k.

258 E. Estrada / Linear Algebra and its Applications 488 (2016) 249–263
5. Dynamical processes on windmill graphs
There are many different dynamical processes that can be studied on the nodes and edges of graphs. The reader is referred to [20,21] for a detailed account of the topic. One of the most important dynamical processes studied on graphs is the epidemic dynamics. The spreading of an infectious disease on networks can be modeled representing individuals as nodes and the contacts between them as edges. In this context individuals are categorized in different compartments according to their health state [22]: i.e., susceptible (S) for individuals that can be infected by the disease, infected (I) for infectious individuals that can spread the pathogen or recovered (R) for individuals that already passed the disease and are immune to it. Some of the classical models used in this context are the so-called SIS and SIR [22,23]. The spreading of a disease is driven in these models by the ratio among the probability β for a susceptible individual to catch the disease once in contact with an infected one through a link of the network, and the recovery rate ρ that characterizes the rate at which an infected individual recovers from the disease. Depending on its infectious power two distinct phases are possible: an absorbing one where the spreading is not efficient enough to reach a large fraction of the system and the disease is absorbed and an active phase where the epidemics reaches a macroscopic fraction of the network. The transition from the absorbing to the active phase strictly resembles a non-equilibrium second order phase transition in statistical physics [24]. The
critical value of this transition (
βρ
)c
= τ is defined as the epidemic threshold, which in
the case of an epidemic spreading on a graph has been shown to be [25–27]:
τ = 1λ1
. (29)
In the case of a windmill graph the epidemic dynamics can be an appropriate tool to understand for instance the propagation of some ideas through the citation of papers which become viral very quickly. In this case it is straightforward to realize that the epidemic threshold is
τ = 2
κ− 1 +√
(κ− 1)2 + 4ηκ. (30)
The immediate consequence of this relation is that for a given value of κ the epidemic threshold vanishes as η → ∞. In other words, in a sufficiently large windmill graph there is no resistance to the propagation of an epidemic. An idea can become viral in the whole network almost without any resistance. Even worse, when κ is sufficiently large the epidemic threshold is almost null even for very small values of η. This situation resembles the one that has been largely studied for random networks with power-law degree distributions. In those models, like the Barabási–Albert one, it has been proved analytically that the epidemic threshold vanishes for very large graphs [28]. The main
E. Estrada / Linear Algebra and its Applications 488 (2016) 249–263 259
cause of this effect in the so-called scale-free graphs is the existence of an uneven degree distribution with a few hubs concentrating a large number of connections. In the windmill graphs the situation is quite similar due to the existence of a node which is connected to everyone else in the network. Thus, once this node is infected it immediately can infect the rest of the network in just one step.
As another important example of a dynamical process on graph we consider now the synchronization process on networks [29,30]. Network synchronization finds many im-portant applications in the natural and physical worlds, such as in human learning [31]and in wireless sensor networks [32]. In the particular case of windmill graphs this pro-cess is appropriate to analyze how easily a group of collaborators forming such kind of structures reaches consensus about a given discussion topic.
A large class of dynamic networks have a bounded synchronized region specified by
cμn−1/μ1 ∈ (α2, α3) ⊂ (0,∞), (31)
where constants α2, α3 depend only on the node dynamics, and a bigger eigenratio μn−1/μ1 implies a better network synchronizability, which likewise means a smaller cou-pling strength is needed [33]. Thus, the following sync-index is adopted:
Q = μn−1
μ1, (32)
which for the case of windmill graphs becomes
Q = 1ηκ + 1 = 1
n. (33)
As stated before, for good network synchronizability it is necessary that the sync-index is as large as possible. Then, it is easy to see that because when n → ∞ the eigenratio Q → 0, which means that the windmill graphs are very bad synchronizers. In other words, although synchronization among all the nodes can be reached relatively easy, the stability of the sync state is very low.
6. Windmill-like structure in real-world networks
In a previous section we have seen that there are real-world networks for which the local and the global clustering coefficients diverge. Clearly, the windmill graphs can be used as a model to describe this characteristic of the previously mentioned networks. Windmill-like structures are plausible in certain kinds of real-world situations in which there are many groups of tightly connected nodes, all of them tied to a central node. This could be the case of citations and collaboration networks. In the first case, a seminal paper could be cited by many different groups working in related but different fields. For instance, the seminal papers of Milgram in 1967 [34], Watts and Strogatz in 1998 [4] and

260 E. Estrada / Linear Algebra and its Applications 488 (2016) 249–263
Table 1Topological properties of the real-world network representing a citation network in the topic of “Small World Networks” and four different models. The models included are the windmill graph W (33, 7), Erdős–Rényi (ER) GER(233, 994), Barabási–Albert (BA) GBA(233, 4), Watts–Strogatz (WS) GBA(233, 8, 0.05) and random geometric graph (RRG) GRRG(233, 0.115).
SmallW W (33, 7) ER BA WS RGGn 233 232 233 233 233 233m 994 924 994 870 932 986
C̄ 0.556 0.996 0.038 0.127 0.565 0.617C 0.160 0.176 0.037 0.065 0.559 0.592C̄/C 3.475 5.659 1.027 1.954 1.011 1.042l̄ 2.371 1.966 2.759 2.637 4.353 6.710D 4 2 5 4 8 16kmax 147 231 17 84 10 18Cl 7 8 3 4 5 9λ1 20.96 18.49 9.57 13.842 8.070 12.736Q 0.0043 0.0043 0.0682 0.0230 0.0154 0.0029
Barabási and Albert in 1999 [35] are frequently cited by groups working in mathemat-ics, physics, social sciences, computer sciences and neurosciences (among others). These groups frequently cite each other’s papers within their fields, but hardly cite other pa-pers in areas beyond their close specialty. A similar situation happens with collaboration networks as well as in other real-world scenarios. Let us just mention a couple of ex-amples from the Stanford Large Network Dataset Collection (SNAP) [36]: the networks representing autonomous system (AS) peering information inferred from “Oregon route-views”, “Looking glass data”, and “Routing registry”, all combined, of March 21th, 2001 (dataset Oregon-2) has C̄ ≈ 0.501 and C≈ 0.0385. The second example is the Enron email communication network which has C̄ ≈ 0.497 and C≈ 0.0302 (see [2] for details about the previously mentioned networks).
Taking into account the previous considerations we embarked now in a comparison of a real-world network with the windmill graph by considering a series of topological parameters. We consider here both clustering coefficients C̄ and C, the maximum degree kmax , the size of the largest clique (clique number) Cl, the number of cliques of size Cl in the graph NCl, the Perron–Frobenius eigenvalue of the adjacency matrix λ1 and the eigenratio Q. We also study four models frequently used to describe properties of networks. They are the uniform random graphs of Erdős–Rényi (ER) GER(n, m) [37], the Barabási–Albert (BA) GBA(n, mc) [35], the Watts–Strogatz small-world model (WS) GWS(n, mc) [4], and the random geometric graph (RRG) GRRG(n, r) [38]. The main characteristics of these four models are described in [1].
In Table 1 we illustrate the results for the graph parameters and models described before. It is clear that there are several windmill graphs W (η, κ) which may be used to describe the real-world network under consideration. We selected the windmill graph having the number of edges closer to the one of the real-world network. That is, the number of edges in a windmill graph is
m = ηκ (κ + 1) . (34)
2
E. Estrada / Linear Algebra and its Applications 488 (2016) 249–263 261
The graph which better reproduces the number of edges in the real-world network corresponds to the windmill graph W (33, 7), which has 924 edges out of 994 that the citation graph has. As can be seen in Table 1 this graph reproduces very well many of the topological properties of the Small World citation network. It shows a large Watts–Strogatz clustering coefficient and small global transitivity as the real-world network. The highest degree in both the windmill graph and the real-world network are very large in comparison with the number of nodes in these graphs. However, the most interesting results come from the analysis of the clique number and the spectral properties of these graphs. First, the windmill graph is formed by 33 cliques of size 7. That is, the largestclique in this graph is of size 8. The largest clique in the real-world network is of size 7 and there are 39 of them. We should notice that these cliques in the real-world network have overlapping, i.e., there are nodes in more than one clique, which does not occur in the windmill graph. The Perron–Frobenius eigenvalue of the adjacency matrix of the windmill graph is 18.49, which is very close to that of the citation network. Finally, the eigenratio of the windmill, which is just n−1, is identical to that of the real-world network. An inspection of the four other models used for comparison show that none of them captures the topological specificity of the real-world network.
7. Conclusions
The main result of this work is to show that the average WS clustering coefficient and the network transitivity can diverge for certain classes of graphs. The windmill graphs are examples of graphs in which this phenomenon occurs due to the fact that there are many cliques connected to a single node in which no pair of nodes from different cliques are connected. It is important to realize that this clustering divergence also occurs in real-world networks. In particular, it seems to be very frequent in citation and collaboration networks. In citation networks, for instance, there could be a central paper which is highly cited by many other papers. These other papers form clusters, mainly inside a particular discipline, whose authors cite each other. However, the papers in one cluster (discipline) hardly cite a paper in another discipline. Then, it is expected that as these networks grow, the divergence between the clustering coefficients become more marked, resembling more and more the situation taken place in windmill graphs. We have characterized here the spectra of the adjacency and the Laplacian matrices of windmill graphs, which are fundamental for understanding their structure and dynamical properties. We have also shown that many of the structural and dynamical properties of a citation network displaying clustering divergence are reproduced by the appropriate windmill graph. Thus these graphs may represent the core for developing theoretical models of certain kinds of real-life networks.
Acknowledgement
The author thanks the Royal Society of London for a Wolfson Research Merit Award.

262 E. Estrada / Linear Algebra and its Applications 488 (2016) 249–263
References
[1] E. Estrada, The Structure of Complex Networks. Theory and Applications, Oxford University Press, 2011.
[2] M.E.J. Newman, The structure and function of complex networks, SIAM Rev. 45 (2003) 167–256.[3] L.F. Costa, O.N. Oliveira Jr, G. Travieso, F.A. Rodrigues, P.R. Villas Boas, L. Antiqueira,
M.P. Viana, L.E. Correa Rocha, Analyzing and modeling real-world phenomena with complex net-works: a survey of applications, Adv. Phys. 60 (2011) 329–412.
[4] D.J. Watts, S.H. Strogatz, Collective dynamics of ‘small-world’ networks, Nature 393 (1998) 440–442.
[5] B. Bollobás, Mathematical results on scale-free random graphs, in: S. Bornholdt, H.G. Schuster (Eds.), Handbook of Graph and Networks: From the Genome to the Internet, Wiley–VCH, Wein-heim, 2003, pp. 1–32.
[6] R.D. Luce, A.D. Perry, A method of matrix analysis of group structure, Psychometrika 14 (1949) 95–116.
[7] M.E.J. Newman, The structure of scientific collaboration networks, Proc. Natl. Acad. Sci. USA 98 (2001) 404–409.
[8] S. Wasserman, K. Faust, Social Network Analysis, Cambridge University Press, Cambridge, 1994.[9] E. Estrada, E. Estrada-Vargas, Distance-sum heterogeneity in graphs and complex networks, Appl.
Math. Comput. 218 (2012) 10393–10405.[10] P. Erdős, A. Rényi, V. Sós, On a problem of graph theory, Studia Sci. Math. Hungar. 1 (1966)
215–235.[11] J.A. Gallian, A survey: recent results, conjectures, and open problems in labeling graphs, J. Graph
Theory 13 (1989) 491–504.[12] J.F. Wang, F. Belardo, Q.X. Huang, B. Borovicanin, On the largest Q-eigenvalues of graphs, Discrete
Math. 310 (2010) 2858–2866.[13] J.F. Wang, H. Zhao, Q. Huang, Spectral characterization of multicone graphs, Czechoslovak Math. J.
62 (2012) 117–126.[14] K.C. Das, Proof of conjectures on adjacency eigenvalues of graphs, Discrete Math. 313 (2013) 1925.[15] A. Abdollahi, S. Janbaz, M.R. Obudi, Graphs cospectral with a friendship graph or its complement,
arXiv:1307.5411v1.[16] J.A. Gallian, Dynamic survey DS6: graph labelling, Electron. J. Combin. DS6 (2007) 1–58.[17] M. Fiedler, Algebraic connectivity of graphs, Czechoslovak Math. J. 23 (1973) 298–305.[18] D.M. Cvetković, M. Doob, H. Sachs, Spectra of Graphs: Theory and Application, Academic Press,
1980.[19] D.M. Cvetković, P. Rowlinson, S. Simic, Eigenspaces of Graphs, Cambridge University Press, 1997.[20] A. Barrat, M. Barthelemy, A. Vespignani, Dynamical Processes on Complex Networks, Cambridge
University Press, 2008.[21] E. Estrada, Introduction to complex networks: structure and dynamics, in: Evolutionary Equations
with Applications in Natural Sciences, Springer International Publishing, 2015, pp. 93–131.[22] N.T.J. Bailey, The Mathematical Theory of Infectious Diseases and Its Applications, Hafner Press,
1975.[23] R.M. Anderson, R.M. May, Infectious Diseases in Humans, Oxford University Press, 1992.[24] J. Marro, R. Dickman, Nonequilibrium Phase Transitions in Lattice Models, Cambridge University
Press, 1999.[25] D. Chakrabarti, Y. Wang, C. Wang, J. Leskovec, C. Faloutsos, ACM Trans. Inf. Syst. Sec. 10 (2008)
1.[26] S. Gómez, A. Arenas, J. Borge-Holthoefer, S. Meloni, Y. Moreno, Europhys. Lett. 89 (2010) 38009.[27] P. Van Mieghem, J. Omic, R.E. Kooij, IEEE/ACM Trans. Netw. 17 (2009) 1.[28] M. Boguñá, R. Pastor-Satorras, A. Vespignani, Phys. Rev. Lett. 90 (2003) 028701.[29] G. Chen, Z. Duan, Network synchronizability analysis: a graph-theoretic approach, Chaos 18 (2008)
037102.[30] G. Chen, X.F. Wang, X. Li, Fundamentals of Complex Networks: Models, Structures and Dynamics,
Wiley, 2015.[31] A. Trafton, Synchronized brain waves enable rapid learning, MIT News, online: http://newsoffice.
mit.edu/2014/synchronized-brain-waves-enable-rapid-learning-0612, June 2014.[32] Y.-C. Wu, Q. Chaudhari, E. Serpedin, Clock synchronization of sensor networks, IEEE Signal Proc.
Mag. 28 (2011) 124–138.
E. Estrada / Linear Algebra and its Applications 488 (2016) 249–263 263
[33] M. Barahona, L.M. Pecora, Synchronization in small-world systems, Phys. Rev. Lett. 89 (2002) 054101.
[34] S. Milgram, The small world problem, Psychology Today 2 (1967) 60–67.[35] A.-L. Barabási, R. Albert, Emergence of scaling in random networks, Science 286 (1999) 509–512.[36] J. Leskovec, Stanford large network dataset collection, 2011.[37] P. Erdős, A. Rényi, On the evolution of random graphs, Pub. Math. Inst. Hungar. Acad. Sci. 5
(1960) 17–60.[38] M. Penrose, Random Geometric Graphs, Oxford University Press, 2003.