Lindab Group presentation Q2 2011 · l i n d a b | g r o u p p r e s e n t a t i o n Lindab Group...
24
lindab | group presentation Lindab Group presentation Q2 2011 David Brodetsky, CEO Per Nilsson, CFO
Transcript of Lindab Group presentation Q2 2011 · l i n d a b | g r o u p p r e s e n t a t i o n Lindab Group...

lindab | group presentation
Lindab Group presentation Q2 2011
David Brodetsky, CEOPer Nilsson, CFO

l i n d a b | g r o u p p r e s e n t a t i o n
Agenda
Highlights
Financial– Group– Business Areas
Business highlights by BA
Trends and outlook
Q & A
2

l i n d a b | g r o u p p r e s e n t a t i o n
Lindab GroupQ2 Highlights
Sales & MarketsSales increased 8%*Strongest region CEE/CIS (+17%*), due to non-residential. Residential weak. All Nordic markets improved (+8%*)Mixed picture in West European markets (+5%*)
Profit & loss4th successive qtr of sales growth. 5th successive qtr of EBIT improvementMargin was affected by price pressure and strategy rollout costsEBIT improved from SEK 110 m (6.4%) to SEK 135 m (7.7%) due to sales increase
CashOperational Cash flow very good at SEK 217 m (SEK 67 m)
3
*adjusted for structure and currency compared to Q2 2010

l i n d a b | g r o u p p r e s e n t a t i o n
Lindab GroupProfit & Loss Q2 2011 - Group
Sales growth 2%
Structure 0%
Currency effect -6%
Organic 8%
EBIT improvement mainly due to increased volume
EBIT margin affected negatively by price pressure
Higher cost due to roll out of strategy linked activities
4
*)Q2 2010 EBIT excludes one time cost of SEK -21 m, net profit not adjusted.
SEK m Q2 2011 Q2 2010
Sales 1 755 1 715EBIT* 135 110EBIT* % 7.7% 6.4%Fin net -39 -42Tax -37 -20Net profit 60 27

l i n d a b | g r o u p p r e s e n t a t i o n
Lindab GroupProfit & Loss Jan - Jun 2011 - Group
Sales growth 6%
Structure 1%
Currency effect -7%
Organic 12%
EBIT improvement due to increased volume
5
*) H1 2011EBIT excludes one time cost of SEK -17 m, net profit not adjusted. H1 2010 EBIT excluding one off item of SEK 54 m. Net profit not adjusted.
SEK m Jan - Jun2011
Jan – Jun2010
Sales 3 132 2 949EBIT* 128 60EBIT* % 4.1% 2.0%Fin net -76 -82Tax -27 -33Net profit 8 -1

l i n d a b | g r o u p p r e s e n t a t i o n
6
Lindab GroupQuarterly operating profit (EBIT) SEK m
85
235
365283
185
330
424376
207
396 458
218
2597
145
34
-50
110
212
75
-7
135
-300030060090012001500
-1000
100200300400500
Q1 Q2 Q3 Q4 Q1 Q2 Q3 Q4 Q1 Q2 Q3 Q4 Q1 Q2 Q3 Q4 Q1 Q2 Q3 Q4 Q1 Q2
2006 2007 2008 2009 2010 2011
QuarterRolling 12 month
Quarterly LTM
Seasonal impact – Q1 lowest result, Q3 highest result
EBIT LTM SEK 415 m, EBIT margin 6.2%
Note. figures excl. one time items
l i n d a b | g r o u p p r e s e n t a t i o n
7
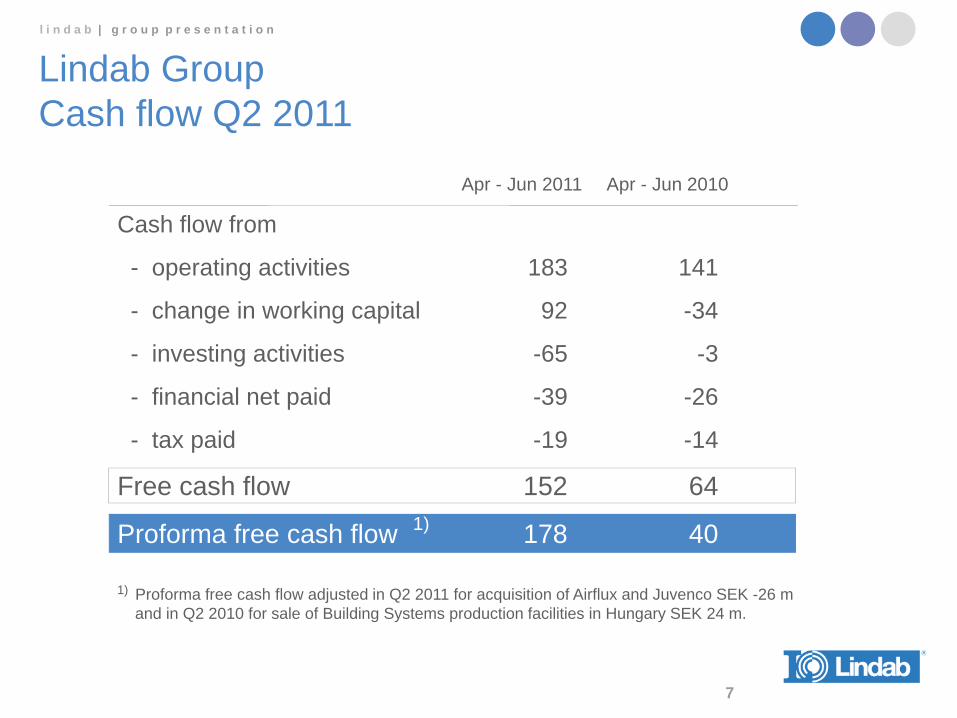
Lindab GroupCash flow Q2 2011
Apr - Jun 2011 Apr - Jun 2010
Cash flow from
- operating activities 183 141
- change in working capital 92 -34
- investing activities -65 -3
- financial net paid -39 -26
- tax paid -19 -14
Free cash flow 152 64
Proforma free cash flow 178 401)
1) Proforma free cash flow adjusted in Q2 2011 for acquisition of Airflux and Juvenco SEK -26 mand in Q2 2010 for sale of Building Systems production facilities in Hungary SEK 24 m.
l i n d a b | g r o u p p r e s e n t a t i o n
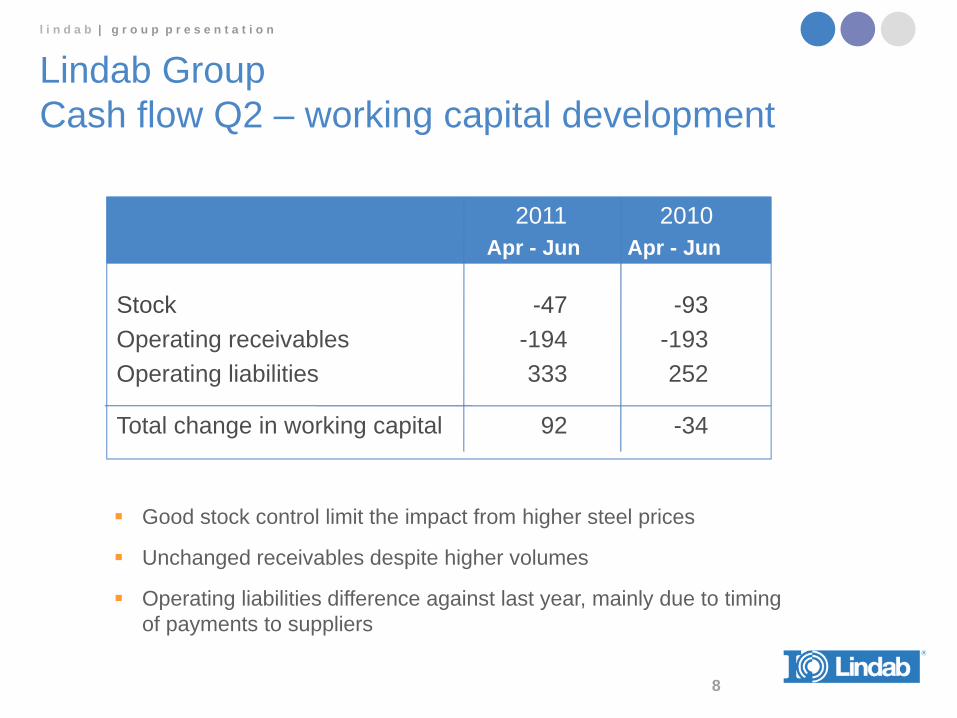
2011 2010 Apr - Jun Apr - Jun
Stock -47 -93Operating receivables -194 -193Operating liabilities 333 252
Total change in working capital 92 -34
Lindab GroupCash flow Q2 – working capital development
8
Good stock control limit the impact from higher steel prices
Unchanged receivables despite higher volumes
Operating liabilities difference against last year, mainly due to timing of payments to suppliers

l i n d a b | g r o u p p r e s e n t a t i o n
9
Lindab GroupCash flow trend
Operating cash flow, SEK m
LTM cash flow from operating activities amounted to SEK 474 m
-600-400-2000200400600800100012001400
-300-200-100
0100200300400500600700
Q1 Q2 Q3 Q4 Q1 Q2 Q3 Q4 Q1 Q2 Q3 Q4 Q1 Q2 Q3 Q4 Q1 Q2 Q3 Q4 Q1 Q2 Q3 Q4 Q1 Q2 Q3 Q4 Q1 Q2
2004 2005 2006 2007 2008 2009 2010 2011
QuarterRolling 12 month

l i n d a b | g r o u p p r e s e n t a t i o n
Business Areas
10

l i n d a b | g r o u p p r e s e n t a t i o n
BA VentilationProfit & Loss Q2 2011
Sales growth -2%
Structure 0%
Currency effect -5%
Organic 3%
Organic sales growth in all regions
EBIT affected by start up costs of new Czech plant
Improved EBIT due to sales growth
11
*) excluding one time cost of SEK 11m in Q2 2010
SEK m Q2 2011 Q2 2010
Sales 896 914EBIT* 62 59EBIT* % 6.9 6.5

l i n d a b | g r o u p p r e s e n t a t i o n
BA Building ComponentsProfit & Loss Q2 2011
Sales growth 2%
Structure 0%
Currency effect -4%
Organic 6%
Strong growth in Nordic
Price pressure affected margins
Improved EBIT due to sales growth
12
SEK m Q2 2011 Q2 2010
Sales 618 607EBIT 75 70EBIT % 12.1 11.5

l i n d a b | g r o u p p r e s e n t a t i o n
BA Building SystemsProfit & Loss Q2 2011
Sales growth 24%
Structure 0%
Currency effect -11%
Organic 35%
Strong growth in all main markets, particularly in Russia
Improved EBIT due to sales growth
13
*) excluding one offs of SEK -10 m in Q2 2010
SEK m Q2 2011 Q2 2010
Sales 241 194EBIT 9 -3EBIT % 3.7 -1.5

l i n d a b | g r o u p p r e s e n t a t i o n
Business highlights by BA
14

l i n d a b | g r o u p p r e s e n t a t i o n
VentilationDistribution
– Acquisition of Airflux, Belgium innovative concept of “self-service stores”
– Acquisition of Juvenco, Danish distributor, specialised in ventilation fans
– New branch opened in Bordeaux
Successful launch of LindQST (Lindab Quick Selection Tool) – a web tool that makes the selection of our indoor climate products quick and simple.
Improvement actions:– Divestment of small non-core business, Benone
(Swiss installation company) in July– New Prague plant on track - Danish Comfort
production moved by end Q2
15
Presentatör
Presentationsanteckningar

l i n d a b | g r o u p p r e s e n t a t i o n
Building Components
Focus Residential:– New ”click” standing seam roofing product,
which simplifies installation, well suited for residential housing. Launched in 8 markets.
Steel benefits– Growing trend to use steel studs in both
external walls and partition walls – good growth in Nordic region
2 major orders in CEE/CIS:– Largest Russian BC order to date
~ SEK 4 m, for roof covering– ~ SEK 5 m order for landmark building, Cluj
Arena in Romania for roofing and walls
16
l i n d a b | g r o u p p r e s e n t a t i o n
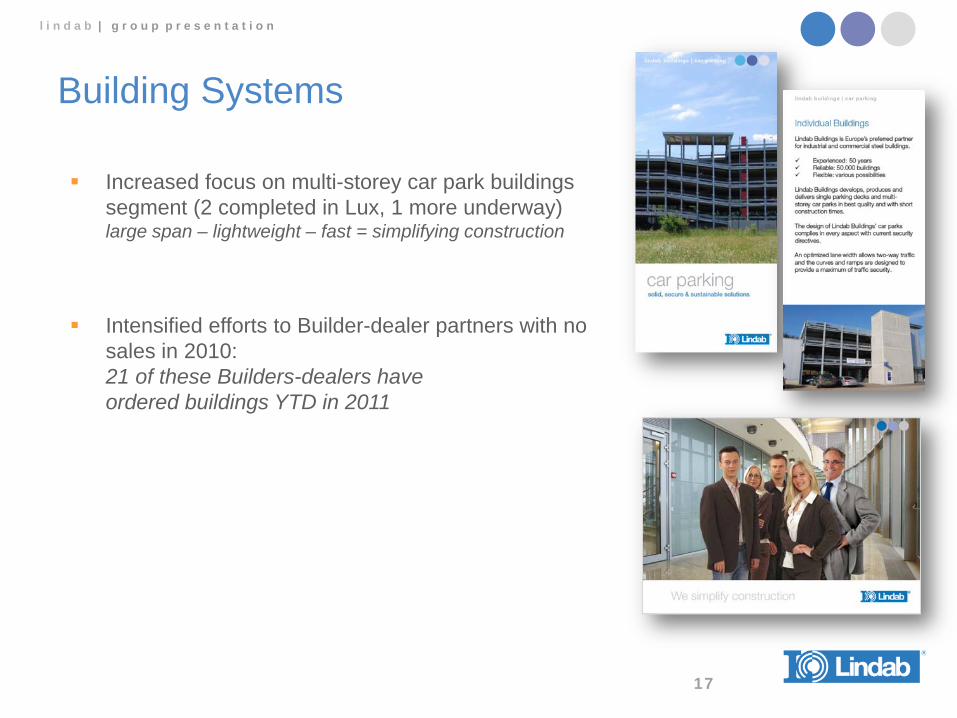
Building Systems
Increased focus on multi-storey car park buildings segment (2 completed in Lux, 1 more underway)large span – lightweight – fast = simplifying construction
Intensified efforts to Builder-dealer partners with no sales in 2010: 21 of these Builders-dealers have ordered buildings YTD in 2011
17

l i n d a b | g r o u p p r e s e n t a t i o n
Trends and outlook
18

l i n d a b | g r o u p p r e s e n t a t i o n
Lindab GroupSteel (Hot dipped galvanized spot prices)
19
Spot prices reduced in Q2
0100200300400500600700800900
Oct 10 Nov 10 Dec 10 Jan 11 Feb 11 March11 April 11 May 11 June 11
Source: average spot prices reported by SBB & CRU
€

l i n d a b | g r o u p p r e s e n t a t i o n
Euroconstruct update June 2011 - Non Residential
20
UK downgrade pushes back overall recovery
NB: Percentages are Euroconstruct unadjusted forecasts for the 19 Euroconstruct countries
Report date 2012 growth 2013 growthJune 2011 0.2% 2.5%December 2010 1.0% 2.0%
Main reason for Euroconstruct’s downward revision compared to the December report is outlook in UK.
Also, PIIGS and Nordic reduced (Nordic reduced in % because of a higher than expected pace of growth in 2011)

l i n d a b | g r o u p p r e s e n t a t i o n
Euroconstruct update June 2011 - Residential
21
Austerity packages reduce forecast growth
NB: Percentages are Euroconstruct unadjusted forecasts for the 19 Euroconstruct countries
Report date 2012 growth 2013 growthJune 2011 2.6% 3.0%December 2010 3.1% 3.5%
Euroconstruct’s downward revisions are mainly due to tough austerity packages in PIIGS & CEE.

l i n d a b | g r o u p p r e s e n t a t i o n
Euroconstruct update adjusted for Lindab’s mix*
An improvement for 2011 (Nordic markets impact)Reduced but accelerating growth rates for both 2012 and 2013
Slightly more cautious outlook than their 12/2010 report
0,0%0,5%1,0%1,5%2,0%2,5%3,0%3,5%4,0%
2011 2012 2013
06/2011 report
12/2010 report
*Adjusted for Lindab’s Market mix, segment and time adjusted22

l i n d a b | g r o u p p r e s e n t a t i o n
Q2 – Outlook - CEO comment
In total, the first half year saw organic growth of 12% primarily due to strong Nordic markets as well as an improvement in Building Systems sales particularly in CEE/CIS.
Considering our good growth in the first 6 months of the year, the 8 % organic growth target for 2011 now seems more achievable. However, the underlying demand remains uncertain, particularly in light of the current Euro-crisis, which has led to lower business confidence.
External market forecasts point to a growing recovery for our key segment, non-residential construction, in 2012 and gaining pace in 2013.
23

lindab | group presentation
Thank you
Q & A