Linda van der Graaf van Bloois -...
27
Whole genome analysis of Campylobacter fetus indicates recent diversification and reveals inconsistency of phenotypic and genomic characteristics Linda van der Graaf – van Bloois Department of Infectious Diseases and Immunology, Faculty of Veterinary Medicine, Utrecht University, WHO Collaborating Centre for Campylobacter / OIE Reference Laboratory for Campylobacteriosis Rapid Microbial NGS and Bioinformatics: Translation Into Practice, 2016
Transcript of Linda van der Graaf van Bloois -...
Whole genome analysis of Campylobacter fetus
indicates recent diversification
and
reveals inconsistency of phenotypic and genomic characteristics
Linda van der Graaf – van Bloois
Department of Infectious Diseases and Immunology, Faculty of Veterinary Medicine, Utrecht University, WHO Collaborating Centre for Campylobacter / OIE Reference Laboratory for
Campylobacteriosis
Rapid Microbial NGS and Bioinformatics: Translation Into Practice, 2016
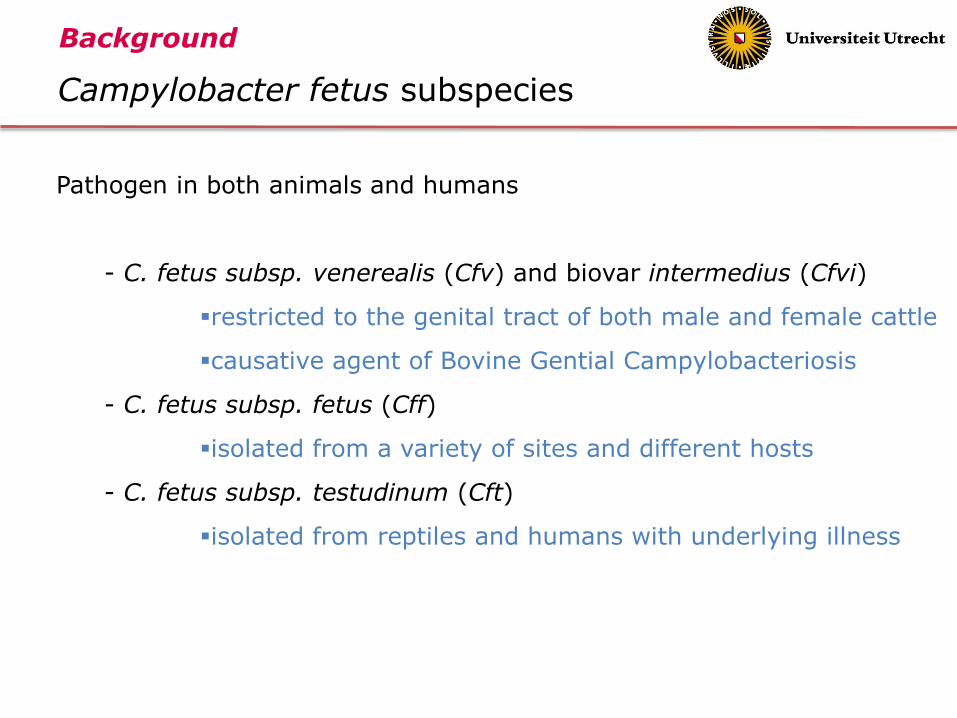
Campylobacter fetus subspecies
Pathogen in both animals and humans
- C. fetus subsp. venerealis (Cfv) and biovar intermedius (Cfvi)
restricted to the genital tract of both male and female cattle
causative agent of Bovine Gential Campylobacteriosis
- C. fetus subsp. fetus (Cff)
isolated from a variety of sites and different hosts
- C. fetus subsp. testudinum (Cft)
isolated from reptiles and humans with underlying illness
Background
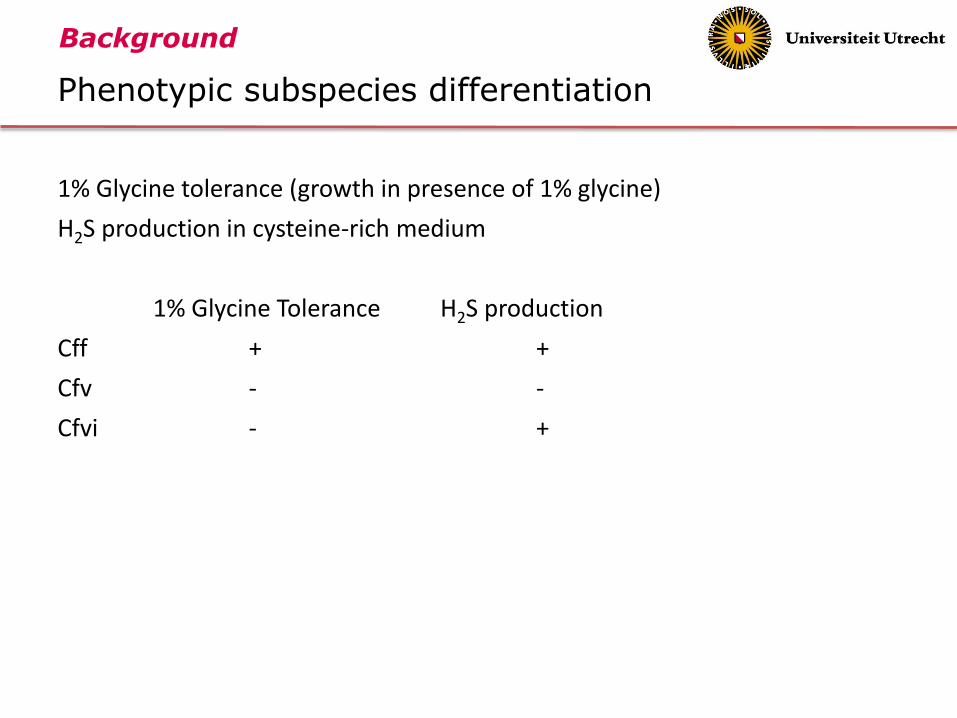
Phenotypic subspecies differentiation
1% Glycine tolerance (growth in presence of 1% glycine)
H2S production in cysteine-rich medium
1% Glycine Tolerance H2S production
Cff + +
Cfv - -
Cfvi - +
Background
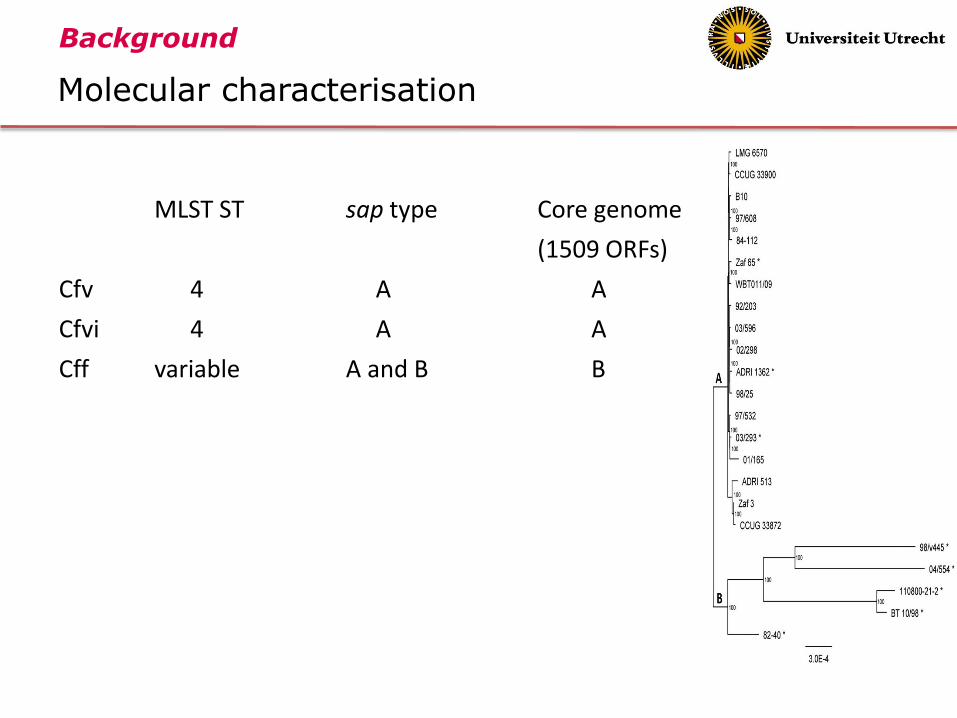
Molecular characterisation
MLST ST sap type Core genome
(1509 ORFs)
Cfv 4 A A
Cfvi 4 A A
Cff variable A and B B
Background
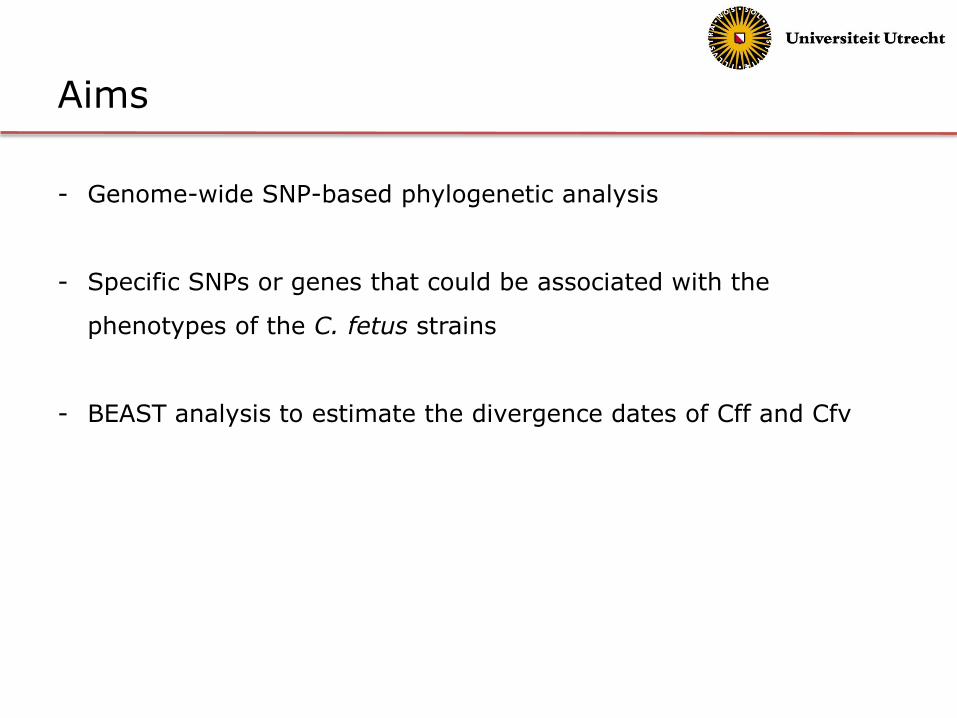
Aims
- Genome-wide SNP-based phylogenetic analysis
- Specific SNPs or genes that could be associated with the
phenotypes of the C. fetus strains
- BEAST analysis to estimate the divergence dates of Cff and Cfv
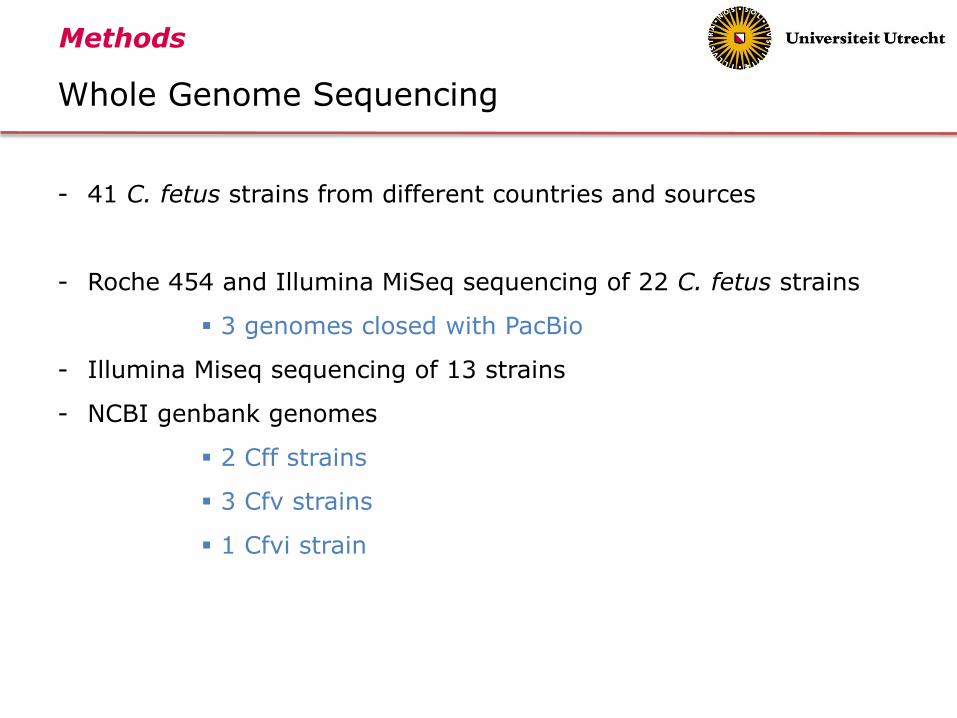
Whole Genome Sequencing
- 41 C. fetus strains from different countries and sources
- Roche 454 and Illumina MiSeq sequencing of 22 C. fetus strains
3 genomes closed with PacBio
- Illumina Miseq sequencing of 13 strains
- NCBI genbank genomes
2 Cff strains
3 Cfv strains
1 Cfvi strain
Methods

Whole Genome Analysis
- Genome alignment – Parsnp
- Recombination regions – Gubbins
- Comparison of SNPs and genes with phenotypes
- BEAST – recombination filtered non-synonymous SNPs from Gubbins
results
- Calculation of branch-specific dN/dS ratios
Methods

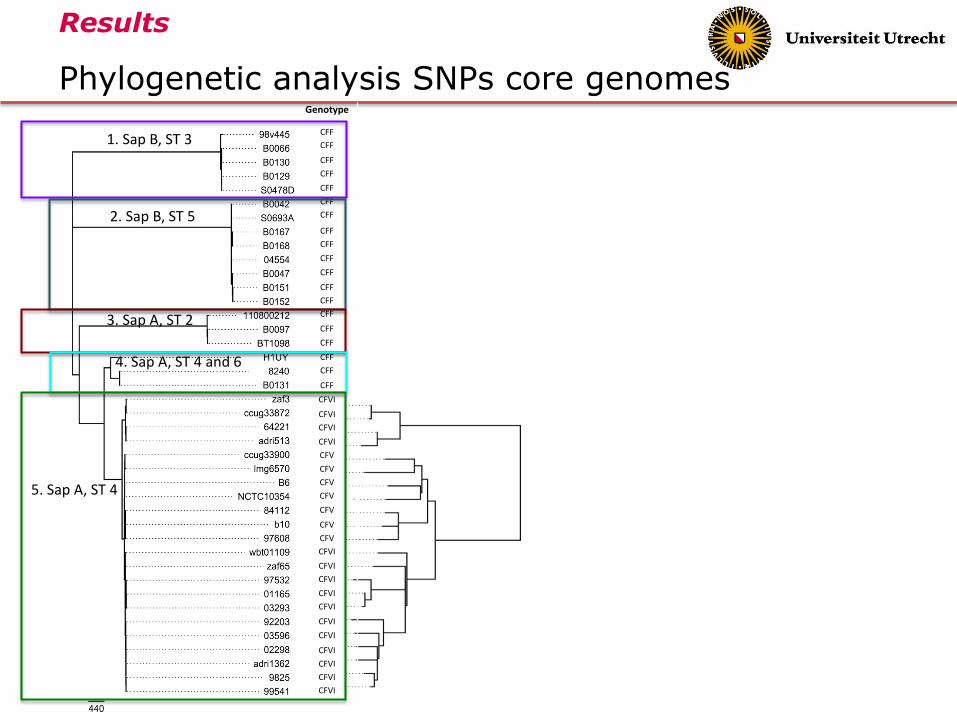
Phylogenetic analysis SNPs core genomes
Results
Genotype
CFF
CFF
CFF
CFF
CFF
CFF
CFF
CFF
CFF
CFF
CFF
CFF
CFF
CFF
CFF
CFF
CFF
CFF
CFF
CFVI
CFVI
CFVI
CFVI
CFV
CFV
CFV
CFV
CFV
CFV
CFV
CFVI
CFVI
CFVI
CFVI
CFVI
CFVI
CFVI
CFVI
CFVI
CFVI
CFVI
1. Sap B, ST 3
4. Sap A, ST 4 and 6
3. Sap A, ST 2
5. Sap A, ST 4
2. Sap B, ST 5
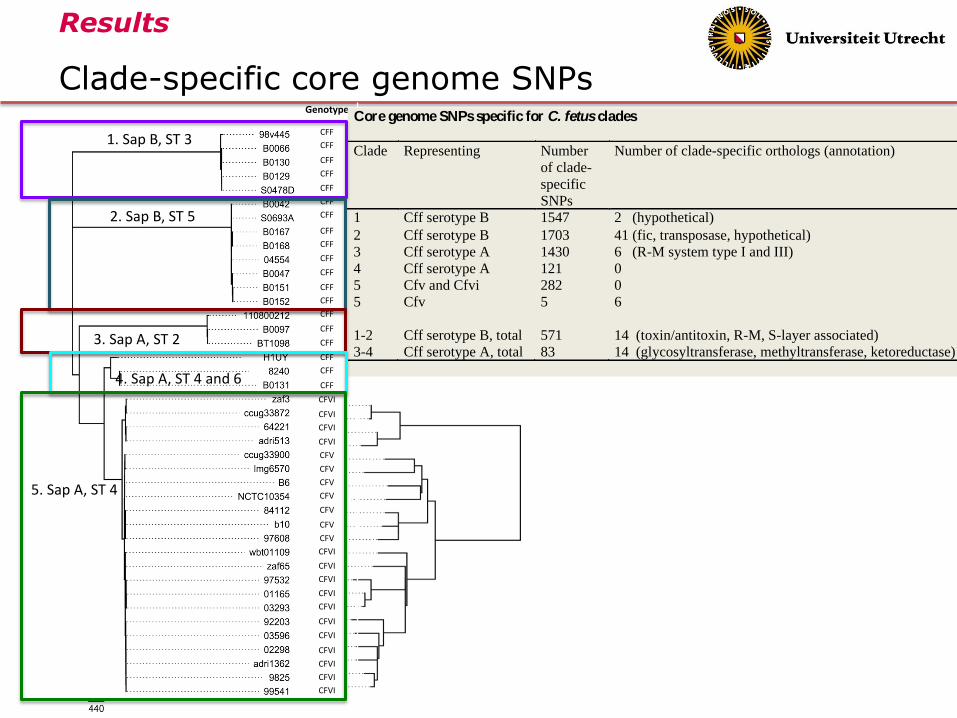
Clade-specific core genome SNPs
Results
Genotype
CFF
CFF
CFF
CFF
CFF
CFF
CFF
CFF
CFF
CFF
CFF
CFF
CFF
CFF
CFF
CFF
CFF
CFF
CFF
CFVI
CFVI
CFVI
CFVI
CFV
CFV
CFV
CFV
CFV
CFV
CFV
CFVI
CFVI
CFVI
CFVI
CFVI
CFVI
CFVI
CFVI
CFVI
CFVI
CFVI
1. Sap B, ST 3
4. Sap A, ST 4 and 6
3. Sap A, ST 2
5. Sap A, ST 4
2. Sap B, ST 5
Core genome SNPs specific for C. fetus clades
Clade Representing Number
of clade-
specific
SNPs
Number of clade-specific orthologs (annotation)
1 Cff serotype B 1547 2 (hypothetical)
2 Cff serotype B 1703 41 (fic, transposase, hypothetical)
3 Cff serotype A 1430 6 (R-M system type I and III)
4 Cff serotype A 121 0
5 Cfv and Cfvi 282 0
5 Cfv 5 6
1-2 Cff serotype B, total 571 14 (toxin/antitoxin, R-M, S-layer associated)
3-4 Cff serotype A, total 83 14 (glycosyltransferase, methyltransferase, ketoreductase)
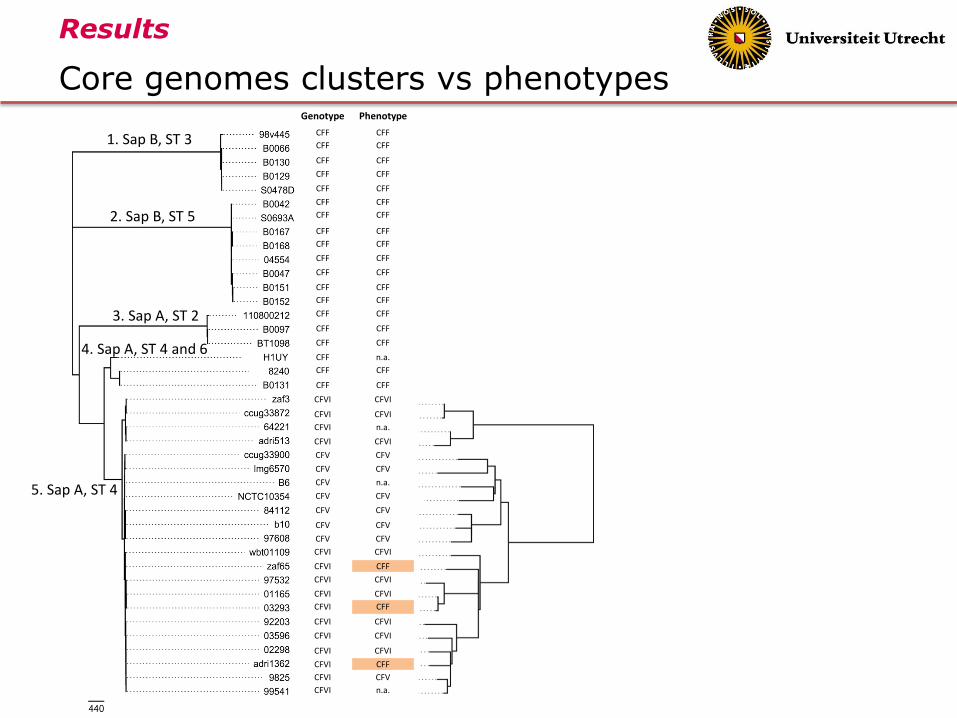
Core genomes clusters vs phenotypes
Results
1. Sap B, ST 3
4. Sap A, ST 4 and 6
3. Sap A, ST 2
5. Sap A, ST 4
2. Sap B, ST 5
Genotype Phenotype
CFF CFF
CFF CFF
CFF CFF
CFF CFF
CFF CFF
CFF CFF
CFF CFF
CFF CFF
CFF CFF
CFF CFF
CFF CFF
CFF CFF
CFF CFF
CFF CFF
CFF CFF
CFF CFF
CFF n.a.
CFF CFF
CFF CFF
CFVI CFVI
CFVI CFVI
CFVI n.a.
CFVI CFVI
CFV CFV
CFV CFV
CFV n.a.
CFV CFV
CFV CFV
CFV CFV
CFV CFV
CFVI CFVI
CFVI CFF
CFVI CFVI
CFVI CFVI
CFVI CFF
CFVI CFVI
CFVI CFVI
CFVI CFVI
CFVI CFF
CFVI CFV
CFVI n.a.
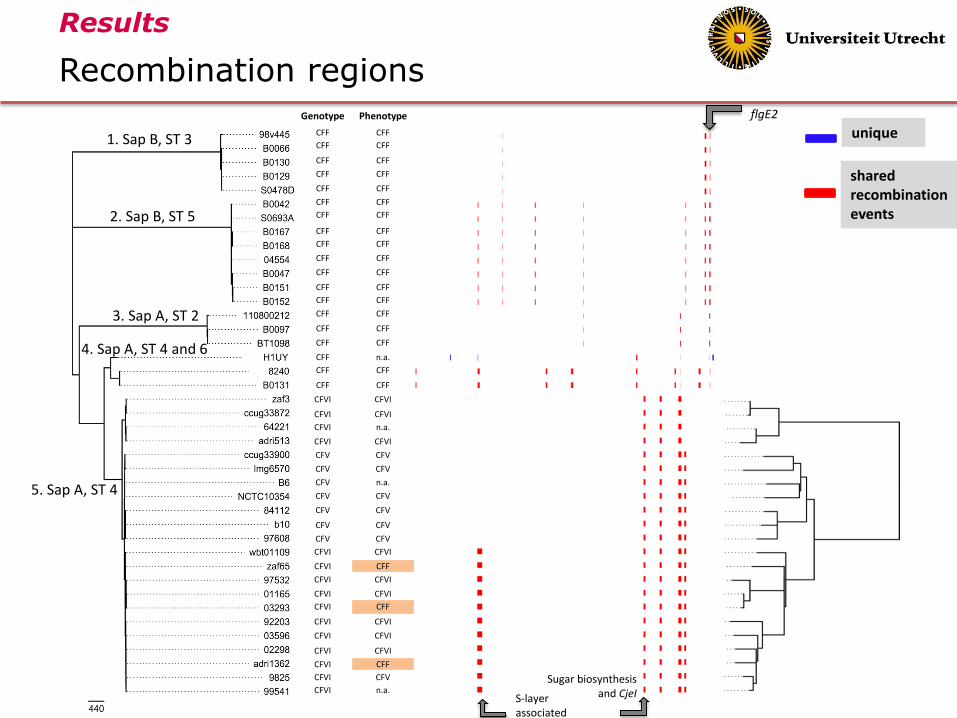
Recombination regions
Results
1. Sap B, ST 3
4. Sap A, ST 4 and 6
3. Sap A, ST 2
5. Sap A, ST 4
2. Sap B, ST 5
Genotype Phenotype
CFF CFF
CFF CFF
CFF CFF
CFF CFF
CFF CFF
CFF CFF
CFF CFF
CFF CFF
CFF CFF
CFF CFF
CFF CFF
CFF CFF
CFF CFF
CFF CFF
CFF CFF
CFF CFF
CFF n.a.
CFF CFF
CFF CFF
CFVI CFVI
CFVI CFVI
CFVI n.a.
CFVI CFVI
CFV CFV
CFV CFV
CFV n.a.
CFV CFV
CFV CFV
CFV CFV
CFV CFV
CFVI CFVI
CFVI CFF
CFVI CFVI
CFVI CFVI
CFVI CFF
CFVI CFVI
CFVI CFVI
CFVI CFVI
CFVI CFF
CFVI CFV
CFVI n.a. S-layer associated
Sugar biosynthesis and CjeI
flgE2
unique
shared recombination events
Aims
- Genome-wide SNP-based phylogenetic analysis
- Specific SNPs or genes that could be
associated with the phenotypes of the C.
fetus strains
- BEAST analysis to estimate the divergence dates of Cff and Cfv
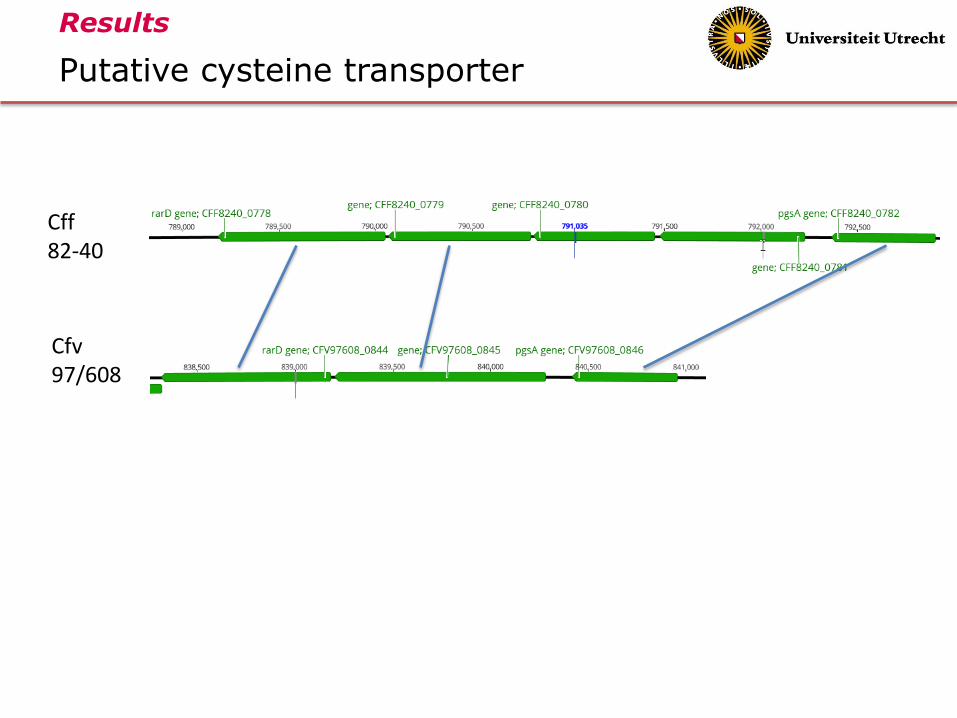
Putative cysteine transporter
Results
Cff 82-40
Cfv 97/608
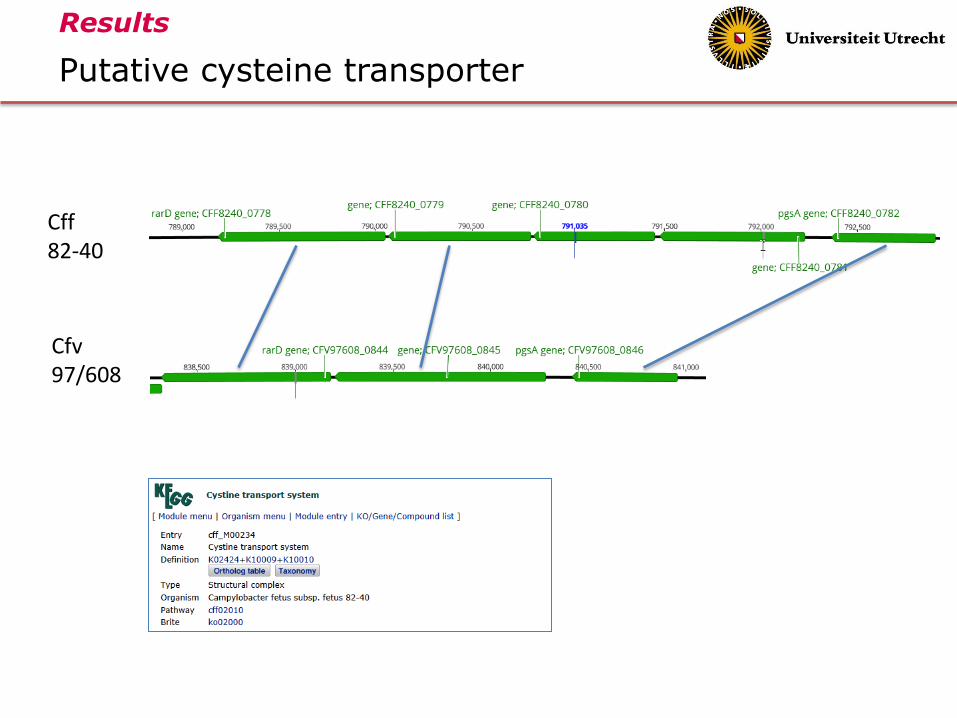
Putative cysteine transporter
Results
Cff 82-40
Cfv 97/608
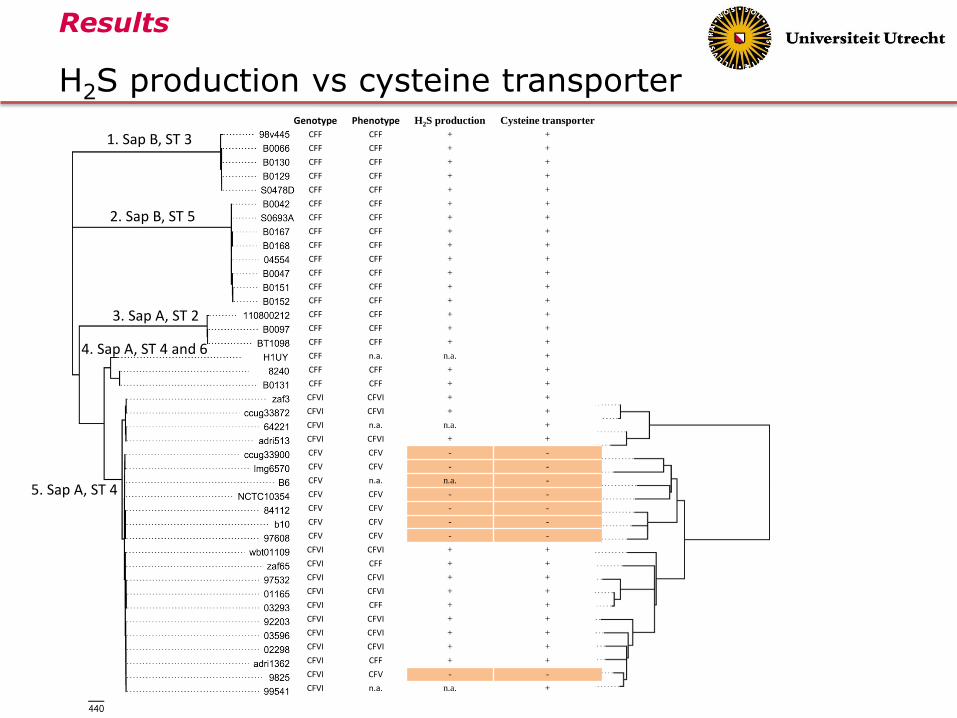
H2S production vs cysteine transporter
Results
1. Sap B, ST 3
4. Sap A, ST 4 and 6
3. Sap A, ST 2
5. Sap A, ST 4
2. Sap B, ST 5
Genotype Phenotype H2S production Cysteine transporter CFF CFF + +
CFF CFF + +
CFF CFF + +
CFF CFF + +
CFF CFF + +
CFF CFF + +
CFF CFF + +
CFF CFF + +
CFF CFF + +
CFF CFF + +
CFF CFF + +
CFF CFF + +
CFF CFF + +
CFF CFF + +
CFF CFF + +
CFF CFF + +
CFF n.a. n.a. +
CFF CFF + +
CFF CFF + +
CFVI CFVI + +
CFVI CFVI + +
CFVI n.a. n.a. +
CFVI CFVI + +
CFV CFV - -
CFV CFV - -
CFV n.a. n.a. -
CFV CFV - -
CFV CFV - -
CFV CFV - -
CFV CFV - -
CFVI CFVI + +
CFVI CFF + +
CFVI CFVI + +
CFVI CFVI + +
CFVI CFF + +
CFVI CFVI + +
CFVI CFVI + +
CFVI CFVI + +
CFVI CFF + +
CFVI CFV - -
CFVI n.a. n.a. +

Aims
- Genome-wide SNP-based phylogenetic analysis
- Specific SNPs or genes that could be associated with the
phenotypes of the C. fetus strains
- BEAST analysis to estimate the divergence
dates of Cff and Cfv

BEAST analysis
Results
- Recombination filtered non-synonymous SNPs from Gubbins - Reptile-associated C. fetus testudinum as outgroup
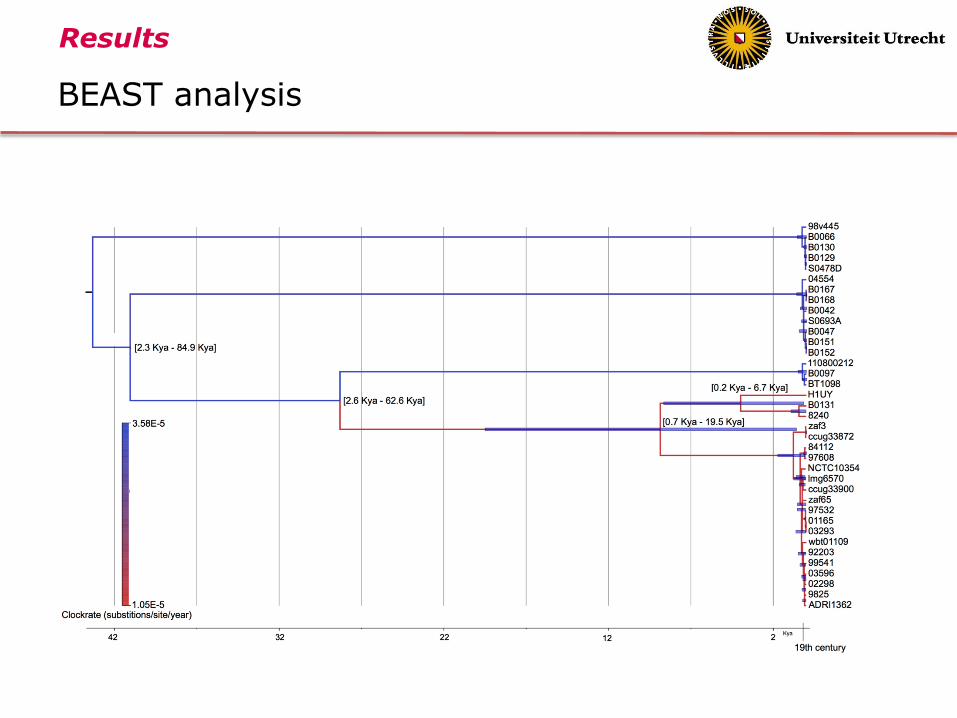
BEAST analysis
Results

BEAST analysis
Results
1. Sap B, ST 3
2. Sap B, ST 5
3. Sap A, ST 2
4. Sap A, ST 4,6
5. Sap A, ST 4
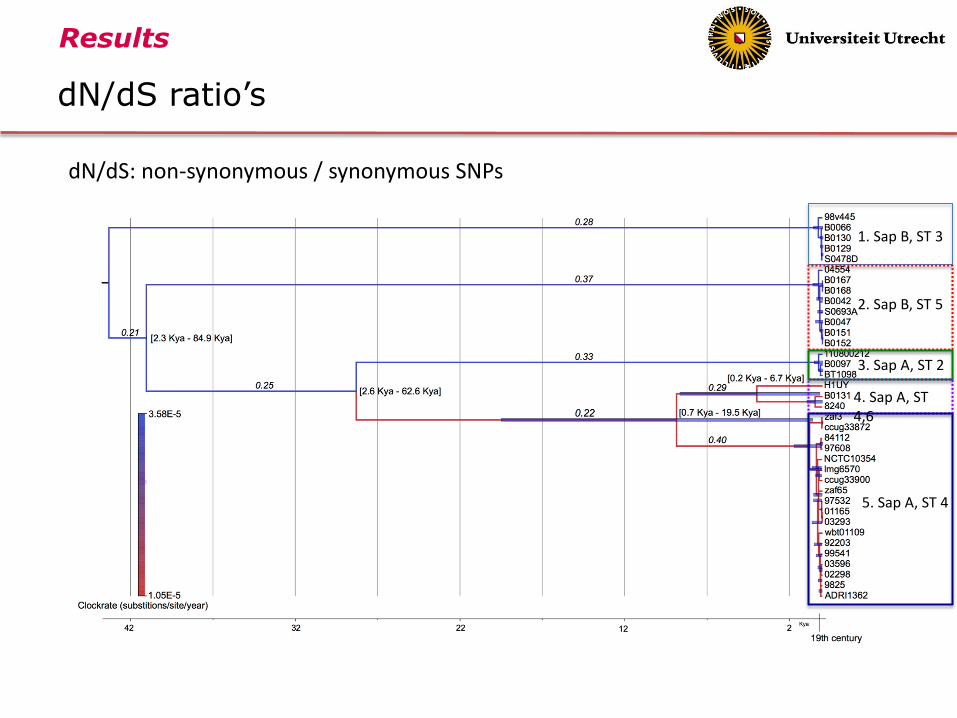
dN/dS ratio’s
Results
dN/dS: non-synonymous / synonymous SNPs
1. Sap B, ST 3
2. Sap B, ST 5
3. Sap A, ST 2
4. Sap A, ST 4,6
5. Sap A, ST 4

Conclusions
- Genome-wide SNP analysis divided Cff and Cfv strains in 5 clades
- Clades were inconsistent with phenotypes of strains
Phenotype
- 1% glycine tolerance; unknown
- H2S production: Partial deletion of putative cysteine transporter is
observed in H2S negative strains (Cfv)
- BEAST showed that Cfv strains evolved recently from Cff ancestor
under diversifying selection

Discussion
- Phenotype used for differentiation Cff and Cfv in BGC control programs
- Phenotype is inconsistent with genotype
- Significance phenotypic identification?
- Cluster 5 with Cfv/Cfvi is probably successful bovine clone

Core genomes clusters vs phenotypes
Results
1. Sap B, ST 3
4. Sap A, ST 4 and 6
3. Sap A, ST 2
5. Sap A, ST 4
2. Sap B, ST 5
Genotype Phenotype
CFF CFF
CFF CFF
CFF CFF
CFF CFF
CFF CFF
CFF CFF
CFF CFF
CFF CFF
CFF CFF
CFF CFF
CFF CFF
CFF CFF
CFF CFF
CFF CFF
CFF CFF
CFF CFF
CFF n.a.
CFF CFF
CFF CFF
CFVI CFVI
CFVI CFVI
CFVI n.a.
CFVI CFVI
CFV CFV
CFV CFV
CFV n.a.
CFV CFV
CFV CFV
CFV CFV
CFV CFV
CFVI CFVI
CFVI CFF
CFVI CFVI
CFVI CFVI
CFVI CFF
CFVI CFVI
CFVI CFVI
CFVI CFVI
CFVI CFF
CFVI CFV
CFVI n.a.

Acknowledgments
Aldert Zomer
Birgitta Duim
Jaap Wagenaar
Bill Miller and Emma Yee, USDA, Albany USA
Ken Forbes, University of Aberdeen, UK