Pillar Point Harbor DRAFT Condition Survey for West Shoreline Trail
description

Lincoln Trail Area Development District: Labor Market Survey 2012
1 | P a g e Prepared by ERISS Corporation
LINCOLN TRAIL
AREA DEVELOPMENT DISTRICT
Business Survey
2012
Executive
Summary
Lincoln Trail Area Development District: Labor Market Survey 2012
2 | P a g e Prepared by ERISS Corporation
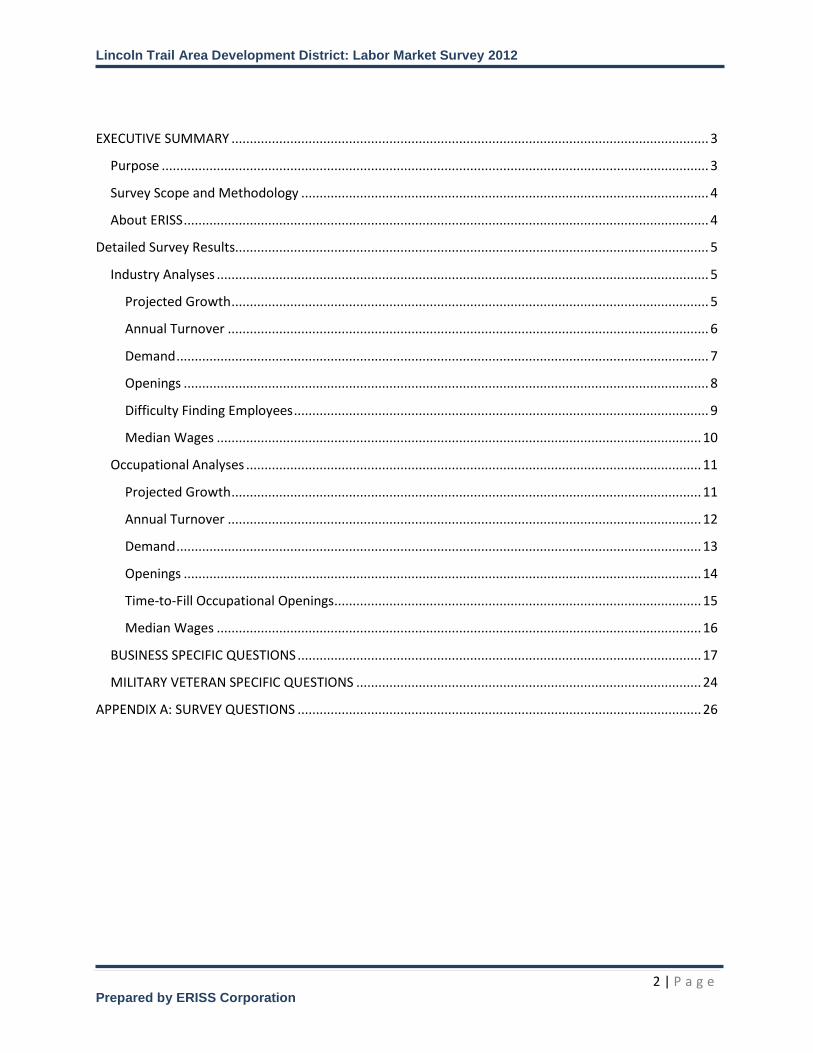
EXECUTIVE SUMMARY .................................................................................................................................. 3
Purpose ..................................................................................................................................................... 3
Survey Scope and Methodology ............................................................................................................... 4
About ERISS ............................................................................................................................................... 4
Detailed Survey Results................................................................................................................................. 5
Industry Analyses ...................................................................................................................................... 5
Projected Growth .................................................................................................................................. 5
Annual Turnover ................................................................................................................................... 6
Demand ................................................................................................................................................. 7
Openings ............................................................................................................................................... 8
Difficulty Finding Employees ................................................................................................................. 9
Median Wages .................................................................................................................................... 10
Occupational Analyses ............................................................................................................................ 11
Projected Growth ................................................................................................................................ 11
Annual Turnover ................................................................................................................................. 12
Demand ............................................................................................................................................... 13
Openings ............................................................................................................................................. 14
Time-to-Fill Occupational Openings .................................................................................................... 15
Median Wages .................................................................................................................................... 16
BUSINESS SPECIFIC QUESTIONS .............................................................................................................. 17
MILITARY VETERAN SPECIFIC QUESTIONS .............................................................................................. 24
APPENDIX A: SURVEY QUESTIONS .............................................................................................................. 26

Lincoln Trail Area Development District: Labor Market Survey 2012
3 | P a g e Prepared by ERISS Corporation
The results of the survey are to be delivered in the following ways:
EXECUTIVE SUMMARY
The following Executive Summary report details the findings of a region-wide business survey of the
Lincoln Trail Area Development District (LTADD). The survey took place August through September
2012.
PURPOSE The purpose of this study was to gather current and in-depth workforce
information to serve as the foundation for workforce and economic activities
in the region. The information will also assist employers, job seekers, and
students as well as provide key data for education partners, workforce and
economic developers, allowing them to address workforce and economic
needs.
Specific Goals:
Identify businesses at risk of downsizing and/or relocating.
Create a detailed inventory of local businesses.
Measure employer-staffing practices and needs.
Improve the understanding of the needs and perspectives of local businesses.
Identify and address the immediate concerns of individuals businesses.
Identify existing opportunities in order to enhance linkages with workforce and economic development partners and initiatives.
Collect information regarding the attitudes and hiring practices of employers for Military Veterans.
T
An interactive web application – USWorks for Professionals (right)
A confidential ACCESS database – contains the raw data and a variety of pre-set report filters
An electronic Executive Summary and Detailed Report (this document)

Lincoln Trail Area Development District: Labor Market Survey 2012
4 | P a g e Prepared by ERISS Corporation
SURVEY SCOPE AND METHODOLOGY The survey targeted employers with 5 or more employees. ERISS Corporation conducted the survey using a proprietary Computer Aided Telephone Interviewing (CATI) system. A stratified census style survey methodology was employed whereby an attempt was made to contact every business within the survey parameters, with the final sample representative by size and industry cluster of the population of businesses in the local region.
The final contact database comprised 3,123 employers. During the survey process 457 of these businesses were found to be out of scope1 of the survey, resulting in a net employer base of 2,666. Of these employers 708 participated in the survey resulting in a 27% response rate. The survey questions collected information from local businesses regarding such areas as:2
Projected growth and general staffing plans
Occupational demand, turnover, hiring plans and wages
Plans to expand, downsize and/or relocate
Reasons for downsizing or relocating
Barriers to growth
Key issues, concerns and challenges to local businesses
Knowledge and use of local programs
Hiring of special workforce populations
Skill deficiencies The survey also asked a series of questions designed to collect information about training and employment of veterans such as:
Collaboration with veteran’s organizations
Programs for veterans and employment
Programs for the hiring of veterans
Leveraging of military background
Interest in participation in a region-wide veterans hiring program
ABOUT ERISS ERISS Corporation is an award-winning company and a national leader in employer outreach, employer surveys and workforce technology since 1992. We have served Workforce Investment Boards and economic development organizations across the nation conducting large-scale survey and outreach projects, as well as targeted industry sector surveys, interviewing over 2,000,000 employers in the last ten years. ERISS’s projects capture employer-specific information such as brand awareness, knowledge of service offerings, services needed, and satisfaction rankings, current and forecasted hiring, planned layoffs, barriers to growth and preferences towards hiring special populations. For more information visit www.eriss.com or contact Barbara Nyegaard, CEO at [email protected].
1 Employers with wrong phone number and no new number, no answer on repeated attempts, employers with less
than 5 employees. 2 Complete survey questions are provided in Appendix A.
Approximately 27%
(708) of the 2,666
eligible businesses
participated in the
survey
Lincoln Trail Area Development District: Labor Market Survey 2012
5 | P a g e Prepared by ERISS Corporation
DETAILED SURVEY RESULTS
Industry Analyses
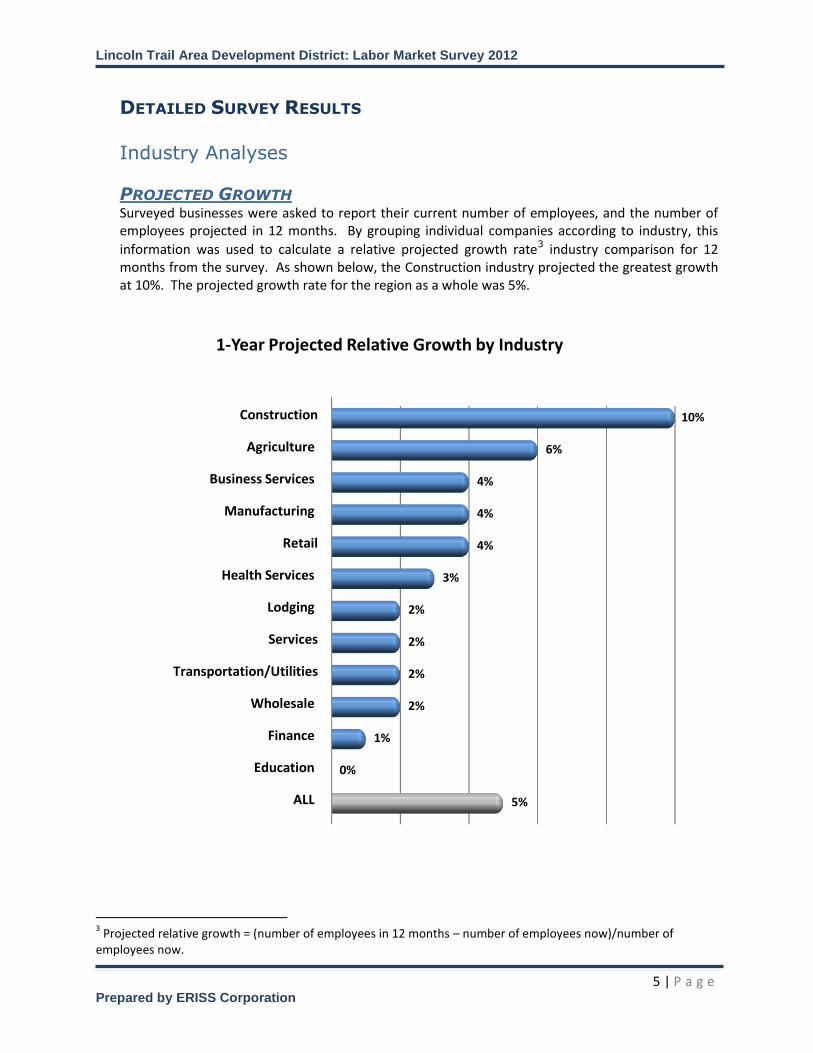
PROJECTED GROWTH Surveyed businesses were asked to report their current number of employees, and the number of employees projected in 12 months. By grouping individual companies according to industry, this
information was used to calculate a relative projected growth rate3 industry comparison for 12 months from the survey. As shown below, the Construction industry projected the greatest growth at 10%. The projected growth rate for the region as a whole was 5%.
3 Projected relative growth = (number of employees in 12 months – number of employees now)/number of
employees now.
10%
6%
4%
4%
4%
3%
2%
2%
2%
2%
1%
0%
5%
Construction
Agriculture
Business Services
Manufacturing
Retail
Health Services
Lodging
Services
Transportation/Utilities
Wholesale
Finance
Education
ALL
1-Year Projected Relative Growth by Industry
Lincoln Trail Area Development District: Labor Market Survey 2012
6 | P a g e Prepared by ERISS Corporation
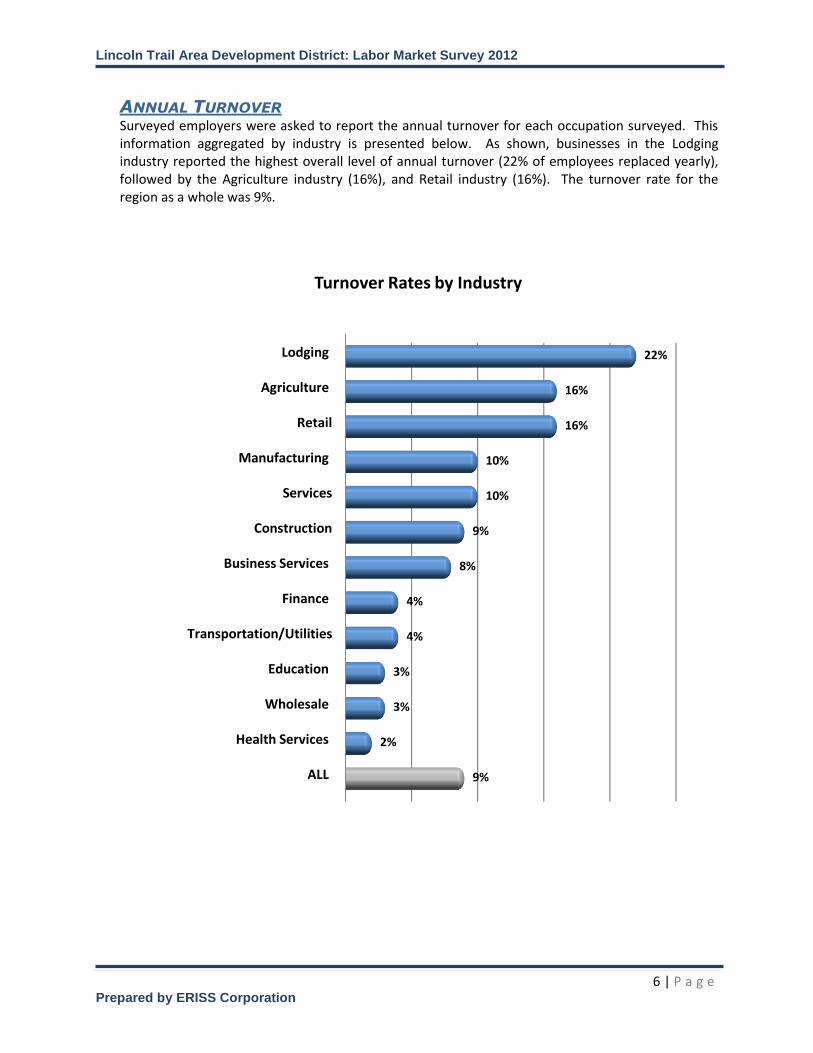
ANNUAL TURNOVER Surveyed employers were asked to report the annual turnover for each occupation surveyed. This information aggregated by industry is presented below. As shown, businesses in the Lodging industry reported the highest overall level of annual turnover (22% of employees replaced yearly), followed by the Agriculture industry (16%), and Retail industry (16%). The turnover rate for the region as a whole was 9%.
22%
16%
16%
10%
10%
9%
8%
4%
4%
3%
3%
2%
9%
Lodging
Agriculture
Retail
Manufacturing
Services
Construction
Business Services
Finance
Transportation/Utilities
Education
Wholesale
Health Services
ALL
Turnover Rates by Industry

Lincoln Trail Area Development District: Labor Market Survey 2012
7 | P a g e Prepared by ERISS Corporation
DEMAND A relevant indicator of the staffing challenges related to specific industries and occupations can be provided by Demand. Demand provides an estimate of the percentage of workers that will need to be hired during a 12-month period due to both growth AND turnover. Demand is calculated by starting with projected growth, adding in annual turnover, and dividing by the number currently employed. It essentially provides a projected growth rate modified by turnover rates. The figure below displays Demand split into growth and turnover components. For example, the overall region has a demand of 14% comprised of 5% growth and 9% turnover. The Lodging industry exhibits the greatest Demand (24%), largely driven by a high turnover rate (22%). Demand for Construction is relatively growth-driven.
2%
6%
4%
10%
4%
4%
2%
2%
1%
3%
2%
0%
5%
22%
16%
16%
9%
10%
8%
10%
4%
4%
2%
3%
3%
9%
Lodging
Agriculture
Retail
Construction
Manufacturing
Business Services
Services
Transportation/Utilities
Finance
Health Services
Wholesale
Education
ALL
Occupational Demand by Industry
Growth
Turnover

Lincoln Trail Area Development District: Labor Market Survey 2012
8 | P a g e Prepared by ERISS Corporation
OPENINGS Estimates of current openings are calculated by calculating the difference between current and estimated future staffing levels 12 months from the survey for each surveyed employer. The total percentage of current openings aggregated over industry is displayed below. As shown, the Retail and Business Services industries had the highest percentage of current openings, with projections for openings for 5% and 4% of the current reported staffing levels respectively for each industry.. The Finance industry had a negative proportion of current openings (-2%) indicating that surveyed employers are currently staffing 2% more employees than they project having in 12 months.
5%
4%
3%
3%
2%
2%
2%
1%
1%
0%
0%
-2%
4%
Retail
Business Services
Health Services
Manufacturing
Agriculture
Construction
Transportation/Utilities
Lodging
Services
Education
Wholesale
Finance
ALL
Current Openings by Industry
Lincoln Trail Area Development District: Labor Market Survey 2012
9 | P a g e Prepared by ERISS Corporation
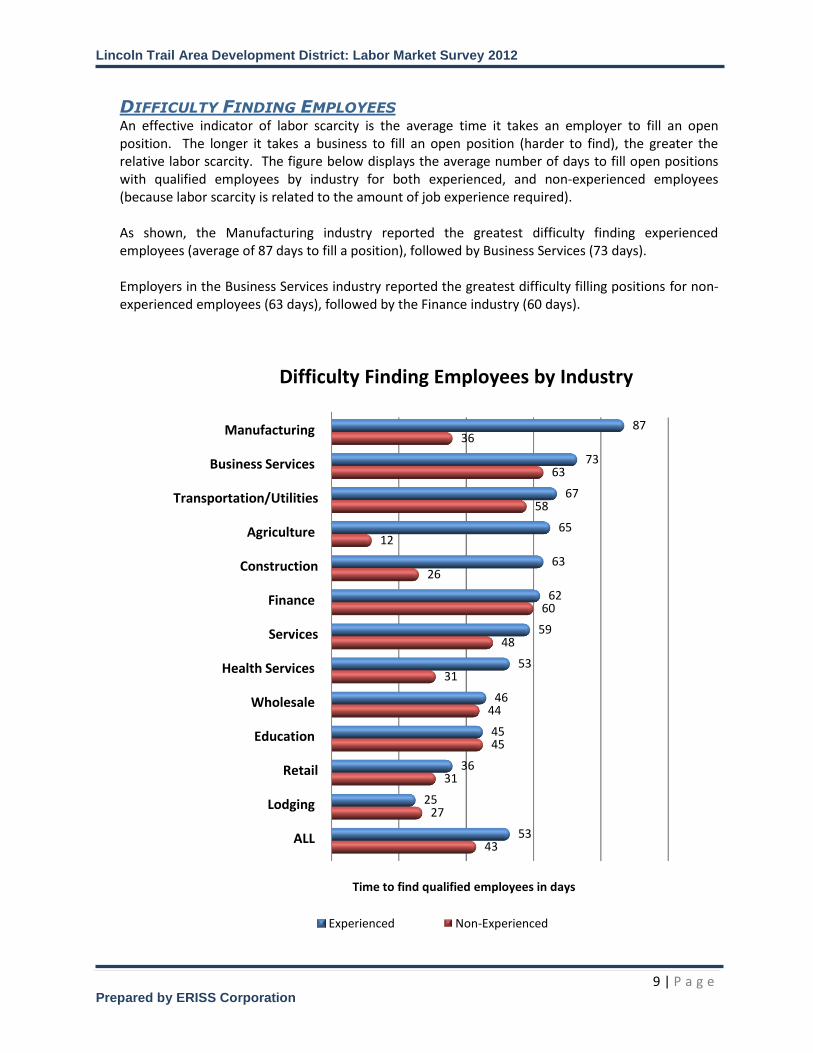
DIFFICULTY FINDING EMPLOYEES An effective indicator of labor scarcity is the average time it takes an employer to fill an open position. The longer it takes a business to fill an open position (harder to find), the greater the relative labor scarcity. The figure below displays the average number of days to fill open positions with qualified employees by industry for both experienced, and non-experienced employees (because labor scarcity is related to the amount of job experience required). As shown, the Manufacturing industry reported the greatest difficulty finding experienced employees (average of 87 days to fill a position), followed by Business Services (73 days). Employers in the Business Services industry reported the greatest difficulty filling positions for non-experienced employees (63 days), followed by the Finance industry (60 days).
87
73
67
65
63
62
59
53
46
45
36
25
53
36
63
58
12
26
60
48
31
44
45
31
27
43
Manufacturing
Business Services
Transportation/Utilities
Agriculture
Construction
Finance
Services
Health Services
Wholesale
Education
Retail
Lodging
ALL
Time to find qualified employees in days
Difficulty Finding Employees by Industry
Experienced Non-Experienced
Lincoln Trail Area Development District: Labor Market Survey 2012
10 | P a g e Prepared by ERISS Corporation
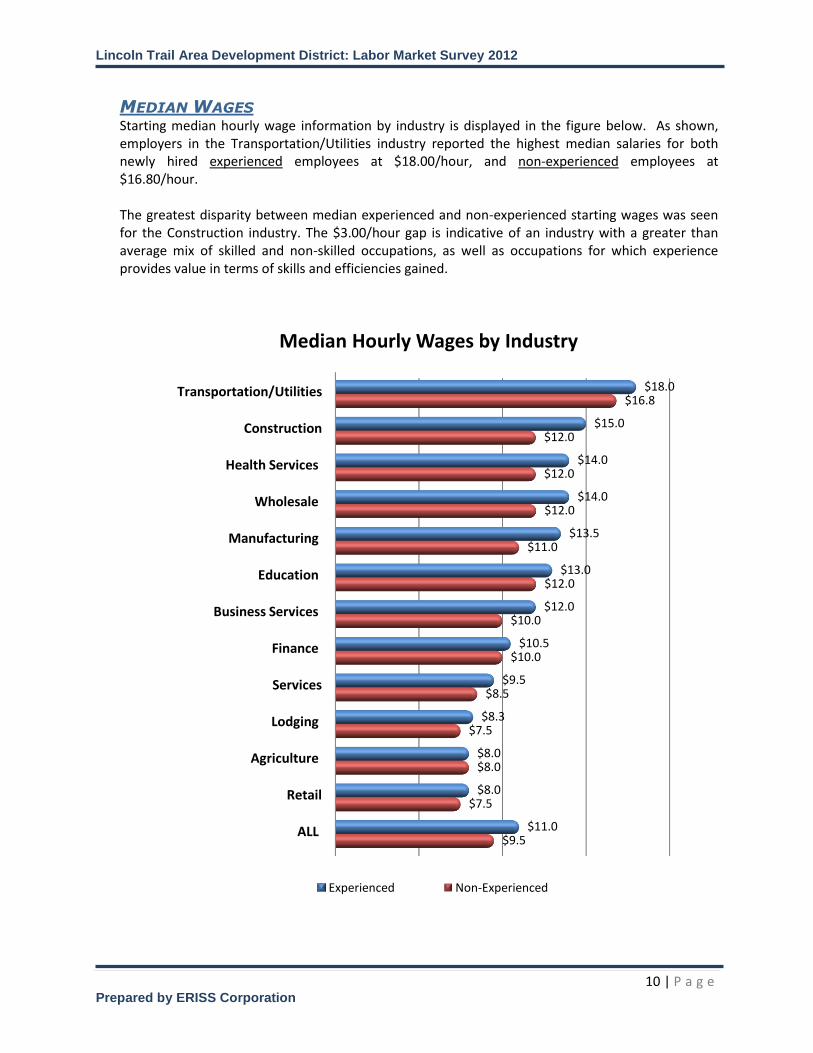
MEDIAN WAGES Starting median hourly wage information by industry is displayed in the figure below. As shown, employers in the Transportation/Utilities industry reported the highest median salaries for both newly hired experienced employees at $18.00/hour, and non-experienced employees at $16.80/hour. The greatest disparity between median experienced and non-experienced starting wages was seen for the Construction industry. The $3.00/hour gap is indicative of an industry with a greater than average mix of skilled and non-skilled occupations, as well as occupations for which experience provides value in terms of skills and efficiencies gained.
$18.0
$15.0
$14.0
$14.0
$13.5
$13.0
$12.0
$10.5
$9.5
$8.3
$8.0
$8.0
$11.0
$16.8
$12.0
$12.0
$12.0
$11.0
$12.0
$10.0
$10.0
$8.5
$7.5
$8.0
$7.5
$9.5
Transportation/Utilities
Construction
Health Services
Wholesale
Manufacturing
Education
Business Services
Finance
Services
Lodging
Agriculture
Retail
ALL
Median Hourly Wages by Industry
Experienced Non-Experienced
Lincoln Trail Area Development District: Labor Market Survey 2012
11 | P a g e Prepared by ERISS Corporation
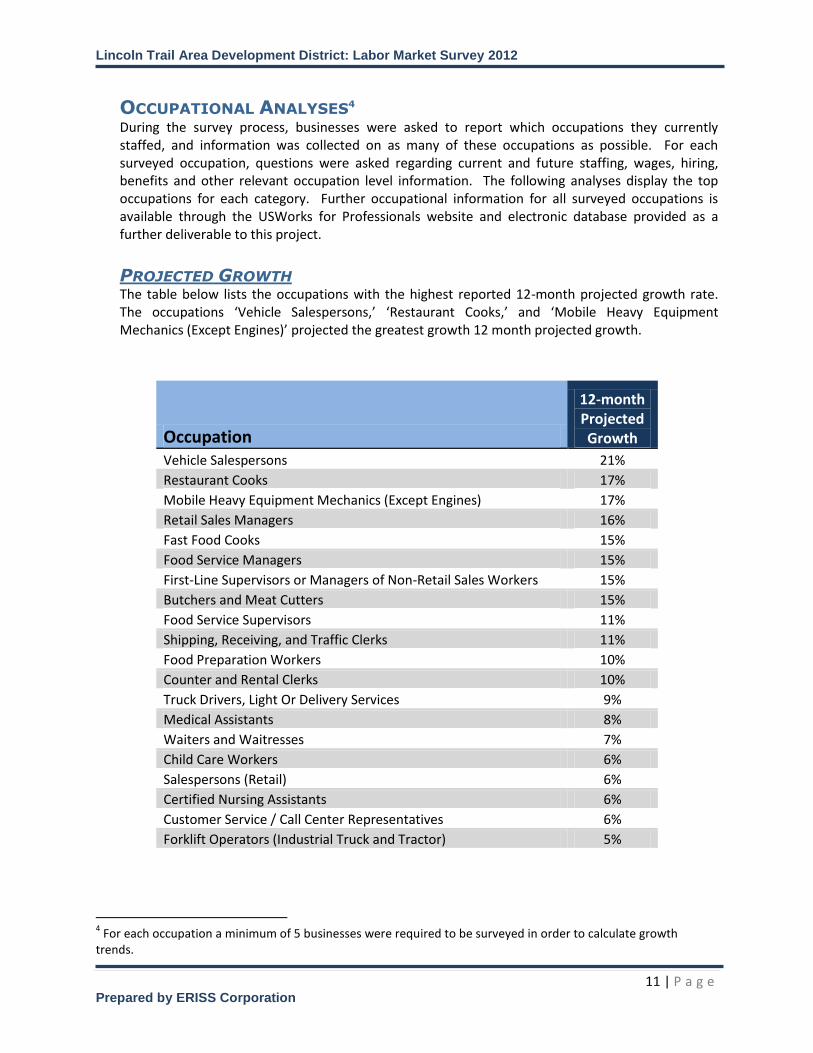
OCCUPATIONAL ANALYSES4 During the survey process, businesses were asked to report which occupations they currently staffed, and information was collected on as many of these occupations as possible. For each surveyed occupation, questions were asked regarding current and future staffing, wages, hiring, benefits and other relevant occupation level information. The following analyses display the top occupations for each category. Further occupational information for all surveyed occupations is available through the USWorks for Professionals website and electronic database provided as a further deliverable to this project.
PROJECTED GROWTH The table below lists the occupations with the highest reported 12-month projected growth rate. The occupations ‘Vehicle Salespersons,’ ‘Restaurant Cooks,’ and ‘Mobile Heavy Equipment Mechanics (Except Engines)’ projected the greatest growth 12 month projected growth.
Occupation
12-month Projected Growth
Vehicle Salespersons 21%
Restaurant Cooks 17%
Mobile Heavy Equipment Mechanics (Except Engines) 17%
Retail Sales Managers 16%
Fast Food Cooks 15%
Food Service Managers 15%
First-Line Supervisors or Managers of Non-Retail Sales Workers 15%
Butchers and Meat Cutters 15%
Food Service Supervisors 11%
Shipping, Receiving, and Traffic Clerks 11%
Food Preparation Workers 10%
Counter and Rental Clerks 10%
Truck Drivers, Light Or Delivery Services 9%
Medical Assistants 8%
Waiters and Waitresses 7%
Child Care Workers 6%
Salespersons (Retail) 6%
Certified Nursing Assistants 6%
Customer Service / Call Center Representatives 6%
Forklift Operators (Industrial Truck and Tractor) 5%
4 For each occupation a minimum of 5 businesses were required to be surveyed in order to calculate growth
trends.

Lincoln Trail Area Development District: Labor Market Survey 2012
12 | P a g e Prepared by ERISS Corporation
ANNUAL TURNOVER The table below shows the occupations with the highest reported turnover rates. Occupations with the highest turnover tended to be from the Services industry. The highest overall turnover was seen for the occupation ‘Fast Food Cook’ with 34% of all position turned over annually.
Occupation Turnover
Rate
Fast Food Cooks 34%
Restaurant Cooks 32%
Vehicle Salespersons 22%
Food Service Supervisors 21%
Dishwashers 19%
Waiters and Waitresses 19%
Child Care Workers 19%
Food Service Managers 17%
Cashiers 17%
Hairdressers, Hairstylists, and Cosmetologists 16%
Salespersons (Retail) 12%
Certified Nursing Assistants 12%
Food Preparation Workers 12%
Butchers and Meat Cutters 12%
Automotive Mechanics and Technicians 11%
Mobile Heavy Equipment Mechanics (Except Engines) 10%
Vehicle and Equipment Cleaners 10%
Freight, Stock, and Material Movers (Hand Laborers) 10%
First-Line Supervisors or Managers of Non-Retail Sales Workers 9%
Retail Sales Managers 9%

Lincoln Trail Area Development District: Labor Market Survey 2012
13 | P a g e Prepared by ERISS Corporation
DEMAND Demand is a function of projected growth plus occupational turnover. The table below shows the occupations with the highest reported demand rates, and also provides growth and turnover rates as an indicator of the components of the demand. As shown, the demand for many of the highest demand occupations is largely driven by turnover. Exceptions to this trend include ‘Retail Sales Managers’ and ‘First-Line Supervisors or Managers of Non-Retail Sales Workers,’ which have largely growth driven demand.
Occupation Demand Growth Turnover
Rate
Fast Food Cooks 49% 15% 34%
Restaurant Cooks 49% 17% 32%
Food Service Managers 32% 15% 17%
Food Service Supervisors 32% 11% 21%
Waiters and Waitresses 26% 7% 19%
Child Care Workers 25% 6% 19%
Retail Sales Managers 25% 16% 9%
First-Line Supervisors or Managers of Non-Retail Sales Workers 24% 15% 9%
Food Preparation Workers 22% 10% 12%
Salespersons (Retail) 18% 6% 12%
Certified Nursing Assistants 18% 6% 12%
Dishwashers 17% -2% 19%
Cashiers 17% 0% 17%
Truck Drivers, Light Or Delivery Services 17% 9% 8%
Shipping, Receiving, and Traffic Clerks 15% 11% 4%
Freight, Stock, and Material Movers (Hand Laborers) 14% 4% 10%
Hairdressers, Hairstylists, and Cosmetologists 13% -3% 16%
Customer Service / Call Center Representatives 12% 6% 6%
Vehicle and Equipment Cleaners 12% 2% 10%
Preschool Teachers (Except Special Education) 11% 3% 8%
Lincoln Trail Area Development District: Labor Market Survey 2012
14 | P a g e Prepared by ERISS Corporation
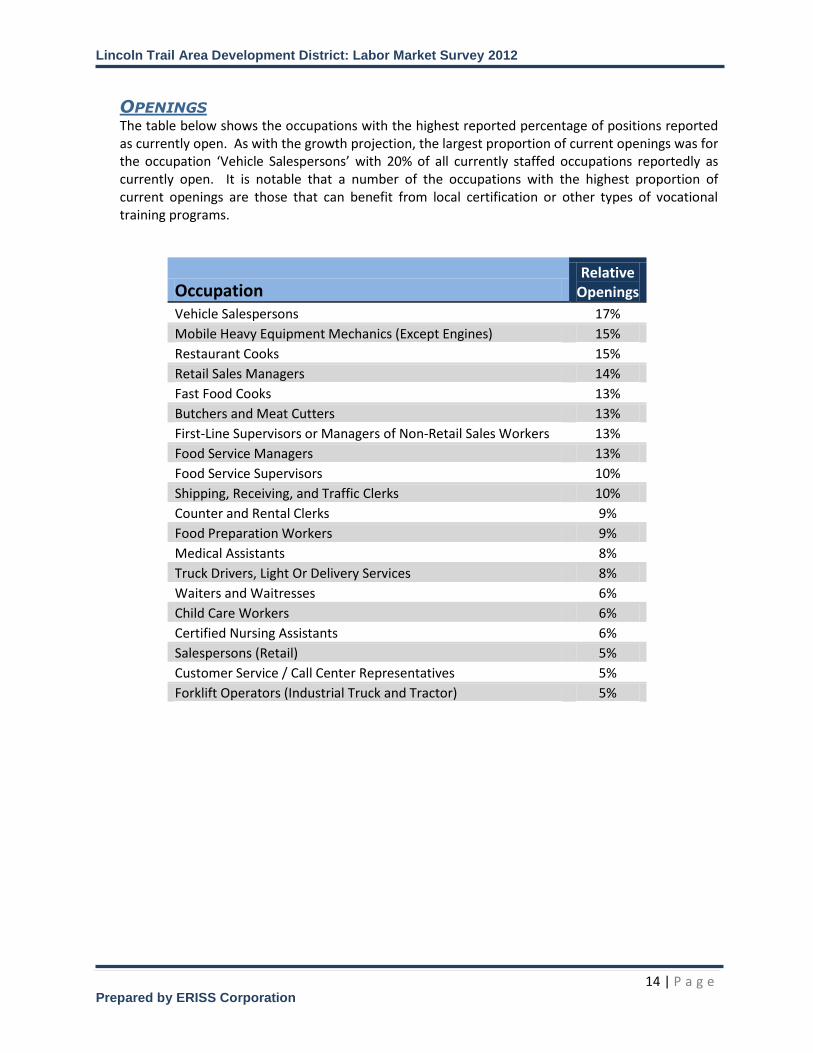
OPENINGS The table below shows the occupations with the highest reported percentage of positions reported as currently open. As with the growth projection, the largest proportion of current openings was for the occupation ‘Vehicle Salespersons’ with 20% of all currently staffed occupations reportedly as currently open. It is notable that a number of the occupations with the highest proportion of current openings are those that can benefit from local certification or other types of vocational training programs.
Occupation Relative
Openings
Vehicle Salespersons 17%
Mobile Heavy Equipment Mechanics (Except Engines) 15%
Restaurant Cooks 15%
Retail Sales Managers 14%
Fast Food Cooks 13%
Butchers and Meat Cutters 13%
First-Line Supervisors or Managers of Non-Retail Sales Workers 13%
Food Service Managers 13%
Food Service Supervisors 10%
Shipping, Receiving, and Traffic Clerks 10%
Counter and Rental Clerks 9%
Food Preparation Workers 9%
Medical Assistants 8%
Truck Drivers, Light Or Delivery Services 8%
Waiters and Waitresses 6%
Child Care Workers 6%
Certified Nursing Assistants 6%
Salespersons (Retail) 5%
Customer Service / Call Center Representatives 5%
Forklift Operators (Industrial Truck and Tractor) 5%

Lincoln Trail Area Development District: Labor Market Survey 2012
15 | P a g e Prepared by ERISS Corporation
TIME-TO-FILL OCCUPATIONAL OPENINGS The table below shows the average number of days to fill an opening for the hardest to find occupations for both experienced and non-experienced employees. For experienced employees, the list is topped by occupations requiring more extensive training or experience. However, many of the hardest to find occupations for non-experienced employees required extensive training as well, providing evidence of possible training gaps. It is also notable many of the occupations appear on both lists which is indicative of possible skill shortages across the spectrum of experience levels.

Lincoln Trail Area Development District: Labor Market Survey 2012
16 | P a g e Prepared by ERISS Corporation
MEDIAN WAGES The table below displays the occupations with the highest median starting salary for experienced and non-experienced employees. Although some of the occupations listed for experienced employees require extensive education, it is notable that some of the relatively higher paying occupations for both experienced and non-experienced employees required only a technical degree or similar vocational training (or less).
Lincoln Trail Area Development District: Labor Market Survey 2012
17 | P a g e Prepared by ERISS Corporation
BUSINESS SPECIFIC QUESTIONS In order to gather the information necessary to make planning decisions and assist businesses, surveyed businesses were asked a series of questions designed to assess such areas as plans to expand or downsize (and reasons for doing so), concerns and challenges for doing business, barriers to growth, and knowledge of local programs.
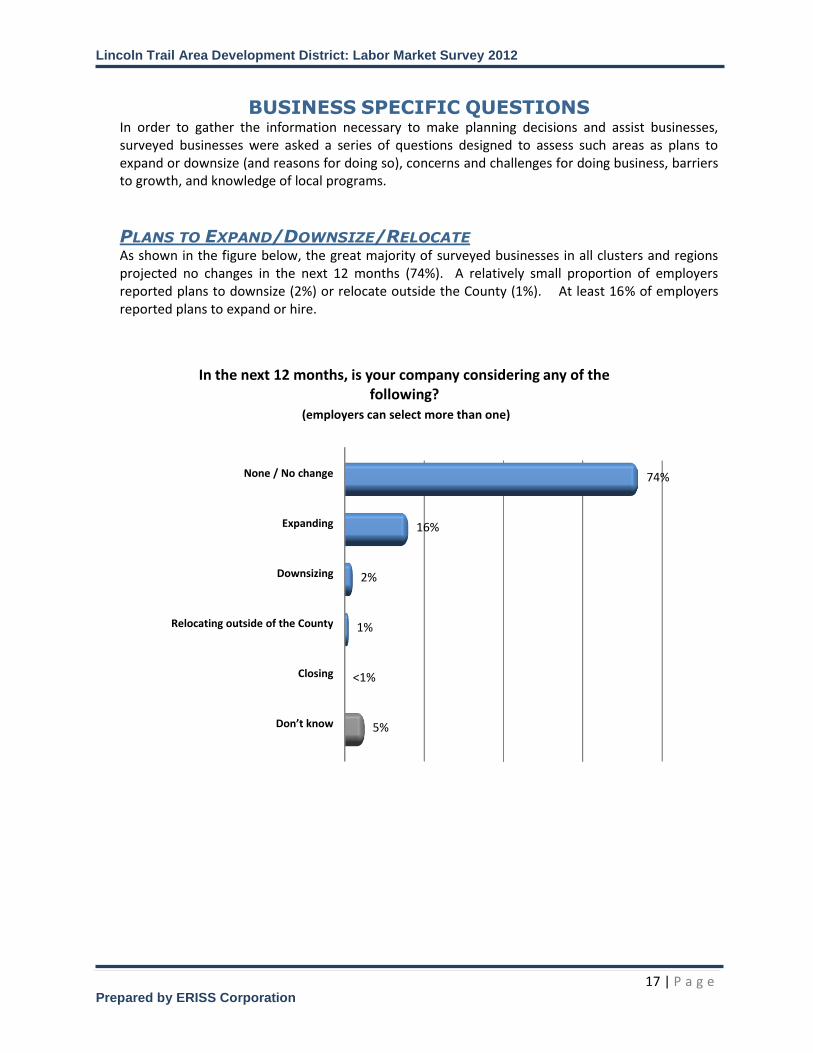
PLANS TO EXPAND/DOWNSIZE/RELOCATE As shown in the figure below, the great majority of surveyed businesses in all clusters and regions projected no changes in the next 12 months (74%). A relatively small proportion of employers reported plans to downsize (2%) or relocate outside the County (1%). At least 16% of employers reported plans to expand or hire.
74%
16%
2%
1%
<1%
5%
None / No change
Expanding
Downsizing
Relocating outside of the County
Closing
Don’t know
In the next 12 months, is your company considering any of the following?
(employers can select more than one)

Lincoln Trail Area Development District: Labor Market Survey 2012
18 | P a g e Prepared by ERISS Corporation
REASONS FOR DOWNSIZING OR CLOSING Businesses that reported they anticipated relocating, downsizing or closing in the next 12 months (17 businesses; 2 closing and 15 downsizing) were asked to choose from a list of possible reasons for their anticipated action. As shown, the most commonly reported reasons were ‘cost of doing business’ and ‘regulatory concerns’ (both at 26%).
26%
26%
13%
1%
6%
6%
9%
6%
40%
26%
Cost of doing Business
Regulatory Concerns
Availability of Credit
Tax Competitiveness
Insufficient Room for Expansion
Lack of Skilled Labor
Affordable Housing for Employees
Traffic Congestion
Other
Don’t Know
If Downsizing or Closing, other than the current economic conditions, would that be because of….
(employers can select more than one)
Lincoln Trail Area Development District: Labor Market Survey 2012
19 | P a g e Prepared by ERISS Corporation
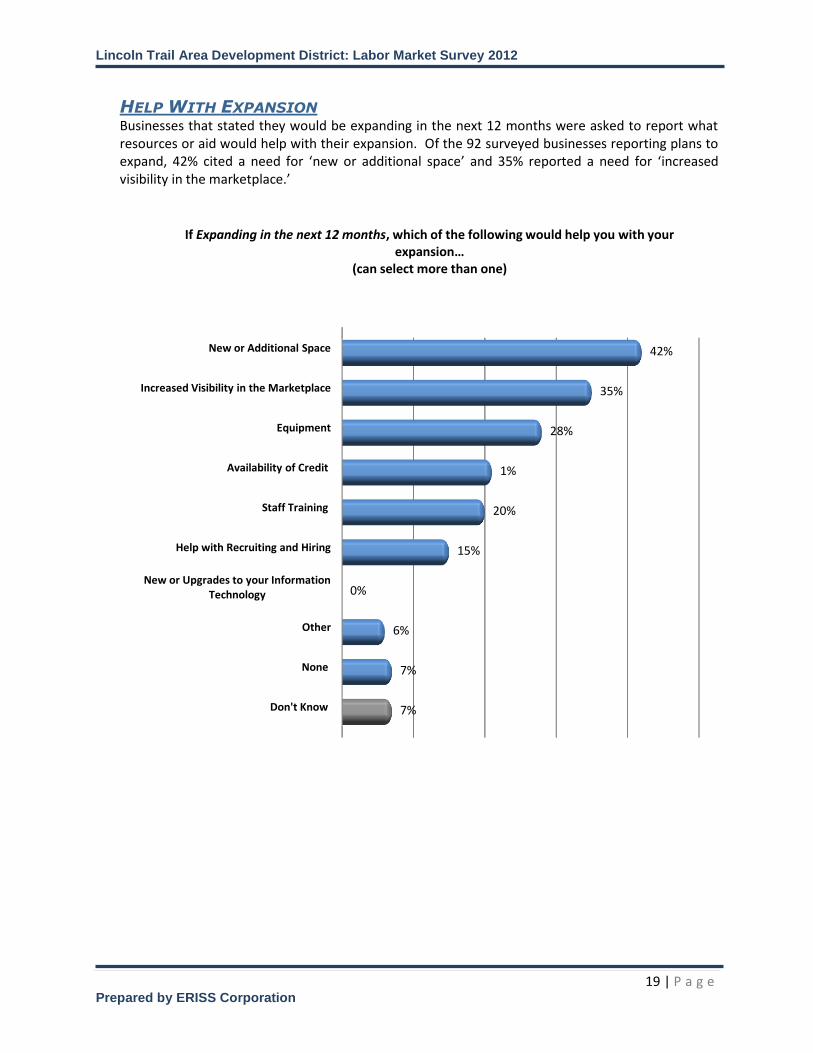
HELP WITH EXPANSION Businesses that stated they would be expanding in the next 12 months were asked to report what resources or aid would help with their expansion. Of the 92 surveyed businesses reporting plans to expand, 42% cited a need for ‘new or additional space’ and 35% reported a need for ‘increased visibility in the marketplace.’
42%
35%
28%
1%
20%
15%
0%
6%
7%
7%
New or Additional Space
Increased Visibility in the Marketplace
Equipment
Availability of Credit
Staff Training
Help with Recruiting and Hiring
New or Upgrades to your Information Technology
Other
None
Don't Know
If Expanding in the next 12 months, which of the following would help you with your expansion…
(can select more than one)
Lincoln Trail Area Development District: Labor Market Survey 2012
20 | P a g e Prepared by ERISS Corporation
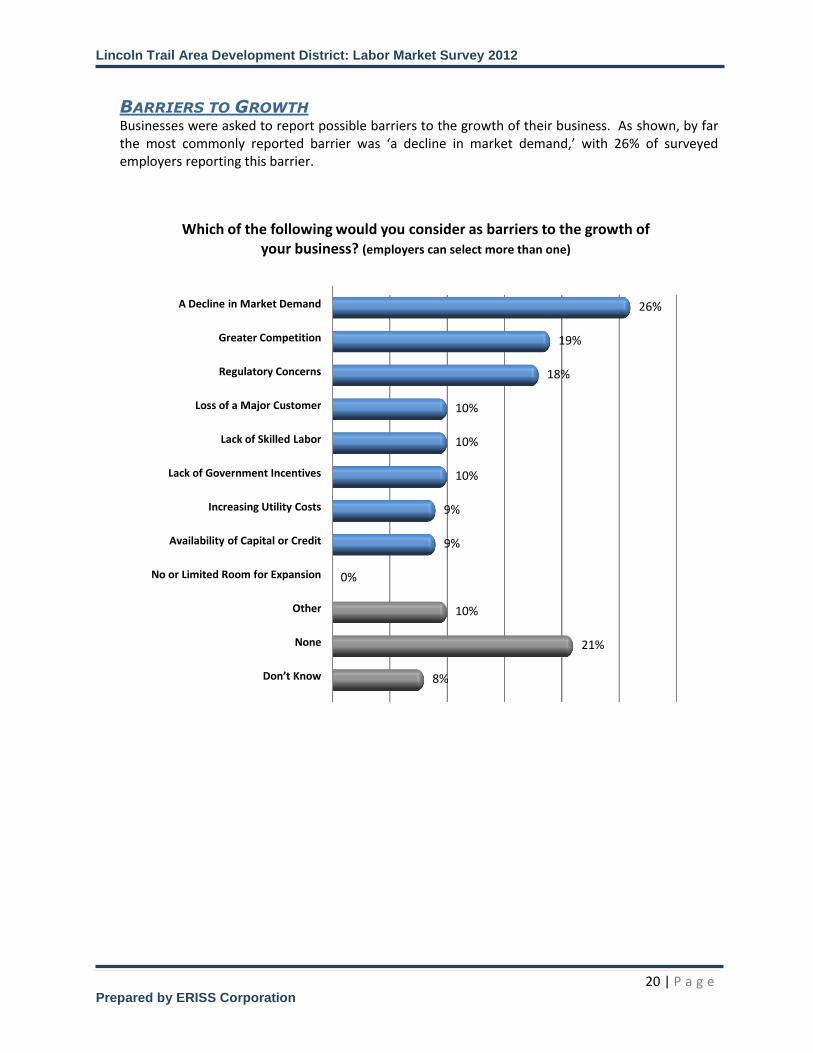
BARRIERS TO GROWTH Businesses were asked to report possible barriers to the growth of their business. As shown, by far the most commonly reported barrier was ‘a decline in market demand,’ with 26% of surveyed employers reporting this barrier.
26%
19%
18%
10%
10%
10%
9%
9%
0%
10%
21%
8%
A Decline in Market Demand
Greater Competition
Regulatory Concerns
Loss of a Major Customer
Lack of Skilled Labor
Lack of Government Incentives
Increasing Utility Costs
Availability of Capital or Credit
No or Limited Room for Expansion
Other
None
Don’t Know
Which of the following would you consider as barriers to the growth of your business? (employers can select more than one)
Lincoln Trail Area Development District: Labor Market Survey 2012
21 | P a g e Prepared by ERISS Corporation
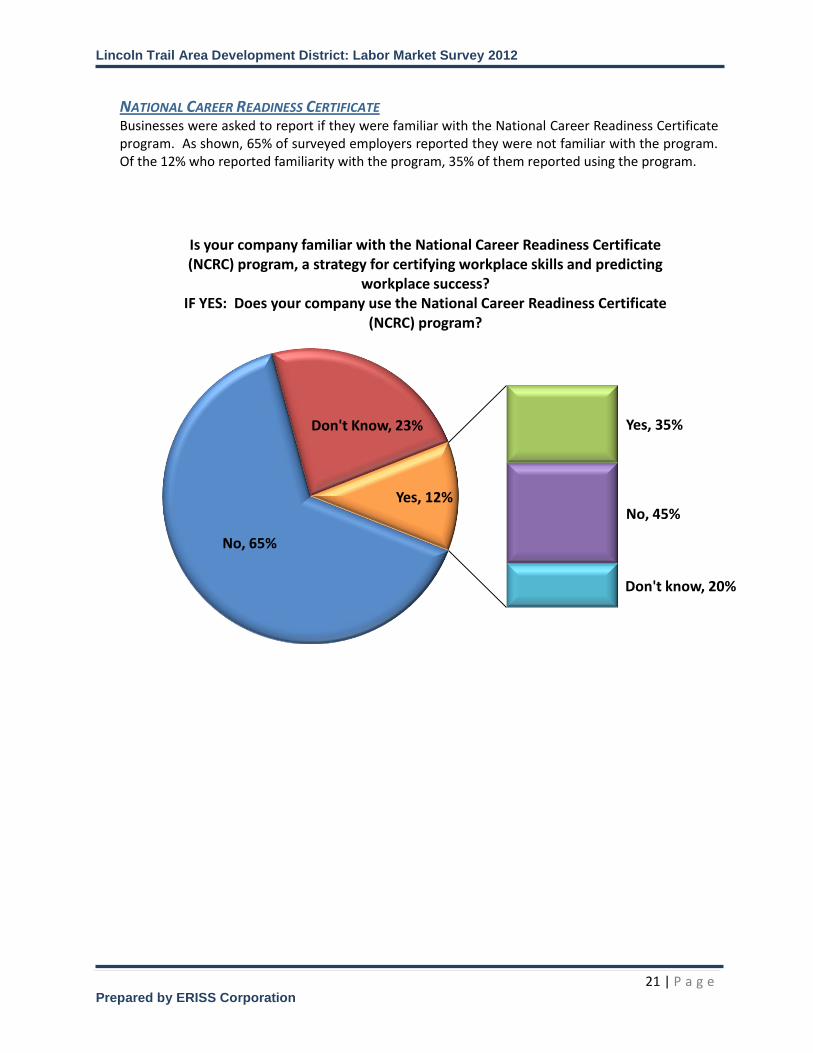
NATIONAL CAREER READINESS CERTIFICATE Businesses were asked to report if they were familiar with the National Career Readiness Certificate program. As shown, 65% of surveyed employers reported they were not familiar with the program. Of the 12% who reported familiarity with the program, 35% of them reported using the program.
No, 65%
Don't Know, 23% Yes, 35%
No, 45%
Don't know, 20%
Yes, 12%
Is your company familiar with the National Career Readiness Certificate (NCRC) program, a strategy for certifying workplace skills and predicting
workplace success? IF YES: Does your company use the National Career Readiness Certificate
(NCRC) program?

Lincoln Trail Area Development District: Labor Market Survey 2012
22 | P a g e Prepared by ERISS Corporation
HIRING SPECIAL POPULATIONS Employers were asked to report if they would consider hiring qualified candidates from a number of categories. As shown, 88% of surveyed employers reportedly would hire Veterans, 81% would hire Dislocated Workers, 78% would hire Persons with Disabilities, and 52% would hire Former Offenders.
88%
81%
78%
52%
55%
Veterans
Dislocated Workers
Persons with Disabilities
Former Offenders
Don't Know
Would you consider hiring qualified candidates in any of the following categories? (select all that apply)

Lincoln Trail Area Development District: Labor Market Survey 2012
23 | P a g e Prepared by ERISS Corporation
COMMON DEFICIENCIES AMONG JOB APPLICANTS The most commonly reported deficiencies among recent job applicants were reported to be ‘Basic Work Ethic’ (49%), ‘Lack of Experience’ (30%), and ‘Communication Skills’ (27%).
49%
30%
27%
24%
21%
18%
9%
14%
0%
8%
0%
7%
Basic Work Ethic
Lack of Experience
Communication Skills
Failing Drug Screening
Failing Background Check
Technical Skills
Computer Skills
Math Skills
Reading Skills
Other
None
Don't Know
Which of the following are the most common deficiencies among recent job applicants? (select all that apply)
Lincoln Trail Area Development District: Labor Market Survey 2012
24 | P a g e Prepared by ERISS Corporation
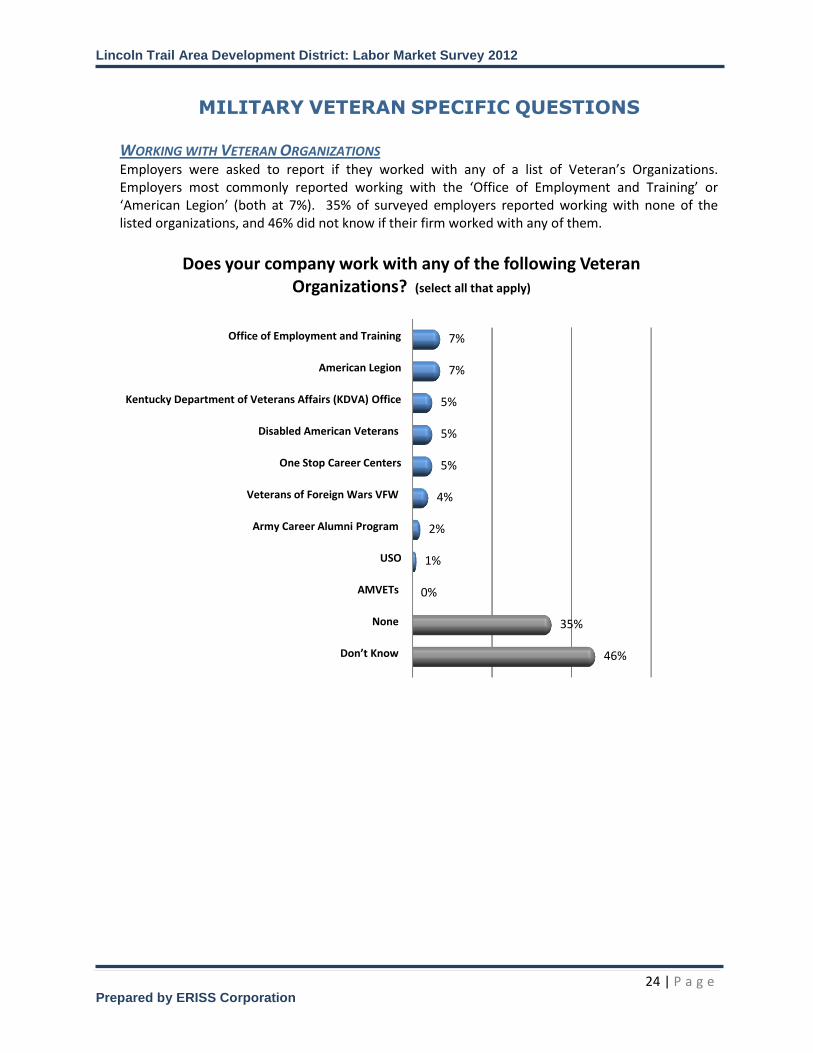
MILITARY VETERAN SPECIFIC QUESTIONS WORKING WITH VETERAN ORGANIZATIONS Employers were asked to report if they worked with any of a list of Veteran’s Organizations. Employers most commonly reported working with the ‘Office of Employment and Training’ or ‘American Legion’ (both at 7%). 35% of surveyed employers reported working with none of the listed organizations, and 46% did not know if their firm worked with any of them.
7%
7%
5%
5%
5%
4%
2%
1%
0%
35%
46%
Office of Employment and Training
American Legion
Kentucky Department of Veterans Affairs (KDVA) Office
Disabled American Veterans
One Stop Career Centers
Veterans of Foreign Wars VFW
Army Career Alumni Program
USO
AMVETs
None
Don’t Know
Does your company work with any of the following Veteran Organizations? (select all that apply)

Lincoln Trail Area Development District: Labor Market Survey 2012
25 | P a g e Prepared by ERISS Corporation
A) Awareness of Military Programs: 55% of survey employers reported they were aware of the
number of veterans employed by their company.
B) Company Hiring Programs for Veterans: 15% of employers reported their company had a hiring
program for veterans.
C) Leveraging Military Experience: 46% of employers reported that their company translated
military experience into terms relevant to the company’s needs.
D) Interest in Participation in a Region-wide Initiative: 29% of employers reported interest in
participating in a region-wide initiative around hiring military veterans.
Yes, 55%
No, 36% Don't
Know, 7%
A) Are you aware of the number of military veterans in
your company?
Yes, 15%
No, 72% Don't Know, 12%
B) Does your company have a program for hiring
military veterans?
Yes, 46%
No, 32%
Don't Know, 21%
C) Does your company translate military background
and experience into terms relevant to your company’s
needs?
Yes, 29%
No, 45%
Don't Know, 25%
D) Would you be interested in participating on a region-wide initiative around hiring
military veterans?

Lincoln Trail Area Development District: Labor Market Survey 2012
26 | P a g e Prepared by ERISS Corporation
APPENDIX A: SURVEY QUESTIONS
Contact Verification
1.) Currently, how many employees do you have at this location? 2.) How many do you expect to have at this time next year?
3.) May I have your name? 4.) May I have your title? 5.) Email collection
Staffing Questions
6.) How many <occupation> do you have? 7.) How many will you need to hire in the next 90 days? 8.) How many do expect to have at this time next year?
9.) What is the annual turnover for this occupation?
Occupational Specific Questions
10.) How long does it take to fill a vacancy for an experienced
<occupation>? Less than 2 weeks Two to 4 weeks
1-3 months 3-6 months
More than 6 months Don’t know Don't hire experienced
11.) How long does it take to fill a vacancy for a non-experienced
<occupation>? Less than 2 weeks Two to 4 weeks
1-3 months 3-6 months
More than 6 months Don’t know Don't hire non-experienced

Lincoln Trail Area Development District: Labor Market Survey 2012
27 | P a g e Prepared by ERISS Corporation
12.) How much work experience do you require for this occupation?
None Under 3 months
3 to under 6 months 6 months to under 12 months 1 to under 2 years
2 to under 4 years 4 to under 10 years
10 years or more Don’t know
13.) Do you require an occupational license or certification for this occupation? Yes
No Don’t know
14.) What is the PREFERRED education level for this occupation? None
High school/GED Some college
Associate degree BS/BA Graduate degree or above
Don’t know
15.) For this occupation, do you employ?
Temporary workers: Yes No Don’t know
High school students: Yes No Don’t know
Part Time: Yes No Don’t know
Seasonal: Yes No Don’t know
Interns/apprentice: Yes No Don’t know
Welfare-to-Work participants: Yes No Don’t know
Workers ages 14-21 Yes No Don’t know

Lincoln Trail Area Development District: Labor Market Survey 2012
28 | P a g e Prepared by ERISS Corporation
16.) Which of the following recruitment methods have been effective for
<occupation>? Please answer Yes or No as I read the options. Newspaper
Hire from within Social Networking sites Referrals/word-of-mouth
Unsolicited walk-ins Local One-Stop Centers /State employment services
School placement offices Recruiters
Internet Job Boards Other None
Don’t know
17.) What standard employee benefits do you provide for this occupation? Please answer Yes or No as I read the options.
Medical
Dental Pension program
401k SAR/SEP (401K program for small businesses) Stock options Paid Vacations and Holidays
Tuition reimbursement Child care
Other None Don’t Know
18.) What is the starting salary range for a NON-EXPERIENCED
<occupation>?
19.) What is the starting salary range for EXPERIENCED <occupation>?
Lincoln Trail Area Development District: Labor Market Survey 2012
29 | P a g e Prepared by ERISS Corporation
Supplemental Survey Questions NON-OCCUPATION Specific
1. In the next 12 months, is your company considering any of the following? Note: this is a multiple choice answer set; employers can select more than one
response
Expanding Downsizing Relocating outside of the County
Closing None / No change
Don’t know
2. If the respondent selects from question number 1, “Downsizing” or “Closing”,
we will ask… You stated that you were considering Downsizing or Closing, other than the current economic conditions, would that be because of….
Availability of Credit Cost of doing Business
Tax Competitiveness Insufficient Room for Expansion
Regulatory Concerns Lack of Skilled Labor
Affordable Housing for Employees Traffic Congestion Other
Don’t Know
3. If the respondent selects from question number 1, “Expanding”, we will ask… You stated that you were considering Expanding in the next 12 months, which of the following would help you with your expansion…
New or Additional Space
Equipment Availability of Credit Help with Recruiting and Hiring
Staff Training New or Upgrade your Information Technology
Increased Visibility in the Marketplace Other None
Don’t Know

Lincoln Trail Area Development District: Labor Market Survey 2012
30 | P a g e Prepared by ERISS Corporation
4. Which of the following would you consider as barriers to the growth of your
business? Note: this is a multiple choice answer set; employers can select more than one response
A Decline in Market Demand Greater Competition
Loss of a Major Customer Increasing Utility Costs Lack of Skilled Labor
Availability of Capital or Credit No or Limited Room for Expansion
Lack of Government Incentives Regulatory Concerns Other
None Don’t Know
5. Is your company familiar with the National Career Readiness Certificate (NCRC)
program, a strategy for certifying workplace skills and predicting workplace success?
Yes No
Don’t Know
6. If the respondent selects from question number 5 above, “Yes”, we will ask…
Does your company use the National Career Readiness Certificate (NCRC) program?
Yes
No Don’t Know
7. Would you consider hiring qualified candidates in any of the following categories? .
Veterans Former Offenders Persons with Disabilities

Lincoln Trail Area Development District: Labor Market Survey 2012
31 | P a g e Prepared by ERISS Corporation
8. Which of the following are the most common deficiencies among recent job applicants? Please select all that apply…
Communication Skills
Technical Skills Math Skills Reading Skills
Computer Skills Basic Work Ethic
Lack of Experience Failing Background Check
Failing Drug Screening Other None
Don't Know
9. The following questions are Military Veteran related. Does your company work with any of the following Veteran Organizations? Please answer Yes or No as I read the options.
Kentucky Department of Veterans Affairs (KDVA) Office
Office of Employment and Training American Legion Disabled American Veterans
Army Career Alumni Program Veterans of Foreign Wars VFW
One Stop Career Centers AMVETS USO
None Don’t Know
10.Are you aware of the number of military veterans in your company?
Yes No
Don’t Know

Lincoln Trail Area Development District: Labor Market Survey 2012
32 | P a g e Prepared by ERISS Corporation
11.Does your company have a program for hiring military veterans?
Yes No
Don’t Know
12.Does your company translate military background and experience into terms relevant to your company’s needs?
Yes
No Don’t Know
13.Would you be interested in participating on a region-wide initiative around hiring military veterans?
Yes
No Don’t Know
14.What would you say are some of the reasons local employers are not hiring
Veterans?