LINC Commission Meeting - Squarespacestatic1.squarespace.com/.../commission-booklet-201604.pdfLINC...
48
LINC Commission Meeting April 18, 2016 (below) Bill Dent, Executive Director of The Family and Community Trust (FACT), announces the release of the 2016 Missouri KIDS COUNT Data Book. The book is available at mokidscount.org
Transcript of LINC Commission Meeting - Squarespacestatic1.squarespace.com/.../commission-booklet-201604.pdfLINC...

LINC Commission MeetingApril 18, 2016
(below) Bill Dent, Executive Director of The Family and Community Trust (FACT), announces the release of the 2016 Missouri KIDS COUNT Data Book. The book is available at mokidscount.org

Local Investment Commission (LINC) Vision
Our Shared Vision
A caring community that builds on its strengths to provide meaningful opportunities for children, families and individuals to achieve self-sufficiency, attain their highest potential, and contribute to the public good.
Our Mission
To provide leadership and influence to engage the Kansas City Community in creating the best service delivery system to support and strengthen children, families and individuals, holding that system accountable, and changing public attitudes towards the system.
Our Guiding Principles
1. COMPREHENSIVENESS: Provide ready access to a full array of effective services. 2. PREVENTION: Emphasize “front-end” services that enhance development and prevent
problems, rather than “back-end” crisis intervention. 3. OUTCOMES: Measure system performance by improved outcomes for children and families, not
simply by the number and kind of services delivered. 4. INTENSITY: Offering services to the needed degree and in the appropriate time. 5. PARTICIPANT INVOLVEMENT: Use the needs, concerns, and opinions of individuals who use
the service delivery system to drive improvements in the operation of the system. 6. NEIGHBORHOODS: Decentralize services to the places where people live, wherever appropriate,
and utilize services to strengthen neighborhood capacity. 7. FLEXIBILITY AND RESPONSIVENESS: Create a delivery system, including programs and
reimbursement mechanisms, that are sufficiently flexible and adaptable to respond to the full spectrum of child, family and individual needs.
8. COLLABORATION: Connect public, private and community resources to create an integrated service delivery system.
9. STRONG FAMILIES: Work to strengthen families, especially the capacity of parents to support and nurture the development of their children.
10. RESPECT AND DIGNITY: Treat families, and the staff who work with them, in a respectful and dignified manner.
11. INTERDEPENDENCE/MUTUAL RESPONSIBILITY: Balance the need for individuals to be accountable and responsible with the obligation of community to enhance the welfare of all citizens.
12. CULTURAL COMPETENCY: Demonstrate the belief that diversity in the historical, cultural, religious and spiritual values of different groups is a source of great strength.
13. CREATIVITY: Encourage and allow participants and staff to think and act innovatively, to take risks, and to learn from their experiences and mistakes.
14. COMPASSION: Display an unconditional regard and a caring, non-judgmental attitude toward, participants that recognizes their strengths and empowers them to meet their own needs.
15. HONESTY: Encourage and allow honesty among all people in the system.

Monday, April 18, 2016 | 4 – 6 pm Kauffman Foundation 4801 Rockhill Rd. Kansas City, Mo. 64110
Agenda
I. Welcome and Announcements
II. Approvals
a. March minutes (motion)
III. Superintendents Report
IV. Missouri Kids Count Data Book a. Bill Dent, Executive Director, Family and Community Trust
b. Child Advocacy Day (Jefferson City)
V. LINC 2016 Summer Programming
a. LINC Kansas City Public School Summer School
b. Other Districts
VI. The Hero Project – Gladstone Elementary
VII. Update Reports a. International Day of the Child (Independence) b. LINC Data System Update c. Community Schools National Forum d. Bert Berkley UMKC Urban Education Award
VIII. Adjournment

THE LOCAL INVESTMENT COMMISSION – MARCH 21, 2016
The Local Investment Commission met at the Kauffman Foundation, 4801 Rockhill Rd., Kansas City,
Mo. Co-chair Bailus Tate presided. Commissioners attending were:
Bert Berkley
Sharon Cheers
Steve Dunn
Mark Flaherty
Rob Givens
Anita Gorman
Sly James
Tom Lewin
Rosemary Lowe
Mary Kay McPhee
David Rock
David Ross
A motion to approve the minutes of the Feb. 16, 2016, LINC Commission meetings was approved
unanimously.
Kansas City Mayor Sly James gave a presentation on the city earnings tax, which has been a major
source of city government revenue since it was implemented in 1963. Since Missouri voters approved
Proposition A in 2010 the earnings tax comes up for renewal by Kansas City voters every four years. The
question will be on the April 5 ballot this year. James urged support of the earning tax renewal.
Discussion followed.
Hickman Mills School District superintendent Dennis Carpenter gave a presentation on a $19 million
no-tax-increase bond issuance that district voters will be asked to approve at the April 5 election. The
bond would be used to finance projects including: moving Smith-Hale Middle School to the Freshman
Center; additions and improvements to Ruskin High School; expansion of Baptiste Educational Center
and Administrative Center; and improvements to elementary schools.
Superintendents’ Report
John Ruddy (Asst. Supt., Fort Osage School District) reported the district Project Lead the Way
team has qualified to be in the regional tournament in St. Louis. The district is developing a new
master plan, its first since 2005, to address education and program needs as well as deferred
maintenance.
Kevin Foster (Executive Director, Genesis Promise Academy) reported the Jackson County
Mental Health Board has approved the assignment of mental health social workers to the school.
April 16: the school will hold a spring clean-up event. April 26: Celebrate Character Day will
recognize community members and students. May 13-14: annual tennis tournament and
fundraiser.
Kenny Rodrequez (Asst. Supt., Grandview School District) reported the district is preparing for
MAP testing and summer school.
Dred Scott (Asst. Supt., Independence School District) reported on several efforts to engage
students and families including the Camp Out with a Good Book event Feb. 25 at Benton
Elementary and the recent LINC Chess tournament. Thanks to support of LINC site coordinator
Jennifer Stone Manulelula, Fairmount Eleemntary is expected to receive a Missouri Preschool
grnat of $230,000. April 27: the fourth annual Hispanic Family Resource Night at Van Horn High
School. May 7: Dia del Nino highlighting the diversity of Independence families’ cultures and
countries.
Allan Tunis (Interim Supt., Kansas City Public Schools) introduced Trailwoods Elementary
principal Christy Harrison, who will lead the district’s summer program. The district has been
meeting with labor unions to seek ways to engage students who may be interested in pursuing
careers in the construction industry; the initiative came about in response to a the topic which was
2
raised by LINC Commissioner Steve Dunn at a recent LINC Commission meeting. The district is
in the process of implementing its transition plan to ensure all items of the master plan are
included. The district’s website is being upgraded.
Steve Meyers (Executive Director of Operations, Hickman Mills School District) reported there
will be a $19 million bond issue on the April ballot. The district is currently making building
improvements through a $14 million performance contract.
Paul Harrell (Chief Financial Officer, North Kansas City School District) reported new Dan
Clemens will begin as superintendent on July 1. The district is getting ready for MAP testing and
working with legislators on school funding needs. The district is planning to upgrade its bus fleet
by leasing 124 compressed natural gas busses.
Oscar Tshibanda of Tshibanda & Associates gave a progress report on implementation of the new
Apricot data system including project timeline and user training, and Caring Communities sites now using
the system; the next phase will add site flyer request functionality, support management of the Summer
Electronic Benefit Transfer for Children program, and support the Missouri Star School initiative. Gayle
Hobbs reported that a Data and Evaluation Committee is being assembled and Commissioners should let
her know if they are interested in joining.
LINC Deputy Director-Community Engagement Brent Schondelmeyer reported on the following:
Open eBooks, a project by First Book, Baker & Taylor, New York Public Library, and Digital
Public Library of America that will allow students to borrow digital books for free.
Hero Project celebration at Gladstone Elementary on April 1 in honor of Landon Rowland.
Hobbs encouraged people to fill out memory cards. A video on the project was shown.
Parent University held on March 1 at the Hickman Mills Freshman Center providing parents the
opportunity to attend two seminars on topics of their choosing related to their child’s education
and school curriculum. A video was shown.
Mark Flaherty presented a photo of Landon Rowland that was taken by Dr. Charlie Porter during
Rowland’s October 2015 presentation at the National World War I Museum. The photo is a gift to LINC.
The meeting was adjourned.
3

• 3418 Knipp Drive, Suite A-2 • Jefferson City, Missouri 65109 • 573.526.3581 • Fax: 573.526.4814 • www.mofact.org
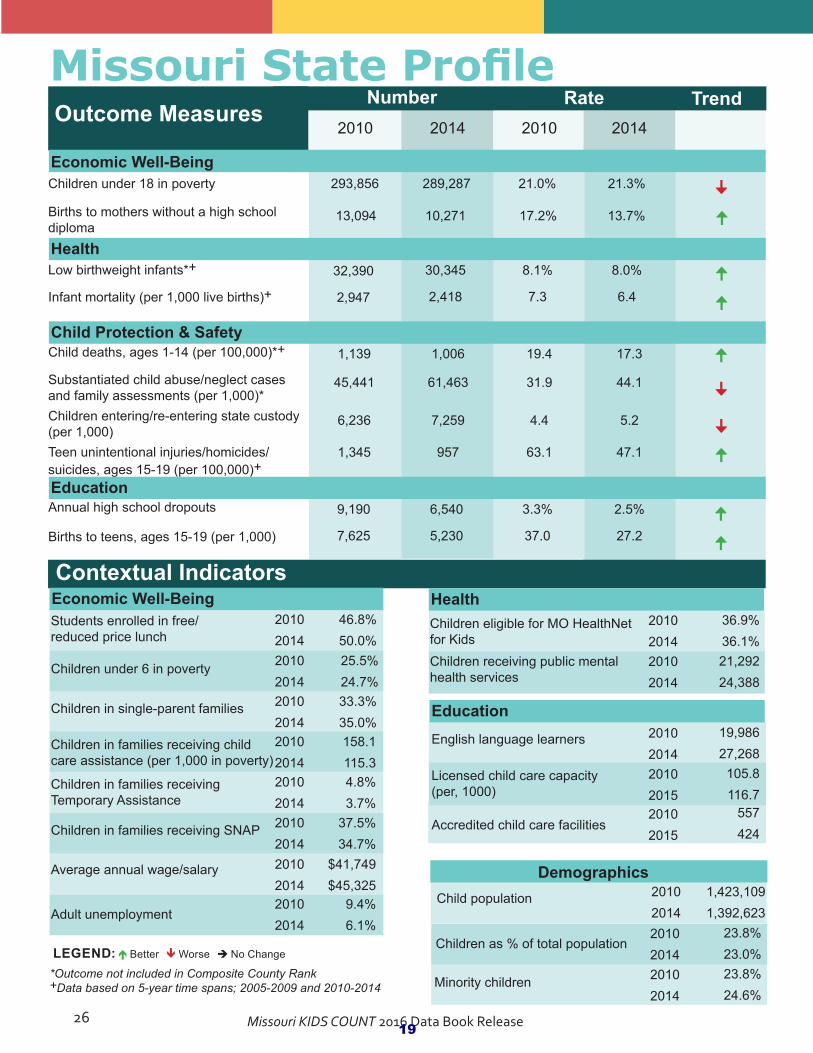
For immediate release: 2:00pm April 5, 2016 Contact: Bill Dent, The Family and Community Trust Phone: (573) 526-3581 Email: [email protected] Contact: Tracy Greever-Rice, Office of Social and Economic Data Analysis Phone: 573-884-5116 Email: [email protected] JEFFERSON CITY, MO – The lingering effects of the Great Recession continue to be felt by Missouri’s children and families according to the 2016 Release of the Missouri KIDS COUNT (MKC) Databook, announced today by the Family and Community Trust (FACT). The new databook shows that more than one in five children in Missouri, 21.3% or nearly 289,000, live in poverty, representing a 1.4% increase in child poverty from 2010 to 2014. However, other indicators helpful in predicting poverty are nudging upward. Births to mothers without a high school diploma, a reliable predictor of persistent poverty, has improved in Missouri, with the percent of children born to such moms decreasing from approximately 17% to slightly less than 14%. The report provides an annual, state and county-level analysis of child well-being measuring indicators of Economic Security, Child Protection and Safety, Education and Health. “The well-being of Missouri’s children and families frames the core of our work,” said Bill Dent, FACT Executive Director. “The ability of our Community Partnerships and other child focused organizations to have relevant, reliable data is critical for them to be successful in their efforts. All of this helps communities better prioritize issues and develop practical initiatives to ensure that children are healthy, secure and prepared to flourish as they mature.” To examine trends over time, MKC compared current 2014 data to the 2010 baseline data, which revealed that seven outcome measures improved in Missouri during this time period including: births to teens, teen unintentional injury/homicides/suicides, annual high school dropouts, births to mothers without a high school diploma, infant mortality, child deaths and low birthweight infants. Outcomes that worsened between 2010 and 2014 include: children under 18 in poverty, child abuse/neglect and family assessments and children entering/re-entering state custody.
Board of Directors Steve Renne Co-Chair Vice President MO Hospital Association
Brian Kinkade Co-Chair Director Dept. of Social Services
Lowell Kruse Senior Fellow Heartland Foundation
Roseann Bentley Associate Commissioner Greene County
Ann Covington Chief Justice MO Supreme Court (Ret) Of Counsel Bryan Cave
Jack Craft Senior Attorney Lathrop & Gage
Peter Lyskowski Acting Director Dept. of Health and Senior Services
Lane Roberts Director Dept. of Public Safety
George Lombardi Director Dept. of Corrections
Michael A. Middleton Interim President UM System
Margie Vandeven Commissioner Dept. of Elementary and Secondary Education
Mike Downing Director Dept. of Economic Development
Loretta Prater Ret. Dean Emeritus Southeast Missouri State University
Ryan McKenna Director Dept. of Labor and Industrial Relations
David Russell Commissioner Dept. of Higher Education
Mark Stringer Director Dept. of Mental Health
Kathryn Swan President JCS wireless
Blanche Touhill Chancellor Emeritus University of Missouri- St. Louis
Bailus Tate Black Economic Union of Greater Kansas City
Bill Dent Executive Director
4

• 3418 Knipp Drive, Suite A-2 • Jefferson City, Missouri 65109 • 573.526.3581 • Fax: 573.526.4814 • www.mofact.org
According to the 2014 data, 1.39 million children under age 18 live in Missouri; nearly one-third (32.1%) are children under age 6; children of color make up nearly one-quarter (24.6%) of the child population; and over one-third (35%) of children live in single-parent families, up from 33.3% in 2010. “By highlighting trends across time and between geographic areas, the MKC report provides policymakers and advocates with the crucial information they need to make informed decisions regarding how best to support the well-being of children across the state,” said Tracy Greever-Rice, Interim Director of the Office of Social and Economic Data Analysis at the University of Missouri. Additional new data sets will be added to the MKC Databook in the future to support changes in the way data are collected, and to continue show an accurate description of child well-being in Missouri. Missouri KIDS COUNT is an initiative of The FACT, a long standing organization with a commitment to improving child well-being in Missouri. The FACT is made up of a public-private board and 20 Community Partnerships working across Missouri on programs aiming to improve family and child outcomes. The FACT is in its third year as the Annie E. Casey Foundation KIDS COUNT grantee in Missouri, and the 2016 Release of the MKC Databook is the first as that affiliation. The 2016 Release of the MKC Databook was produced in partnership with the Office of Social and Economic Data Analysis (OSEDA), the Children’s Trust Fund (CTF) and the Center for Family Policy and Research at the University of Missouri. For more information or to download the full 2016 Release of the MKC Databook visit mokidscount.org.
5
Missouri KIDS COUNT 2016 Data Book Release 16

Missouri KIDS COUNT 2016 Data Book Release8
Why Community Matters“It’s going to take individuals, and communities, and systems working together collectively to do this. And that’s a paradigm shift.”
—Bethany Johnson-Javois,Managing Director of the Ferguson Commission
This is the first data book released by the Family and Community Trust (FACT), the Missouri KIDS COUNT partner to the Annie E. Casey Foun-dation (AECF). The FACT is built on a foundation of 20 Community Partnerships, linked closely to state government leadership, which share the commitment of developing solutions to improve the lives of children and families in Missouri.
During the time since the last Missouri KIDS COUNT data book was published, community played a major role on the national stage and as a catalyst for conversation in Missouri news and events. It is the growing attention focused on communities and the new Missouri KIDS COUNT organization that centers on community that persuaded us to title the narrative backdrop for this data book Why Community Matters.
Today it is said that a person’s zip code is a stronger predictor of health and future success than their DNA. Research suggests that children are particularly vulnerable to their surroundings and to disadvantaged social environments. We know that the percentage of children living in persistent poverty is increasing. For example, analyses of the Census Bureau’s American
Community Survey data have shown that the number of people living in high poverty neighborhoods (i.e., census tracts where the federal poverty rate is 40% or more) has nearly doubled nationally since 2000.1
Last year, one book in particular powerfully described the impact of community on children by analyzing changes to an Ohio community over the past 60 years—Our Kids: The American Dream in Crisis, by Robert D. Putnam.2 The community depicted by Putnam could be anywhere in Missouri. The world he described is at odds with what we want for our communities — the wealthy are better educated; they have community cohesion and resources; the “air bags deploy” when their kids get into trouble. Schools and communities are more fragmented and less inclusive than in days gone by. Those more fortunate are less likely to have first-hand knowledge of the lives of poor children and are less likely to see the growing opportunity gap.
As Richard Reeves pointed out, “With fewer social ties and connections between the haves and have-nots, it becomes harder for people to see themselves in the others’ shoes: the
1 Bishaw, A. (2014). Changes in areas with concentrated poverty: 2000 to 2010. US Census Bureau. Retrieved from http://www.cen-sus.gov/library/publications/2014/acs/acs-27.html2 Putnam, R. D. (2015). Our kids: The American dream in crisis. New York. Simon & Schuster. 3 Reeves, R. (2015, May 14). Question: Is poverty an economic or cultural problem? Answer: Yes. The Brookings Institution. Retrieved from http://www.brookings.edu/blogs/social-mobility-memos/posts/2015/05/14-poverty-economics-culture-reeves
7
Missouri KIDS COUNT 2016 Data Book Release 9
economic gap becomes an empathy gap. When social ties weaken, stereotypes flourish.”3
Missouri played a prominent role in the conversation about community when the protests in Ferguson led national news during the summer of 2014. Ferguson’s struggles, as a suburban community, are shared by many communities surrounding large cities across the country. The events in Ferguson exposed the gaps, the isolation, and the fragmentation in our communities. “Ferguson can and should represent a collective awakening to the issues that many in our region knew and understood, but for many others were invisible. Now they are not” (The Ferguson Commission).4
The FACT Community partnerships, along with many other less heralded community builders, are busy working to bridge the gaps and strengthen social bonds in Missouri—they are rebuilding one family, one neighborhood, one community at a time. Improving children’s lives requires people to understand the challenges and changes faced by their communities. The FACT, as the governance organization for Missouri KIDS COUNT, is committed to advocating for community-level change, by using its resources to provide relevant and understandable social data for Missouri communities.
Family and Community Trust (FACT) HistoryIn the 1990s with what has been described as “a rare vision and a risk-taking spirit,” a group of state agency leaders sowed the seeds, set the ground rules, and made a commitment that continues today. The initiative was rooted in flexibility in processes, simplification of budgeting, and relinquishing centralized control, with the goal that local leaders could
offer programs reflecting the needs and values of the community. This shift in thinking grew out of concerns that communities were being undermined by large social problems that were diminishing agency budgets. The only way to make a lasting impact was to partner with communities around collective improvement. Working through the red tape, navigating systems, easing and surmounting boundaries and instructing everyone involved to “just make it happen,” created some flexibility in the state bureaucracy. Caring Communities had its start in St. Louis in 1989, built around the Walbridge Elementary School. Five months later a Caring Communities project expanded to the counties of Knox and Schuyler in the northeast region of the state.
In November 1993, Executive Order (93-43) was signed by Governor Mel Carnahan, creating a new alliance to further the collaborative efforts of state agencies. At the core of the Executive Order was the establishment of the Family Investment Trust (FIT) for the purpose of promoting collaboration and innovation in service delivery for Missouri’s children and families. It called for changes in how and where services were delivered, and it also mandated that local decision-making be utilized in the process. FIT was purposefully staffed with leaders from state departments, along with corporate and civic community leaders from around the state, to form a policy-setting body serving as the vehicle for collaborative decision-making and for technical assistance guiding the work of the Caring Communities. The Trust’s goal was and remains to achieve better results for children and families by revamping the way services are delivered, decisions made, and dollars spent.
In 2001, Executive Order (01-07) was signed by Governor Bob Holden, which changed the name
4 The Ferguson Commission (2015). Forward through Ferguson: A path towards racial equity. Retrieved from http://forward-throughferguson.org/report/executive-summary/
8

Missouri KIDS COUNT 2016 Data Book Release10
FIT to the Family and Community Trust (FACT). In the years that followed, 21 Caring Community organizations would expand into all corners of the state, as well as the three large metropolitan areas, to implement this new collaborative approach with state agencies serving children and families. The organizations involved shared six common core areas: Parents Working, Children Safe, Children Ready to Enter School, Children and Families Healthy, Children and Youth Succeeding in School, and Youth Ready to Enter the Workforce.
Since 2003, the FACT has been a non-profit corporation. Its 19-member Board reflects a unique and effective membership of executive leadership representing nine state agencies, and it includes top leaders from the private, civic, and education sectors. The FACT Board governs the work of the now 20 Community Partnerships (formerly Caring Communities). The FACT Board’s membership is a model for public-private leadership. The directors from the Departments of Elementary and Secondary Education, Higher Education, Health and Senior Services, Social Services, Mental Health, Labor, Corrections, Economic Development, and Public Safety come together four times a year, along with their private sector counterparts and the Community Partnerships, to learn, dialogue, and collaborate, solely focused on improving the lives of children and families.
The 20 Community Partnerships, employing 1,378 staff, range from large urban non-profits to small staffed non-profits in rural locations. They are each guided by a local Board, totaling 266 citizen members around the state, who help them set the agenda for how to best improve the lives of the community’s children and families. The average tenure of a Partnership Executive Director is 10.5 years; in total they account for 211 years of combined leadership experience embedded in the communities they serve. In 2015, the Partnerships served approximately 534,123 Missourians, relied on 264,974 volunteer
hours, and garnered over $4.5 million in other local investments throughout the state.
From the first release of The Missouri KIDS COUNT Data Book in 1993, the Community Partnerships have utilized data effectively out of necessity, like many other non-profit service organizations, relying on funding sources that require results. In 2014, the FACT applied to the AECF to become the KIDS COUNT affiliate in Missouri, primarily because the work of a KIDS COUNT organization directly aligned with the mission and purpose of the FACT and its network of Community Partnerships. The FACT and the Community Partnerships offer what few other non-profits can to this role—sustainability, statewide reach, committed resources, and top-level state agency leadership buy-in and membership.
The FACT is now in its third year as the AECF KIDS COUNT grantee showcasing a model that relies on the Board’s membership, particularly the state agency leaders and policymakers who collaborate across agencies to benefit children, and on the Partnerships as the community-based advocates who highlight what works, offer direct links to children’s lives and stories, and educate policymakers and lawmakers. Their experience and commitment are reflected in the programs and successes highlighted in the story boxes throughout the data book, serving as prime examples of why community matters.
The Value of CommunityAs illustrated by the Partnership stories and data presented throughout this data book, community involvement is crucial for addressing social issues that affect children because no one else can better identify and understand the challenges and needs of a community than its own members. Community involvement also provides local control to communities to prioritize the challenges and needs they deem
9
Missouri KIDS COUNT 2016 Data Book Release 11
most important. In addition, involving community representatives can result in more effective prevention and intervention programs as they will be based on a more in-depth understanding of contextual and sociocultur-al factors of which state-level decision makers might not be aware. Community representatives can also pre-assess programs before they are implemented on a larger scale, thus allowing for an informed approach to solving potential issues. This bottom-up approach empowers communities by encouraging them to take ownership of the programs they help to develop, which, in turn, has a positive impact on program sustainability. Community representatives can also act as stakeholders, overseeing and ensuring that the challenges and needs of their respective communities are addressed.
Accurate, timely data represent a fundamental tool for the development and evaluation of programs and policies created to address the needs and challenges in a community. Statistics, facts, and figures can all inform the initial stages of program development by providinginformation about the scope and depth of the issues at hand. A systematic collection of data also allows for the evaluation of the impact of programs by providing a quantitative estimate or a qualitative account of factors that improved or worsened as a result of program efforts. In addition, when data are collected repeatedly over various time points, with appropriate study designs, they can be used to evaluate the effectiveness of programs and policy intervention efforts, as well as factors that may account for changes over time.
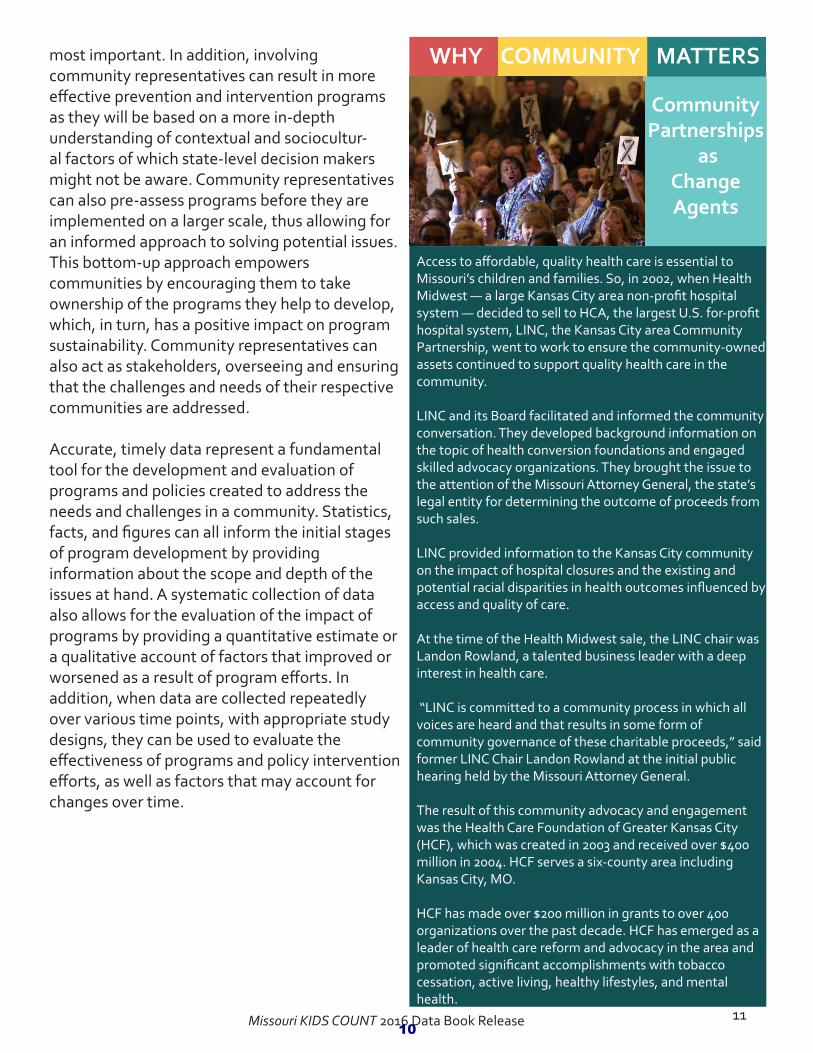
Access to affordable, quality health care is essential to Missouri’s children and families. So, in 2002, when Health Midwest — a large Kansas City area non-profit hospital system — decided to sell to HCA, the largest U.S. for-profit hospital system, LINC, the Kansas City area Community Partnership, went to work to ensure the community-owned assets continued to support quality health care in the community.
LINC and its Board facilitated and informed the community conversation. They developed background information on the topic of health conversion foundations and engaged skilled advocacy organizations. They brought the issue to the attention of the Missouri Attorney General, the state’s legal entity for determining the outcome of proceeds from such sales.
LINC provided information to the Kansas City community on the impact of hospital closures and the existing and potential racial disparities in health outcomes influenced by access and quality of care. At the time of the Health Midwest sale, the LINC chair was Landon Rowland, a talented business leader with a deep interest in health care.
“LINC is committed to a community process in which all voices are heard and that results in some form of community governance of these charitable proceeds,” said former LINC Chair Landon Rowland at the initial public hearing held by the Missouri Attorney General.
The result of this community advocacy and engagement was the Health Care Foundation of Greater Kansas City (HCF), which was created in 2003 and received over $400 million in 2004. HCF serves a six-county area including Kansas City, MO.
HCF has made over $200 million in grants to over 400 organizations over the past decade. HCF has emerged as a leader of health care reform and advocacy in the area and promoted significant accomplishments with tobacco cessation, active living, healthy lifestyles, and mental health.
CommunityPartnerships
as ChangeAgents
WHY COMMUNITY MATTERS
10
Missouri KIDS COUNT 2016 Data Book Release12
ConclusionThe FACT is uniquely situated as a model for bringing together state agency leadership and communities to participate in problem solving on behalf of our children. This work to improve the lives of children must be rooted in easy to understand, reliable, transparent, and persuasive data, leading to evidence-based programs and policies. Combining our focus on community as the medium for change, and using data as the essential tool, we must ensure that the Missouri KIDS COUNT Data Book is reflective of our model and values. In the coming year we will be working with our data and research partners to showcase new indicators that will improve our understanding of child well-being. To read more about the future Missouri KIDS COUNT indicators, see pages 65 - 67.
In addition to the data book, we will continue to offer feature articles on the Missouri KIDS COUNT website that showcase the intersection of cur-rent topics, data, and stories from communities. Visit http://mokidscount.org/stories/ for feature stories and infographics on school nurses, childhood asthma, immuniza-tions, poverty, and other relevant topics related to child well-being in Missouri.
We thank the Annie E. Casey Foundation for their commitment to and support of the new Missouri KIDS COUNT model.
Data Book Strengths and LimitationsThe data presented in this book provide a basic, yet essential, tool to examine the status of children in Missouri. The book includes important outcome measures organized in four domains (Economic Well-Being, Health, Child Protection and Safety, and Education), which are reported at the state and county levels. The data reported in the state and county profiles provide information about how the state and counties are doing as a whole and whether there are differences in each outcome measure from previous to present years. Such data can illustrate which counties may benefit from receiving more assistance and thus inform the allocation of state services and resources. These estimates can also inform state and countyefforts aimed at improving the quality of life for children throughout the state. In summary, the data presented in the Missouri KIDS COUNT Data Book provide a descriptive snapshot of children’s well-being at the state and county levels.
As with any other data source, the information presented in this book has some limitations that should be acknowledged. For example, reporting at the state and county level does not capture potential differences in child well-being across communities, neighborhoods, schools, or families. In addition, although the reported figures across years provides information on trends, further research is needed to identify the specific factors responsible for fluctuations. Moreover, the data reported in this book are drawn from multiple sources that differ in how data are gathered. It is possible that some subgroups are not adequately represented (including hard-to-reach populations such as undocumented immigrants and homeless families) or that the groups sampled from one year to the next are different. Given theselimitations, the numbers reported in this data book are intended to serve as discussion points
to draw attention to pressing issues affecting children in Missouri, augment other pertinent data, spur further research, and help develop more effective policies and intervention efforts.
Methodology
11
Missouri KIDS COUNT 2016 Data Book Release 15
Key Findings
Outcome Measures and Contextual Indicators
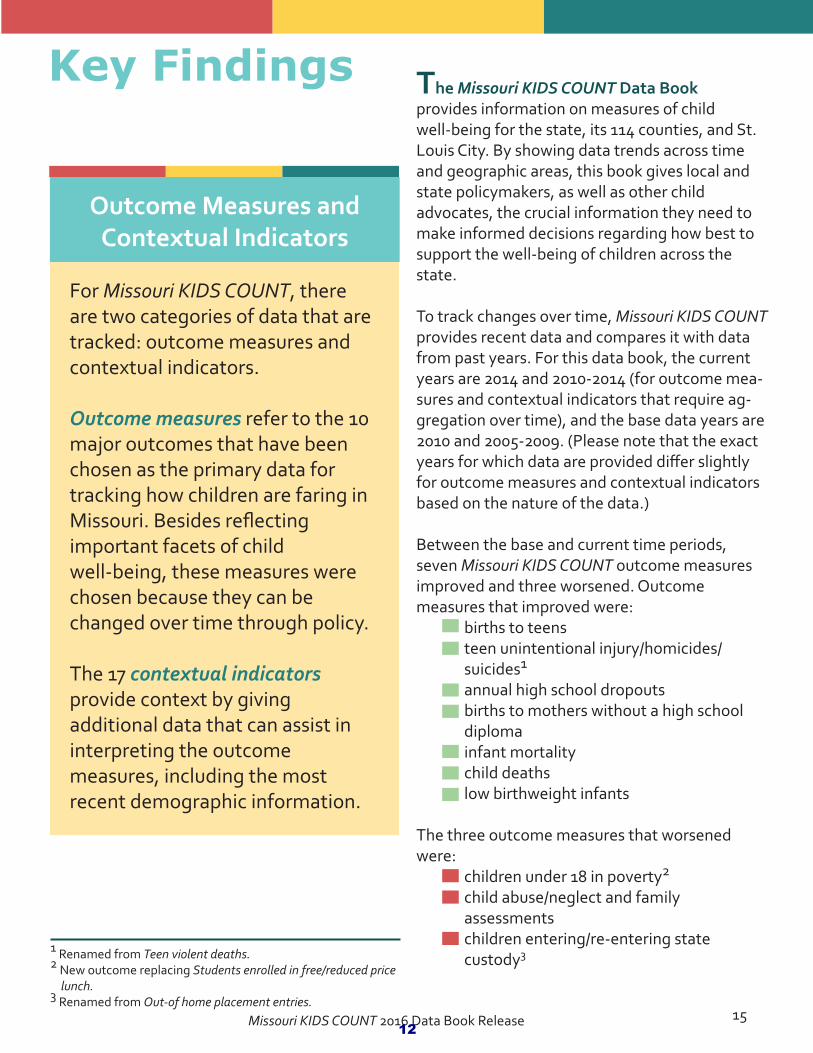
For Missouri KIDS COUNT, there are two categories of data that are tracked: outcome measures and contextual indicators.
Outcome measures refer to the 10 major outcomes that have been chosen as the primary data for tracking how children are faring in Missouri. Besides reflecting important facets of child well-being, these measures were chosen because they can be changed over time through policy.
The 17 contextual indicators provide context by giving additional data that can assist in interpreting the outcome measures, including the most recent demographic information.
The Missouri KIDS COUNT Data Book provides information on measures of child well-being for the state, its 114 counties, and St. Louis City. By showing data trends across time and geographic areas, this book gives local and state policymakers, as well as other child advocates, the crucial information they need to make informed decisions regarding how best to support the well-being of children across the state.
To track changes over time, Missouri KIDS COUNT provides recent data and compares it with data from past years. For this data book, the current years are 2014 and 2010-2014 (for outcome mea-sures and contextual indicators that require ag-gregation over time), and the base data years are 2010 and 2005-2009. (Please note that the exact years for which data are provided differ slightly for outcome measures and contextual indicators based on the nature of the data.)
Between the base and current time periods, seven Missouri KIDS COUNT outcome measures improved and three worsened. Outcome measures that improved were: births to teens teen unintentional injury/homicides/ suicides1 annual high school dropouts births to mothers without a high school diploma infant mortality child deaths low birthweight infants
The three outcome measures that worsened were: children under 18 in poverty2 child abuse/neglect and family assessments children entering/re-entering state custody3
1 Renamed from Teen violent deaths.2 New outcome replacing Students enrolled in free/reduced price lunch.3 Renamed from Out-of home placement entries.
12
Missouri KIDS COUNT 2016 Data Book Release16
Births to teens, ages 15-19 (per 1,000)
Teen unintentional injuries/homicides/suicides (per 100,000)
Annual high school dropouts
Births to mothers without a high school diploma
Infant mortality (per 1,000 live births)
Child deaths, ages 1-14 (per 100,000)
Low birthweight infants
Children under 18 in poverty
Children entering/re-entering state custody (per 1,000)
Substantiated child abuse/neglect cases and family assessments (per 1,000)
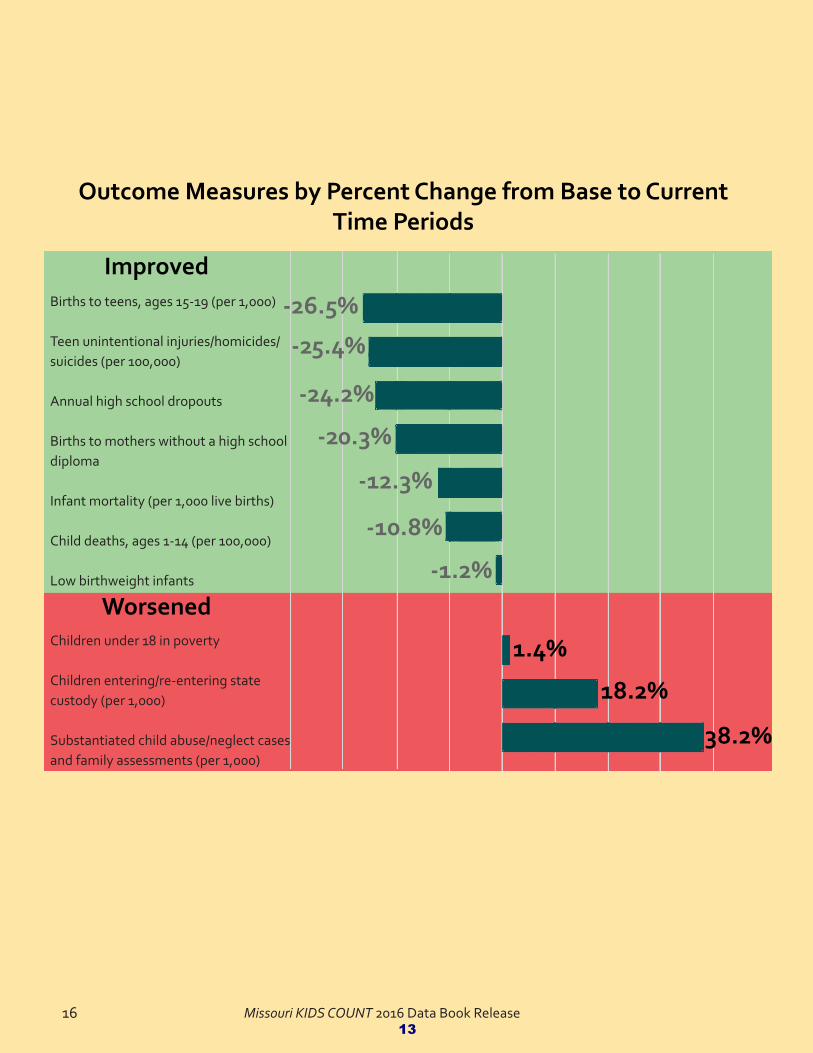
Outcome Measures by Percent Change from Base to Current Time Periods
-26.5%
-25.4%
-24.2%
-20.3%
-12.3%
-10.8%
-1.2%
1.4%
18.2%
38.2%
Improved
Worsened
Missouri KIDS COUNT 2016 Data Book Release1613
Missouri KIDS COUNT 2016 Data Book Release 17
38.2%
A summary of how children and families are doing based
on Missouri KIDS COUNT domains is provided in the
following sections.
Although the Great Recession technically lasted from December 2007 to June 2009,4 its lingering effects continue to be felt by many families, particularly those who live close to and below the poverty level. For 2014, the overall poverty rate for the U.S. and Missouri was 15.5%, which means that more than 1 in 7 people lived at or below the federal poverty threshold. The poverty rate for children under 18 and for children under 6 is even higher for both the state and nation.
Based on Missouri KIDS COUNT outcome measures and contextual indicators, the overall picture for the economic well-being of Missouri’s children and families was mixed. The trend for births to mothers without a high school diploma was positive, meaning that fewer children were born to young mothers who are more likely to struggle to provide the optimal care and support needed for children, especially during the earliest years. The primary poverty outcome measure, children under 18 in poverty, increased slightly (1.4%), whereas the contextual indicator children under 6 in poverty decreased slightly (-3.1%).
Services related to poverty also decreased from 2010 to 2014. Although the poverty rate changed relatively little between 2010 and 2014, families are using most services related to poverty much less in 2014 than 2010. This suggests that there may be other factors influencing their use of state-based services be-sides income level.
On the positive side, adult unemployment also decreased substantially in Missouri from 2010 to 2014, from 9.4% to 6.1%, a 35% decrease; the U.S. unemployment rate also decreased 35% during the same time period.
Economic Well-Being
4 National Bureau of Economic Research. (n.d.). US Business Cycle Expansions and Contractions. Retrieved January 6, 2016, from http://www.nber.org/cycles.html
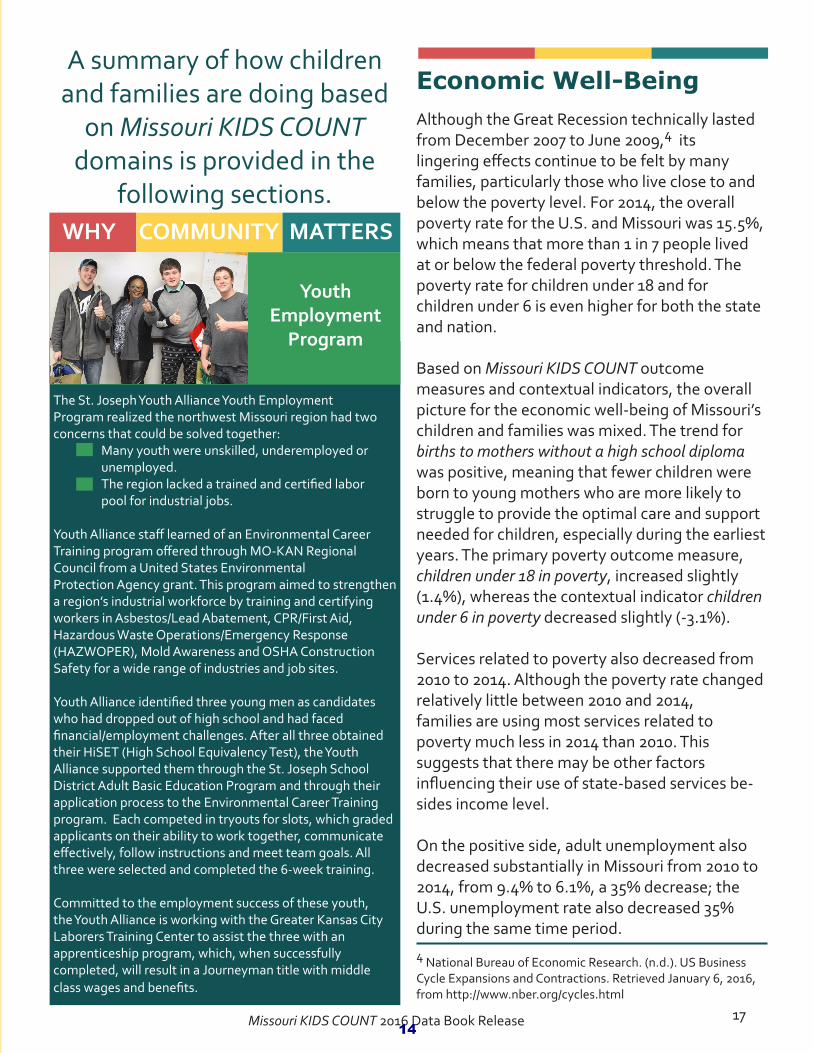
The St. Joseph Youth Alliance Youth Employment Program realized the northwest Missouri region had two concerns that could be solved together: Many youth were unskilled, underemployed or unemployed. The region lacked a trained and certified labor pool for industrial jobs.
Youth Alliance staff learned of an Environmental Career Training program offered through MO-KAN Regional Council from a United States Environmental Protection Agency grant. This program aimed to strengthen a region’s industrial workforce by training and certifying workers in Asbestos/Lead Abatement, CPR/First Aid, Hazardous Waste Operations/Emergency Response (HAZWOPER), Mold Awareness and OSHA Construction Safety for a wide range of industries and job sites.
Youth Alliance identified three young men as candidates who had dropped out of high school and had faced financial/employment challenges. After all three obtained their HiSET (High School Equivalency Test), the Youth Alliance supported them through the St. Joseph School District Adult Basic Education Program and through their application process to the Environmental Career Training program. Each competed in tryouts for slots, which graded applicants on their ability to work together, communicate effectively, follow instructions and meet team goals. All three were selected and completed the 6-week training.
Committed to the employment success of these youth, the Youth Alliance is working with the Greater Kansas City Laborers Training Center to assist the three with an apprenticeship program, which, when successfully completed, will result in a Journeyman title with middle class wages and benefits.
Youth Employment
Program
WHY COMMUNITY MATTERS
14

Missouri KIDS COUNT 2016 Data Book Release18
Poverty in Missouri and in the U.S., 2014
Percent Change for Poverty and Services Related to Poverty,
2010-2014
Children under 18 in poverty
Children under 6 in poverty
1.4%
-3.1%
Children in families receiving child care assistance
Children in families receiving
TemporaryAssistance
Children in families receiving
SNAP (food stamps)
-27.1%-22.9%
-7.5%
Missouri KIDS COUNT 2016 Data Book Release18
* Small Area Income and Poverty Estimates (SAIPE)+One year estimates (ACS)
+
15

Missouri KIDS COUNT 2016 Data Book Release 19
HealthBased on Missouri KIDS COUNT outcome measures, the overall picture for the health of Missouri’s children was positive. The percent of low birthweight infants decreased from the 2005-2009 rate of 8.1% to the current period’s 2010-2014 rate of 8.0%. (However, it should be noted that the rate was lower almost 20 years ago; the 1993-1997 rate was 7.6%). The infant mortality rate has declined 12% since 2005-2009, when the rate was 7.3 infants per 1,000 births to the current 2010-2014 rate of 6.4. This is due to a combination of improved medical technology and public health outreach efforts. Despite these improvements, during the years 2010 through 2014, over 2,400 Missouri babies died before their first birthday.
The Health domain contextual indicators paint a different picture. The percentage of children eligible for MO HealthNet for Kids (Medicaid) decreased slightly between 2010 and 2014 from 36.9% to 36.1%. Although not a contextual indicator, the percent of children under 18 with health insurance also decreased from 93.8% to 92.8% in the same time period for Missouri.5 For the U.S., the trend was reversed; 94.0% of children had health insurance in 2014 compared to 92.0% in 2010. Also showing a negative trend was the number of children receiving public mental health services, which increased 14.5% from 2010 to 2014.
Children eligible for MO HealthNet for
Kids
Missourichildren with
health insurance
U.S. children with
health insurance
2010
2010
2010
2014
2014
2014
36.9%
93.8%
92%
36.1%
92.8%
94%
Health Insurance Coverage for Children, 2010 & 2014
5 Based on American Community Survey (ACS) estimates.
16

Missouri KIDS COUNT 2016 Data Book Release20
Child Protection & SafetyFor this domain, the outcome measures provide a mixed picture for Missouri children. On thepositive side, two of the measures decreased from 2005-2009 to 2010-2014: child deaths (-10.8%) and teen unintentional injuries/homicides/suicides (-25.4%). On the other hand, from 2010 to 2014 two outcomes increased: substantiated child/abuse neglect cases and family
assessments (38.2%) and children entering/re-entering state custody (18.2%). It should be noted that the increase in substantiated child/abuse neglect cases and family assessments is mostly due to the increase in family assessments,6 which increased 40.1% from 2010 to 2014, whereas substantiated child abuse and neglect cases only increased 3.8%.
Child deaths, ages 1-14
(per 100,000)
Teens 15-19unintentional
injuries/homicides/suicides
(per 1,000)
Substantiatedchild abuse/neglect
cases and familyassessments (per 1,000)
Childrenentering/re-entering
state custody(per 1,000)
19.4 17.3
63.1
47.1
31.9
43.2
4.4 5.2
Child Protection and Safety Outcomes over Time
2010 2014
6 Family assessments are counted whether OR not services were required. The increase in family assessments since 2010 may be due to actual increases in concerns regarding abuse/neglect, but are also likely due to administrative changes (elimination of mandated reporter referrals) and legal requirements (change in law that requires all mandated reporters to report; no longer are designees appointed).
17
Missouri KIDS COUNT 2016 Data Book Release 21
Education
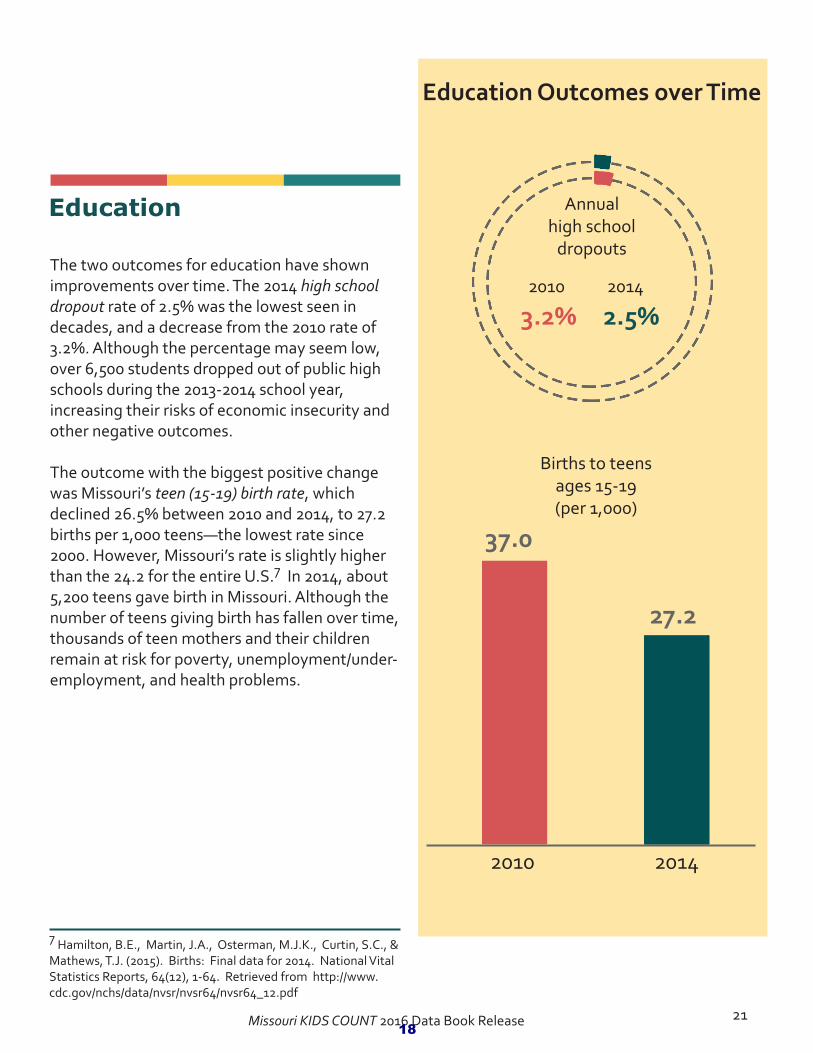
The two outcomes for education have shown improvements over time. The 2014 high school dropout rate of 2.5% was the lowest seen in decades, and a decrease from the 2010 rate of 3.2%. Although the percentage may seem low, over 6,500 students dropped out of public high schools during the 2013-2014 school year, increasing their risks of economic insecurity and other negative outcomes.
The outcome with the biggest positive change was Missouri’s teen (15-19) birth rate, which declined 26.5% between 2010 and 2014, to 27.2 births per 1,000 teens—the lowest rate since 2000. However, Missouri’s rate is slightly higher than the 24.2 for the entire U.S.7 In 2014, about 5,200 teens gave birth in Missouri. Although the number of teens giving birth has fallen over time, thousands of teen mothers and their children remain at risk for poverty, unemployment/under-employment, and health problems.
7 Hamilton, B.E., Martin, J.A., Osterman, M.J.K., Curtin, S.C., & Mathews, T.J. (2015). Births: Final data for 2014. National Vital Statistics Reports, 64(12), 1-64. Retrieved from http://www.cdc.gov/nchs/data/nvsr/nvsr64/nvsr64_12.pdf
Annual high school
dropouts
2010 2014
3.2% 2.5%
Births to teensages 15-19(per 1,000)
37.0
2010 2014
27.2
Education Outcomes over Time
18
Missouri KIDS COUNT 2016 Data Book Release26
Missouri State ProfileOutcome Measures
Number Rate Trend
Economic Well-BeingChildren under 18 in poverty
Births to mothers without a high school diplomaHealthLow birthweight infants*+
Infant mortality (per 1,000 live births)+
Child Protection & SafetyChild deaths, ages 1-14 (per 100,000)*+
Substantiated child abuse/neglect cases and family assessments (per 1,000)*
Children entering/re-entering state custody (per 1,000) Teen unintentional injuries/homicides/suicides, ages 15-19 (per 100,000)+EducationAnnual high school dropouts
Births to teens, ages 15-19 (per 1,000)
Contextual Indicators
2010 20102014 2014
Economic Well-BeingStudents enrolled in free/reduced price lunch
Children under 6 in poverty
Children in single-parent families
Children in families receiving child care assistance (per 1,000 in poverty)
Children in families receivingTemporary Assistance
Children in families receiving SNAP
Average annual wage/salary
Adult unemployment
HealthChildren eligible for MO HealthNet for KidsChildren receiving public mental health services
EducationEnglish language learners
Licensed child care capacity (per, 1000)
Accredited child care facilities
DemographicsChild population
Children as % of total population
Minority children*Outcome not included in Composite County Rank+Data based on 5-year time spans; 2005-2009 and 2010-2014
21.0% 21.3%
17.2% 13.7%13,094 10,271
32,390
2,947
30,345
2,418
8.1%
7.3
8.0%
6.4
293,856 289,287
1,139
45,441
6,236
1,345
1,006
61,463
7,259
957
19.4
31.9
4.4
63.1
17.3
44.1
5.2
47.1
9,190
7,625
6,540
5,230
3.3%
37.0
2.5%
27.2
20102014
1,423,1091,392,623
20102014
23.8%23.0%
20102014
23.8%24.6%
2010201420102014201020142010201420102014201020142010201420102014
46.8%50.0%25.5%24.7%33.3%35.0%158.1115.34.8%3.7%
37.5%34.7%
$41,749$45,325
9.4%6.1%
2010201420102014
36.9%36.1%21,29224,388
201020142010201520102015
19,98627,268105.8116.7
557424
ꜜꜜ
ꜜꜛꜛꜜ
ꜜꜛ
ꜜꜜ
LEGEND: é Better ê Worse è No Change
19

Missouri KIDS COUNT 2016 Data Book Release 27
TrendMissouri Minority ProfileOutcome Measures
Economic Well-BeingBirths to mothers without a high school diplomaHealthLow birthweight infants+
Infant mortality (per 1,000 live births)+
Child Protection & SafetyChild deaths, ages 1-14 (per 100,000)+
Substantiated child abuse/neglect cases and family assessments (per 1,000)
Children entering/re-entering state custody (per 1,000)
Teen unintentional injuries/homicides/suicides, ages 15-19 (per 100,000)+
EducationAnnual high school dropouts
Births to teens, ages 15-19 (per 1,000)
Minority 2010
18.5%24.7%
12.5%
12.7
11.8%
9.9
24.3
25.1
4.3
83.1
7.5%
56.8
4.7%
31.9
Minority 2014
Non-Minority
2010
Non-Minority
2014
Non-Minority Trend
20.2
43.1
4.2
57.7
15.0% 12.3%
7.0%
6.1
6.9%
5.4
19.3
26.1
4.2
60.0
16.3
44.5
5.2
43.1
3.3%
31.6
1.8%
24.2
ꜛ
ꜛ
According to American Community Survey 2014 data, there are just under 1.4 million children under 18 living in Missouri. Almost one in four (24.6%) of these children are of a racial minority. Although still a relatively small part of the overall child population, Hispanic children now make up 6.3%, a proportion double what it was in 2000.
The table above shows outcomes by minority status for the base and current years. Minority refers to individuals who are African American, Asian, American Indian or Alaska Native, Native Hawaiian/Pacific Islander, some other race, a combination of races, and/or who identify as Hispanic/Latino. Nonminority refers to non-His-panic White individuals. In general, both groups have experienced more positive trends than negative ones. For minority children in Missouri, eight outcomes improved and one worsened. For nonminority children, seven outcomes improved
and two worsened. For both groups, the rate of substantiated child abuse/neglect cases and family assessments worsened. For nonminority children, the rate of children entering/re-entering state custody also worsened over time.
Despite the mostly positive trends for both groups, minority teens are far more likely to give birth and to have low birthweight infants compared to their nonminority peers. Non-minority mothers are more likely to have at least a high school diploma. Minority teens are more likely to drop out of high school and to experience deaths due to homicides, suicides, and unintentional injuries compared to non-minority teens. On the other hand, minority children experience slightly lower rates of substantiated child abuse/neglect and family assessments and are less likely to enter/re-enter state custody in comparison to nonminority children.
Minority Trend
ꜛ
+Data based on 5-year time spans; 2005-2009 and 2010-2014
ꜜ
ꜜ
ꜛ ꜛꜛ ꜛ
ꜛ ꜛꜛ
ꜜ ꜜ
ꜜ ꜜꜜ ꜜ
20

Missouri KIDS COUNT 2016 Data Book Release 29
Texas
Dent
Pike
Bates
Barry
Polk
Linn
Ray
Iron
Howell
Cass
Ozark
Saline
Henry
Pettis
Macon
Butler
Vernon
Holt
Franklin
Wayne
Miller
Shannon
Taney
Adair
Boone
Carroll
Wright
Oregon
Benton
Ripley
Knox
Douglas
Phelps
Johnson
Clark
Laclede
Ralls
Jasper
Dade
Nodaway
Callaway
Osage
Stoddard
Clay
Chariton
Greene
Perry
Barton
Lincoln
Audrain
Lewis
Monroe
St. Clair
Stone
Reynolds
Dallas
Cole
Harrison
Camden
Scott
Sullivan
Newton
Crawford
Carter
Cedar
Morgan
Maries
Cooper
Pulaski
Jackson
Platte
Shelby
Dunklin
Gentry
Webster
Daviess
Lafayette
PutnamMercer
Marion
Christian
Atchison
Lawrence
Howard
Clinton
Warren
St. Louis
Grundy
Madison
DeKalbAndrew
Hickory
McDonald
Caldwell
ScotlandWorth
Jefferson
Bollinger
Washington
NewMadrid
Pemiscot
St. Charles
Livingston
Randolph
Gas
cona
deMoniteau
Mon
tgom
ery
Buchanan
Mississippi
St.Francois
CapeGirardeau
Schuyler
Ste.Genevieve
St. Louis City
Source: Missouri KIDS COUNTMap Created By: University of Missouri Extension, Office of Social and Economic Data Analysis (OSEDA)
Map Created On: 11 Mar 2016
Composite Rank1 - 2324 - 4647 - 6970 - 9293 - 115
Missouri KIDS COUNT Composite County Rank
1 - 23
24 - 46
47 - 69
70 - 92
93 - 115
Missouri KIDS COUNT Composite County Rank
County Ranks 1. St. Charles2. Platte3. Clay4. Christian5. Ste. Genevieve6. Nodaway7. Cass8. St. Louis9. Boone10. Johnson11. Lincoln12. Gasconade13. Osage14. Maries15. Jefferson16. Howard17. Lewis
18. Atchison19. Andrew20. Bates21. Carroll22. Warren23. Holt24. Franklin25. Clinton26. Adair27. Monroe28. Caldwell29. Pulaski30. Lafayette31. Harrison32. Perry33. Gentry34. Chariton
35. Cape Girardeau36. Polk37. Macon38. Montgomery39. Greene40. Cole41. Livingston42. Clark43. Dade44. Mercer45. Miller46. Shelby47. Marion48. Ozark49. Cooper50. Putnam51. Stone
52. Moniteau53. Camden54. Ray55. Saline56. Schuyler57. Benton58. Pettis59. Barton60. Callaway61. Carter62. DeKalb63. Buchanan64. Bollinger65. Hickory66. Randolph67. St. Francois
68. Taney69. Morgan70. Knox71. Howell72. Daviess73. Douglas74. Crawford75. Ralls76. Scotland77. Phelps78. Worth79. Vernon80. Iron81. Pike82. Lawrence83. Henry
84. Audrain85. Scott86. Madison87. Dent88. Jasper89. Jackson90. Shannon91. Sullivan92. Linn93. Wayne94. Newton95. Webster96. Stoddard97. Laclede98. Washington99. Barry
100. Texas101. Cedar102. New Madrid103. Butler104. Dallas105. Oregon106. Reynolds107. Grundy108. Wright109. St. Clair110. McDonald111. Pemiscot112. Mississippi113. Ripley114. Dunklin115. St. Louis City
Missouri KIDS COUNT 2016 Data Book Release 2921
LEG
END
: é B
ette
r ê
Wor
se è
No
Cha
nge
*O
utco
me
not i
nclu
ded
in C
ompo
site
Cou
nty
Ran
k
Mis
sour
i KID
S CO
UN
T 20
16 D
ata
Book
Rel
ease
Indi
cato
rs
■ If c
ount
y po
pula
tion
is le
ss th
an 6
5,00
0, th
e fig
ure
repr
esen
ts a
5-y
ear e
stim
ate
(201
0-20
14)
+ D
ata
base
d on
5- y
ear t
ime
span
s; 2
005-
2009
and
201
0-20
14
Cou
nty
Com
posi
te R
ank
Jack
son
Coun
tyCo
unty
Sea
t: In
depe
nden
ce
Out
com
e M
easu
res
Num
ber
Rat
eTr
end
Ran
k20
1020
1420
1020
14St
ate
Rat
eC
ount
y R
ank
Econ
omic
Wel
l-Bei
ngC
hild
ren
unde
r 18
in p
over
ty38
,771
37,6
7223
.9%
23.5
%é
21.3
%42
Birth
s to
mot
hers
with
out H
S di
plom
a2,
063
1,58
521
.0%
16.6
%é
13.7
%54
Hea
lthLo
w b
irthw
eigh
t inf
ants
*+
4,51
04,
056
8.6%
8.4%
é8.
0%80
Infa
nt m
orta
lity
(per
1,0
00 li
ve
birth
s)+
446
294
8.5
6.1
é6.
455
Child
Pro
tect
ion
& S
afet
yC
hild
dea
ths,
age
s 1–
14* (
per
100,
000)
+ 14
113
120
.319
é17
.363
Subs
tant
iate
d ch
ild a
buse
/ne
glec
t & fa
mily
ass
essm
ents
* (p
er 1
,000
)
5,61
37,
949
33.9
48.4
ê44
.148
Chi
ldre
n en
terin
g/re
-ent
erin
g st
ate
cust
ody
(per
1,0
00)
1,09
597
76.
66
é5.
260
Teen
uni
nten
tiona
l inj
urie
s/ho
mic
ides
/sui
cide
s , a
ges
15–1
9*
(per
100
,000
)+
196
119
8656
.5é
47.1
72
Educ
atio
nAn
nual
hig
h sc
hool
dro
pout
s1,
183
1,45
84.
0%5.
2%ê
2.5%
114
Birth
s to
teen
s, a
ges
15–1
9 (p
er
1,00
0)
1,05
770
548
.135
é27
.268
Dem
ogra
phic
Chi
ld p
opul
atio
n■20
1016
5,49
8
2014
164,
068
Chi
ldre
n as
% o
f tot
al
popu
latio
n■20
1024
.5
2014
24
Min
ority
chi
ldre
n■20
1046
.3%
2014
46.6
%
Econ
omic
Wel
l-bei
ngSt
uden
ts e
nrol
led
in fr
ee/
redu
ced
pric
e lu
nch
2010
51.5
%
2014
57.9
%
Chi
ldre
n un
der 6
in p
over
ty■
2010
28.5
%
2014
28.6
%
Chi
ldre
n in
sin
gle-
pare
nt
fam
ilies■
2010
42.3
%
2014
43.3
%C
hild
ren
in fa
mili
es re
ceiv
ing
child
car
e as
sist
ance
(per
1,0
00
in p
over
ty)
2010
162.
8
2014
133.
6
Chi
ldre
n in
fam
ilies
rece
ivin
g ca
sh a
ssis
tanc
e20
106.
8%
2014
4.9%
Chi
ldre
n in
fam
ilies
rece
ivin
g S
NA
P (fo
od s
tam
ps)
2010
44.8
%
2014
41.7
%
Aver
age
annu
al w
age/
sala
ry20
10$4
8,50
4
2014
$52,
493
Adul
t une
mpl
oym
ent
2010
10.7
%
2014
7.1%
Hea
lthC
hild
ren
elig
ible
for M
O
Hea
lthN
et fo
r Kid
s20
1043
.0%
2014
40.9
%
Chi
ldre
n re
ceiv
ing
publ
ic
men
tal h
ealth
ser
vice
s20
103,
519
2014
3,73
2
Educ
atio
n
Engl
ish
lang
uage
lear
ners
2010
5,29
2
2014
7,46
7
Lice
nsed
chi
ld c
are
capa
city
(p
er 1
,000
)20
1012
0.6
2015
161.
2
Accr
edite
d ch
ild c
are
faci
litie
s 20
1072
2015
43
Juve
nile
law
vio
latio
n re
ferr
als,
ag
es 1
0–17
(per
1,0
00)
2010
23.7
2014
15.7
89
Popu
latio
n: 6
83,1
91
22
LEG
END
: é B
ette
r ê
Wor
se è
No
Cha
nge
*O
utco
me
not i
nclu
ded
in C
ompo
site
Cou
nty
Ran
k
Mis
sour
i KID
S CO
UN
T 20
16 D
ata
Book
Rel
ease
Indi
cato
rs
■ If c
ount
y po
pula
tion
is le
ss th
an 6
5,00
0, th
e fig
ure
repr
esen
ts a
5-y
ear e
stim
ate
(201
0-20
14)
+ D
ata
base
d on
5- y
ear t
ime
span
s; 2
005-
2009
and
201
0-20
14
Cou
nty
Com
posi
te R
ank
Clay
Cou
nty
Coun
ty S
eat:
Libe
rty
Out
com
e M
easu
res
Num
ber
Rat
eTr
end
Ran
k20
1020
1420
1020
14St
ate
Rat
eC
ount
y R
ank
Econ
omic
Wel
l-Bei
ngC
hild
ren
unde
r 18
in p
over
ty7,
588
6,90
913
.4%
12.1
%é
21.3
%3
Birth
s to
mot
hers
with
out H
S di
plom
a36
024
411
.5%
7.9%
é13
.7%
9
Hea
lthLo
w b
irthw
eigh
t inf
ants
*+
1,10
299
56.
9%6.
5%é
8.0%
24
Infa
nt m
orta
lity
(per
1,0
00 li
ve
birth
s)+
8875
5.5
4.9
é6.
436
Child
Pro
tect
ion
& S
afet
yC
hild
dea
ths,
age
s 1–
14* (
per
100,
000)
+ 35
3615
.314
.9é
17.3
39
Subs
tant
iate
d ch
ild a
buse
/ne
glec
t & fa
mily
ass
essm
ents
* (p
er 1
,000
)
1,15
11,
723
20.1
29.5
ê44
.17
Chi
ldre
n en
terin
g/re
-ent
erin
g st
ate
cust
ody
(per
1,0
00)
3875
0.7
1.3
ê5.
25
Teen
uni
nten
tiona
l inj
urie
s/ho
mic
ides
/sui
cide
s , a
ges
15–1
9*
(per
100
,000
)+
2721
38.4
28.6
é47
.127
Educ
atio
nAn
nual
hig
h sc
hool
dro
pout
s30
613
72.
5%1.
2%é
2.5%
53
Birth
s to
teen
s, a
ges
15–1
9 (p
er
1,00
0)
191
154
26.9
21.4
é27
.224
Dem
ogra
phic
Chi
ld p
opul
atio
n■20
1057
,368
2014
58,3
98
Chi
ldre
n as
% o
f tot
al
popu
latio
n■20
1025
.8
2014
25
Min
ority
chi
ldre
n■20
1021
.0%
2014
22.3
%
Econ
omic
Wel
l-bei
ngSt
uden
ts e
nrol
led
in fr
ee/
redu
ced
pric
e lu
nch
2010
32.1
%
2014
36.2
%
Chi
ldre
n un
der 6
in p
over
ty■
2010
9.1%
2014
16.0
%
Chi
ldre
n in
sin
gle-
pare
nt
fam
ilies■
2010
24.6
%
2014
27.0
%C
hild
ren
in fa
mili
es re
ceiv
ing
child
car
e as
sist
ance
(per
1,0
00
in p
over
ty)
2010
132.
7
2014
111.
3
Chi
ldre
n in
fam
ilies
rece
ivin
g ca
sh a
ssis
tanc
e20
102.
2%
2014
1.8%
Chi
ldre
n in
fam
ilies
rece
ivin
g S
NA
P (fo
od s
tam
ps)
2010
24.9
%
2014
22.3
%
Aver
age
annu
al w
age/
sala
ry20
10$4
4,34
2
2014
$47,
604
Adul
t une
mpl
oym
ent
2010
8.5%
2014
5.4%
Hea
lthC
hild
ren
elig
ible
for M
O
Hea
lthN
et fo
r Kid
s20
1023
.0%
2014
23.3
%
Chi
ldre
n re
ceiv
ing
publ
ic
men
tal h
ealth
ser
vice
s20
1057
3
2014
703
Educ
atio
n
Engl
ish
lang
uage
lear
ners
2010
1,14
3
2014
1,46
7
Lice
nsed
chi
ld c
are
capa
city
(p
er 1
,000
)20
1082
.3
2015
98.4
Accr
edite
d ch
ild c
are
faci
litie
s 20
1016
2015
12
Juve
nile
law
vio
latio
n re
ferr
als,
ag
es 1
0–17
(per
1,0
00)
2010
30.6
2014
20.5
3
Popu
latio
n: 2
33,6
82
23
LEG
END
: é B
ette
r ê
Wor
se è
No
Cha
nge
*O
utco
me
not i
nclu
ded
in C
ompo
site
Cou
nty
Ran
k
Mis
sour
i KID
S CO
UN
T 20
16 D
ata
Book
Rel
ease
Indi
cato
rs
■ If c
ount
y po
pula
tion
is le
ss th
an 6
5,00
0, th
e fig
ure
repr
esen
ts a
5-y
ear e
stim
ate
(201
0-20
14)
+ D
ata
base
d on
5- y
ear t
ime
span
s; 2
005-
2009
and
201
0-20
14
Cou
nty
Com
posi
te R
ank
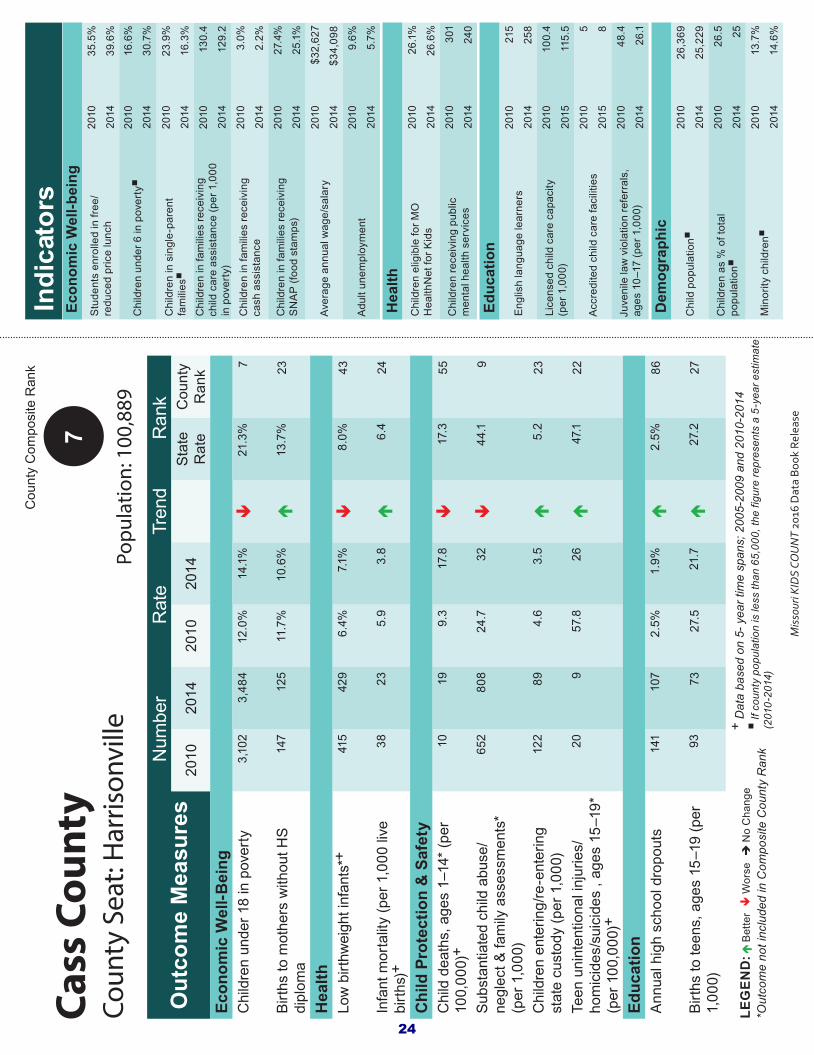
Cass
Cou
nty
Coun
ty S
eat:
Har
rison
ville
Out
com
e M
easu
res
Num
ber
Rat
eTr
end
Ran
k20
1020
1420
1020
14St
ate
Rat
eC
ount
y R
ank
Econ
omic
Wel
l-Bei
ngC
hild
ren
unde
r 18
in p
over
ty3,
102
3,48
412
.0%
14.1
%ê
21.3
%7
Birth
s to
mot
hers
with
out H
S di
plom
a14
712
511
.7%
10.6
%é
13.7
%23
Hea
lthLo
w b
irthw
eigh
t inf
ants
*+
415
429
6.4%
7.1%
ê8.
0%43
Infa
nt m
orta
lity
(per
1,0
00 li
ve
birth
s)+
3823
5.9
3.8
é6.
424
Child
Pro
tect
ion
& S
afet
yC
hild
dea
ths,
age
s 1–
14* (
per
100,
000)
+ 10
199.
317
.8ê
17.3
55
Subs
tant
iate
d ch
ild a
buse
/ne
glec
t & fa
mily
ass
essm
ents
* (p
er 1
,000
)
652
808
24.7
32ê
44.1
9
Chi
ldre
n en
terin
g/re
-ent
erin
g st
ate
cust
ody
(per
1,0
00)
122
894.
63.
5é
5.2
23
Teen
uni
nten
tiona
l inj
urie
s/ho
mic
ides
/sui
cide
s , a
ges
15–1
9*
(per
100
,000
)+
209
57.8
26é
47.1
22
Educ
atio
nAn
nual
hig
h sc
hool
dro
pout
s14
110
72.
5%1.
9%é
2.5%
86
Birth
s to
teen
s, a
ges
15–1
9 (p
er
1,00
0)
9373
27.5
21.7
é27
.227
Dem
ogra
phic
Chi
ld p
opul
atio
n■20
1026
,369
2014
25,2
29
Chi
ldre
n as
% o
f tot
al
popu
latio
n■20
1026
.5
2014
25
Min
ority
chi
ldre
n■20
1013
.7%
2014
14.6
%
Econ
omic
Wel
l-bei
ngSt
uden
ts e
nrol
led
in fr
ee/
redu
ced
pric
e lu
nch
2010
35.5
%
2014
39.6
%
Chi
ldre
n un
der 6
in p
over
ty■
2010
16.6
%
2014
30.7
%
Chi
ldre
n in
sin
gle-
pare
nt
fam
ilies■
2010
23.9
%
2014
16.3
%C
hild
ren
in fa
mili
es re
ceiv
ing
child
car
e as
sist
ance
(per
1,0
00
in p
over
ty)
2010
130.
4
2014
129.
2
Chi
ldre
n in
fam
ilies
rece
ivin
g ca
sh a
ssis
tanc
e20
103.
0%
2014
2.2%
Chi
ldre
n in
fam
ilies
rece
ivin
g S
NA
P (fo
od s
tam
ps)
2010
27.4
%
2014
25.1
%
Aver
age
annu
al w
age/
sala
ry20
10$3
2,62
7
2014
$34,
098
Adul
t une
mpl
oym
ent
2010
9.6%
2014
5.7%
Hea
lthC
hild
ren
elig
ible
for M
O
Hea
lthN
et fo
r Kid
s20
1026
.1%
2014
26.6
%
Chi
ldre
n re
ceiv
ing
publ
ic
men
tal h
ealth
ser
vice
s20
1030
1
2014
240
Educ
atio
n
Engl
ish
lang
uage
lear
ners
2010
215
2014
258
Lice
nsed
chi
ld c
are
capa
city
(p
er 1
,000
)20
1010
0.4
2015
115.
5
Accr
edite
d ch
ild c
are
faci
litie
s 20
105
2015
8
Juve
nile
law
vio
latio
n re
ferr
als,
ag
es 1
0–17
(per
1,0
00)
2010
48.4
2014
26.1
7
Popu
latio
n: 1
00,8
89
24

LEG
END
: é B
ette
r ê
Wor
se è
No
Cha
nge
*O
utco
me
not i
nclu
ded
in C
ompo
site
Cou
nty
Ran
k
Mis
sour
i KID
S CO
UN
T 20
16 D
ata
Book
Rel
ease
Indi
cato
rs
■ If c
ount
y po
pula
tion
is le
ss th
an 6
5,00
0, th
e fig
ure
repr
esen
ts a
5-y
ear e
stim
ate
(201
0-20
14)
+ D
ata
base
d on
5- y
ear t
ime
span
s; 2
005-
2009
and
201
0-20
14
Cou
nty
Com
posi
te R
ank
Plat
te C
ount
yCo
unty
Sea
t: Pl
atte
City
Out
com
e M
easu
res
Num
ber
Rat
eTr
end
Ran
k20
1020
1420
1020
14St
ate
Rat
eC
ount
y R
ank
Econ
omic
Wel
l-Bei
ngC
hild
ren
unde
r 18
in p
over
ty2,
017
2,08
99.
3%9.
4%ê
21.3
%2
Birth
s to
mot
hers
with
out H
S di
plom
a94
828.
3%7.
4%é
13.7
%7
Hea
lthLo
w b
irthw
eigh
t inf
ants
*+
369
359
6.8%
6.3%
é8.
0%20
Infa
nt m
orta
lity
(per
1,0
00 li
ve
birth
s)+
2235
46.
2ê
6.4
58
Child
Pro
tect
ion
& S
afet
yC
hild
dea
ths,
age
s 1–
14* (
per
100,
000)
+ 7
48
4.3
é17
.312
Subs
tant
iate
d ch
ild a
buse
/ne
glec
t & fa
mily
ass
essm
ents
* (p
er 1
,000
)
398
453
1820
ê44
.11
Chi
ldre
n en
terin
g/re
-ent
erin
g st
ate
cust
ody
(per
1,0
00)
1417
0.6
0.7
ê5.
22
Teen
uni
nten
tiona
l inj
urie
s/ho
mic
ides
/sui
cide
s , a
ges
15–1
9*
(per
100
,000
)+
1212
41.6
38.9
é47
.147
Educ
atio
nAn
nual
hig
h sc
hool
dro
pout
s10
647
2.3%
1.0%
é2.
5%44
Birth
s to
teen
s, a
ges
15–1
9 (p
er
1,00
0)
7431
25.4
10.3
é27
.25
Dem
ogra
phic
Chi
ld p
opul
atio
n■20
1022
,083
2014
22,6
75
Chi
ldre
n as
% o
f tot
al
popu
latio
n■20
1024
.7
2014
23.9
Min
ority
chi
ldre
n■20
1020
.1%
2014
21.4
%
Econ
omic
Wel
l-bei
ngSt
uden
ts e
nrol
led
in fr
ee/
redu
ced
pric
e lu
nch
2010
23.3
%
2014
27.7
%
Chi
ldre
n un
der 6
in p
over
ty■
2010
10.5
%
2014
10.9
%
Chi
ldre
n in
sin
gle-
pare
nt
fam
ilies■
2010
23.0
%
2014
29.7
%C
hild
ren
in fa
mili
es re
ceiv
ing
child
car
e as
sist
ance
(per
1,0
00
in p
over
ty)
2010
87.6
2014
102
Chi
ldre
n in
fam
ilies
rece
ivin
g ca
sh a
ssis
tanc
e20
101.
8%
2014
1.4%
Chi
ldre
n in
fam
ilies
rece
ivin
g S
NA
P (fo
od s
tam
ps)
2010
18.2
%
2014
16.9
%
Aver
age
annu
al w
age/
sala
ry20
10$4
0,70
9
2014
$45,
806
Adul
t une
mpl
oym
ent
2010
7.8%
2014
5.1%
Hea
lthC
hild
ren
elig
ible
for M
O
Hea
lthN
et fo
r Kid
s20
1016
.4%
2014
16.2
%
Chi
ldre
n re
ceiv
ing
publ
ic
men
tal h
ealth
ser
vice
s20
1016
4
2014
206
Educ
atio
n
Engl
ish
lang
uage
lear
ners
2010
401
2014
535
Lice
nsed
chi
ld c
are
capa
city
(p
er 1
,000
)20
1073
2015
80.8
Accr
edite
d ch
ild c
are
faci
litie
s 20
103
2015
5
Juve
nile
law
vio
latio
n re
ferr
als,
ag
es 1
0–17
(per
1,0
00)
2010
21.8
2014
18.8
2
Popu
latio
n: 9
4,78
8
25
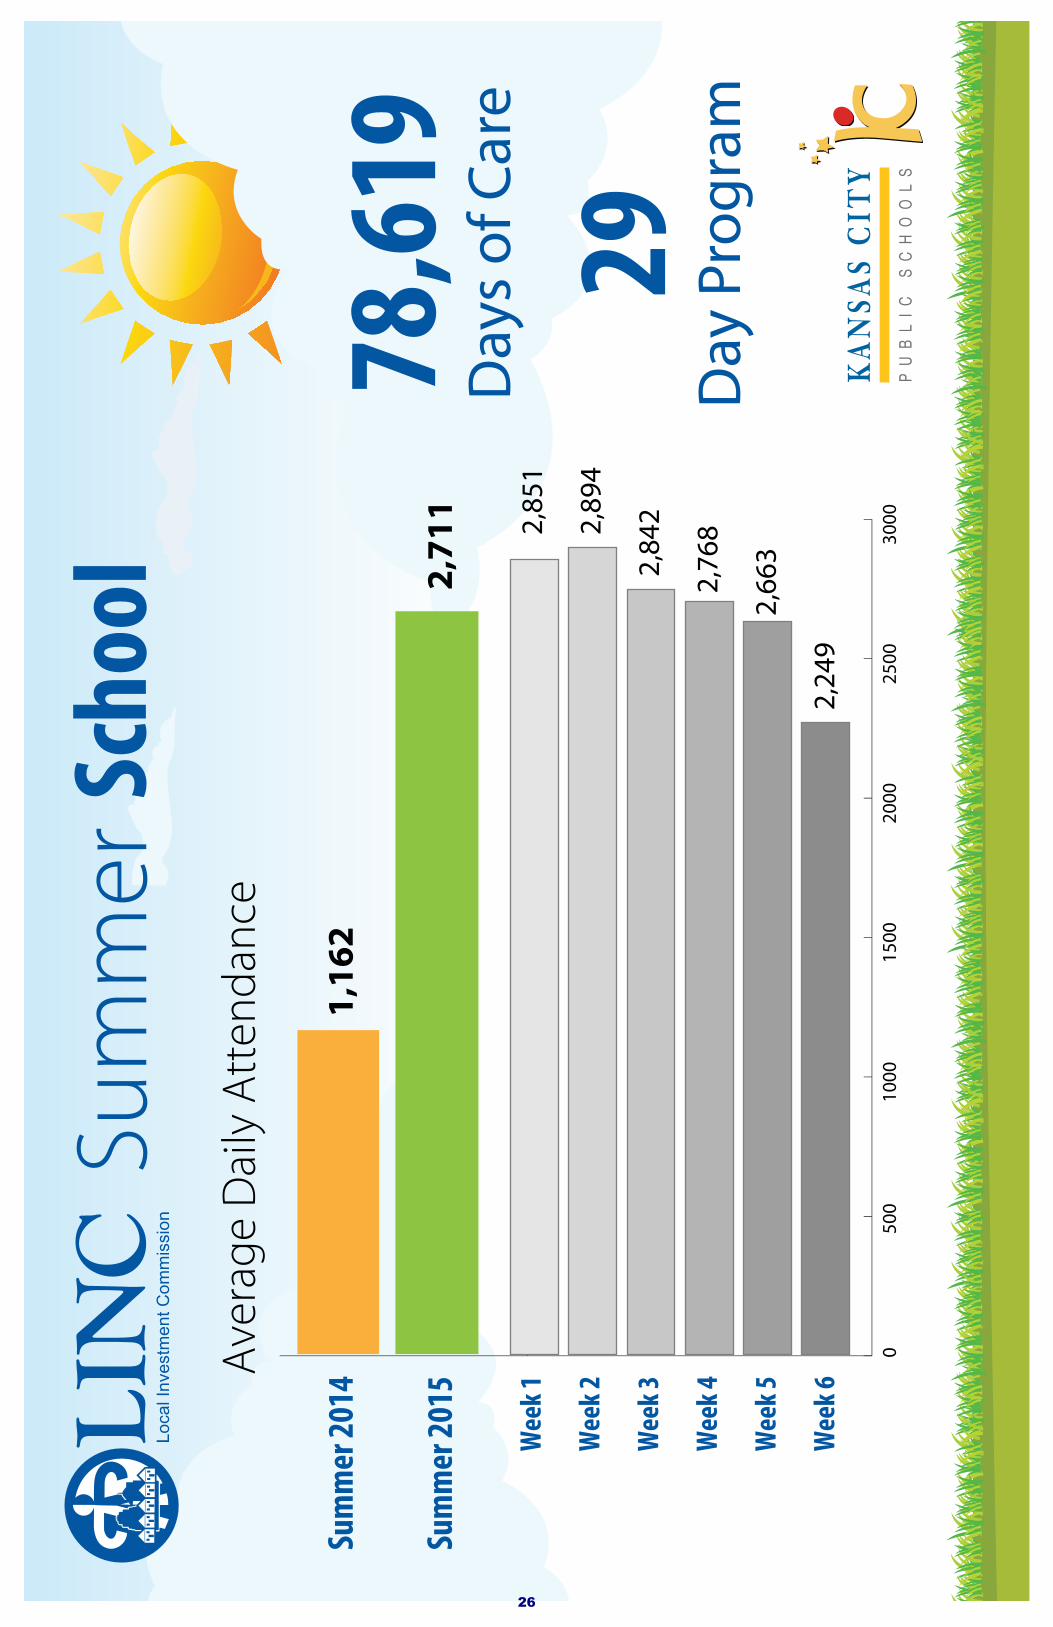
Day
s of
Car
e78
,619
Day
Pro
gram
29
050
010
0015
0020
0025
0030
00
Wee
k 3
Wee
k 4
Wee
k 5
Wee
k 6
Wee
k 2
Wee
k 1
Sum
mer
2014
Sum
mer
2015
1,16
2
Aver
age
Dai
ly A
tten
danc
e
2,85
1
2,71
1 2,89
4
2,84
2
2,76
8
2,66
3
2,24
9
26

1211 McGee Kansas City, MO 64106 (816) 418-7000 www.kcpublicschools.org
PRESS ADVISORY For immediate release – April 7, 2016
Get ready to accelerate your summer with KCPS
KANSAS CITY, MO. – Kansas City Public Schools wants to make sure every child in the region can launch their summer of 2016 into the atmosphere with fun and learning.
KCPS will host a press conference 10:00 a.m. Tuesday, April 12 at Whittier Elementary School, 1012 Bales Ave. in Kansas City, Mo., to unveil all of the opportunities available through the 2016 Summer Acceleration program. The event will include rocket launches by students who designed and built their own rockets, one example of the types of experiences young people can have through the Summer Acceleration program.
Through Summer Acceleration, KCPS has partnered with 7 Strategic, AileyCamp, the Boys & Girls Club, LINC, Upper Room and the YMCA to provide a wide variety of fun and educational programs designed for every age group, ability and interests, and spread across KCPS. Interim Superintendent Al Tunis and representatives from the partner organizations will be on-hand to talk about why Summer Acceleration is important, its goals and the type of activities that will be available.
Any child in the Kansas City region can enroll in Summer Acceleration at no charge. KCPS and its partners want to ensure that all students have access to high-quality educational experiences this summer so that young people don’t lose a step. Numerous studies have demonstrated that students who enroll in summer school tend to see improved reading and math skills, get a jump start on fall classes and find it easier to transition from one grade to the next.
Families can visit any KCPS school to obtain a Summer Acceleration application, or get a referral from one of the partner organizations. More information and applications are available by visiting www.kcpublicschools.org/Summer, emailing [email protected] or calling (816) 418-7266.
Kansas City Public Schools is dedicated to graduating students that are college, career, and workforce ready. This mission is supported by innovative classroom instruction, engaging programs, highly qualified employees, and an engaged and well-informed community. To learn more about the ways our community of schools supports students and the community-at-large, please visit www.kcpublicschools.org, KCMOSchools on Facebook, or KCMOSchools on Twitter.
For more information, please contact Executive Director of Student Support & Community Services Dr. Tonia Gilbert at (816) 418-7406 or Public Relations & Marketing Coordinator Ray Weikal at (816) 418-7414.
##
27

LINC Summer SchoolMultiple LocationsThe Local Investment Commission (LINC) will o�er a 5-week, all-day summer school and enrichment experience hosted at 16 school sites. Mornings will feature academic instruction in reading and math provided by a certi�ed teacher. Afternoons will feature academic enrichment and youth development activities including �eld trips, arts, sports and �tness, character education, swimming and robotics.
DATES5-week ProgramJune 6 - July 8, 2016
HOURS7:00 a.m. - 6:00 p.m.
COSTFree
WEBSITE & MORE INFOkclinc.org/kcps-summer
BEFORE & AFTER CARELINC will also o�er Before &After Care for students in theKCPS Summer School programs.
MEALSBreakfast, lunch and snackprovided.
PARENT INVOLVEMENTLINC encourages the activeparticipation of parents andprovides supportive resourcesand referrals. LINC will organizea special event to be held at theend of the summer program.The end of summer blast willinclude food and entertainmentfor the whole family.
TRANSPORTATIONTransportation is not provided.
LOCATIONS
Banneker Elementary7050 Askew Ave, Kansas City, MO 64132
Border Star Montessori6321 Wornall Rd, Kansas City, MO 64113
Carver Dual Language4600 Elmwood Ave, Kansas City, MO 64130
Faxon Elementary1320 E 32nd Terr, Kansas City, MO 64109
Garcia Elementary1000 W 17th St, Kansas City, MO 64108
Hale Cook Elementary7302 Pennsylvania Ave, Kansas City, MO 64114
Holliday Montessori7227 Jackson, Kansas City, MO 64132
King Elementary4848 Woodland, Kansas City, MO 64110
Longfellow2830 Holmes St, Kansas City, MO 64109
Melcher Elementary3958 Chelsea Dr, Kansas City, MO 64130
Pitcher Elementary9915 E 38th Terr, Kansas City, MO 64133
Rogers6400 E 23 St, Kansas City, MO 64129
Trailwoods Elementary6201 E 17th St, Kansas City, MO 64126
Troost Elementary1215 E 59th St, Kansas City, MO 64110
Whittier1012 Bales Ave, Kansas City, MO 64127
ACADEMIC ENRICHMENTThe LINC Summer Camp program will incorporate three hours of academic enrichment each morning. LINC will provide learning experiences for students, both inside and outside of the classroom, in the following academic areas: reading and writing, mathematics, and science.
DRESS CODEClean, neat and appropriate clothing for summer weather and activities.
You must enroll at the LINC school you want to attend this summer.
28

Kansas City Public Schools Expands Summer School Offerings By Sam Zeff - KCUR
Students at Whittier Elementary School show off a science project. Kansas City Public Schools says science will be a focus of its summer school offerings this year.
Credit Sam Zeff / KCUR 89.3
Summer is a time that all educators dread to some degree. No matter how well students do during the school year there is generally some slippage during the summer break.
That's especially true in urban districts like the Kansas City Public Schools (KCPS).
The district has expanded its summer school offerings over the past few years and says it expects more students to enroll this summer.
“Yes, we are expanding the number of locations and continuing to grow all the time. We’re increasing and looking for additional partners to provide greater opportunities and greater experiences for kids," says Acting Superintendent Al Tunis.
The district has partnered with 7 Strategic, AileyCamp, Boys & Girls Clubs of Greater Kansas City, Local Investment Commission (LINC), Upper Room and the YMCA this summer.
“The kids don’t really need a vacation," says Brent Schondelmeyer with LINC who has been running summer school in KCPS buildings for years. "The kids really need a place to be and the results in the prior years have shown student gains around reading and math.”
Many of the summer programs will focus on science and technology. “We have a lot of science opportunities for our students this summer,” says Principal Christy Harrison from Trailwoods Elementary School.
Science has been a continuing problem for KCPS. The district's students have done poorly on the Missouri state assessment test. “It’s intentional for us to focus on science, something that may not have had the same element of focus as it really needs and what we plan to do in the future,” says Tunis.
Tunis says because most of the KCPS summer classes will be taught by certified teachers the state Department of Elementary and Secondary Education (DESE) will pick up most of the cost.
The summer program is open to any student in Kansas City. They don't have to currently be a KCPS student.
Last year when the district expanded summer school, it hoped to use it as a marketing tool to lure students away from private and charter schools.
Only 50 percent of school age children in the KCPS boundaries actually attend a district school.
Sam Zeff covers education for KCUR. He's also co-host of KCUR's political podcast Statehouse Blend. Follow him on Twitter @samzeff.
29
Kansas City Star editorial – April 10, 2016
Volunteer army doing great work to boost children’s reading scores Lead to Read provides ‘boots on the ground’ in schools
Nearly 650 adults sacrifice lunch hour once a week to read with children
At Boone Elementary School, Trish Warford, a geographic information specialist with Burns & McDonnell, reads with 7-year-old Annie. Pauly Hart Special to The Star
Getting thousands of books into the hands of children in Kansas City has been part of a communitywide, yearslong effort to boost reading scores.
A volunteer adult army puts its “boots on the ground” to provide the second wave of help. Workers at area companies sacrifice their lunchtime to go to 30 classrooms in nine schools in three districts and two charter schools to read books one-on-one with kids.
It’s done through Lead to Read, a five-year-old Kansas City literacy program that has recruited more than 720 volunteers to read books to children.
It’s a superb and worthwhile use of time.
Pauly Hart, Lead to Read director of reader development, wants the number of adult volunteers in schools to jump to 1,200 by 2017. The vision by 2020 is for every urban core Kansas City area student in first through fourth grades to have a Lead to Read volunteer making weekly school visits.
The program is aligned with Mayor Sly James’ 2011 initiative, Turn the Page Kansas City. When it started, only 33 percent of third-graders in Kansas City schools were reading at or above grade level. In 2015 it increased to 49 percent.
Last year alone, first-graders in Lead to Read classrooms enjoyed an 11 percent increase in reading scores. The improvements are headed in the right direction. But a lot more is needed.
“We have schools that are not lowering the expectation bar for kids but instead providing additional supports to help kids achieve at high levels,” James said in his March 29 state of the city address.
Turn the Page, the United Way of Greater Kansas City through Dolly Parton’s Imagination Library, and the Local Investment Commission have worked to get thousands of books into the hands of children for them to keep so they will get excited about reading.
Lead to Read provides a vital connection by showing children that adults beyond teachers and parents really want them to have a lifelong love for books and the wonders they contain.
The hallway walls at Garfield Elementary School in the Northeast area of Kansas City are decorated with students’ essays and pictures. On a recent Wednesday around lunchtime, volunteers from area companies showed up to read books. Many come from well-known companies such as DST and Central Bank.
30

Some of the adults get down on the floor with kids and read books like “Horton Hears a Who!” one of the “Clifford the Big Red Dog” series or a “SpongeBob SquarePants” story. It’s important that the books are what the children want to read, and the volunteers know it.
Garfield Elementary is unique because it has children from kindergarten to sixth grade who are from about 20 countries. English is not their native language. But they really warm up to adults who come once a week to read with them.
Nothing could be more exciting. The exposure also is great for the adults who undergo background checks before they are partnered with a child. They get to see what schools are like, what teacherscontend with and some even help provide supplies for classrooms.
“It can dispel myths and illuminate concerns,” Hart said.
In many cases the children also read to the adults to show what they have learned.
“It’s a lot of fun,” said Julia Daily with DST, who was sharing books with 7-year-old Angel. “I’ve noticed a big difference.”
Sarah Cousineau, marketing director at Central Bank, was reading with 10-year-old Brian.
“This is the best part of my Wednesday,” she said.
At Boone Elementary School in the Center School District, volunteers from Burns & McDonnell filled the hallway of warm, calming colors before heading to read to children. The adults sat in student desks on carpeted or bare floors in classrooms to share books with kids.
Relationships are developed, and the children can see that through hard work and reading they can grow up to be like the volunteers.
“I love kids and to give back to the community any way I can,” said Grant Malone with Burns & McDonnell.
“It’s really heartwarming,” said Marilyn McCahon, a volunteer who’s retired from St. Luke’s Hospital and now reads to 9-year-old Tristin at Boone Elementary.
School staff members are fans of the extra community effort to help their children become lifelong readers.
“It’s great for the kids to have professional people who care about what they are doing,” said Anson Baker, Boone Elementary School principal.
“It’s a great help,” said Rosario Woodward, a second-grade teacher at Garfield Elementary. “My kids love it.”
And keep this fact in mind: Volunteers who give their time and attention to share the joys of reading also get a lot in return. To volunteer go to www.leadtoreadkc.org.
31

It’s time for an ambitiousnational investment inAmerica’s childrenInvestments in early childhood care and educationwould have enormous benefits for children, families,society, and the economy
Report • By Josh Bivens, Emma García, Elise Gould, Elaine Weiss, and Valerie Wilson • April 6, 2016
Summary: An ambitious national investment in early childhood care and education wouldprovide high societal returns. American productivity would improve with a better-educated and healthier future workforce, inequality would be immediately reduced asresources to provide quality child care are progressively made available to families withchildren, and the next generation would benefit from a more level playing field thatallows for real equality of opportunity.
• Washington, DC View this report at epi.org/101151
32

SECTIONS
1. Introduction and keyfindings • 1
2. Benefits stemmingfrom directinvestments inchildhooddevelopment • 5
3. Benefits stemmingfrom increased in-kindresources to familieswith children • 13
4. Benefits stemmingfrom parents’increased labor forceparticipation • 16
5. Benefits stemmingfromprofessionalization ofthe child careworkforce • 20
6. The status quo inAmerican child care,and policy efforts tohelp • 23
7. Conclusion • 31
About the authors • 32
Endnotes • 33
References • 34
Introduction and keyfindingsNearly 7 years into the recovery from the Great Recession,two glaring problems remain in the U.S. economy. One is asignificant slowdown in the growth of productivity (theamount of output and income generated in an averagehour of work). The other is the destructive rise in incomeinequality in recent decades due largely to bigcorporations and the wealthy rewriting the rules of theeconomy to stack the deck in their favor. This inequalityhas prevented the fruits of productivity growth from“trickling down” to reach most households—and hasundermined the ideal of providing genuinely equalopportunity for all.
Ameliorating these two problems should be policymakers’core focus. One way to address both issues—one thatwould spur myriad other benefits to American families—isinvesting ambitiously in our country’s children. Theseinvestments should include (but not necessarily be limitedto):
Expanding public funding for home visits by trainednurses to help expectant parents make healthychoices both before and after childbirth.
Providing resources necessary to ensure all familiescan access high-quality child care with well-trained,professional staff qualified to provide early childhoodeducation. High-quality programs will aim to nurturechildren’s cognitive and socioemotional developmentand allow all children to enter their formal schoolingyears at comparable levels of preparedness.
Providing resources to ensure the professionalizationof early childhood caregivers and teachers. Thismeans providing enough resources to attract andretain well-credentialed staff and to close earningsgaps between early childhood workers and otherworkers with similar skills and credentials (includingK–12 teachers).
There are many models of successful widespreadimplementation of these types of investments, andresearch clearly demonstrates such investments wouldprovide high societal returns. American productivity would
1
33

improve with a better-educated and healthier future workforce, inequality would beimmediately reduced as resources to provide quality child care are progressively madeavailable to families with children, and the next generation would benefit from a more levelplaying field that allows for real equality of opportunity. What is missing is the political willto provide these resources to all American families.
This report reviews the evidence on why a major investment in America’s children is sucha promising economic strategy that can provide substantial social benefits—and thatwould more than pay for itself over time. It highlights four particular tranches of benefits:
1. Benefits that stem from having more resources invested in the care and education ofchildren in their early years
The benefits accruing directly to the children receiving greater care and educationalresources are large and progressive, as higher-income families are much more likely toalready be able to afford high-quality child care and educational opportunities. Thebenefits stemming from greater investments in children are also universal, leading to anincreasingly productive workforce that will boost economic growth, provide budgetarysavings at the state and federal levels, and lead to reductions in future generations’involvement with the criminal justice system. These benefits will, of course, materializeonly in coming decades when today’s children have grown up. But the research is clearthat they will materialize—and when they do, they are permanent.
One section of this paper will review the research on the potential payoff from this trancheof benefits. Key findings from this section include:
Achievement gaps between American students in different income classes, andbetween students of different races and ethnicities, appear before kindergartenbegins, and sometimes peak at ages 5 and 6. This means early childhood care andeducation (ECCE) has a potentially large role in shaping these gaps.
According to McKinsey researchers, the potential benefits to closing educationalachievement gaps between students of different income classes total nearly $70billion annually. The same researchers have further estimated that the payoff toreducing average test score gaps between American students and students in better-performing national school systems stands at nearly $180 billion annually.
High-income families spend much more on child enrichment activities than do low-income families—and the gap has grown over time. For example, in 1970 the spendinggap between the highest and lowest household income fifths was roughly $2,700. By2006, it had grown to $7,500.
Gaps in the absolute level of investments in children’s enrichment activities by incomeclass have grown substantially over time, even as lower-income householdsincreased their spending on these activities at a more rapid clip when measured asa share of income. In essence, lower-income households are making a greaterinvestment effort, but the rise in income inequality has allowed higher-incomehouseholds to pull away even without increasing the share of income they devote tochildren’s enrichment.
2
34
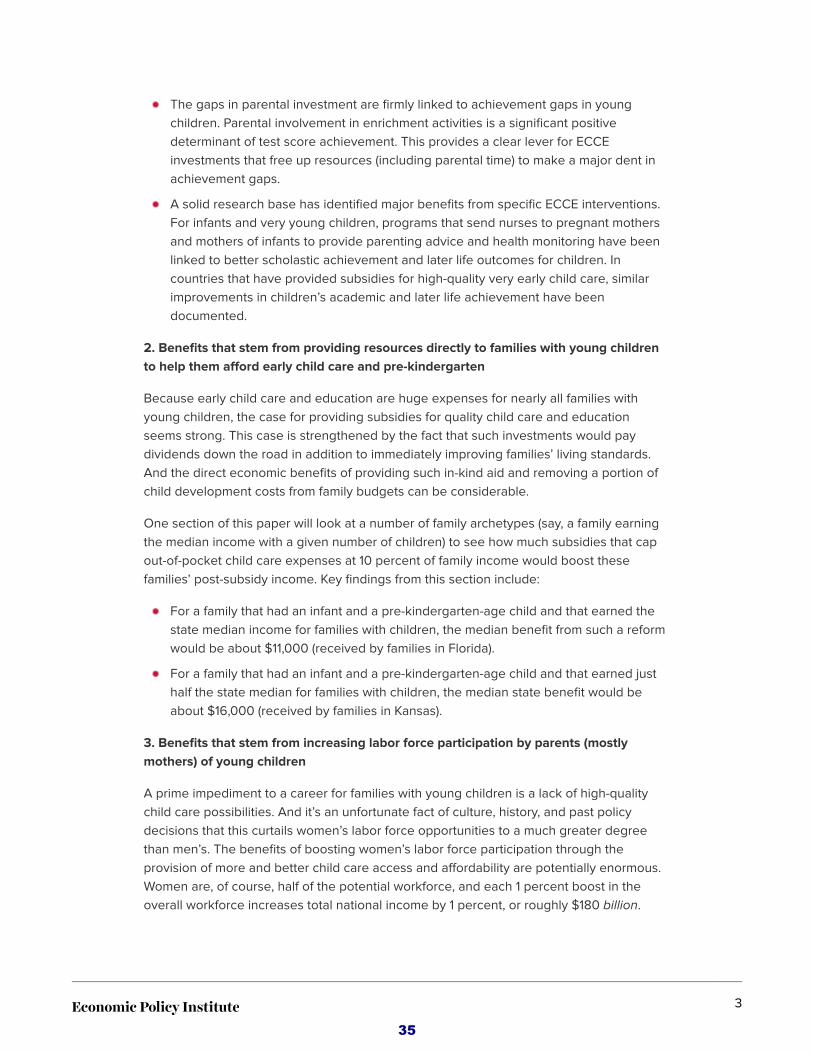
The gaps in parental investment are firmly linked to achievement gaps in youngchildren. Parental involvement in enrichment activities is a significant positivedeterminant of test score achievement. This provides a clear lever for ECCEinvestments that free up resources (including parental time) to make a major dent inachievement gaps.
A solid research base has identified major benefits from specific ECCE interventions.For infants and very young children, programs that send nurses to pregnant mothersand mothers of infants to provide parenting advice and health monitoring have beenlinked to better scholastic achievement and later life outcomes for children. Incountries that have provided subsidies for high-quality very early child care, similarimprovements in children’s academic and later life achievement have beendocumented.
2. Benefits that stem from providing resources directly to families with young childrento help them afford early child care and pre-kindergarten
Because early child care and education are huge expenses for nearly all families withyoung children, the case for providing subsidies for quality child care and educationseems strong. This case is strengthened by the fact that such investments would paydividends down the road in addition to immediately improving families’ living standards.And the direct economic benefits of providing such in-kind aid and removing a portion ofchild development costs from family budgets can be considerable.
One section of this paper will look at a number of family archetypes (say, a family earningthe median income with a given number of children) to see how much subsidies that capout-of-pocket child care expenses at 10 percent of family income would boost thesefamilies’ post-subsidy income. Key findings from this section include:
For a family that had an infant and a pre-kindergarten-age child and that earned thestate median income for families with children, the median benefit from such a reformwould be about $11,000 (received by families in Florida).
For a family that had an infant and a pre-kindergarten-age child and that earned justhalf the state median for families with children, the median state benefit would beabout $16,000 (received by families in Kansas).
3. Benefits that stem from increasing labor force participation by parents (mostlymothers) of young children
A prime impediment to a career for families with young children is a lack of high-qualitychild care possibilities. And it’s an unfortunate fact of culture, history, and past policydecisions that this curtails women’s labor force opportunities to a much greater degreethan men’s. The benefits of boosting women’s labor force participation through theprovision of more and better child care access and affordability are potentially enormous.Women are, of course, half of the potential workforce, and each 1 percent boost in theoverall workforce increases total national income by 1 percent, or roughly $180 billion.
3
35

One section of this paper will look at trends in women’s labor force participation andprovide illustrative calculations of how much an ambitious investment in America’s childrencould pay off in terms of greater labor force participation and national income. Key findingsfrom this section include:
If women’s labor force participation in the United States matched that of America’sinternational peers, the potential gains to gross domestic product (GDP) could beenormous—up to $600 billion annually.
Providing affordable, high-quality child care should be a core component of anystrategy to boost women’s labor force participation. An investment that capped childcare expenditures at 10 percent of family income could increase overall women’slabor force participation enough to boost GDP by roughly $210 billion (or 1.2 percent).
The additional tax revenue and reduced public outlays associated with higher GDPstemming from higher women’s labor force participation could provide roughly $70billion in economic resources to governments to help finance the investment in ECCE.
4. Benefits that stem from the professionalization of the child care workforce
Currently, providing early child care in the United States is low-wage work. This is largelybecause the workforce lacks meaningful labor standards and protections. Further, evenwith its current low-wage workforce, the cost of early child care and development is largerelative to the budgets of typical American families, principally because this work is labor-intensive and there is little scope for traditional strategies to lower costs without sacrificingquality. To put it simply, while crowding more and more children into each room with acaregiver and teacher would normally register in economic statistics as a productivityimprovement, this is clearly not a serious strategy for improving early childhood care anddevelopment.
By providing incentives to boost pay and training for early child care providers, a majorinvestment in America’s children would also lift wages in this key economic sector. Many ofthese gains would accrue to the workers themselves, but the higher-quality workforce thatwould result from attracting and retaining more and better job seekers and incentivizingtraining would also result in higher-quality care. A key strategy for retention will be closingthe wage penalty that currently exists between early child care and development workersand workers in other sectors with similar skills and credentials (including teachers in theK–12 sector).
One section of this paper will examine the characteristics of the child care workforce, andwill calculate the wage gains that would accompany policies leading to a better-trainedand better-paid early child care workforce. Key findings from this section include:
The current U.S. child care workforce is strikingly low-paid and lacks bargainingpower to boost their pay and raise standards in the profession. In 2014, for example,the median wage of child care workers was $10.31, or 39.3 percent below the medianin other occupations.
4
36

The low pay of child care workers and the low level of investment in their training arebarriers to providing high-quality child care. Well-compensated employees andinvestment in staff are key contributors to the most successful ECCE strategies.
Outline of following sectionsThe following four sections examine the economic evidence and logic behind each of thefour tranches of benefits that investments in ECCE provide. This is followed by anoverview of the American status quo of helping families with children obtain access toquality child care. It finds that while a number of different policies and programs aim tohelp American families along these lines, these efforts fall short in terms of affordability,access, and quality. This highlights the need for a major investment in America’s childrenthat could realize the potential benefits we identify.
Benefits stemming from directinvestments in childhood developmentThe largest and most enduring benefits of a major investment in childhood care anddevelopment are those stemming from its direct impact on children. The evidence is clear:Children with better early childhood care and educational opportunities grow up to bemore likely to work and less likely to interact with the criminal justice system. They growup in better health and earn higher wages. They pay more taxes and draw on fewergovernment resources. While many of these benefits only become apparent once the firstwave of children enter adulthood, these benefits are large—and they persist and grow insuccessive generations so long as the investment effort is maintained.
Lynch and Vaghul (2015), for example, review evidence on the economic benefits from amajor investment that would provide universal high-quality pre-kindergarten education toall American 3- and 4-year-olds. Over a 34-year window (between 2016 and 2050), theyestimate annual benefits from this investment would total roughly $10 billion.
It is important to note that even these large benefits still leave many potential benefits onthe table. The full potential economic payoff from a major investment in America’s childrenwould occur if achievement gaps were eliminated between American students of differentincome classes, or different races and ethnicities, or even between average Americanstudents and students in higher-performing national educational systems in otheradvanced economies. McKinsey (2009) has estimated that closing achievement gapsbetween low-income students and others would boost GDP by roughly $70billion annually. They further estimate that closing achievement gaps that persist betweenstudents of different races and ethnicities would boost GDP by roughly $50 billionannually. Further, if a major investment in America’s children also boostedthe average performance of American students, payoffs would be even larger. Forexample, McKinsey (2009) estimates that closing the gap in average educational
5
37
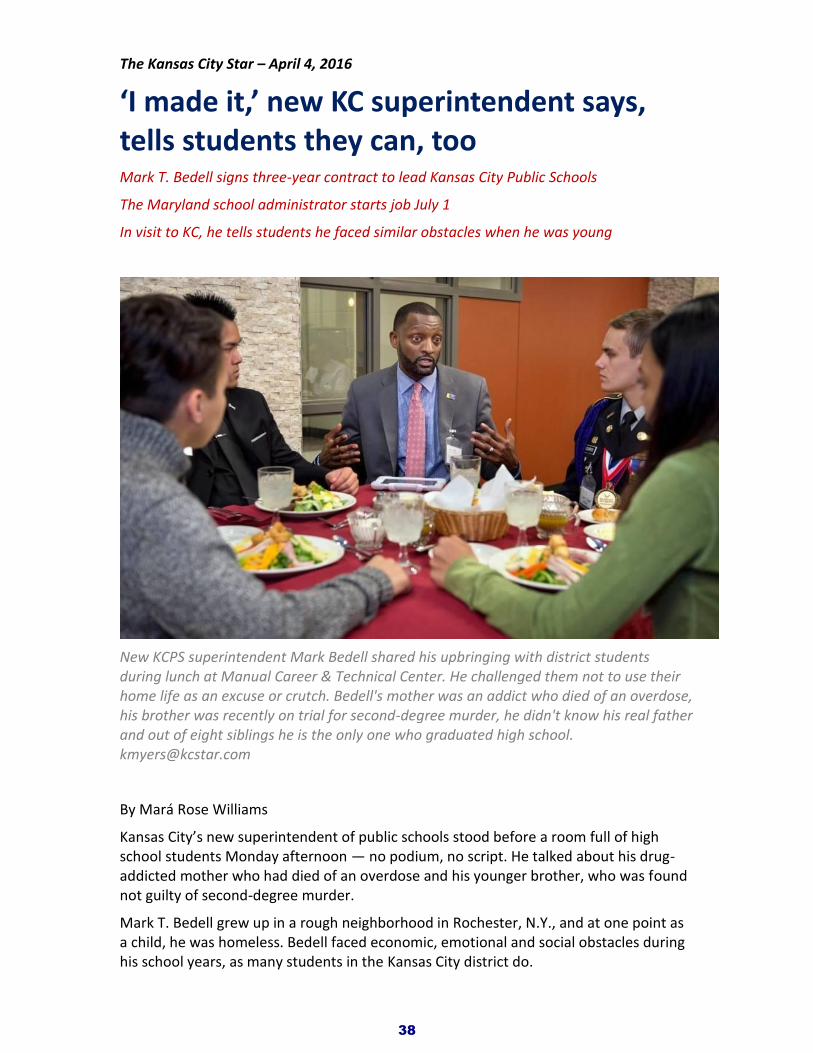
The Kansas City Star – April 4, 2016
‘I made it,’ new KC superintendent says, tells students they can, too Mark T. Bedell signs three-year contract to lead Kansas City Public Schools
The Maryland school administrator starts job July 1
In visit to KC, he tells students he faced similar obstacles when he was young
New KCPS superintendent Mark Bedell shared his upbringing with district students during lunch at Manual Career & Technical Center. He challenged them not to use their home life as an excuse or crutch. Bedell's mother was an addict who died of an overdose, his brother was recently on trial for second-degree murder, he didn't know his real father and out of eight siblings he is the only one who graduated high school. [email protected]
By Mará Rose Williams
Kansas City’s new superintendent of public schools stood before a room full of high school students Monday afternoon — no podium, no script. He talked about his drug-addicted mother who had died of an overdose and his younger brother, who was found not guilty of second-degree murder.
Mark T. Bedell grew up in a rough neighborhood in Rochester, N.Y., and at one point as a child, he was homeless. Bedell faced economic, emotional and social obstacles during his school years, as many students in the Kansas City district do.
38

His story, one he is openly sharing with students during his visit to the city this week, already has made an impact.
“He is strong-willed,” said Sonia Badji, a senior at Paseo Academy of Fine and Performing Arts who was among 17 student leaders who had lunch with Bedell on Monday.
“I think it is reassuring to hear his story and to know that he is not leaving where he comes from behind,” Badji said. “He knows that where he comes from is what makes him who he is. We can relate to that.”
Bedell, the current assistant superintendent of high schools in Baltimore County, Md., was here to officially sign his $225,000-a-year contract with the Kansas City Public Schools. The three-year contract includes a $31,000 retention bonus if he stays for the duration.
Monday at the Manual Career and Technical Center, 1215 E. Truman Road, the 41-year-old administrator chatted candidly with students and spent about an hour listening to them talk about their plans for college and experiences in the district.
Over lunch prepared by culinary arts students, the young school leaders asked Bedell not only what he will do to put the best teachers in their classrooms but how to assure students are challenged with more academic rigor.
They also asked him to guard against violence when students from a closed high school are moved to a rival school.
With an electronic notebook in hand, Bedell took down their concerns. He mentioned them later in a meeting with district principals.
“I think it is a wonderful opportunity to give these students a chance to address issues that matter to them, to give the students a voice,” said Yamimah Muhammad, whose son Jabriel Muhammad, a freshman at the African Centered College Preparatory Academy, was among the students who met with Bedell.
Bedell told students that “sometimes your environment can be a predictor of ultimately, your outcome in life.”
But, he said, “my job is to come here and to tell you all it doesn’t have to be that way. My job is to come in here and say to all of you it is no excuse. I made it. … I don’t want what you may be going through at home to become a crutch for why you can’t change the trajectory of your life.”
Earlier, Bedell talked about collaborating with community and business leaders, building trust among his staff and with parents and, most importantly, instilling a sense of hope in district students.
Jon Hile, the chairman of the Kansas City Public Schools Board of Education, said Bedell represents “a break from past leadership,” who he said came to the district with promises of a quick fix. “Dr. Bedell represents a new future for Kansas City Public Schools,” Hile said.
Bedell said that changing the district story will be one of the biggest challenges. “We have to convince people that this public school system is their system of choice,” he said.
39

Bedell said that losing students to charter schools affects the district financially. “The money goes with the student,” he said.
Bedell said the job will be tough “but no urban superintendent’s job is easy.” He said he expects to work “long days and long nights,” telling the story about “the good things going on in our schools. And if that means going into some tough neighborhoods I don’t have a problem with that. That’s where I come from.”
Bedell said he will enroll his three school-age children in Kansas City schools and plans a long stay as superintendent.
Bedell takes the reins of a district with shrinking enrollment, low test scores and a less than 70 percent graduation rate. Three years ago, a tight budget and low enrollment forced the district to close half of its schools.
Bedell said one of his priorities will be to bring the provisionally accredited district to full accreditation. He said he will institute a one-on-one mentoring program, which he thinks will narrow the achievement gap and improve retention and graduation rates.
“My expectations for Kansas City school students are the same as the expectations I have for my own children: that they become globally competitive,” Bedell said. “I want happy students. With happy students, you are going to get happy results.”
Shelby Payne, a junior at Paseo Academy, met Bedell during his last visit to Kansas City. “I walked away thinking, ‘I hope that he is serious about what he says because I want to see what he is going to do for this district.’ ”
DaVonne Bailey, a senior at Paseo Academy, said she was most impressed by Bedell’s student-first policy and the way he talked with students, but she intends to hold the new superintendent accountable.
“Even though I am leaving for college, I have brothers and sisters in school, and I want to make sure they have the support of someone who really cares about them and is not just talking at a podium,” Bailey said.
Bedell on Tuesday will tour Lincoln College Preparatory Academy, the Foreign Language Academy, King Elementary School, Gladstone Elementary School and Central Middle School.
Bedell replaces Steve Green, who took a superintendent job in the Atlanta area. Al Tunis will continue as interim superintendent through the end of this school year. Bedell is scheduled to start July 1.
40
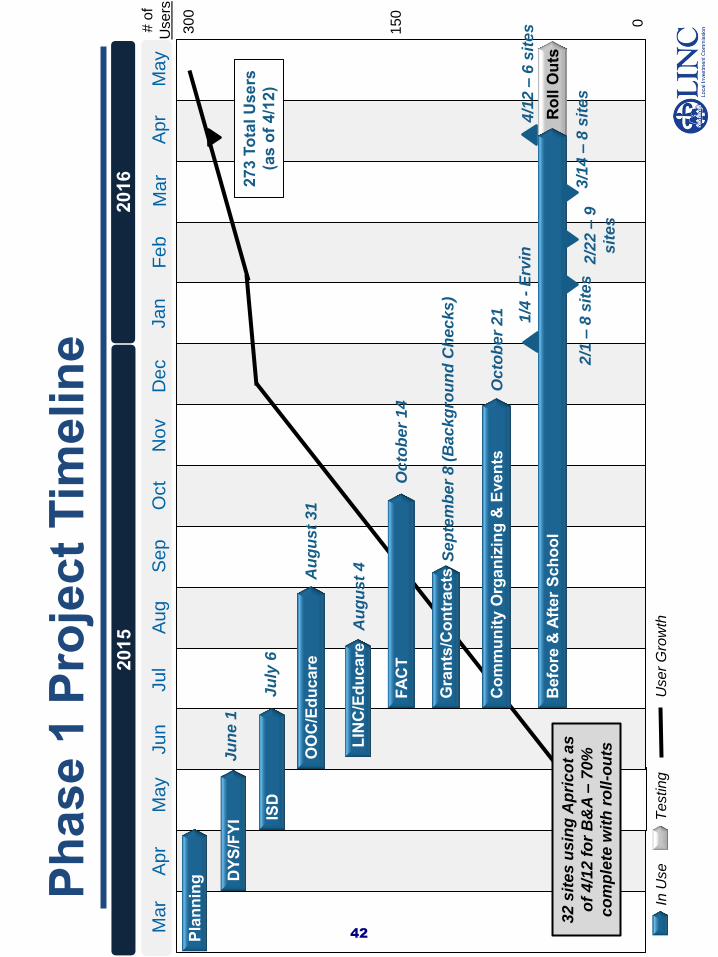
Ph
as
e 1
Pro
jec
t T
ime
lin
e
Ma
r
Apr
Ju
l Ju
n
Ma
y
Aug
Sep
Oct
No
v
De
c
Ja
n
Fe
b
Apr
Ma
r M
ay
2015
2016
In U
se
T
estin
g
27
3 T
ota
l U
se
rs
(as
of
4/1
2)
1/4
- E
rvin
Pla
nn
ing
FA
CT
DY
S/F
YI
OO
C/E
du
ca
re
Gra
nts
/Co
ntr
ac
ts
ISD
Ju
ne 1
Ju
ly 6
Co
mm
un
ity O
rga
niz
ing
& E
ve
nts
Au
gu
st
4
LIN
C/E
du
ca
re
Au
gu
st
31
Oc
tob
er
14
Ro
ll O
uts
B
efo
re &
Aft
er
Sc
ho
ol
Oc
tob
er
21
Se
pte
mb
er
8 (
Ba
ck
gro
un
d C
hec
ks
)
2/1
– 8
sit
es
2
/22
– 9
sit
es
3/1
4 –
8 s
ites
3
2 s
ite
s u
sin
g A
pri
co
t a
s
of
4/1
2 f
or
B&
A –
70
%
co
mp
lete
wit
h r
oll
-ou
ts
Use
r G
row
th
# o
f
Use
rs
0
150
300
4/1
2 –
6 s
ites
42

LIN
C S
ite
s U
sin
g A
pri
co
t Site
s U
sin
g A
pri
co
t
Site
s N
ot
Ye
t U
sin
g
Ap
rico
t
Legend
43
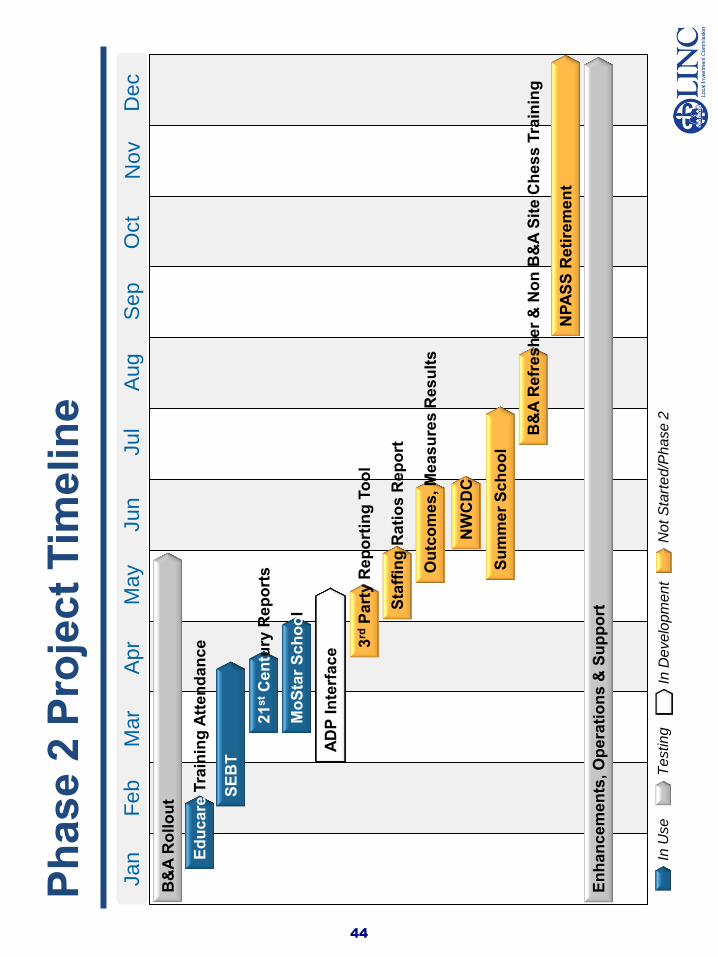
Jan
F
eb
May
Apr
Mar
Jun
Jul
Aug
S
ep
O
ct
AD
P I
nte
rfac
e
Nov
Dec
Sta
ffin
g R
ati
os
Rep
ort
B&
A R
ollo
ut
In U
se
T
estin
g
In D
evelo
pm
ent
No
t S
tart
ed/P
hase
2
21
st C
en
tury
Re
po
rts
SE
BT
Ph
ase 2
Pro
ject
Tim
elin
e
Ed
uca
re T
rain
ing
Att
en
dan
ce
NW
CD
C
Ou
tco
me
s, M
ea
su
res R
es
ult
s
3rd
Pa
rty R
ep
ort
ing
To
ol
Mo
Sta
r S
ch
oo
l
B&
A R
efr
es
her
& N
on
B&
A S
ite C
hes
s T
rain
ing
En
han
ce
me
nts
, O
pe
rati
on
s &
Su
pp
ort
Su
mm
er
Sc
ho
ol
NP
AS
S R
eti
rem
en
t
44

Pro
gre
ss
Sin
ce
Th
e 3
/21
Me
eti
ng
P
ha
se
1
T
rain
ed 1
1 a
dditio
na
l LIN
C s
taff a
nd d
eplo
yed B
efo
re &
Aft
er
School
enro
llments
and a
tte
ndance a
t th
eir 6
sites
P
ha
se
2
R
econcile
d t
he 2
016 K
ansas C
ity,
Hic
km
an M
ills a
nd
Cente
r school
dis
tric
t file
s t
o the 2
015 S
EB
T p
art
icip
ants
and identified p
art
icip
ants
elig
ible
for
2016
D
eplo
yed t
he M
issouri S
tarS
chool fo
rms a
nd r
eport
s f
or
use b
y t
heir
adm
inis
trative s
taff
45

Sat. May 7, 11am- 4pmHill Park Pavilion, 2201 S. Maywood St., Independence, MO
Entertainment • FoodCommunity resources • Family fun
FREE!kclinc.org/dayofthechild
Free parking and shuttle from Korte Elementary, 2437 S. Hardy
Dayof
theChildInternational
46