Limits on the Rate of Evolution Sally Otto Department of Zoology University of British Columbia.
41
Limits on the Rate of Evolution Sally Otto Department of Zoology University of British Columbia
-
date post
19-Dec-2015 -
Category
Documents
-
view
216 -
download
1
Transcript of Limits on the Rate of Evolution Sally Otto Department of Zoology University of British Columbia.

Limits on the Rate of Evolution
Sally Otto
Department of ZoologyUniversity of British Columbia

Rates of morphological evolution
vary enormously...

Some species have changed rapidly in appearanceover tens to hundreds of thousands of years.
Cichlids in African rift lakes
Columbines
Sticklebacks in BCfreshwater lakes
HawaiianDrosophila
Others have remained similar in appearanceover tens to hundreds of million years.
Crocodiles
Sequoias Lungfish
Monotremes

The largest unsolved puzzle in evolution
What factors set the pace of evolutionary change?
?? ??
Rate of Environmental Change Appearance of Mutations Efficiency of Selection Architectural Constraints
…but what are their relative roles??

Fast rates ofmorphological evolution
occur in novel environments...
e.g. Honeycreepers on the Hawaiian islands
RATE OF ENVIRONMENTAL CHANGE

and E. coli in a novel glucose environment
(Lenski and Travisano 1994)
but the rate slows in a static environments.

Evolution can only go where mutations lead it.
The rate of beneficial mutationcan limit the rate of evolution,
especially in novel environmentsand in small populations.
(de Visser et al 1999)
APPEARANCE OF MUTATIONS
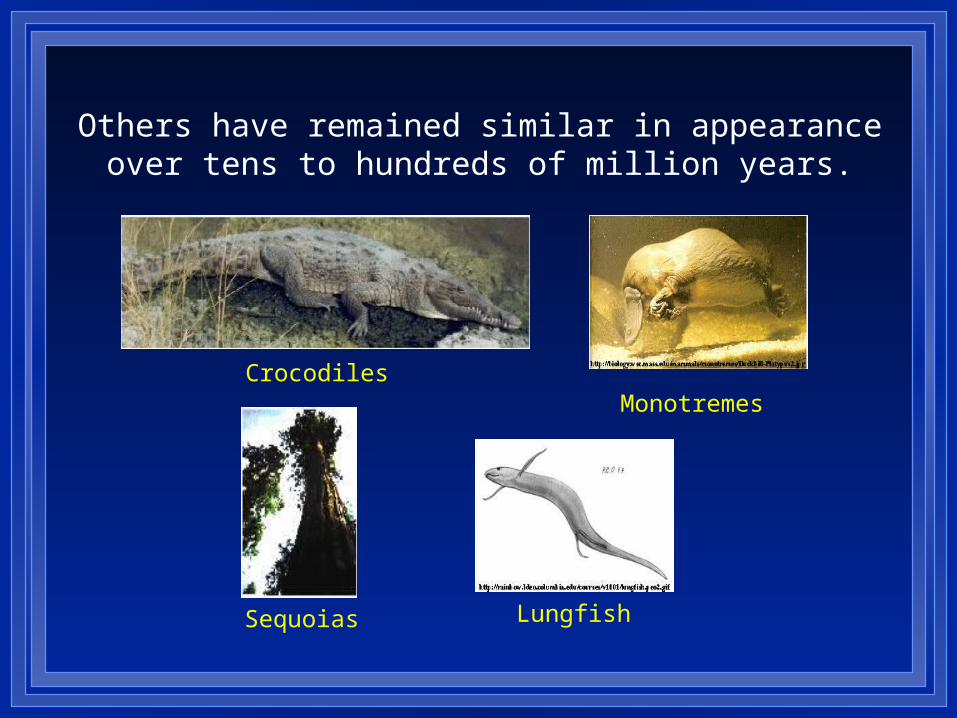
EFFICIENCY OF SELECTION
Natural selection does not causeinstantaneous adaptation.
The spread ofbeneficial alleles
takes time...
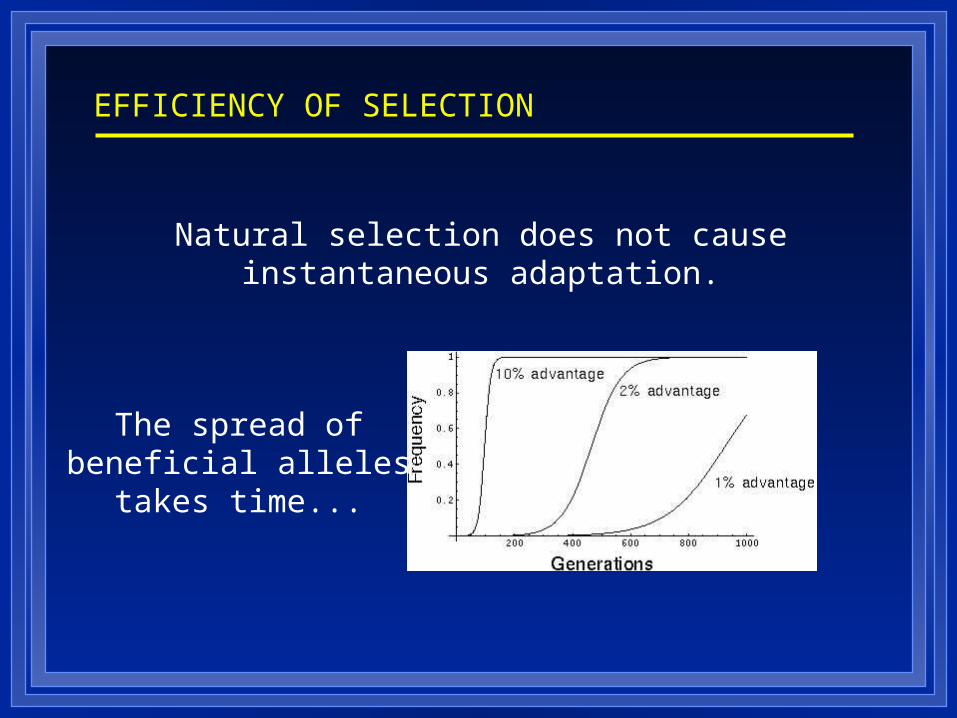
...and new beneficial alleles are often lost by drift.
Aa
1
2
0
3
but this is only an average.
In a population of constant size, each parent produces one offspring, on average.
Individuals carrying a new beneficial allele may have more offspring, say 1+s, on average...

In 1927, Haldane proved the classic result that theprobability of fixation (P) of a new beneficial mutationis approximately 2s in a population of LARGE andCONSTANT size, ignoring other loci.

Where does 2s come from?
Poisson distribution of offspring per parent One offspring per parent on average 1+s offspring per parent carrying a rare beneficial
mutation
Branching Process
When s is small, P is approximately 2s.
1 P e (1s) (1 s) j
j!(1 P) j
j
e (1s)P

expansions contractions fluctuations
Natural populations do not, however, remain constantin size, but experience
In populations changing in size (Nt),what is the probability
of fixation of a new allele?

Exponential growth
1+r for wildtype parents (1+r)(1+s) for parents carrying a
beneficial allele
If a population is growing or shrinking, the averagenumber of offspring per parent is not one but
P 2 (s + r)
(Otto and Whitlock 1997)

Fixation probability with exponential growth:
r=-0.005 r=0 r=0.01 r=0.1
s=0.01 0.012 0.020 0.039 0.197
s=-0.01 0.002 4*10-4 10-5 2*10-20
Diploid population of initial size 100.

Logistic Growth
2 (s+r) when Nt << K
2s when Nt approaches K
Population growth is generally limited, however, and decreases as population size approaches carryingcapacity (K).
Pt 2 (s r)
1 r
s
N tK

Population Size
Growing Shrinking
2
4
6
8
10
1000|
10000|
10|
s=0.001
s=0.01
Pt
2s
0.2
0.4
0.8
1
s=0.001
s=0.01
1100|
1000|
10000|
Time (Measured by Population Size)
(r=0.01, K=1000) (r=0.01, K=10000)
0.6

more likely to fix in growing populations less likely to fix in shrinking populations
Beneficial mutations are:
Population dynamics are as important as selection in determining the fate of new mutations.
less likely to fix in growing populations more likely to fix in shrinking populations
Deleterious mutations are:

Evolutionary forces will reinforce,
rather than counteract,externally caused changes
in population size.

ARCHITECTURAL CONSTRAINTS
Pleiotropy Gene number Linkage relationships
Genomic architecture:

“As a result of complex biochemical, developmental, and regulatory pathways, a single gene will almost always influence multiple traits, a phenomenon known as pleiotropy.”
- Lynch and Walsh (1998)
I - Pleiotropy
One Gene
One TraitX
One Gene
SeveralTraits
Teosinte Maize
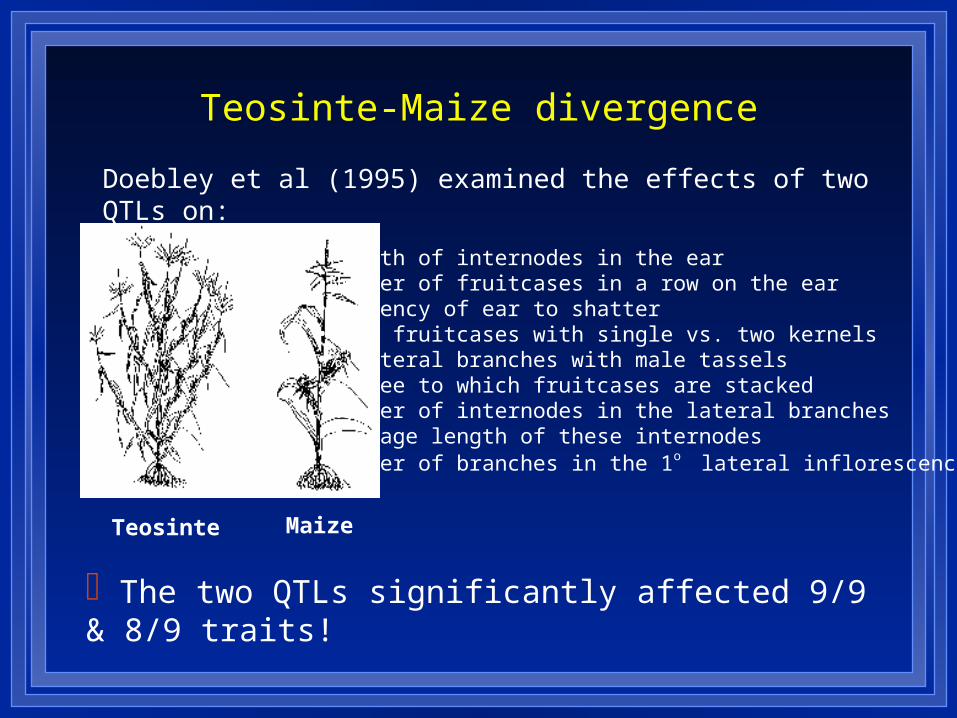
•Length of internodes in the ear •Number of fruitcases in a row on the ear •Tendency of ear to shatter •% of fruitcases with single vs. two kernels •% lateral branches with male tassels •Degree to which fruitcases are stacked•Number of internodes in the lateral branches •Average length of these internodes •Number of branches in the 1o lateral inflorescence
Doebley et al (1995) examined the effects of two QTLs on:
The two QTLs significantly affected 9/9 & 8/9 traits!
Teosinte-Maize divergence

Consider a trait subject to direct artificial or natural selection.
An allele that causes a direct beneficial effect (sd) on this trait may fail to become established due to deleterious pleiotropic effects (sp).
Scenario

1. Fewer alleles are favourable overall (sT = sd + sp must be positive).
2. Among these, the overall selective advantage is lessened.
How does pleiotropy affect the rate of evolution?

- 0.04 - 0.03 - 0.02 - 0.01- 0.05
Pleiotropic selection (s )p
0
Probability
Uniform
Half-normal
Exponential
These quantities can be calculatedfor any given distribution of pleiotropic effects.

- 0.04 - 0.03 - 0.02 - 0.01- 0.05
20
40
60
Pleiotropic selection (s )p
0
Probability
Uniform
s > 0 T
- s d
s < 0 T
|s |2
s
p
d
2
ss d
0s|TT
1. Fraction favourable 2. Overall selective advantage

In general, when pleiotropy is extensive and strong…
Only a fraction of alleles that are beneficial to the trait will be favourable overall.
Among these, pleiotropy on average halves the selective advantage.

Implications
• Pleiotropy will slow evolutionary change, especially when selection acts weakly on novel functions ( GxE).
• The exact traits that have been favoured by natural selection will be difficult to identify, because even costly phenotypic changes may have arisen pleiotropically.
II - Gene Number
When genetic change is constrained by pleiotropy,the rate of evolution may be increased
by gene or genome duplication.

Reproduction Insects Fish Amphibia Reptiles Mammals
Parthenogens 80 10 4 14 (1) 0
Sexuals (3) 20 (2) 24 (2) 1 1
? 0 17 0 0 0
Polyploidy among animals
Key polyploid events early in the evolution of vertebrates, ray-finned fish, salmonids, catostomids...

Gene conservation
Among ancient polyploids, a surprisingly high fraction of gene duplicates are preserved:
• ~ 8-13% retained in duplicate in yeast (Wolfe & Shields 1997)• ~ 50% retained in duplicate in vertebrates (Nadeau & Sankoff 1997) • ~ 50% retained in duplicate in Xenopus (Hughes & Hughes 1993)• ~ 50% retained in duplicate in salmonids & catastomids (Bailey et al 1978)• ~ 72% retained in duplicate in maize (Ahn & Tanksley 1993)
“Gene duplication...allows each daughter gene to specializefor one of the functions of the ancestral gene.” (Hughes 1994)

Rate of adaptation

Implications
• Polyploidy events have occurred repeatedly among animals and plants.
• Polyploids are not evolutionary dead-ends and may have higher rates of evolution.
• Polyploidization may have played a key role in evolution, freeing genes from the constraints of pleiotropy and allowing the evolution of more complex patterns of gene expression.
“For, unless advantageous mutations occurso seldom that each has had time to becomepredominant before the next appears, theycan only come to be simultaneously in thesame gamete by means of recombination.”
- R. A. Fisher (1930)
III - Genetic Associations

CONCLUSIONS
Evolutionary change is limited by a variety of factors (environmental change, mutation, selection, genomic architecture).
We are gaining a better appreciation for the effects of these various factors,but determining their relative roles remains one of the most important open questions in evolutionary biology.

Fisher-Muller Hypothesis
aBAB
ABAB
ABAB
AB
AB
AB
AB AB
ABAB
AB
AB
aBAB
ABAB
AB
ABAB
AB AB
ABAB
aB
aB
aBAb
abab
abab
ab
abab
ab ab
abab
ab
ab
abab
Mutation to b
ABAB
ABAB
ABAB
AB
AB
AB
AB AB
ABAB
AB
AB
Mutation to a
aBaBaB
aBaBaB
aBaB aB
aBaB aBaBaB
aB
With recombination
Without recombination
Time
2 s
1.6 s
1.2 s
0.8 s
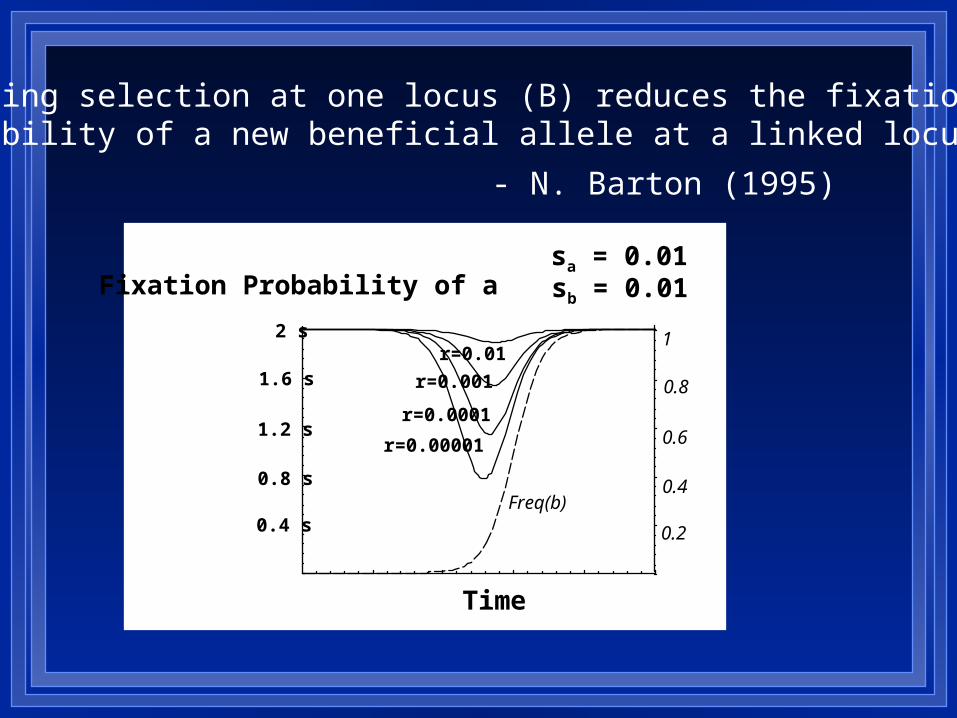
0.4 sFreq(b)
Fixation Probability of a
Time
r=0.00001
r=0.0001
r=0.001
r=0.011
0.8
0.6
0.4
0.2
sa = 0.01sb = 0.01
On-going selection at one locus (B) reduces the fixationprobability of a new beneficial allele at a linked locus (A).
- N. Barton (1995)

Evolution of recombination
A modifier gene that increases recombinationbecomes associated with beneficial alleles
that are more likely to fix.
As these successful alleles spread,the modifier is dragged along
by genetic hitchhiking.

By increasing the fixation probability of beneficial mutations,modifiers that increase recombination rise in frequency.
- Otto & Barton (1997)
Time
0.0001
0.0002
0.0003
Change in Modifier
0
1
0.5
0
Freq(b)
sa = 0.01
sb = 0.1
R = 0.001
rMM = 0.01
rMm = 0.02
rmm = 0.03

Selection acting on a modifier of recombination is :
2 s r / r for a tightly linked chromosome2 s3 r / N for a one Morgan chromosome
: rate of beneficial mutations throughout populationper chromosome per generation
s: average selection coefficient of beneficial mutation
r: average rate of recombination between genes
r: effect of modifier on r
N: population size

The Fisher-Muller mechanism can select
for increased recombination and sex
within a population, but the effect is weak
unless linkage is tight or
beneficial mutations are common.