Limited Access to Airport Facilities and Market Power in ...
29
467 [Journal of Law and Economics, vol. 53 (August 2010)] 2010 by The University of Chicago. All rights reserved. 0022-2186/2010/5303-0018$10.00 Limited Access to Airport Facilities and Market Power in the Airline Industry Federico Ciliberto University of Virginia Jonathan W. Williams University of Georgia Abstract We investigate the role of limited access to airport facilities as a determinant of the hub premium in the U.S. airline industry. We use original data from competition plans that airports are required to submit to the U.S. Department of Transportation in compliance with the Aviation Investment and Reform Act for the Twenty-First Century. We collect information on the availability and control of airport gates, leasing arrangements, and other restrictions limiting the expansion of airport facilities. We find that the hub premium is increasing in the ticket fare. We find that control of gates is a crucial determinant of this premium. Limits on the fees that airlines can charge for subleasing their gates lower the prices charged by airlines. Finally, control of gates and restrictions on sublease fees explain high fares only when there is a scarcity of gates relative to the number of departures from an airport. 1. Introduction In this paper, we investigate the size and the determinants of the hub premium, by which we mean the difference between the fares charged for trips into and out of airports where major airlines have their hubs and the fares charged for trips that are similar but do not originate from or end in a hub. We focus on the role of operating practices limiting access to airport facilities We thank Dennis Carlton and an anonymous referee for detailed and constructive suggestions. The paper has benefited from our conversations with Leora Friedberg, David Mills, Oliver Richard, Nicolas Rupp, Steven Stern, and Anming Zhang; participants at the 2006 Southern Economic As- sociation meetings and the 2007 International Industrial Organization Conference; and seminar participants at the U.S. Department of Justice. We thank Joe Hebert and Andrea Toney at theFederal Aviation Administration for helping us in the collection of the airports’ competition plans. Berna Karali provided excellent research assistance. Federico Ciliberto gratefully acknowledges financial support from the Bankard Fund for Political Economy at the University of Virginia. Jonathan Williams gratefully acknowledges support from the John M. Olin Foundation at the University of Virginia School of Law and from the Bankard Fund for Political Economy at the University of Virginia.
Transcript of Limited Access to Airport Facilities and Market Power in ...

467
[Journal of Law and Economics, vol. 53 (August 2010)]� 2010 by The University of Chicago. All rights reserved. 0022-2186/2010/5303-0018$10.00
Limited Access to Airport Facilities andMarket Power in the Airline Industry
Federico Ciliberto University of Virginia
Jonathan W. Williams University of Georgia
Abstract
We investigate the role of limited access to airport facilities as a determinantof the hub premium in the U.S. airline industry. We use original data fromcompetition plans that airports are required to submit to the U.S. Departmentof Transportation in compliance with the Aviation Investment and Reform Actfor the Twenty-First Century. We collect information on the availability andcontrol of airport gates, leasing arrangements, and other restrictions limitingthe expansion of airport facilities. We find that the hub premium is increasingin the ticket fare. We find that control of gates is a crucial determinant of thispremium. Limits on the fees that airlines can charge for subleasing their gateslower the prices charged by airlines. Finally, control of gates and restrictionson sublease fees explain high fares only when there is a scarcity of gates relativeto the number of departures from an airport.
1. Introduction
In this paper, we investigate the size and the determinants of the hub premium,by which we mean the difference between the fares charged for trips into andout of airports where major airlines have their hubs and the fares charged fortrips that are similar but do not originate from or end in a hub.
We focus on the role of operating practices limiting access to airport facilities
We thank Dennis Carlton and an anonymous referee for detailed and constructive suggestions.The paper has benefited from our conversations with Leora Friedberg, David Mills, Oliver Richard,Nicolas Rupp, Steven Stern, and Anming Zhang; participants at the 2006 Southern Economic As-sociation meetings and the 2007 International Industrial Organization Conference; and seminarparticipants at the U.S. Department of Justice. We thank Joe Hebert and Andrea Toney at the FederalAviation Administration for helping us in the collection of the airports’ competition plans. BernaKarali provided excellent research assistance. Federico Ciliberto gratefully acknowledges financialsupport from the Bankard Fund for Political Economy at the University of Virginia. Jonathan Williamsgratefully acknowledges support from the John M. Olin Foundation at the University of VirginiaSchool of Law and from the Bankard Fund for Political Economy at the University of Virginia.

468 The Journal of LAW& ECONOMICS
that Borenstein (1989) and the Government Accounting Office (GAO) (1989,1990) identify as a set of potential barriers to entry in the airline industry andthat could explain the hub premium and, more generally, high airline fares.1
Such operating practices are quite simple to describe. Airlines need ticket coun-ters, baggage check-in rooms, baggage claim areas, and, most important, en-planing/deplaning gates to provide service at an airport. However, access to theseairport facilities is typically regulated by long-term exclusive contracts betweenairlines and airports. Thus, new entrants typically can gain access to an airportonly by paying sublease fees.2 These institutional barriers to entry should beassociated with higher prices, particularly at airports where gates are a scarceresource, such as airports where the number of departures is very large relativeto the number of gates available.
We build a unique and original data set to measure the importance of operatingpractices as determinants of the hub premium. The data are from competitionplans that airports are required to submit to the U.S. Department of Transpor-tation in compliance with the Wendell H. Ford Aviation Investment and ReformAct for the Twenty-First Century (AIR 21). The act, which was signed into lawin April 2000, states that beginning in fiscal year 2001, no federal grant wouldbe made to fund any one of a set of major airports unless the airport hadsubmitted a written competition plan. The competition plan must include in-formation on the availability of airport gates and related facilities, leasing andsubleasing arrangements, gate use requirements, gate assignment policies, andwhether the airport intends to build or acquire gates that would be used ascommon facilities (106th Cong., 2nd Sess., sec. 155.f[1–2]).
We estimate a linear specification of the (reduced-form) pricing equation. Tocontrol for the significant number of unobserved factors affecting consumers’decisions to fly and the costs of offering service on any particular route, weinclude route-carrier fixed effects. This has the advantage of providing a clearsource of identifying variation for the parameters of interest while still allowingus to recover the effect of time-invariant barriers to entry on equilibrium pricingdecisions using the minimum distance procedure of Chamberlain (1982).
We report three main findings. First, the hub premium is increasing in theticket fare. The hub premium is lower than 10 percent at the 10th percentile ofthe fare distribution and almost as high as 25 percent at its 90th percentile.
Second, we find that the hub premium is reduced by almost one-half if weinclude our measures of barriers to entry in the empirical analysis. We showthat the control of gates leased on an exclusive basis by an airline is a crucial
1 See Carlton (2004), Schmalensee (2004), and McAfee, Mialon, and Williams (2004) for a debateon the economics of barriers to entry. The institutional barriers to entry that we examine in thispaper are the result of explicit contractual agreements that limit potential competitors’ access to thenecessary airport facilities to offer service.
2 Borenstein (1989) and Government Accounting Office (1989, 1990) also identify marketingpractices that might explain higher fares. Incumbent airlines use frequent-flyer programs and volumeincentives for travel agents to build a loyal customer base, which makes entry by new carriers moredifficult. Direct data on these practices remain unavailable.

Airport Facilities and Market Power 469
determinant of the hub premium. In particular, if the percentage of gates con-trolled by the carrier increases from 10 to 30 percent, fare prices increase by 3percent. Other variables that are associated with high premia are those that recordthe presence of restrictions on the fees that airlines can charge for subleasingtheir gates. Prices are 2 percent lower when limits on sublease fees are in place.
Finally, we construct a new measure of congestion, which is defined here asthe ratio of the total number of quarterly departures from an airport to thenumber of gates at an airport. We show that the interaction of this new variablewith the measures of barriers to entry plays a crucial role in explaining the hubpremium. At an airport where there are approximately 600 departures per gatein a quarter (for example, Atlanta), a 30 percent difference in the gates leasedwould lead to a difference of 6 percent in fare prices. At an airport where thereare approximately 200 departures per gate (for example, Nashville), a 30 percentdifference would lead to a 2 percent difference in prices. Similarly, we show thatat an airport where there are approximately 600 departures per gate, the presenceof a limit on the sublease fees lowers the premium by approximately 11 percentbut decreases it by only 2 percent at airports with 120 departures per gate. Thus,exclusive control of gates explains high fares only when there is a scarcity ofgates relative to the number of departures at an airport. This finding suggeststhat efforts to improve access to gates should be concentrated on those majorairports that are most congested (that is, airports that have a large number ofdepartures relative to the number of boarding gates).
These results are novel and important because they show a direct, clear re-lationship between limited access to airport facilities and hub premia. Previousworks could provide only indirect evidence of the relationship between limitedaccess to airport facilities and hub premia. For example, Borenstein (1989) prox-ied limited access to airport facilities with a measure of an airline’s airportdominance, the percentage of passengers flying on one airline at an airport.Borenstein showed that airlines’ fares were positively correlated with the airline’sshare of passengers on the route and at the endpoint airports.3 Clearly, the mainlimitation of using indirect evidence is that the proxy might capture only partof the effect of limited access to gates on hub premia. We show that this is thecase: once we control for route-carrier fixed effects, the percentage of passengersflying on one airline at an airport does not pick up any of the effect of limitedaccess to airport facilities on hub premia.
We provide a description of the data that we collected from the airports’competition plans in Section 2. The fare and passenger data are described in
3 Evans and Kessides (1993) add market and, separately, firm fixed effects and confirm Borenstein’sfinding (1989) that airport dominance by a carrier is correlated with higher fares; however, they donot find that dominance at the route level is statistically or economically significant. Evans andKessides conclude that the most promising direction for public policy aimed at improving theindustry’s performance is to ensure equal access to sunk airport facilities. This is exactly what weconfirm in this paper.

470 The Journal of LAW& ECONOMICS
Section 3. Our econometric specification is discussed in Section 4. We thenprovide a detailed description of the results in Section 5. Section 6 concludes.
2. Limited Access to Airport Facilities
2.1. The Aviation Investment and Reform Act for the Twenty-First Century
In response to governmental, public, and academic concern about the existenceof institutional barriers to entry in the airline industry, President Bill Clintonsigned AIR 21 into law on April 5, 2000. The act identified a set of major airportsthat, on a reasonable basis, had to be available to all carriers wishing to servethem. The set of airports identified by AIR 21 were commercial service airportsthat had more than .25 percent of the total number of passenger boardings eachyear in the United States and had one or two air carriers that controlled morethan 50 percent of the passenger boardings.4
As a result of AIR 21, all of these airports compiled competition plans. Wewere able to collect the competition plans and construct a cross section of datafor which the unit of observation is the airport. From these plans, we gatheredinformation on the availability of airport gates, leasing and subleasing arrange-ments of gates and other airport facilities, and agreements between airlines andairports.5
There is one potential limitation of the data that we collected. We have onlyone observation for each airport, and the observation is for 1 year between 2001and 2004. To address this limitation of the data, we restrict our analysis to theyears 2002, 2003, and 2004. For these years, the data on the limited access toairport facilities is appropriate, given the long-term nature of the contracts thatairlines sign with airports for the use of gates. The Government AccountabilityOffice (GAO 1990) reports that 22 percent of the gates at the 66 largest airportswere for 3–10 years’ duration, 25 percent were for 11–20 years’ duration, and41 percent were for more than 20 years’ duration.6 It is also worth noting thatairlines cannot terminate leases unilaterally. For example, in the case of DallasLove Field airport, American Airlines sought termination of the gate lease agree-
4 These airports consist of large and medium hubs at which one or two airlines board more than50 percent of the passengers. See Section A2.
5 Washington National, New York’s LaGuardia, and Dallas Love Field (the main hub of Southwest)have perimeter rules that limit long-haul flights to and from these airports. For example, nonstopflights from Phoenix to Washington National and LaGuardia were prohibited until 2004. Becausein this paper we do not distinguish nonstop service and connecting service as different products,we do not include perimeter rules in the analysis. Washington National, Chicago O’Hare, and NewYork’s LaGuardia and Kennedy have slot controls to reduce congestion by limiting the number oftakeoffs and landings per hour. However, we have only the competition plans for Washington Reaganand O’Hare, and including route-carrier fixed effects practically rules out the use of variables mea-suring the effects of slot restrictions.
6 For example, in the competition plan submitted in 2000 by the Philadelphia International Airport,we read that the lease agreements were signed in 1974 and expire in 2006. In the competition plansubmitted in 2000 by Hartsfield-Jackson Atlanta International Aiirport, we read that exclusive-useleases for gates and other facilities expire on September 20, 2010.
Airport Facilities and Market Power 471
ments with the airport. American no longer used the gates but was obligated tocontinue paying $335,000 per year.7 The Dallas Love Field airport declined toterminate the lease agreement, and American will have to pay until 2011, whenthe lease expires.8
2.2. Access to Gates
Airlines require enplaning/deplaning gates to provide service at an airport. Anexclusive-use lease gives the lessee the sole right to use the facilities in question.The GAO (1990) reports that nearly 88 percent of the gates at the 66 largestairports were leased to airlines, and 85 percent of those were leased for exclusiveuse. Most of the remaining gates were leased on a preferential basis, giving thelessee the first right to use the facilities. For example, in Salt Lake City, 96 percentof the gates were leased on an exclusive-use basis, and 3 percent were leased ona preferential-use basis in 1996 (Transportation Research Board 1999). Someairports (16 percent) have use-or-lose provisions for exclusive leases, allowingthe airport to gain control of the gate if the lessee does not use the gates. However,an airline must cease all operations for 1–3 months before losing the right tothe gates, which is unlikely to occur (GAO 1990).
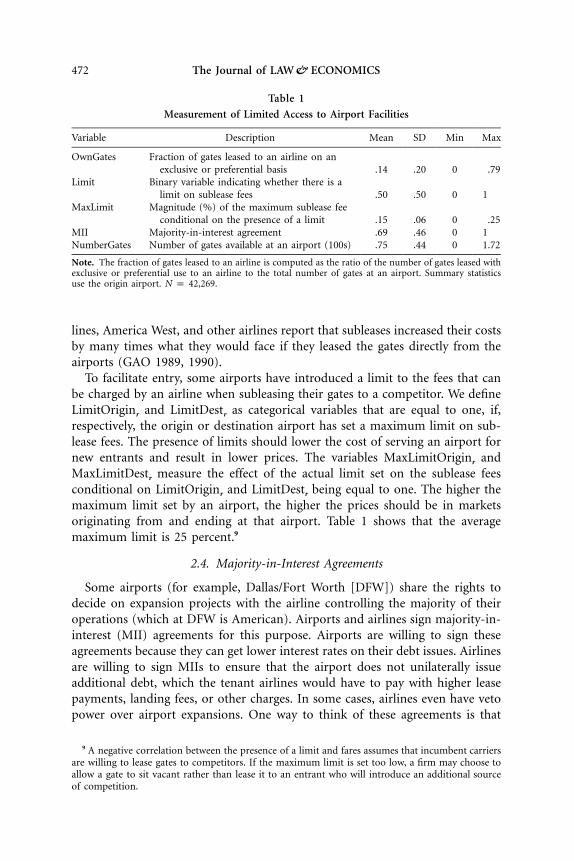
Among the information included in the competition plans is airports’ reportsof the total number of gates available, the number of gates for common use(leased on neither an exclusive nor preferential basis), and the number of gatesleased to each airline on an exclusive or preferential basis. We construct threevariables to code this information. First, we define OwnGatesOriginjr andOwnGatesDestjr, which measure the percentage of gates leased on an exclusiveor preferential basis to airline j at, respectively, the origin and destination endpoints of route r. We construct OwnGatesOriginjr and OwnGatesDestjr for thefollowing airlines: American, Continental, Delta, Northwest, United, US Airways,and America West. We do not make a distinction between exclusive and pref-erential leases because even in this second framework, airlines can maintaincontrol of the gates as long as they use them. Table 1 shows that, on average,an airline controls 13.6 percent of the gates at an airport, but one airline cancontrol up to 79 percent of them. Second, we define NumberGatesOriginjr andNumberGatesDestjr, which measure the total number of gates located at theorigin and destination endpoints, respectively, of route r.
2.3. Sublease Fees
When an entrant wants to start service at an airport where most of the gatesare leased on an exclusive or preferential basis, its main option is to subleasethe gates and other facilities from an incumbent. Officials from Southwest Air-
7 Letter from Kenneth W. Gwyn, Director of Aviation, City of Dallas, to Catherine M. Lang, DeputyDirector of Airport Planning and Programming, Federal Aviation Administration, June 30, 2003.
8 Letter from Kenneth W. Gwyn, Director of Aviation, City of Dallas, to Catherine M. Lang, DeputyDirector of Airport Planning and Programming, Federal Aviation Administration, February 28, 2005.
472 The Journal of LAW& ECONOMICS
Table 1
Measurement of Limited Access to Airport Facilities
Variable Description Mean SD Min Max
OwnGates Fraction of gates leased to an airline on anexclusive or preferential basis .14 .20 0 .79
Limit Binary variable indicating whether there is alimit on sublease fees .50 .50 0 1
MaxLimit Magnitude (%) of the maximum sublease feeconditional on the presence of a limit .15 .06 0 .25
MII Majority-in-interest agreement .69 .46 0 1NumberGates Number of gates available at an airport (100s) .75 .44 0 1.72
Note. The fraction of gates leased to an airline is computed as the ratio of the number of gates leased withexclusive or preferential use to an airline to the total number of gates at an airport. Summary statisticsuse the origin airport. N p 42,269.
lines, America West, and other airlines report that subleases increased their costsby many times what they would face if they leased the gates directly from theairports (GAO 1989, 1990).
To facilitate entry, some airports have introduced a limit to the fees that canbe charged by an airline when subleasing their gates to a competitor. We defineLimitOriginr and LimitDestr as categorical variables that are equal to one, if,respectively, the origin or destination airport has set a maximum limit on sub-lease fees. The presence of limits should lower the cost of serving an airport fornew entrants and result in lower prices. The variables MaxLimitOriginr andMaxLimitDestr measure the effect of the actual limit set on the sublease feesconditional on LimitOriginr and LimitDestr being equal to one. The higher themaximum limit set by an airport, the higher the prices should be in marketsoriginating from and ending at that airport. Table 1 shows that the averagemaximum limit is 25 percent.9
2.4. Majority-in-Interest Agreements
Some airports (for example, Dallas/Fort Worth [DFW]) share the rights todecide on expansion projects with the airline controlling the majority of theiroperations (which at DFW is American). Airports and airlines sign majority-in-interest (MII) agreements for this purpose. Airports are willing to sign theseagreements because they can get lower interest rates on their debt issues. Airlinesare willing to sign MIIs to ensure that the airport does not unilaterally issueadditional debt, which the tenant airlines would have to pay with higher leasepayments, landing fees, or other charges. In some cases, airlines even have vetopower over airport expansions. One way to think of these agreements is that
9 A negative correlation between the presence of a limit and fares assumes that incumbent carriersare willing to lease gates to competitors. If the maximum limit is set too low, a firm may choose toallow a gate to sit vacant rather than lease it to an entrant who will introduce an additional sourceof competition.
Airport Facilities and Market Power 473
the carriers put themselves at risk because they bear some of the costs of theairport’s facilities.
The airport competition plans report whether the airport has an MII agreementwith airlines that serve the airport. However, the competition plans typically arequite vague in terms of the specifics of these agreements. We define two variables,MiiOriginr and MiiDestr, to measure the effect that these types of agreementshave on prices.
3. Airline Data
Our empirical analysis relies on data from three publicly available sourcesother than the competition plans.10 As with previous studies of the industry, asignificant portion of our data comes from the Airline Origin and DestinationSurvey (DB1B). The DB1B is a 10 percent sample of tickets from all reportingcarriers and includes information on the origin, destination, and fare paid aswell as details regarding any connections an individual makes en route to hisor her final destination.
In addition to the DB1B, we use information from the T-100 Domestic Seg-ment data set, which provides details on each carrier’s nonstop flights betweentwo particular airports. The data are reported monthly and include informationon the carrier, origin, destination, aircraft type, service class for transportedpassengers, freight and mail, available capacity (number of seats), scheduleddepartures, departures performed, aircraft hours, and load factor.
The remainder of the data are taken from the Schedule P-12 database, whichreports quarterly profit and loss statements for carriers with annual operatingrevenues of $20 million or more. This database includes quarterly operatingrevenues and expenses, depreciation and amortization, operating profit, incometax, and net income.
3.1. Market
A market is defined as a unidirectional trip between two airports, regardlessof the number of stops that the traveler had to make in between (see Peters2006). This definition permits us to analyze whether the hub premium is differenton routes to and from the hub. The data set includes all markets between airportsidentified by AIR 21 as the set of major airports that had to be available to allcarriers on a reasonable basis. There are 1,375 unidirectional (airport-to-airport)routes.
3.2. Carrier
There were nine national carriers between 2002 and 2004: American, Con-tinental, Delta, America West, Northwest, United, US Airways, and Southwest.
10 A more detailed description of the data is provided in the Appendix.

474 The Journal of LAW& ECONOMICS
In addition, there are three low-cost carriers with a strong national presence:AirTran, ATA, and Frontier. Finally, there is a remaining group of independentlow-cost carriers providing mostly regional service. We combine this third groupof smaller carriers into one group, which we call the LCC type. This helps usto avoid dropping small carriers that are present in few markets and to use ameaningful grouping while capturing the effect of their presence in the market.
3.3. Itinerary Fare
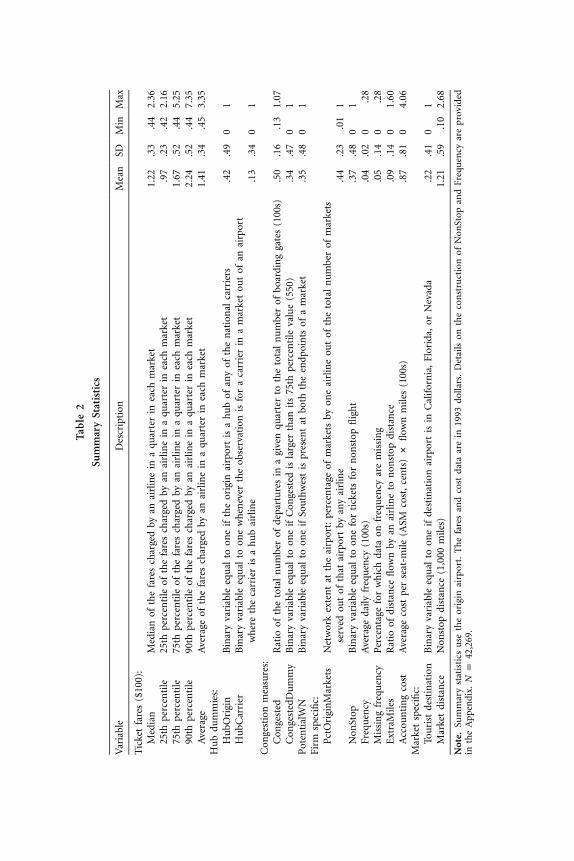
The DB1B is a 10 percent sample of tickets sold by airlines in a quarter. Thisdata set does not provide information on either the date when the ticket wassold or used or the characteristics of the buyer. However, the DB1B does provideinformation on the characteristics of the trip, such as details of connections madeby the passenger and whether the ticket is for round-trip travel. We summarizethe airline pricing behavior using the mean, median, and the 25th, 75th, and90th percentiles. By doing so, we use some information on the distribution ofprices available from the DB1B data set while using as few statistics as possible.12
Table 2 presents summary statistics for the five measures of itinerary faresused in this paper. The fares are measured in 1993 dollars. The difference betweenthe 75th percentile of the fares ($166.9) and the median ($121.9) is twice aslarge as the difference between the median and the 25th percentile of the fares($97.1), which suggests that there is much more dispersion at the top of thedistribution than at the bottom. This is confirmed by the average ticket fare,which is equal to $140.9, almost 1 standard deviation above the median.
3.4. Hub Categorical Variables
The classification of airports as hubs is to some extent arbitrary because itrequires a threshold for the percentage of passengers using the airport who aretraveling through, rather than to or from, the airport. There are two problemswith using such a threshold. First, the percentage of passengers traveling throughan airport is a function of the price charged by the airlines, which is the dependentvariable. Second, airlines can change their hubs over time. In light of these twoobservations, we use a conservative definition of “hubs.” (See Table 3 for airportsthat we define as hubs. All airports shown were hubs during the period understudy.)
We define HubUmbrellaOriginjr to be equal to one if the origin airport is ahub of any of the national carriers. We define HubUmbrellaDestjr similarly, usingthe destination airport. Then, we define HubCarrierOriginjr to be equal to onewhenever the observation is for carrier j out of an airport where carrier j is thehub airline. Thus, HubUmbrellaOriginjr is equal to one whenever Hub-CarrierOriginr is equal to one, but not vice versa. We define HubCarrierDestjr
similarly. These four categorical variables play a critical role in our analysis
12 See Armantier and Richard (2008) for an interesting way to use information from the distributionof prices.
Tab
le2
Sum
mar
ySt
atis
tics
Var
iabl
eD
escr
ipti
onM
ean
SDM
inM
ax
Tic
ket
fare
s($
100)
:M
edia
nM
edia
nof
the
fare
sch
arge
dby
anai
rlin
ein
aqu
arte
rin
each
mar
ket
1.22
.33
.44
2.36
25th
perc
enti
le25
thpe
rcen
tile
ofth
efa
res
char
ged
byan
airl
ine
ina
quar
ter
inea
chm
arke
t.9
7.2
3.4
22.
1675
thpe
rcen
tile
75th
perc
enti
leof
the
fare
sch
arge
dby
anai
rlin
ein
aqu
arte
rin
each
mar
ket
1.67
.52
.44
5.25
90th
perc
enti
le90
thpe
rcen
tile
ofth
efa
res
char
ged
byan
airl
ine
ina
quar
ter
inea
chm
arke
t2.
24.5
2.4
47.
35A
vera
geA
vera
geof
the
fare
sch
arge
dby
anai
rlin
ein
aqu
arte
rin
each
mar
ket
1.41
.34
.45
3.35
Hu
bdu
mm
ies:
Hu
bOri
gin
Bin
ary
vari
able
equ
alto
one
ifth
eor
igin
airp
ort
isa
hu
bof
any
ofth
en
atio
nal
carr
iers
.42
.49
01
Hu
bCar
rier
Bin
ary
vari
able
equ
alto
one
whe
nev
erth
eob
serv
atio
nis
for
aca
rrie
rin
am
arke
tou
tof
anai
rpor
tw
her
eth
eca
rrie
ris
ah
ub
airl
ine
.13
.34
01
Con
gest
ion
mea
sure
s:C
onge
sted
Rat
ioof
the
tota
ln
um
ber
ofde
part
ure
sin
agi
ven
quar
ter
toth
eto
tal
nu
mbe
rof
boar
din
gga
tes
(100
s).5
0.1
6.1
31.
07C
onge
sted
Du
mm
yB
inar
yva
riab
leeq
ual
toon
eif
Con
gest
edis
larg
erth
anit
s75
thpe
rcen
tile
valu
e(5
50)
.34
.47
01
Pot
enti
alW
NB
inar
yva
riab
leeq
ual
toon
eif
Sou
thw
est
ispr
esen
tat
both
the
endp
oin
tsof
am
arke
t.3
5.4
80
1Fi
rmsp
ecifi
c:P
ctO
rigi
nM
arke
tsN
etw
ork
exte
nt
atth
eai
rpor
t:pe
rcen
tage
ofm
arke
tsby
one
airl
ine
out
ofth
eto
tal
nu
mbe
rof
mar
kets
serv
edou
tof
that
airp
ort
byan
yai
rlin
e.4
4.2
3.0
11
Non
Stop
Bin
ary
vari
able
equ
alto
one
for
tick
ets
for
non
stop
flig
ht.3
7.4
80
1Fr
equ
ency
Ave
rage
daily
freq
uen
cy(1
00s)
.04
.02
0.2
8M
issi
ng
freq
uen
cyP
erce
nta
gefo
rw
hic
hda
taon
freq
uen
cyar
em
issi
ng
.05
.14
0.2
8E
xtra
Mile
sR
atio
ofdi
stan
cefl
own
byan
airl
ine
ton
onst
opdi
stan
ce.0
9.1
40
1.60
Acc
oun
tin
gco
stA
vera
geco
stpe
rse
at-m
ile(A
SMco
st,
cen
ts)
#fl
own
mile
s(1
00s)
.87
.81
04.
06M
arke
tsp
ecifi
c:To
uri
stde
stin
atio
nB
inar
yva
riab
leeq
ual
toon
eif
dest
inat
ion
airp
ort
isin
Cal
ifor
nia
,Fl
orid
a,or
Nev
ada
.22
.41
01
Mar
ket
dist
ance
Non
stop
dist
ance
(1,0
00m
iles)
1.21
.59
.10
2.68
Not
e.Su
mm
ary
stat
isti
csu
seth
eor
igin
airp
ort.
Th
efa
res
and
cost
data
are
in19
93do
llars
.D
etai
lson
the
con
stru
ctio
nof
Non
Stop
and
Freq
uen
cyar
epr
ovid
edin
the
App
endi
x.N
p42
,269
.

476 The Journal of LAW& ECONOMICS
Table 3
Control of Gates at Hubs and Other Large Airports
Airport Carrier HubCarrier OwnGates (%) Limit MaxLimit (%)
St. Louis American 1 .22 1 .15Washington Reagan US Airways 0 .32 0Chicago O’Hare American 1 .35 0Chicago O’Hare United 1 .35 0San Jose, Calif. American 0 .36 0Cincinnati Delta 1 .42 0Charlotte, N.C. US Airways 1 .43 1 .15Atlanta Delta 1 .55 1 0Philadelphia US Airways 1 .50 0Phoenix America West 1 .40 1 .15Baltimore US Airways 0 .52 0Newark, N.J. Continental 1 .58 0Denver United 1 .60 0Cleveland Continental 1 .60 1 .1Detroit Northwest 1 .68 1 .15Dallas/Fort Worth American 1 .64 0Salt Lake City Delta 0 .67 0Minneapolis Northwest 1 .72 1 .15Houston (IAH) Continental 1 .75 0
Note. Airports shown are either the hubs of a legacy carrier or airports where one carrier controls morethan 30 percent of the gates. OwnGates denotes the percentage of gates leased to the airline with the largestshare at an airport (for example, American Airlines at St. Louis). Limit is a categorical variable equal toone if the airport has a limit on sublease fees. If the airport has a limit, then MaxLimit reports its magnitude.
because their interpretation is related to the debate on the hub premium in avery simple fashion.
First, these four hub variables measure whether prices and markups are stillhigher in hub markets, after we control for various determinants of prices—most important, the new measures of barriers to entry. Second, we identifywhether hub airlines charge a premium on tickets for markets out of their hubairport, compared with tickets for markets into the same airport. The differencefor tickets on markets out of the hub and tickets on markets into the hub is thedifference between the sum of the coefficients of HubUmbrellaOriginr andHubCarrierOriginjr and the sum of the coefficients of HubUmbrellaDestr andHubCarrierDestjr. Finally, the coefficient estimates of HubUmbrellaOriginr andHubUmbrellaDestr measure the presence of umbrella effects, or a measure ofthe benefit to carriers with smaller operations in hub markets. Should we findHubUmbrellaOriginr to be positive and significant, we would conclude that allcarriers can charge a premium in markets out of a hub airport.
The main objective of our paper is to identify the determinants of the hubpremium. Table 3 provides a preliminary look at the type of evidence for whichwe are looking. Limits on sublease fees are presented. For example, in Charlotte,N.C., US Airways can sublease the gates for which US Airways has preferentialor exclusive use, but it cannot charge a sublease fee that is more than 15 percenthigher than the fee that US Airways pays to the airport. In Denver, United can

Airport Facilities and Market Power 477
charge any sublease fee, since the airport has not set a limit. In the empiricalanalysis, we quantify the effect that each one of the three variables—OwnGatesjr,Limitr, and MaxLimitr—has on the premium that airlines can charge on flightsout of their hubs.
3.5. Control Variables
One crucial issue is whether airlines charge a premium at hubs because theyprovide a better, differentiated product than do their competitors or whetherthey charge it because they control access to the airport facilities. We considerfive measures of product differentiation.
The first measure is related to the network of an airline at an airport and ismotivated by Berry (1990, 1992), Brueckner, Dyer, and Spiller (1992), and Cilibertoand Tamer (2009). We compute the percentage of all markets served out of anairport that are served by one airline and call this variable PctOriginMarketsjrt.This measure captures the relative attractiveness of the airlines’ frequent-flyerprograms and its other services at the airport (the number of ticket counters,customer service desks, and the like).13 We define PctDestMarketsjrt similarly.14
Airlines also differentiate their product by whether they provide nonstop orconnecting service. The variable NonStopjrt is equal to one if airline j providesnonstop service on route r at time t.15 When airlines provide connecting service,they must decide how many miles the passenger must travel in addition to thenonstop distance between two airports. We construct a variable, ExtraMilesjrt,which is equal to the ratio of the distance flown to the nonstop distance in milesbetween two airports minus one.16 Thus, a nonstop flight will be associated witha value of ExtraMilesjrt equal to zero, whereas connecting flights will be associatedwith values larger than zero. The larger the number of extra miles that a passengermust travel between two airports, the less attractive it is to travel on a connectingtrip than on a nonstop trip. Airlines also serve markets with different flights ina day, or frequency.17 The more flights per day, the more likely a passenger canfly at her preferred time. The variable Frequencyjrt measures the average numberof flights by an airline per day in a quarter.18 Finally, we also includeMarketDistancer, the nonstop distance in miles between two airports, and
13 Bamberger and Carlton (2002) discuss at length why fares should be positively correlated tovariables of this type of hubbing activity at an airport.
14 In a previous version of the paper, we also included the number of markets served out of anairport by a carrier. However, this measure is highly correlated (1.95) with PctOriginMarkets, whichwe defined in Table 2. So we decided to keep PctOriginMarkets, which is more naturally associatedwith the idea of frequent-flyer benefits.
15 For more details on the construction of NonStop, see the Appendix.16 The distance flown varies across itineraries, because an airline may offer a number of alternative
routings within an airport-pair. We use a passenger-weighted average across itineraries.17 For more details on the construction of Frequency, see the Appendix.18 In 4 percent of the observations, Frequencyjrt is missing, and in those cases, it is set to zero and
the related variable MissingFrequencyjrt is set equal to one; otherwise, MissingFrequencyjrt is equalto zero. We performed the analysis with and without Frequencyjrt, and the results are similar. Wedo not report the results for MissingFrequencyjrt for sake of brevity.

478 The Journal of LAW& ECONOMICS
TouristDestr, a dummy variable equal to one if the route has an end point inFlorida or California as additional market-specific controls.
Institutional characteristics of the airline industry ensure that NonStopjrt,ExtraMilesjrt, and Frequencyjrt are determined before the airlines’ choice of prices.This is because prices can be changed at any time by an airline, whereas noneof these variables can be changed in the same short period. Flight schedules,which involve crew scheduling and aircraft assignments, are developed a yearbefore departure and are updated every 3 months (see Ramdas and Williams[2009] and the references therein). We maintain that these five variables areexogenous in the empirical analysis to follow.
As far as costs are concerned, it is reasonable to think that the economicmarginal cost of transporting one passenger is a function of the average costper seat-mile, which is the average operating accounting cost to carry one pas-senger for 1 mile. We construct the average cost per seat-mile using the ratioof the quarterly operating expenses available from the Air Carrier FinancialReports (Form 41 Financial Data) to the quarterly total of the product of thenumber of seats transported and the number of miles flown by the airline. Dataon the total number of seats and the total number of miles flown are obtainedfrom the Air Carrier Statistics (Form 41 Traffic). The mean of the average costper seat-mile is approximately 9 cents and can be as low as 4 cents and as highas 13 cents. Notice that this variable is not market specific. We multiply thisaverage cost per seat-mile by the number of miles flown by an airline to provideservice between two airports, and we call this variable AsmCostjrt.
3.6. Congested Airports
We expect that the control of gates is important when gates are a scarceresource, which is more likely to be the case at congested airports. An importantconcern is that if an airline leases a large share of gates at an airport, it mayreflect the existence of entry barriers, but it may also reflect the efficienciesassociated with hub operations or the outcome of a dynamic game in whichairlines differentiate themselves by developing their services in different locations.Because we have information on the total number of gates at an airport, wenow show how to infer the importance of gate scarcity as a barrier to entry.
We study the interaction of the information on gate leases with measures ofairport capacity constraints. In particular, we use our new data set to define ameasure of congestion, CongestedOriginrt, that is equal to the ratio of the totalnumber of departures from an airport in a given quarter to the total numberof boarding gates. We divide this ratio by 1,000 to simplify the interpretationof the estimation results. Table 2 shows that, on average, there are 350 departuresper gate in a quarter. The minimum is 130 departures, and the maximum is1,007 departures.
To construct CongestedOriginrt, we use data from the T-100 Domestic Segmentdata set to obtain information on the total number of carrier-specific departures
Airport Facilities and Market Power 479
from an airport each quarter. We aggregate over carriers and months and dividethis aggregate measure of departures by the total number of boarding gates ateach airport. We define CongestedDestrt similarly. In our analysis, we includeCongestedOriginrt and CongestedDestrt to control for any price differences thatare related to a change in the extent to which an airport is congested.
3.7. Potential Competition of Southwest
Another context in which the control of gates is important should be at thoseairports where Southwest is not yet present. At these airports, controlling largeenough shares of gates may allow the incumbents to prevent Southwest’s entry.We construct a variable, WNatAirportrt, that is equal to one if Southwest ispresent at both end points of a market. We conjecture that the control of facilitiesis less valuable at an airport where Southwest is already present than at an airportwhere Southwest is not yet active. For 35 percent of the markets that are includedin our sample, Southwest is present at both the endpoints of the market.
4. Econometric Model
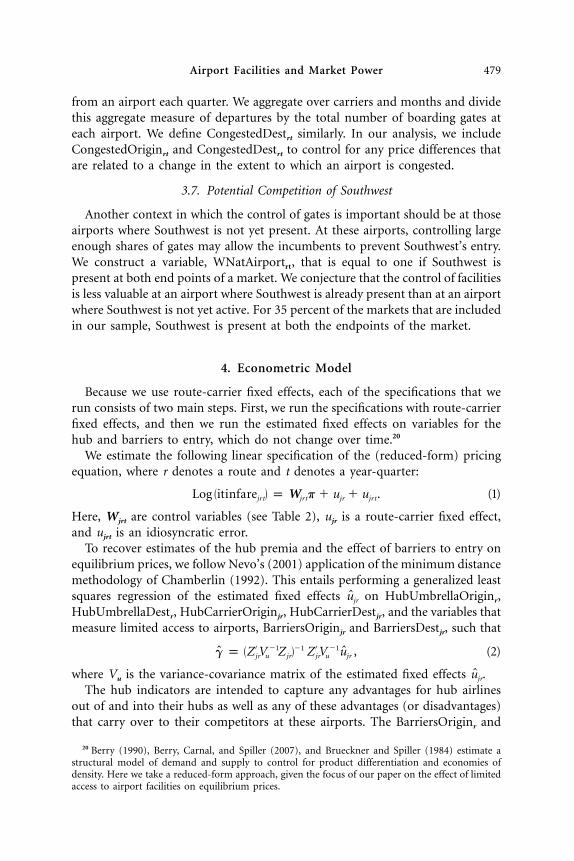
Because we use route-carrier fixed effects, each of the specifications that werun consists of two main steps. First, we run the specifications with route-carrierfixed effects, and then we run the estimated fixed effects on variables for thehub and barriers to entry, which do not change over time.20
We estimate the following linear specification of the (reduced-form) pricingequation, where r denotes a route and t denotes a year-quarter:
( )Log itinfare p W p � u � u . (1)jrt jrt jr jrt
Here, Wjrt are control variables (see Table 2), ujr is a route-carrier fixed effect,and ujrt is an idiosyncratic error.
To recover estimates of the hub premia and the effect of barriers to entry onequilibrium prices, we follow Nevo’s (2001) application of the minimum distancemethodology of Chamberlin (1992). This entails performing a generalized leastsquares regression of the estimated fixed effects on HubUmbrellaOriginr,ujr
HubUmbrellaDestr, HubCarrierOriginjr, HubCarrierDestjr, and the variables thatmeasure limited access to airports, BarriersOriginjr and BarriersDestjr, such that
′ ′�1 �1�1 ˆˆ ( )g p Z V Z Z V u , (2)jr u jr jr u jr
where Vu is the variance-covariance matrix of the estimated fixed effects .ujr
The hub indicators are intended to capture any advantages for hub airlinesout of and into their hubs as well as any of these advantages (or disadvantages)that carry over to their competitors at these airports. The BarriersOriginr and
20 Berry (1990), Berry, Carnal, and Spiller (2007), and Brueckner and Spiller (1984) estimate astructural model of demand and supply to control for product differentiation and economies ofdensity. Here we take a reduced-form approach, given the focus of our paper on the effect of limitedaccess to airport facilities on equilibrium prices.
480 The Journal of LAW& ECONOMICS
BarriersDestr vectors are intended to capture the effect that concentrated rightsto gates, MII agreements, slot controls, and limits on subleasing fees have onfirms’ pricing decisions at these airports.
In some of our specifications, we also include the interaction terms of theBarriersOriginm and BarriersDestm vectors with CongestedOriginrt, CongestedDestrt,and WNatAirportrt.
5. Results
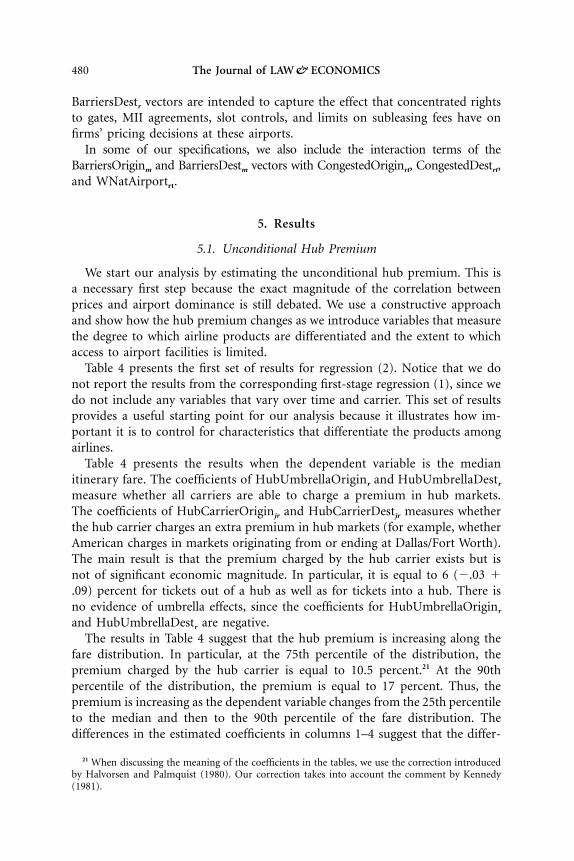
5.1. Unconditional Hub Premium
We start our analysis by estimating the unconditional hub premium. This isa necessary first step because the exact magnitude of the correlation betweenprices and airport dominance is still debated. We use a constructive approachand show how the hub premium changes as we introduce variables that measurethe degree to which airline products are differentiated and the extent to whichaccess to airport facilities is limited.
Table 4 presents the first set of results for regression (2). Notice that we donot report the results from the corresponding first-stage regression (1), since wedo not include any variables that vary over time and carrier. This set of resultsprovides a useful starting point for our analysis because it illustrates how im-portant it is to control for characteristics that differentiate the products amongairlines.
Table 4 presents the results when the dependent variable is the medianitinerary fare. The coefficients of HubUmbrellaOriginr and HubUmbrellaDestr
measure whether all carriers are able to charge a premium in hub markets.The coefficients of HubCarrierOriginjr and HubCarrierDestjr measures whetherthe hub carrier charges an extra premium in hub markets (for example, whetherAmerican charges in markets originating from or ending at Dallas/Fort Worth).The main result is that the premium charged by the hub carrier exists but isnot of significant economic magnitude. In particular, it is equal to 6 (�.03 �.09) percent for tickets out of a hub as well as for tickets into a hub. There isno evidence of umbrella effects, since the coefficients for HubUmbrellaOriginr
and HubUmbrellaDestr are negative.The results in Table 4 suggest that the hub premium is increasing along the
fare distribution. In particular, at the 75th percentile of the distribution, thepremium charged by the hub carrier is equal to 10.5 percent.21 At the 90thpercentile of the distribution, the premium is equal to 17 percent. Thus, thepremium is increasing as the dependent variable changes from the 25th percentileto the median and then to the 90th percentile of the fare distribution. Thedifferences in the estimated coefficients in columns 1–4 suggest that the differ-
21 When discussing the meaning of the coefficients in the tables, we use the correction introducedby Halvorsen and Palmquist (1980). Our correction takes into account the comment by Kennedy(1981).

Airport Facilities and Market Power 481
Table 4
Unconditional Hub Premia
50th% Fare(1)
25th% Fare(2)
75th% Fare(3)
90th% Fare(4)
Mean Fare(5)
Hub dummies:HubUmbrellaOrigin �.03** (.01) �.03** (.01) �.02** (.01) .02** (.01) �.01 (.01)HubUmbrellaDest �.02** (.01) �.03** (.01) .00 (.01) .03** (.01) .00 (.01)HubCarrierOrigin .09** (.01) .07** (.01) .12** (.01) .14** (.01) .11** (.01)HubCarrierDest .08** (.01) .06** (.01) .14** (.01) .21** (.01) .14** (.01)
Controls:Tourist �.05** (.01) �.05** (.01) �.07** (.01) �.08** (.01) �.06** (.01)Distance .15** (.01) .18** (.00) .13** (.01) .17** (.01) .16** (.00)Constant 4.60** (.01) 4.34** (.01) 4.89** (.01) 5.09** (.01) 4.71** (.01)
R2 .15 .26 .12 .17 .2
Note. N p 42,269.** p ! .01.
ences among mean and median ticket fares are important. Not surprisingly, theresults are not identical when we use means or medians of the ticket fares. Thepremia are 11.6 percent (market out of a hub) and 15 percent (markets into ahub) when we use means.
We reach two main conclusions from Table 4. First, results based on the useof average fares must be interpreted with care because the distribution of marketfares is not symmetric around the mean. This is particularly true in hub markets.For this reason, we perform the rest of the analysis using the 25th percentile,the median, the 75th percentile, and the 90th percentile. Second, the hub premiaare increasing in the fare percentile. Notice that this finding is not immediatelyrelated to the fare mix story proposed by Morrison and Winston (1995) andLee and Luengo-Prado (2005).22 The fare mix story says that there is a largerpercentage of business travelers flying out of hubs, and this explains the higheraverage fares. Here we find that the hub premium is larger for higher fares, butwe cannot say anything about the fare mix composition.
5.2. Control Variables
We now include additional controls for product differentiation and costs (forexample, economies of density). The results for regression (1) are presented inTable 5.
The results for the control variables should be interpreted with caution becausethey represent the net effect of the variables on the demand and supply. Overall,nonstop flights are associated with lower prices, which is related to the fact that
22 Morrison and Winston (1995) argue that comparison of fares across markets also requires takinginto account other demand-driven control variables—in particular, traffic mix and frequent-flyertickets. Traffic mix is the fraction of business passengers flying on a route. Using the Departmentof Transportation’s Data Bank 1A (DB1A), Morrison and Winston show that the premia are sig-nificantly lower—by approximately 5 percent—after controlling for traffic mix and frequent-flyertickets. We discuss some limitations of the fare mix data in the DB1A data set in the Appendix.

482 The Journal of LAW& ECONOMICS
Table 5
First-Stage Regressions
50th% Fare(1)
25th% Fare(2)
75th% Fare(3)
90th% Fare(4)
Mean Fare(5)
Variable:NonStop �.37** (.07) �.43** (.05) �.28** (.06) �.31** (.08) �.44** (.05)ExtraMiles .24** (.03) .23** (.03) .18** (.03) .14** (.04) .18** (.02)PctOriginMarkets �.16** (.02) �.14** (.02) �.21** (.02) �.20** (.03) �.18** (.02)PctDestMarkets �.17** (.02) �.14** (.02) �.21** (.02) �.19** (.03) �.17** (.02)Frequency �.76** (.15) �.56** (.11) �.76** (.13) �.94** (.16) �.91** (.11)AsmCost �.05** (.01) �.06** (.01) �.03** (.01) �.04** (.01) �.06** (.01)
Adjusted R2 .664 .693 .673 .683 .745
Note. N p 42,269.** p ! .01.
they imply lower costs. Longer connecting flights, captured by a higher value ofExtraMiles, are charged at a higher price than are shorter ones. A larger numberof markets served by an airline out of an airport is associated with lower prices.Notice that this is easily explained by the presence of economies of density.Higher frequency is associated with lower prices, and again this is easily explainedby the presence of economies of density. Finally, the coefficient of the unit cost,AsmCostjrt, is negative, which suggests that the effect of the average operatingcost per seat-mile is decreasing as the flown distance increases.23
5.3. The Hub Premium
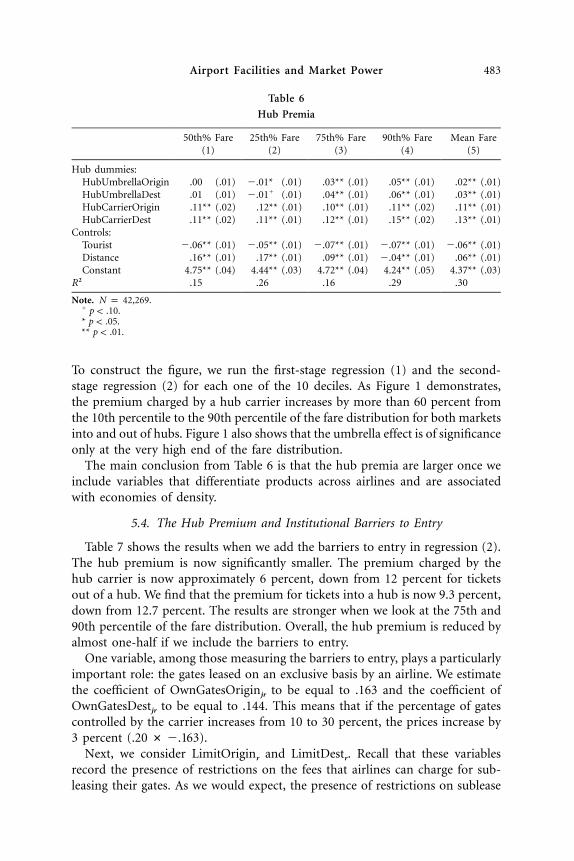
Table 6 presents the results for the regression after we have estimated the firststage, as discussed in Section 5.2. Notice that we do not yet include barriers toentry.
The main result is that the premium charged by the hub carrier is nowof a more significant economic magnitude. In particular, it is equal to 11.9percent for tickets out of a hub and 12.7 percent for tickets into a hub. Thereis only limited evidence of umbrella effects, because the coefficients forHubUmbrellaOriginr and HubUmbrellaDestr are less than or equal to 1 percent.
Again, the results suggest that the hub premium is still increasing in the ticketfare. In particular, at the 75th percentile of the distribution, the premium chargedby the hub carrier is equal to 13.5 percent in markets out of a hub and 17.6percent in markets into a hub. At the 90th percentile of the distribution, thepremium is equal to 16.8 percent in markets out of a hub and 26 percent inmarkets into a hub.
Figure 1 illustrates the relationship between fares and hub premia in an explicitfashion by plotting the hub premium for each quantile of the fare distribution.
23 As mentioned earlier, the results for the control variables should be interpreted with cautionsince we are estimating a reduced-form model. We interpret the finding that a higher average costis associated with lower prices with the fact that a longer distance flown relative to the nonstopmarket distance is likely associated with lower demand.
Airport Facilities and Market Power 483
Table 6
Hub Premia
50th% Fare(1)
25th% Fare(2)
75th% Fare(3)
90th% Fare(4)
Mean Fare(5)
Hub dummies:HubUmbrellaOrigin .00 (.01) �.01* (.01) .03** (.01) .05** (.01) .02** (.01)HubUmbrellaDest .01 (.01) �.01� (.01) .04** (.01) .06** (.01) .03** (.01)HubCarrierOrigin .11** (.02) .12** (.01) .10** (.01) .11** (.02) .11** (.01)HubCarrierDest .11** (.02) .11** (.01) .12** (.01) .15** (.02) .13** (.01)
Controls:Tourist �.06** (.01) �.05** (.01) �.07** (.01) �.07** (.01) �.06** (.01)Distance .16** (.01) .17** (.01) .09** (.01) �.04** (.01) .06** (.01)Constant 4.75** (.04) 4.44** (.03) 4.72** (.04) 4.24** (.05) 4.37** (.03)
R2 .15 .26 .16 .29 .30
Note. N p 42,269.� p ! .10.* p ! .05.** p ! .01.
To construct the figure, we run the first-stage regression (1) and the second-stage regression (2) for each one of the 10 deciles. As Figure 1 demonstrates,the premium charged by a hub carrier increases by more than 60 percent fromthe 10th percentile to the 90th percentile of the fare distribution for both marketsinto and out of hubs. Figure 1 also shows that the umbrella effect is of significanceonly at the very high end of the fare distribution.
The main conclusion from Table 6 is that the hub premia are larger once weinclude variables that differentiate products across airlines and are associatedwith economies of density.
5.4. The Hub Premium and Institutional Barriers to Entry
Table 7 shows the results when we add the barriers to entry in regression (2).The hub premium is now significantly smaller. The premium charged by thehub carrier is now approximately 6 percent, down from 12 percent for ticketsout of a hub. We find that the premium for tickets into a hub is now 9.3 percent,down from 12.7 percent. The results are stronger when we look at the 75th and90th percentile of the fare distribution. Overall, the hub premium is reduced byalmost one-half if we include the barriers to entry.
One variable, among those measuring the barriers to entry, plays a particularlyimportant role: the gates leased on an exclusive basis by an airline. We estimatethe coefficient of OwnGatesOriginjr to be equal to .163 and the coefficient ofOwnGatesDestjr to be equal to .144. This means that if the percentage of gatescontrolled by the carrier increases from 10 to 30 percent, the prices increase by3 percent ( )..20 # �.163
Next, we consider LimitOriginr and LimitDestr. Recall that these variablesrecord the presence of restrictions on the fees that airlines can charge for sub-leasing their gates. As we would expect, the presence of restrictions on sublease

484 The Journal of LAW& ECONOMICS
Figure 1. Distribution of the hub premium by ticket fare
fees decreases the premium that airlines can charge. For example, the coefficientof LimitOriginr is equal to �.02 when we look at the effects on median prices.This means that prices are 2 percent lower when limits on sublease fees are inplace. Notice that the effect is equal to �6.2 percent when we consider the 90thpercentile.
The coefficients of the other variables are estimated with considerable noise.The presence of limits on sublease fees is associated with an actual percentagelimit. We do not find strong and consistent results for MaxLimitOriginr andMaxLimitDestr, which suggests that the actual percentage limit (15 or 25 percent)is not as important as the presence of a limit. Airports that have MII agreementsseem to have lower fares at the bottom of the fare distribution, but not at the75th and 90th percentiles.
Finally, the coefficients of the number of gates also vary along the fare dis-tribution because we find them to be negative at the bottom and positive at thetop. This suggests that control of gates might be particularly important to servebusiness travelers, possibly because having a larger fraction of gates is associatedwith more flexible departure times.
Overall, Table 7 shows that access to gates is a crucial determinant of the hubpremium in the airline industry. First, the higher the percentage of gates con-trolled at an airport, the higher the prices that airlines are able to charge. Second,the presence of a limit on sublease fees seems to play an important role inreducing the hub premium. There is only mixed evidence for the other insti-tutional barriers to entry.

Airport Facilities and Market Power 485
Table 7
Hub Premia with Gates
50th% Fare(1)
25th% Fare(2)
75th% Fare(3)
90th% Fare(4)
Hub dummies:HubUmbrellaOrigin .01 (.01) .01 (.01) .02* (.01) .04** (.01)HubUmbrellaDest .02** (.01) .01� (.01) .05** (.01) .07** (.01)HubCarrierOrigin .06** (.02) .07** (.01) .05** (.02) .04* (.02)HubCarrierDest .07** (.02) .07** (.01) .07** (.02) .06** (.02)
Barriers:OwnGatesOrigin .16** (.02) .16** (.02) .15** (.03) .19** (.03)OwnGatesDest .14** (.03) .14** (.02) .15** (.03) .27** (.03)LimitOrigin �.02� (.01) �.02� (.01) �.03* (.01) �.06** (.01)MaxLimitOrigin �.04 (.08) �.06 (.06) .01 (.09) .19* (.09)LimitDest �.01 (.01) �.00 (.01) �.02 (.01) �.05** (.02)MaxLimitDest �.07 (.08) �.11� (.07) �.08 (.09) .09 (.10)MiiOrigin �.03** (.01) �.04** (.01) �.01* (.01) �.01 (.01)MiiDest �.01� (.01) �.02** (.01) .01 (.01) .01* (.01)NumberGatesOrigin .01 (.01) �.02* (.01) .03** (.01) .06** (.01)NumberGatesDest �.01 (.01) �.03** (.01) .00 (.01) .02� (.01)
R2 .20 .29 .18 .32
Note. All regressions include controls for market distance and tourist market dummies. N p 42,269.� p ! .10.* p ! .05.** p ! .01.
5.5. The Hub Premium at Congested Airports
We now consider how the results change when we control for the level ofcongestion at an airport. In practice, we add a set of interaction terms forCongestedOriginrt (CongestedDestrt) and the variables that measure the avail-ability of gates at airports. The results are presented in Table 8.
First, we find that the hub premium is now smaller than that shown in Table7. The premium charged by the hub carrier for flights out of the hub is nowless than 4 percent, down from 6 percent in Table 7 and 12 percent in Table 6.The hub premium in markets into a hub is now 7.2 percent, down from 12.7percent in Table 6. Again, the results are stronger when we look at the 75th and90th percentiles
Next, we consider the interaction terms. We start with OwnGatesOriginrt #CongestedOriginrt and OwnGatesDestrt # CongestedDestrt. We find their co-efficients to be positive and precisely estimated. In particular, the coefficient forOwnGatesOriginrt # CongestedOriginrt is equal to .325. Recall thatCongestedOriginrt is defined as the ratio of departures out of an airport to thenumber of gates at that airport and that we divide it by 1,000. Therefore, afinding of .325 means that at an airport where there are approximately 600departures per gate (for example, Atlanta), a 30 percent difference in the gatesleased would lead to a difference of 6 percent ( ) in fare prices..30 # .325 # .6At an airport where there are approximately 200 departures per gate (for example,

486 The Journal of LAW& ECONOMICS
Table 8
Hub Premia with Gates and Congestion
50th% Fare(1)
25th% Fare(2)
75th% Fare(3)
90th% Fare(4)
Hub Dummies:HubUmbrellaOrigin .00 (.01) .00 (.01) .02* (.01) .04** (.01)HubUmbrellaDest .03** (.01) .01* (.01) .04** (.01) .06** (.01)HubCarrierOrigin .04** (.02) .06** (.01) .03� (.02) .02 (.02)HubCarrierDest .05** (.02) .05** (.01) .06** (.02) .06** (.06)
Barriers:CongestedOrigin #
NumberGatesOrigin .33** (.10) .20** (.08) .41** (.12) .29** (.12)CongestedDest #
NumberGatesDest .26** (.11) .25** (.09) .20� (.13) .02 (.13)OwnGatesOrigin .01 (.05) .07* (.04) �.04 (.06) .06 (.06)OwnGatesDest .04 (.05) .04 (.05) .07 (.07) .26** (.07)CongestedOrigin #
LimitOrigin �.34** (.09) �.21** (.08) �.38** (.11) �.48** (.11)CongestedDest #
LimitDest �.26** (.09) �.10** (.07) �.38** (.11) �.62** (.11)LimitOrigin .16** (.05) .09* (.04) .17** (.06) .19** (.06)LimitDest .12** (.05) .04 (.04) .19** (.06) .28** (.06)CongestedOrigin #
MaxLimitOrigin 1.73** (.48) 1.12** (.41) 2.07** (.58) 2.75** (.59)CongestedDest #
MaxLimitDest 1.76** (.46) .77* (.39) 2.44** (.55) 3.68** (.57)MaxLimitOrigin �.88** (.26) �.54** (.22) �1.00** (.32) �1.13** (.33)MaxLimitDest �.88** (.25) �.37* (.21) �1.28** (.30) �1.76** (.31)CongestedOrigin #
MiiOrigin .21** (.05) .26** (.04) .21** (.06) .35** (.06)CongestedDest #
MiiDest .26** (.05) .28** (.04) .16** (.06) .22** (.06)MiiOrigin �.12** (.02) �.16** (.02) �.11** (.03) �.16** (.03)MiiDest �.12** (.02) �.15** (.02) �.06* (.03) �.08** (.03)CongestedOrigin �.17** (.05) �.20** (.04) �.19** (.06) �.30** (.06)CongestedDest �.25** (.05) �.26** (.04) �.12* (.06) �.16** (.06)NumberGatesOrigin .01 (.01) �.01** (.01) .04** (.01) .06 ** (.01)NumberGatesDest �.01 (.01) �.03** (.01) .2 (.01) .04** (.01)
R2 .21 .34 .19 .33
Note. All regressions include controls for market distance and tourist market dummies. N p 42,269.� p ! .10.* p ! .05.** p ! .01.
Nashville), a 30 percent difference would lead to a difference of 2 percent. Nowconsider the coefficients for OwnGatesOriginrt and OwnGatesDestrt. The resultsare striking. Controlling a large fraction of gates at airports that are not congesteddoes not lead to higher prices. Hence, the control of gates is a crucial determinantof airline prices and hub premia only when there is a scarcity of gates relativeto the number of departures from or into an airport. Interestingly, there doesnot seem to be a stronger effect at the higher end of the fare distribution: wefind the coefficients of the interaction terms to be essentially the same.

Airport Facilities and Market Power 487
Now consider the interactions LimitOriginrt # CongestedOriginrt andLimitDestrt # CongestedDestrt. Both coefficients are negative and precisely es-timated, and they should be interpreted as follows. At an airport where thereare approximately 600 departures per gate, the presence of a limit on the subleasefees lowers the premium by approximately 11 percent ( ).[�.340 � .158] # .600Notice that at the airports with the smallest value of CongestedOriginrt, whereit is equal to approximately 120, the presence of a limit would lower the premiumby just 2 percent.
The interactions MaxLimitOriginr # CongestedOriginrt and MaxLimitDesr #CongestedDestrt are positive, as expected. At congested airports, an increase inthe limits to the sublease fee translates as higher prices. Again, to compute themagnitude of the effect, we need to take the sum of MaxLimitOriginr #CongestedOriginrt and MaxLimitOriginr at a given value of CongestedOriginrt.Notice that this variable never takes a value less than 130, so the sum is nevernegative.
Finally, the interactions of MiiOriginrt # CongestedOriginrt and MiiDestrt #CongestedDestrt are also positive, as expected. More important, the sum ofMiiOriginrt and MiiOriginrt # CongestedOriginrt is also positive (and, similarly,so is that for the corresponding destination variables). Thus, airports that are morecongested are more likely to see higher prices when they share the rights to decideon expansion projects with the airline controlling the majority of their operations.
Overall, these results provide strong evidence that airlines controlling a largernumber of gates benefit significantly more at congested airports than at airportswhere gates are not a scarce resource.
5.6. The Hub Premium at Airports Where Southwest Is Present
We now look at the extent to which the control of gates is important atairports where Southwest is present. The idea here is quite simple. If Southwestis present at an airport, then it is also present in some of the routes out of thatairport. Hence, the prices out of that particular airport should be, ceteris paribus,lower than at airports where Southwest is not yet present. In particular, we areinterested in the sign and magnitude of the interaction of WNatAirportrt withthe variables that measure the access to the airport’s facilities. The results arepresented in Table 9.
First, consider the coefficients of OwnGatesOriginrt and OwnGatesDestrt. Theyare positive and slightly larger than in Table 7. Recall that this means that thecontrol of a larger share of airport gates is associated with higher prices. Now,consider the interactions WNatAirportrt # OwnGatesOriginrt and WNatAirportrt
# OwnGatesDestrt. We find that these interactions have a negative effect onprices. This means that in markets between two airports where Southwest ispresent ( ), controlling 10 percent more of the gates wouldWNatAirport p 1rt
increase the prices by a negligible amount (.25 percent at the origin). Theseresults suggest that control of gates is an important determinant of higher airlineprices only where Southwest is not already present at the airport.

488 The Journal of LAW& ECONOMICS
Table 9
Hub Premia with Gates and Potential Competition from Southwest
50th% Fare(1)
25th% Fare(2)
75th% Fare(3)
90th% Fare(4)
Hub dummies:HubUmbrellaOrigin .01� (.01) .01 (.01) .03** (.01) .04** (.01)HubUmbrellaDest .03** (.01) .01* (.01) .06** (.01) .07** (.01)HubCarrierOrigin .07** (.01) .08** (.01) .07** (.02) .06** (.02)HubCarrierDest .07** (.01) .08** (.01) .08** (.02) .08** (.02)
Barriers:OwnGatesOrigin #
WNatBothAirports �.16** (.03) �.11** (.03) �.24** (.04) �.15** (.04)OwnGatesDest #
WNatBothAirports �.14** (.03) �.09** (.03) �.24** (.04) �.20** (.04)OwnGatesOrigin .18** (.03) .17** (.02) .19** (.03) .21** (.03)OwnGatesDest .16** (.03) .14** (.02) .20** (.03) .29** (.03)LimitOrigin #
WNatBothAirports �.03� (.03) �.03� (.02) �.06* (.03) �.03 (.03)LimitDest #
WNatBothAirports �.03 (.03) �.03 (.02) �.06* (.03) �.03 (.03)LimitOrigin .01 (.01) .01 (.01) .00 (.02) �.03* (.02)LimitDest .01 (.01) .02 (.01) .01 (.02) �.02� (.02)MaxLimitOrigin #
WNatBothAirports .05 (.15) .03 (.12) .19 (.18) .05 (.18)MaxLimitDest #
WNatBothAirports �.06 (.14) �.01 (.12) .10 (.18) .01 (.18)MaxLimitOrigin �.06 (.09) �.07 (.08) �.06 (.12) .17� (.12)MaxLimitDest �.01 (.09) �.06 (.08) �.07 (.12) .13 (.12)MiiOrigin #
WNatBothAirports .01 (.01) .02* (.01) �.01 (.02) .01 (.02)MiiDest #
WNatBothAirports .01 (.01) .02* (.01) �.02� (.02) �.02 (.02)MiiOrigin �.05** (.01) �.06** (.01) �.03** (.01) �.03** (.01)MiiDest �.03** (.09) �.05** (.01) �.01 (.01) �.00 (.01)WNatBothAirports �.07** (.02) �.10** (.02) �.02 (.02) �.10** (.02)NumberGatesOrigin �.03** (.01) �.05** (.01) �.01 (.01) .01 (.01)NumberGatesDest �.05** (.01) �.06** (.01) �.04** (.01) �.03* (.01)
R2 .25 .35 .23 .37
Note. All regressions include controls for market distance and tourist market dummies. N p 42,269.� p ! .10.* p ! .05.** p ! .01.
Interestingly, the presence of Southwest has a policing effect only with regardto the control of gates. The effect of the other variables measuring access toairport facilities (Limit, MaxLimit, and MII) is essentially unchanged.
5.7. Airport Dominance and Limited Access to Airport Facilities
Finally, we check the robustness of our results when we include in the first-stage regression the measure of airport dominance used by Borenstein (1989).For each market, we define a measure of airport dominance for the origin and
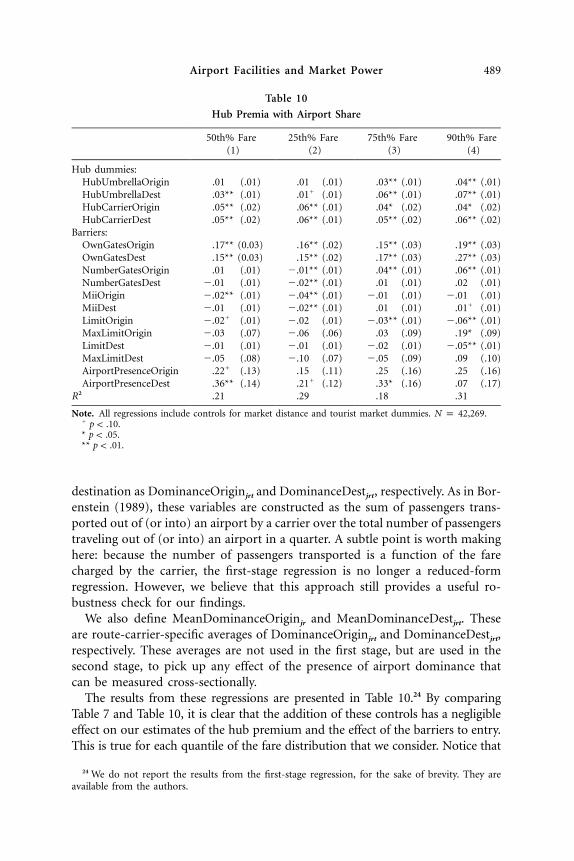
Airport Facilities and Market Power 489
Table 10
Hub Premia with Airport Share
50th% Fare(1)
25th% Fare(2)
75th% Fare(3)
90th% Fare(4)
Hub dummies:HubUmbrellaOrigin .01 (.01) .01 (.01) .03** (.01) .04** (.01)HubUmbrellaDest .03** (.01) .01� (.01) .06** (.01) .07** (.01)HubCarrierOrigin .05** (.02) .06** (.01) .04* (.02) .04* (.02)HubCarrierDest .05** (.02) .06** (.01) .05** (.02) .06** (.02)
Barriers:OwnGatesOrigin .17** (0.03) .16** (.02) .15** (.03) .19** (.03)OwnGatesDest .15** (0.03) .15** (.02) .17** (.03) .27** (.03)NumberGatesOrigin .01 (.01) �.01** (.01) .04** (.01) .06** (.01)NumberGatesDest �.01 (.01) �.02** (.01) .01 (.01) .02 (.01)MiiOrigin �.02** (.01) �.04** (.01) �.01 (.01) �.01 (.01)MiiDest �.01 (.01) �.02** (.01) .01 (.01) .01� (.01)LimitOrigin �.02� (.01) �.02 (.01) �.03** (.01) �.06** (.01)MaxLimitOrigin �.03 (.07) �.06 (.06) .03 (.09) .19* (.09)LimitDest �.01 (.01) �.01 (.01) �.02 (.01) �.05** (.01)MaxLimitDest �.05 (.08) �.10 (.07) �.05 (.09) .09 (.10)AirportPresenceOrigin .22� (.13) .15 (.11) .25 (.16) .25 (.16)AirportPresenceDest .36** (.14) .21� (.12) .33* (.16) .07 (.17)
R2 .21 .29 .18 .31
Note. All regressions include controls for market distance and tourist market dummies. N p 42,269.� p ! .10.* p ! .05.** p ! .01.
destination as DominanceOriginjrt and DominanceDestjrt, respectively. As in Bor-enstein (1989), these variables are constructed as the sum of passengers trans-ported out of (or into) an airport by a carrier over the total number of passengerstraveling out of (or into) an airport in a quarter. A subtle point is worth makinghere: because the number of passengers transported is a function of the farecharged by the carrier, the first-stage regression is no longer a reduced-formregression. However, we believe that this approach still provides a useful ro-bustness check for our findings.
We also define MeanDominanceOriginjr and MeanDominanceDestjrt. Theseare route-carrier-specific averages of DominanceOriginjrt and DominanceDestjrt,respectively. These averages are not used in the first stage, but are used in thesecond stage, to pick up any effect of the presence of airport dominance thatcan be measured cross-sectionally.
The results from these regressions are presented in Table 10.24 By comparingTable 7 and Table 10, it is clear that the addition of these controls has a negligibleeffect on our estimates of the hub premium and the effect of the barriers to entry.This is true for each quantile of the fare distribution that we consider. Notice that
24 We do not report the results from the first-stage regression, for the sake of brevity. They areavailable from the authors.

490 The Journal of LAW& ECONOMICS
the coefficients of MeanDominanceOriginjr and MeanDominanceDestjrt have theexpected positive sign.
Thus, these additional and potentially endogenous controls that are commonlyused in the literature do not change our results or the conclusions made aboveregarding the magnitude of the hub premium. In addition, the effect of thebarriers to entry is nearly identical with or without these measures of airportdominance. We still consistently find that concentrated control of boarding gatesresults in significantly higher fares. Again, the effect of the size of the limit onsubleasing fees (MaxLimitOriginr and MaxLimitDestr) and the presence of MII(MiiOriginr and MiiDestr) agreements are estimated imprecisely, and no defin-itive conclusions should be drawn from the results.
6. Conclusions
After deregulation of the U.S. airline industry in 1978, there was a great dealof optimism that airline markets would become more competitive and fareswould decrease substantially. The theoretical framework justifying this optimismwas the theory of contestable markets developed by Baumol, Panzar, and Willig(1992). Their basic insight was that airlines do not incur large sunk costs toenter into markets, and thus they can easily enter when prices are high and exitas soon as prices fall too much.
In this paper, we show that airlines can still charge a large premium in marketsinto and out of their hubs. In particular, we find that the hub premium isinfluenced by gate ownership, particularly when gate utilization is high at anairport, and that the hub premium is larger at the high end of the fare distri-bution. Future research should focus on the role that barriers to entry have onthe entry decisions, because that is also an important determinant of long-runcompetition in airline markets.25
Finally, we want to highlight that our research can explain approximately 50percent of the hub premium. The other 50 percent is still to be explained. Itcould be a function of what Borenstein (1989) calls marketing barriers to entry:frequent-flyer programs and volume incentives to travel agents that might allowairlines to raise their prices above their marginal cost. Unfortunately, data onfrequent-flyer programs are not available. The remainder of the premium mayalso be explained as a function of the strategic behavior of airlines.26
25 Williams (2009) finds that improved access to boarding gates at hub airports is the most sig-nificant determinant of the sunk cost of entry, particularly for low-cost carriers.
26 For example, Miller (2010) studies the U.S. Department of Justice’s suit against eight majordomestic airlines and the Airline Tariff Publishing Company. The purpose of the suit was to reduceopportunities for collusion in the industry. The lawsuit ended with consent decrees limiting theability of airlines to communicate surreptitiously through the shared fare database. Direct data onthese practices remain unavailable.
Airport Facilities and Market Power 491
Appendix
Data Construction
A1. Fare and Passenger Data
Fare and passenger information are from the Airline Origin and DestinationSurvey (DB1B), which is a 10 percent sample of airline tickets from reportingcarriers. The data from the DB1B are merged with data from the T-100 DomesticSegment data set by the operating carrier. The T-100 Domestic Segment dataset contains domestic market data by air carriers and origin and destinationairports for passengers enplaned. The T-100 is not a sample: it reports all flightsin the United States in a given month of the year. Data are from every quarterfrom the first quarter in 1993 to the third quarter in 2005. A market is definedas a unidirectional trip from one airport to another airport, with or withoutconnections. The unit of observation is a market-carrier-year-quarter data point.
We exclude tickets that are neither one-way nor round-trip travel, such asopen-jaw trip tickets, tickets involving a nonreporting U.S. carrier flying withinNorth America and a foreign carrier flying between two points in the UnitedStates, tickets that are part of international travel, tickets including travel onmore than one airline on a directional trip (known as interline tickets), ticketsinvolving noncontiguous domestic travel (Hawaii, Alaska, and territories), ticketswith fares less than $20 or higher than $9,999, tickets with fares that were inthe bottom and top fifth percentile in their year, and tickets with more than 6coupons. We then merge this data set with the T-100 Domestic Segment (U.S.Carriers) and exclude tickets for flights that have fewer than 12 departures overa quarter in one direction (this means less than one departure every week inone direction).
We code a round-trip ticket as one directional trip ticket that costs one-halfthe full round-trip ticket fare. This avoids overcounting the lower fares associatedwith round-trip tickets relative to the higher fares associated with purchasingtwo one-way tickets. In this way, it is possible to make meaningful the com-parisons between one-way and round-trip fares by comparing what two pas-sengers would pay for traveling the same distance. Each passenger is countedonly once when constructing the market and airport market shares.27
We construct NonStop using the following procedure: For each ticket, weknow the number of segments flown by the passenger. If the passenger used onecoupon for one-way travel and the airline provided nonstop service on thatroute, we code this ticket as a nonstop ticket. If the passenger used two couponsfor a round-trip ticket and the airline provided nonstop service on the tworoutes, we code this ticket as a nonstop ticket. Otherwise, the ticket is for aconnecting or direct (connecting but using only one coupon) flight. In principle,an airline can provide both nonstop and connecting service between two airports.
27 To check that this coding did not affect the result, we reran our regressions with only data fromround-trip tickets. The results were almost identical.

492 The Journal of LAW& ECONOMICS
It turns out that, in our sample, in 63 percent of the observations (year-quarter-route-carrier), a carrier provided only connecting service. For the remaining 37percent of the observations, a carrier might provide both nonstop and connectingservice. However, it turns out that carriers sell a nonnegligible number of con-necting tickets (at least 30 percent of the tickets on a route in a quarter) whenthey also provide nonstop service in less than 2 percent of the observations.Because the price variable is constructed as a median, the median price is theprice of the nonstop service in all but a very negligible number of markets. Thus,we coded NonStop as equal to one if the carrier provided nonstop service betweentwo airports.
We construct Frequency using the following procedure: If an airline providesnonstop service on a route, then Frequency is simply the number of departuresin a quarter divided by 91, and this provides the average number of flights perday. If an airline provides connecting service on a route, then Frequency is equalto the minimum number of daily flights among those in each segment that theairline flew on the route. This is the same approach as in Borenstein (1989). Insome cases, airlines issue a coupon for two segments of a flight, so data onfrequency are missing. In these cases, we let MissingFrequency equal one.
In accordance with Borenstein (1989), the mean, median, 25th percentile, and75 percentile fares are derived from the distribution of fares weighted by thenumber of passengers paying each fare, not from a distribution that gives equalweight to each fare listed by the airline. We do not use data on fare class fromData Bank 1B for the following reasons. First, in private communication withthe National Transportation Library in the Bureau of Transportation Statistics,it came to our attention that it is possible that one airline may classify a ticketas belonging to class X, whereas another airline may classify the same ticket asbelonging to class Y. The reason for this is that there are no rules for standardizingwhat X and Y mean. Second, Southwest codes all tickets under one fare class,despite selling tickets with different fare restrictions. As a result, it is questionablewhether the information on fare classes contained in the U.S. Department ofTransportation Origin and Destination Survey can be used to build a reliabletraffic mix variable. Finally, the number of frequent-flyer tickets (and traffic mix)is endogenous in the sense that prices, the number of frequent-flyer tickets, andthe fare mix are determined simultaneously.
One important issue is how to treat regional airlines that operate throughcode-sharing agreements with national airlines. As long as the regional airlinesells tickets independently, we treat it separately from the national airline.28
28 The DB1B data set provides information on the operating and ticketing carrier, which mightdiffer in the case of code-share agreements. In their institutional analysis of airline alliances, Bam-berger, Carlton, and Neumann (2004) discuss how code-share agreements allow a carrier to inde-pendently set price and sell service between cities that it otherwise would not be able to serve. Code-share agreements can involve different financial agreements between the operating carrier and itsalliance partner. In some alliances (free-sale agreements), the operating carrier determines seat avail-ability and the ticketing carrier sets prices for its service. In other alliances (blocked-space agreements),the ticketing carrier buys a block of seats on each code-share flight from the operating carrier. Since

Airport Facilities and Market Power 493
Another issue is that there are airlines that transport very few passengers in aquarter. In particular, consider an airline using a small plane that has 20 seatsto serve a regional market. One flight per week over a quarter tells us that theairline will transport 240 passengers at full capacity. A 10 percent sample shouldhave the airline reporting 24 passengers in the data set. If an airline reports fewerthan 20 passengers in a quarter, we assume that the airline does not have anactive presence in this market. Berry (1992) excludes airlines that report fewerthan 90 passengers in a quarter. We relax this condition to account for theprogressive adoption of smaller regional jets by U.S. airlines.
A2. Aviation Investment and Reform Act for the Twenty-First Century Data
The data from the competition plans are a cross section. The airports includedare those in Albuquerque (ABQ), Atlanta (ATL), Austin (AUS), Baltimore (BWI),Burbank (BUR), Charlotte (CLT), Chicago O’Hare (ORD), Cincinnati (CVG),Dallas/Fort Worth (DFW), Denver (DEN), Detroit (DTW), Houston (IAH),Washington Dulles (IAD), Washington Reagan (DCA), Tucson (TUS), Miami(MIA), Milwaukee (MKE), Minneapolis (MSP), Newark (EWR), Philadelphia(PHL), Phoenix (PHX), Pittsburgh (PIT), St. Louis (STL), Salt Lake City (SLC),San Francisco (SFO), Chicago Midway (MDW), Cleveland (CLE), Dallas LoveField (DAL), El Paso (ELP), Houston Hobby (HOU), Jacksonville (JAX), Mem-phis (MEM), Nashville (BNA), Oakland (OAK), Providence (PVD), Reno(RNO), Sacramento (SMF), San Antonio (SAT), San Jose (SJC), and West PalmBeach (PBI).
We merge the data from the competition plans with the fare and passengerdata, which is a panel data set. During this process of merging the two data sets,we needed to clean the AIR 21 data set as follows. At JAX, American uses a gatethat is for common use. We code that gate as being for common use rather thanfor American. The same is true for Southwest, which also uses a common-usegate. At SMF, the gates of American Airlines include the activity of TWA. Thegates of Continental include the activity of America West. We have three com-petition plans for SMF. The number of gates and the assignment change verylittle. Instead, the limit on sublease fees changed from not existing in 2000 tobeing 15 percent in 2001. At ATL, Atlantic Southwest Airlines is counted asDelta. At SLC, Skywest controls the gates and serves Delta: we coded these gatesas controlled by Delta. At IAD, Atlantic Coast Airlines gates are assigned toUnited Airlines. At SLC, SLC’s competition plan says that an entrant was chargedmore than 15 percent and that the airport helped negotiation, but it does nottell how much lower of a fee was charged. It says that they are introducing alimit but with a new agreement. At PHL, the airport authorities were constructing13 gates, which are included. We do not include four gates and 38 regional gates
fares are set by the ticketing carrier in both cases, we use the ticketing carrier to assign a ticket toa specific airline. Notice that this approach addresses the issue of how to treat regional carriers thatoperate for major airlines.

494 The Journal of LAW& ECONOMICS
expected to be added after the period of interest. At DTW, five gates are assignedto both HP and CO, but we use the number of departures to attribute four toContinental and one to America West. At DAL, 25 gates were available but only18 were operational. At CLE, US Airways sublets one gate to Midwest, Conti-nental sublets one to America West, and Continental also has four gates thatcan serve six regional planes each. We coded them as having four. At BUR,airlines cannot sublease gates. There are three overflow gates that we interpretas being available for common use. At MIA, all gates are for common use, andno subleasing is necessary. At DFW, 37 are nonbridge positions, so we do notcount them. The TWA gates were assigned to American Airlines when TWA wasacquired by American Airlines. MKE converted one gate of TWA to commonuse. American Airlines has served the airport through American Airlines Eaglesince 1996. Data for ORD, MDW, OAK, and BWI were collected from the airportWeb sites, their competition plans, direct contact with the airports, and FederalAviation Administration (1999).
References
Armantier, Olivier, and Oliver Richard. 2008. Domestic Airline Alliances and ConsumerWelfare. RAND Journal of Economics 39:875–904.
Bamberger, Gustavo, and Dennis Carlton. 2002. Airline Networks and Fares. Pp. 269–88in Handbook of Airline Economics, edited by Darryl Jenkins. 2d ed. Washington, D.C.:Aviation Week.
Bamberger, Gustavo, Dennis Carlton, and Lynette Rae Neumann. 2004. An EmpiricalInvestigation of the Competitive Effects of Domestic Airline Alliances. Journal of Lawand Economics 47:195–222.
Baumol, William, John Panzar, and Robert Willig. 1982. Contestable Markets and theTheory of Industry Structure. San Diego, Calif.: Harcourt Brace Jovanovich.
Berry, Steven. 1990. Airport Presence as Product Differentiation. American Economic Re-view 80:394–99.
———. 1992. Estimation of a Model of Entry in the Airline Industry. Econometrica 60:889–917.
Berry, Steven, Michael Carnal, and Pablo Spiller. 2006. Airline Hubs: Costs, Markups,and the Implications of Costumer Heterogeneity. Pp. 183–214 in vol. 1 of Advances inAirline Economics, Competition Policy and Antitrust, edited by Darin Lee. Amsterdamand Boston: Elsevier.
Borenstein, Severin. 1989. Hubs and High Fares: Dominance and Market Power in theU.S. Airline Industry. RAND Journal of Economics 20:344–65.
Brueckner, Jan, Nicola Dyer, and Pablo Spiller. 1992. Fare Determination in Airline Hub-and-Spoke Networks. RAND Journal of Economics 23:309–33.
Brueckner, Jan, and Pablo Spiller. 1994. Economies of Traffic Density in the DeregulatedAirline Industry. Journal of Law and Economics 37:379–415.
Carlton, Dennis. 2004. Why Barriers to Entry Are Barriers to Understanding. AmericanEconomic Review 94:466–70.

Airport Facilities and Market Power 495
Chamberlain, Gary. 1982. Multivariate Regression Models for Panel Data. Journal ofEconometrics 18:5–46.
Ciliberto, Federico, and Elie Tamer. 2009. Market Structure and Multiple Equilibria inthe Airline Industry. Econometrica 77:1791–1828.
Evans, William, and Ioannis Kessides. 1993. Localized Market Power in the U.S. AirlineIndustry. Review of Economics and Statistics 75:66–75.
Federal Aviation Administration. 1999. Office of the Secretary Task Force. Airport BusinessPractices and Their Impact on Airline Competition. Washington, D.C.: Department ofTransportation, Federal Aviation Administration.
GAO (Government Accounting Office). 1989. Barriers to Competition in the AirlineIndustry. Washington D.C.: U.S. Government Accounting Office.
———. 1990. Airline Competition: Industry Operating and Marketing Practices LimitMarket Entry. Washington D.C.: U.S. Government Accounting Office.
Halvorsen, Robert, and Raymond Palmquist. 1980. The Interpretation of Dummy Vari-ables in Semilogarithmic Equations. American Economic Review 70:474–75.
Kennedy, Peter. 1981. Estimation with Correctly Interpreted Dummy Variables in Sem-ilogarithmic Equations. American Economic Review 71:801.
Lee, Darin, and Maria Jose Luengo-Prado. 2005. The Impact of Passenger Mix on Reported“Hub Premiums” in the U.S. Airline Industry. Southern Economic Journal 72:372–96.
McAfee, Preston, Hugo Mialon, and Michael Williams. 2004. What Is a Barrier to Entry?American Economic Review 94:461–65.
Miller, Amalia. 2010. Did the Airline Tariff Publishing Case Reduce Collusion? Journalof Law and Economics 53:569–86.
Morrison, Steven, and Clifford Winston. 1995. The Evolution of the Airline Industry.Washington, D.C.: Brookings Institution Press.
Nevo, Aviv. 2001. Measuring Market Power in the Ready to Eat Cereal Industry. Econ-ometrica 69:307–42.
Peters, Craig. 2006. Evaluating the Performance of Merger Simulations: Evidence fromthe U.S. Airline Industry. Journal of Law and Economics 49:627–49.
Ramdas, Kamalini, and Jonathan Williams. 2009. An Empirical Investigation into theTradeoffs That Impact On-Time Performance in the Airline Industry. Working paper.University of Georgia, Department of Economics, Athens.
Schmalensee, Richard. 2004. Sunk Costs and Antitrust Barriers to Entry. American Eco-nomic Review 94:471–75.
Transportation Research Board. 1999. Entry and Competition in the U.S. Airline Industry:Issues and Opportunities. Washington D.C.: Transportation Research Board.
Williams, Jonathan. 2009. Capacity Investment, Exclusionary Behavior, and Welfare: ADynamic Model of Competition in the Airline Industry. Working paper. University ofGeorgia, Department of Economics, Athens.