LIM351 FINAL BUDGET 2018/19-2020/21 MEDIUM TERM REVIEW · 1 | P a g e Table of Contents Part 1 –...
123
0 | Page LIM351 FINAL BUDGET 2018/19-2020/21 MEDIUM TERM REVIEW
Transcript of LIM351 FINAL BUDGET 2018/19-2020/21 MEDIUM TERM REVIEW · 1 | P a g e Table of Contents Part 1 –...

0 | P a g e
LIM351 FINAL BUDGET 2018/19-2020/21 MEDIUM TERM REVIEW

1 | P a g e
Table of Contents
Part 1 – Annual Budget PAGE
1.1 Mayor’s Report 10
1.2 Resolutions 11
1.3 Executive Summary 12
1.4 Annual budget Tables 64
Part 2 – Supporting Documentation 78
2.1 Overview of Annual budget process 78
2.2 Overview of alignment of annual budget with IDP 79
2.3 Measurable performance objectives and indicators 82
2.4 Overview of budget Related policies 96
2.5 Overview of Budget assumptions 100
2.6 Overview of budget funding 102
2.7 Expenditure on allocations and grant programmers and Reconciliation of
unspent
105
2.8 Allocation and grant made by the Municipality 108
2.9 Councilors and board members allowances and employers benefits and
employer’s benefits
108
2.10 Monthly target for Revenue, Expenditure cash flow 110
2.11 Annual Budget and Service Delivery and budget Implementation Plan
internal departments
113
2.12 Contract having future Budgetary Implication 116
2.13 Capital expenditure details 116
2.14 Legislation compliance status 118
2.15 Other supporting documents: tables 120
2.16 Municipal Manager‘s quality certificate 122

2 | P a g e
PART 1 –ANNUAL DRAFT BUDGET
1.1 Mayor‘s Report
Madam Speaker
Members of the Executive Committee
The Chief Whip of the majority party and other
Whips
Chairperson of the Municipal Public Accounts
Committee
Fellow Councillors
Municipal Manager and senior managers
All Traditional Leaders
All Ward Committees & CDW’s
Members of the Community
Business Community
Representative of Sector Departments Present
All municipal officials
INTRODUCTION
Let us celebrate the lives of the two icons, Tata Nelson Mandela and Mama Albertina Sisulu, Let us also include
aunti Dora’s life, Ngwana Lehong, the woman who made immense contribution to the life of an African child at this
corner of Blouberg. Many kids who schooled here before us, those who schooled with us and those who came
after us passed through the hands of this great woman.
Madam Speaker when we made first contact with a teacher at this school, the great entry was in Mam Dorah’
class. When I learnt how to hold a pencil, that’s the woman who made it possible. The first time I heard of the word
hygiene was at this school. When I learnt how to relate with other human beings, that’s the woman who taught me.
When we celebrate the life of Tata Madiba, there were great men who contributed to life of the African child as
well. To mention but a few, Ntate Monobe, Ntate Mapeka and those who carried forward the baton like Solly
Rasefate and young principal Lotus Phukubje

3 | P a g e
When I knew that there is Africa and I am an African it was at this school and she together with others passed that
knowledge to us.
Madam Speaker Dr Kwame Nkrumah once said, “Africa is one continent, one people and one nation” “The masses
of the people of Africa are crying for unity.” As we conclude Africa month celebrations, we are able to look back
with pride that since formation of OAU- now AU- in 1963, Africa has progressed. We should continue to fight for
African unity, oneness and a better Africa. Part of building African unity and taking Africa forward is returning land
to the people. As Blouberg Municipality, we must respond to this national call. If we want to resuscitate and grow
the Blouberg Economy, we must make land available for economic use. A clear plan and approach must be
developed in this regard.
__________________________________________________________________________
Madam Speaker I would like to table the following matters before Council for consideration:
1. REPORT ON APPOINTMENT OF SHORTLISTING AND INTERVIEW PANEL FOR THE POSITION OF
THE DIRECTOR, TECHNICAL SERVICES: PAGE 23-65
Madam Speaker, there is a remarkable progress in respect of the filling of senior management positions. We are
hopeful that the next Council will make due appointments pending security clearance reports for each candidate
which were submitted to our office on the 29th May 2018.
Madam Speaker, as resolved by this Council, the position of Director: Technical Services was re-advertised on
Sowetan national newspaper on the 22nd May 2018 as well as on the municipal website as regulation provides.
It is against the above information that; in terms of local government regulations on appointment and Conditions
of employment of Senior Managers, municipal councils should establish shortlisting and interview panel to make
recommendations for the appointment of candidates to vacant Senior Managers’ positions.
It is against this background that a recommendation is made to this Council to establish a shortlisting and interview
panel for the vacant position of Director: Technical Services as per the regulations.
2. REPORT ON MAKGARI AND EUZORINGA ELECTRIFICATION PROJECTS
Madam Speaker, we hereby report to this council about the challenges we experienced with regards to
implementation of the Euzoringa and Makgari projects, whereby the engineer unilaterally changed their scope. The
number of households to be electrified was substantially reduced. We hereby recommend to this Council that the
contractor continue with the project under the current status quo, while investigations are underway. We further
recommend that a budget be set aside to cater for the households not covered within the current set-up.
3. STATUS OF THE OLD TRAFFIC STATION

4 | P a g e
Madam Speaker, Council had resolved to dispose of the Old Traffic Station for other developmental projects as
we already have a new one in place. It has come to our attention that there is lack of office space and therefore it
becomes imperative to not dispose of the building. Some of the units such as waste and environment will be
decentralized to the facility. This also comes at a time when the Provincial Transport department has also made a
request to take back the facility, which we rejected. Home Affairs and LEDET also approached us in that regard
and given the circumstances we also intend to turn them down. We are therefore bringing to this August house a
recommendation that council revoke the decision to dispose of the old traffic station.
4. REPORT ON INDUSTRIAL ACTION BY SAMWU
Madam Speaker, it was during the period under review that we experienced some work delays as a result of the
disagreements we had with the union in relation to the payment of pay progression. Several meetings were held
with the union at LLF level, sometimes with both CoGHSTA and SALGA to advice on the process. The exercise
could not bear fruits as the employees demanded that we utilize the R3 million budgeted for job evaluation to
increase the notches, in which we were advised that such action will be unlawful. Employees had to embark on an
unprotected industrial action, but were given an ultimatum to resume their duties. We shall always assure our
commitment to keep engaging our labour union in the best interest of the employees and the community we serve.
Meanwhile, the Job Evaluation process for our municipality is at an advanced stage. Today Provincial Audit
Committee is busy assessing us, and hope for positive outcomes.
We further bring the following reports for consideration;
1. REPORT ON ENERGY EFFICIENCY AND DEMAND SIDE MANAGEMENT PROGRAMME (EEDSM)
FOR APPROVAL
2. REPORT ON PROGRESS OF MUNICIPAL WIDE RDP PROJECT FOR APPROVAL
3. REPORT ON THE GROWTH AND DEVELOPMENT STRATEGY FOR APPROVAL
4. REPORT ON SUPPLEMENTARY VALUATION ROLL 2018/19 FOR APPROVAL
5. REPORT ON DISPOSAL OF ASSETS FOR APPROVAL
6. REPORT ON RISK MANAGEMENT FOR APPROVAL
7. REPORT ON SECURITY MANAGEMENT FOR APPROVAL
________________________________________________________________________________

5 | P a g e
TABLING OF IDP/BUDGET 30 DAYS BEFORE START OF THE NEW FINANCIAL YEAR
Madam Speaker after adoption of the draft IDP/Budget on the 28th of March, we have rolled out a massive
Community and stakeholder engagement programmes. People have raised issues on the draft IDP/Budget that
have sharpened our ideas and plans. This indeed confirms the words of Julius Nyerere that “If real development
is to take place, the people have to be involved”. On the basis of our engagement with our communities and
stakeholders, we had to rework the IDP/Budget in order to respond to issues raised by Communities. All sector
issues raised during consultations will be referred to relevant sector departments and IGR Forums.
Madam Speaker, we are tabling IDP/Budget 2018/19 before Council for approval.
The IDP/Budget has been in such a way that it is in a position to provide services, grow the economy, create jobs
and fight corruption. Madam Speaker hereunder follow the programmes we intend pursuing:
Accelerate access to land
In order for us to contribute to the issue of land redistribution we have planned the following programmes;
- Review of the Spatial Development Framework
- Facilitate the issuing of title deeds to both Alldays and Senwabarwana residents
- Conduct land Audit
-And have an updated valuation roll, and as such we request Council to approve it.
Growing the economy
Blouberg Municipality has potential in agriculture, tourism, retail and mining. The mining potential within Blouberg
Municipality represents a brighter future. Great strides have been made with regards to engaging mining houses;
Madam Speaker, we have developed a Growth and Development Strategy 2040 for approval by Council. This
strategy will go a long way in driving development within the Municipality.
The mining initiatives that are in the pipeline will undoubtedly serve as the turning point for Blouberg economy.
Madam Speaker, The Blouberg Tourism Composite Guide has been finalized and approved. This will help unearth
and market tourism potential of the Municipality. All these initiatives are catalysts to revitalization of Blouberg
Economy and directing economic investments.
We are planning to industrialize both Senwabarwana and Alldays. This will help facilitate local manufacturing
initiatives. (Local Manufacturing & processing)

6 | P a g e
Creating jobs
As the Municipality we are busy creating job opportunities through programmes like CWP, EPWP and other LED
projects. These are temporary interventions that will provide the necessary much needed relief to those living under
poverty line.
Madam Speaker we continue to assist young people with internship and learnership opportunities. The sole
purpose is to provide and equip young people with the necessary skills for the job market.
Go lwantšha bomenetša (Fighting Corruption)
Madam Speaker bjalo ka Mmasepala re ikemišeditše go tsenela lesolo la go lwantšha bosenyi le bomenetša.
Komiti ya tekolo ya dipuku(Audit Committee),komiti ya MPAC di tšwela pele gore thuša go bona gore tshepedišo
ya Masepala e sepela gabotse go ya ka melao. Ngwaga wa go feta re kgonne go fetiša go hlangwa ga Financial
Misconduct Board. Yona e tlo thuša go matlafatša mošomo wa dikomiti tšeo re šetšego re boletše ka tšona.
Setšhaba le batšeakarolo ka kakaretšo ba swanetše go re thuša mo lesolong le.
Spatial Planning
Re beetše thoko tšhelete yeo lakanago R1,5 M go phethagatša merero ya peakanyo ya naga(Spatial planning)
Environment and Waste Management
Cllr Rangata, Paballo ya tikologo e bohlokwa mo maphelong a rena. Go babalela tlhago go thuša go e boloka gore
e tle e šomišwe ke meloko yeo e latelago Sustainable development approach
Basic Services and Infrastructure Development
Cllr Mashalane, in order to continue to provide basic services and infrastructure,the plans are as follows;
Provision of electricity
An amount of R 5,9 M has been set aside for electrification of the following villages;
Witten,Cracouw,Oldlongsine,Raweshi,Lekgwara,Earlydawn andThorpe
Upgrading Internal Streets
We will continue with tarring of internal streets in the following areas;
• Senwabarwana phase 9 & 10
• Avon phase 3
• Kromhoek phase 3 & 4

7 | P a g e
The overall amount set aside for internal streets is R 24, 4 M
Construction of Creches
We have set aside R 2 M for construction of crèche at Towerfontein.
Maintenance Budget
Madam Speaker an amount of R 4, 3 M has been put aside towards maintenance Budget. Yona e tla be e lebeletše
tšeo di latelago.
• Electricity
• Patching of Potholes and maintenance of internal streets
• Municipal facilities
• Plant and equipment
Growing Blouberg Economy
Cllr Ntlatla,in order to grow the economy of the Municipality we have put aside R 800 000;
• R500 000 for LED Projects support
• R100 for Tourism
• R 150 for SMME’s
Financial Viability and Management
Cllr Makobela we cannot continue to provide services without ensuring that we improve on our collection. We must
make sure that those who are supposed to pay for services pay and those who cannot are part of the indigent
programmes. We need to grow our revenue sources and implement the draft cost containment regulation. That
will help address the going concern. Re ka se sele ka lesaka la go dutla,
The revised policies, tariffs and supplementary valuation will assist us in building a sustainable Municipality.
INSTITUTIONAL TRANSFORMATION AND DEVELOPMENT
Madam Speaker, we remain resolute to our plan to provide services to our communities within a closer proximity
through our decentralization plan. The organizational structure we are presenting here is a testimony to realize this
plan. We have scrutinized the organogram and reviewed it in such a way that it will position administration for
provision of services

8 | P a g e
Cllr Morapedi we must continue to capacitate officials, ward committees and Councillors. We need to further ensure
decentralization of services to our service points (satelites). Our communities must get services nearer. Madam
Speaker, we have allocated funds as follows in order to promote good governance and public participation;
• R 1M for public participation
• R 5, million for Ward Committees support
• R 500 000 for IDP/Budget review process
• R 380 for performance management
• R 3, for external audit. Se se tla re thuša go hwetša pego ye kaone ya mašeleng mo ngwageng wa
2017/18
Sports, Arts and Culture
Re beetše thoko mašeleng thoko ka tsela yeo e latelago go hlabolla merero ya meraloko,bokgabo le setšo;
R 6, 8 for Senwabarwana Sports Complex phase 3,
R 500 000 for Eldorado sports complex (to improve lighting)
R 500 000 for Cooperspark Community hall Phase 2
Re beetše tšhelete ya go lekana R 1, 4 M go hlabolla merero ya dipapadi,bokgabo le setše.
Cllr Rangata re swanetše go bona gore re thušana le Ntate Laka mo mererong ya Boxing.
Special focus programme.
Cllr Makhura re beetše thoko tšhelete ya go lekana R810 000 go thekga maneneo a special focus. Ona a akaretša
baswa,bagolofadi,tša bong bjalo bjalo
Fight against HIV/Aids
Re beetše thoko tšhelete ya go lekana R200 000 go thuša lefapha la tša maphelo mererong ya twantšho ya
HIV/Aids. We appreciate the work done Blouberg Aids Technical Committee and Council.
Provision of Free Basic Services
The Municipality has a programme of provision of free basic services to our Communities. The Municipality has an
indigent register. All households with a total gross income of R 3400 per annum must apply and be included in the
register.
Re beetše thoko mašeleng a ditirelo tša mahala ka tsela ye;

9 | P a g e
• Free basic electricity R 1,5M
• Free basic waste removal R 1,5 M
• Ka thušano le ba CDM badudi ba rena ba hwetša meetse a mahala
2018/19 Budget Summary
Madam Speaker the overall budget is as follows;
The total Budget Revenue for 2018/19 is at R 314 million which is less than last year‘s budget (R 322
million) by R 8 million, the main cause for decrease is because of non-increase on the grant
allocation and own revenue. The total Budget Expenditure for 2018/19 is at R300,5 million which is less
than last year’s budget of R300,9 million, it therefore went down by R350 hundred thousand. The total
grant revenue budget of Blouberg Local Municipality for the 2018/19 financial year is at R 242 million
that is less than last year budget by R 4 million. The total Own revenue is at R 72 million which is less
than last year‘s budget by R 3.9 million due to decrease on sale of site and other sources of income.
The total Capital Budget for 2018/19 is amounting to R 60 Million, which is equals to 20% of the total
Operation budget. In the outer years this amount totals R68 Million, for the 2018/19 and R 70 Million in
the next financial year.
Madam Speaker re tšwa kgole ka leeto la kabo ya ditirelo. Re swanetše go tšwela pele go lwantšha ditlhotlo tšeo
re lebanego le tšona lehono.
We therefore table the IDP/Budget 2018/19 in terms of Municipal Systems Act, Municipal Finance Management
Act and Municipal Budget Report Regulations for adoption. We further submit the following budget related policies
for adoption:
1. Indigent support policy. For the 2017\18, the indigent policy threshold was R 3,200 per household, but
for the 2018\19, the indigent policy threshold will be revised to R 3,400 per household, and an introduction
of a 70% discount to professional pensioners.
2. Tariff structure: the 2018/19 tariff increase will be 6%, which is in line with the CPI price index. And
further note that a proof of residence will remain at R10, while Development fund will remain at R 30.
3. Supply chain management policy
4. Impairment policy.
5. Cost containment policy, a new policy, which is developed in line with Draft cost containment
regulation.
6. Asset management policy

10 | P a g e
7. Cash management policy
8. Investment Policy
9. Fund Reserve policy
10. Unauthorized ,Irregular, Fruitless and wasteful expenditure policy
11. Budget Policy, and lastly
12. Rates policy
“It is clear that we must find an African solution to our problems and that this can only be found in African
unity. Divided we are weak; united, Africa could become one of the greatest forces for good in the world”
Kwame Nkrumah.
“Unity will not make us rich, but it can make it difficult for Africa and the African people to be disregarded
and humiliated. And it therefore, increase the effectiveness of the decisions we make and try to implement
for our development” Julius Nyerere.
Ke a leboga
Cllr Maseka Pheedi
Mayor; Blouberg Local Municipality
1.2 Resolutions
2018/2019 MTREF Budget Resolutions: In terms of section 16 (2) of the Municipal Finance Management Act, Act 56 of 2003, the mayor of the municipality must table the annual budget at a council meeting at least 30 days before the start of the budget year. Section 17 further directs that the budget must be a schedule in the prescribed format-

11 | P a g e
• Setting out realistically anticipated revenue for the budget year from each revenue source;
• Appropriating expenditure for the budget year under the different votes of the municipality;
• Setting out indicative revenue per source and projected expenditure by vote for the two financial years following the budget year;
• Setting out estimated revenue and expenditure by vote for the current year; and
• Actual revenue and expenditure by vote for the financial year preceding the current year.
• Any further proposed amendment to the municipality’s Integrated Development Plan following the annual review of the Integrated Development Plan in terms of section 34 of the Municipal Systems Act.
Recommended resolutions:
That COUNCIL,
1. In terms of section 24 of the Municipal Finance Management Act, (Act 56 of 2003) approves and
adopts:
a) Approve the draft annual budget of the Blouberg municipality for 2018/19, and specifically
appropriating the amounts for the different votes, and for single-year and multi-year capital
expenditure,
b) Approve all rates, taxes and tariffs for services provided by the municipality,
c) Approve the measurable performance objectives for the annual budget for each year of the
medium term revenue and expenditure framework,
d) Approve the entire draft budget related policies or amendments to such policies
2. The Council of Blouberg Local Municipality, acting in terms of 75A of the Local Government:
Municipal Systems Act (Act 32 of 2000) approves and adopts with effect from 1 July 2018 the tariffs
for other services, as set out in Annexure B policy document.
1.3 Executive Summary
This budget was compiled in line with the Municipal Budgeting and Reporting Regulation (MBRR)
notice no 31804 of 2009 provides comparative financial over a seven year period commencing in the
2014/2015 budget year to 2020/21 budget year. National Treasury’s various Budget Circulars

12 | P a g e
introduced since the beginning of MFMA reforms in 2004 as well as the latest being circular 78,79 , 82
,85, 86 , 89 and 91 were used to guide the compilation of the draft 2018/2019 – 2020/2021 annual
budget and MTREF The planning of the budget involved consideration of all factors, which had far
reaching implications on the annual budget of the municipality..
The application of sound financial management principles for the compilation of the Municipality’s
financial plan is essential and critical to ensure that the Municipality remains financially viable and that
municipal services are provided sustainably, economically and equitably to all communities.
The Municipality’s business and service delivery priorities were reviewed as part of this year’s planning
and budget process. Where appropriate, funds were transferred from low- to high-priority programmes
so as to maintain sound financial management.
The preparation of the 2018/2019 medium Term revenue and Expenditure Framework (MTREF) were
an extremely challenging, with considerable potential impacts on core service delivery cost and
revenue components which influenced the outcomes of MTREF. Another challenge is lower revenue
collection due to non-payment by residents and deficit on none cash item e.g. Depreciation.
The Municipality has anticipated on implementing a variety of revenue collection strategies to optimize
the collection of debt owed by consumers and also circulating its credit control and debt collection
policy.
1.3.1 The following issues were the challenges in the assumption of funds when preparing the
2018/19 draft budget:
• Service delivery backlog against the available resources; especially internal streets.
• Initiatives to improve the current payment aspects.
• The need to reprioritize projects and expenditure within the existing resource envelope given
the cash flow realities and declining cash position of the municipality
• Affordability of capital projects – original allocations had to be reduced because of allocation of
MIG Grant.
• Requirements with regard to upgrading and maintenance of existing roads and other service
networks (Re-gravelling of internal streets).

13 | P a g e
• The non- payment of services charges by communities is a call for concern and strategies must
be developed to ensure that the municipality is able to collect.
• Departmental requirements regarding the filling of critical and vacant positions.
1.3.2 The following assumption were used in compiling the budget,
• In terms of DORA allocation, municipality allocated the following grant :
OPERATING GRANTS AND SUBSIDIES Medium Term Revenue and Expenditure Framework
Budget Budget Budget
2018/19 2019/20 2020/21
Decription
EQUITABLE SHARE 167,730,000 182,071,00
0 195,348,00
0
FINANCIAL MANAGEMENT GRANT 2,534,000 2,534,000 2,534,000
MUNICIPAL SYSTEM IMPROVEMENT 1,055,000 - -
NATIONAL SKILLS FUND GRANT (NSFG) 13,870,726 - - EXPANDED PUBLIC WORKS PROGR INTERGRA 1,089,000 - -
CDM GRANTS 3,300,000 - -
SUBTOTAL OPERATING GRANTS AND SUBSI 189,578,726
184,605,000 197,882,000
CAPITAL GRANTS AND SUBSIDIES MUNICIPAL INFRASTRUCTURE GRANT (MIG) 43,491,000 44,350,000 46,725,000
MUNICIPAL ELECTRIFICATION (INEP) 4,295,000 19,200,000 19,200,000
ENERGY EFFICIENCY AND DEMAND SITE MANAGEMENT 5,000,000 0 0
TOTAL 52,786,000 63,550,000 65,925,000
TOTAL GRANTS 293 438 343 224 139
000 230 290 000
• Tariff Structure

14 | P a g e
-Refuse 6%
- We only receive the commission amount from Capricorn district as we are not water authority.
-Other services 6% e.g photo copies, Advertisement
-Rates 6%
CATEGORY CURRENT TARIFF PROPOSED TARIFF (CENT IN A RAND)
Residential 0.0059 0.0063
Residential property consent use 0.0094 0.0100
Residential impermissible or illegal use 0.0118 0.0125
Residential vacant land 0.0083 0.0088
Farms 0.0083 0.0088
State owned properties 0.0349 0.0370
Businesses\ commercial 0.0083 0.0088
• Remuneration of councilors: The municipality considered the gazette on the Remuneration of
Public Office Bearers Act.
• General Expenses: the municipality consider the MFMA Circular No.82 for cost Containment
Measures.
• Ensuring that expenditure is aligned to revenue and that the municipality has sufficient cash to
finance the expenditure.
• Ensuring that “back to basics” approach will be continuing, focus on improving service delivery, accountability and financial management.
• The Draft municipal cost Containment Regulation as published.
• Ensuring that municipality focus on core service delivery functions and reduce costs without
adversely affecting basic services
• Ensure that the municipality avoids borrowings due to the dependence on grant revenue.
• Ensure that the budget respond to priorities enlisted in the IDP.
• Ensuring eradication of non-priority spending (cost containment measures) and the
reprioritization of expenditure relating to core infrastructure continue to inform the planning
framework
• Ensure that service is cost effective, affordable and sustainable.
• Ensure that realistic revenue targets are set based on trends.
• Ensuring that service delivery and capital projects use labour intensive methods wherever appropriate
• Participating fully in the Expanded Public Works Programme; and

15 | P a g e
• Implementing interns programmes to provide young people with on-the-job training.
• Electricity tariffs will be increased by 6% as per NERSA approval .
• National guide on the application of MFMA circular 89 and 91
1.3.3 BUDGET SUMMARY
The following budget principles and guidelines directly informed the compilation of the tabled 2018/19 MTREF: • The 2017/18 Adjustments Budget • The sustainable development goals The spending on non-core activities has been reviewed and austerity measures have been introduced to reduce spending as outline on the draft municipal cost Containment Regulation. National Treasury’s MFMA Circular No. 91 was used to guide the compilation of the 2018/19 MTREF.

16 | P a g e
The preparation of 2018/19 budget is prepared in accordance with National Treasury MFMA Circular No. 91, Municipal Financial System and process requirements in support of municipal Standard Chart of Account (mSCOA). In view of the aforementioned, the following table is a consolidated overview of the proposed 2018/19 Medium-term Revenue and Expenditure Framework: Table 1 Consolidated Overview of the 2018/19 MTREF
Description Budget Year Budget Year Budget Year Budget Year
2017/18 2018/19 2019/20 2020/21
Total Revenue R322,553,011 314,481,190 323,376,700 342,244,523
Total Operating Expenditure
R300,911,988 300,561,586 298,146,174 310,285,184
Total Capital Expenditure R66,041,024 60,106,650 68,182,000 70,596,920
Surplus/(Deficit) for the year
-R44,400,001 -R42,666,839 -R40,398,996 -R36,845,969
Total operating revenue has decreased by R8.0 million in the 2018/19 budget year when compared to
the 2017/18 Budget. For the two outer years, operational revenue will increase by R8.9 million in the
2019/20 and will increase by R 18.8 million in the 2020/21 financial year.
Total operating expenditure for the 2018/19 budget year has decreased by R350,402.00 when
compared to 2017/18 Budget, and is expected to decrease by R 2.4 million in the 2019/20 and increase
by R12.1 million in the 2020/21 financial year. The capital Expenditure for 2018/19 is expected to
decrease by R 5.9 million, further increase of R8.0 million in 2019/20 and by R 2.4 million in the
2020/21 financial year. This capital income is per 2018/19 DORA allocation plus own revenue.
1.3.3.1 Operating Revenue Framework
The total revenue for the 2018/19 annual budget includes property rates, rental of facilities and
equipment, other revenue, licenses and permits, Interest earned on outstanding debtors, interest on
external investment, sale of site and transfers of recognized operational grants.
The total draft Budget Revenue for 2018/119 is at R 314.4 million which is less than last year ‘s
budget (R 322.5 million) by R 8.0 million, which was mainly caused by the decrease in the allocation
of grant from DORA. The total grant revenue budget of Blouberg Local Municipality for the 2018/19
financial year is at R 242.3 million which is less than last year budget by R 4.0 million due to grant

17 | P a g e
allocation .The total own revenue is at R 72.1 million which is less than last year‘s budget by R 3.9
million due to the decrease on sale of sites.
Table and Graph
Medium Term Revenue and Expenditure
Framework
Budget Budget Budget
2018/19 2019/20 2020/21
Budget-17/18
Budget 2018/19 Budget 2019/20
Budget 2020/21
Grant Income 246,452,860 242,364,726 248,155,000 263,807,000
Own Income 76,100,151 72,116,464 75,221,700 78,437,523
Total 322,553,011 314,481,190 323,376,700 342,244,523
\

18 | P a g e
LIM351 Blouberg - Table A4 Budgeted Financial Performance (revenue and expenditure)
Description Ref 2014/15 2015/16 2016/17
R thousand 1Audited
Outcome
Audited
Outcome
Audited
Outcome
Original
Budget
Adjusted
Budget
Full Year
Forecast
Pre-audit
outcome
Budget Year
2018/19
Budget Year
+1 2019/20
Budget Year
+2 2020/21
Revenue By Source
Property rates 2 14,985 20,289 25,065 24,463 24,463 24,463 21,445 27,000 27,560 29,214
Serv ice charges - electricity rev enue 2 16,767 16,817 20,534 26,000 26,000 26,000 13,231 28,666 29,326 31,086
Serv ice charges - w ater rev enue 2 – – – – – – – – – –
Serv ice charges - sanitation rev enue 2 – – – – – – – – – –
Serv ice charges - refuse rev enue 2 333 418 406 1,792 792 792 275 1,000 840 882
Serv ice charges - other – – – – – – – – – –
Rental of facilities and equipment 820 1,091 1,046 300 300 300 – 315 350 371
Interest earned - ex ternal inv estments 1,040 1,504 2,072 1,500 1,600 1,600 – 1,700 1,590 1,685
Interest earned - outstanding debtors 388 306 1,961 595 595 595 – 631 654 693
Div idends receiv ed – – – – – – – –
Fines, penalties and forfeits 2,593 1,086 1,273 780 3,380 3,380 – 3,440 3,614 3,809
Licences and permits 2,161 3,162 3,489 3,669 3,669 3,669 – 4,000 3,892 4,126
Agency serv ices – 230 – 1,091 1,091 1,091 – 150 160 170
Transfers and subsidies 122,143 152,320 185,947 195,153 195,153 195,153 – 189,579 184,605 197,882
Other rev enue 2 1,443 26,070 1,567 13,803 14,203 14,203 4,008 5,214 7,235 6,402
Gains on disposal of PPE – – – – – – – – – –
Total Revenue (excluding capital transfers
and contributions)
162,673 223,294 243,360 269,145 271,245 271,245 38,959 261,695 259,827 276,320
2018/19 Medium Term Revenue &
Expenditure FrameworkCurrent Year 2017/18

19 | P a g e
Components of revenue: The following are the revenue sources:
Property Rates:
The budget for property rates for the 2017/18 financial year is estimated at R27, 0 million and the outer years the budget is at R27.5 million and R 29.2 million. This increase for 2018/19 is based on the supplementary valuation roll. Electricity:
The Electricity revenue for 2017/18 was R 26,0 million and for annual budget 2018/19 is at R 28.6 million. The budget shows increase as compared with last year‘s budget. The reason for the increase is as a result of the proposal made to NERSA (6%) and the fact that each and every year the municipality electrifies more villages. The free basic electricity of 50kwh per month is provided to each household who qualify for the definition of indigent. Water and sanitation
Municipality is not a water authority as the services belong to the Capricorn district municipality. This means
that services such as water and sanitation are charged by the district. As a result, the municipality budget only
the commission of R0.150 million as per the Service Level Agreement signed with the district.
Refuse:
The Refuse revenue budget for 2017/18 budget was R0.800 million, and R1.0 million for 2018/19 financial.
New extensions from both Senwabarwana and Alldays towns are to be billed.
Traffic services:
The municipal traffic services revenue budget for 2017/18 was R 3.6 million, and for draft budget 2018/19 is
at R 4.0 million. This shows no increase or decrease because of the 80/20 per cent share with the
Department of Transport.
Fines
The municipal revenue budget on fines such as traffic fines for 2017/18 was R 3.3 million and draft budget for
2018/19 is at R 3.4 million.

20 | P a g e
Other income:
The municipal revenue source for other income for 2017/18 was at R 13.8 million, and for draft annual budget
2018/19 is at R5.2 million. This shows a decrease because of the few sites to be sold at Alldays and
Senwabarwana during the 2018/19 financial year.
GRANTS AND SUBSIDIES
The municipality expects the following grants as per DORA: Conditional and unconditional grant.
Conditional grants are as follows:
Municipal finance grant
Municipal infrastructure grant
INEP
EPWP
Municipal system improvement
National skills fund grant
Table:
Medium Term Revenue and Expenditure Framework
OPERATIONAL :GRANT Budget-17/18 Budget 2018/19 Budget 2019/20 Budget 2020/21
NAT DPT AGEN NAT SKILLS FUND
20,098,343
13,870,726
-
-
NGOV: EXPANDED PUBLIC WORKS GRT SCH
1,562,000
1,089,000
-
-
NGOV: CDM GRANT 4,550,000
3,300,000
-
-
NGOV: LOCAL GOV FIN MANAG GRT SCH 5
2,533,000
2,534,000
2,534,000
2,534,000
NGOV: MUNICIPAL DEMARCATION SCH 5B
3,044,000
-
MUNICIPAL SYSTEM IMPROVEMENT
-
1,055,000

21 | P a g e
NATIONAL REVENUE FUND: EQUITABLE SHARE
161,111,000
167,730,000
182,071,000
195,348,000
SUB TOTAL : OPERATIONAL :
192,898,343
189,578,726
184,605,000
197,882,000
CAPITAL :
NGOV: MUNICIPAL INFRASTRUCTURE GRAN
46,554,517
43,491,000
44,350,000
46,725,000
NGOV: INEP 7,000,000
4,295,000
19,200,000
19,200,000
ENERGY EFFICIENCY AND DEMAND SITE MANAGEMENT 5,000,000 0 0 SUB TOTAL : TRANSFERS & SUBSIDIES
53,554,517
52,786,000
63,550,000
65,925,000
TOTAL GRANT REVENUE BUDGET
246,452,860
242,364,726
248,155,000
263,807,000
Unconditional grant
Equitable share
Table:
OPERATING GRANTS AND SUBSIDIES Medium Term Revenue and Expenditure Framework
Budget Budget Budget
2018/19 201920 2020/21
Decription EQUITABLE SHARE 167,730,000 182,071,000 195,348,000
TOTAL 167,730,000 182,071,000 195,348,000
1.3.3.2 Operating Expenditure

22 | P a g e
Total operating expenditure in the 2018/19 draft budget includes the, Employee related cost, Remuneration for councillors, Depreciation and assets impairment, Debts impairment, Contracted services, and Other expenditure The total operating draft budget for 2017/18 financial year is estimated to R 304,7 million which is shows increase from last year ‘ budget (R 280,8 million) .The operating expenditure for the outer years has decrease. The operating expenditure for the outer years has decreased. The decrease is as a result of the skills grant that will be discontinued and the lapsing of the MDTG and EPWP which made provision for a single financial year. The municipality has eliminated spending on non-priority items or activities to give way for service delivery priorities. The operating expenditure includes non- cash item of R 63,7 million which causes a deficit as the municipality given the fact that it is rural its unable to absorb these items through tariff setting considering the level of poverty and affordability
Table and Graph
Salaries
Budget-17/18 Budget 2018/19 Budget 2019/20 Budget 2020/21
EMPLOYEE RELATED COST 97,661,593 101,559,061 106,637,014 111,968,865
SENIOR MANAGERS 5,012,013 6,705,640 6,446,882 6,833,695
REMUNERATION OF COUNCILLORS 15,826,810 16,756,624 17,762,022 18,827,743
DEPRECIATION 38,314,841 39,314,841 41,673,731 44,174,155
BAD DEBTS PROVISION 8,074,410 7,558,875 8,012,408 8,413,028
BULK PURCHASE OF ELECTRICITY 25,758,000 30,000,000 34,800,000 36,888,000
REPAIRS AND MAINTANANCE 6,211,235 4,370,000 7,132,200 7,560,132
OTHER GENERAL EXPENDITURE 104,053,086 94,296,544 75,681,917 75,619,565
TOTAL 300,911,988 300,561,586 298,146,174 310,285,183
Medium Term Revenue and Expenditure Framework

23 | P a g e
The budgeted allocation for employee related costs for the 2018/19 financial year totals R 107.6 million which equals to 36% of the total operating expenditure. An annual increase of 6 % has been included in the two outer years of the MTREF. The cost associated with the remuneration of councilors is determined by the Minister of Co-operative Governance and Traditional Affairs in accordance with the Remuneration of Public Office Bearers Act, 1998 (Act 20 of 1998). The most recent proclamation in this regard has been taken into account in compiling the municipality’s budget. A six (6) percent is proposed for councilors and 8% for senior managers. There are no vacant posts that are included in the annual budget.
The Remuneration of councilors is based on 44 Councilors, including the Mayor, Speaker, the Chief Whip,
Executive Committee members and MPAC Chairperson.
Bulk Purchase,
The bulk purchase expenditure is mainly expenditure for bulk electricity purchase from Eskom and the draft
budget for 2018/19 is amounting to R 30.0 million. This shows an increase as compared to last year’s budget
of R 25,7 million due to the fact that each and every year the municipality electrify more villages . The
municipality also provides provision of free basic electricity to those who qualify the definition of indigents. The
indigent policy directs that all households earning a collective income of pensioners not exceeding R 3,400.00
per month classified to fall under needy consumer's category.
Operation: Repairs and Maintenance
The repairs and maintenance for Blouberg municipality is for materials (machinery and equipment) and roads
maintenance and we are going to use our employees and EPWP workers for such service. The total allocation
for 2018/19 is at R 4,3 million. This shows a decrease as compared to last year‘s budget of R 6.2 million.
The municipality also makes provision for renewal of assets amounting to R .800 million.
Depreciation
The Provision for depreciation and asset impairment has been informed by the Municipality’s Asset
Management Policy. Depreciation is widely considered a proxy for the measurement of the rate asset
consumption. Budget appropriations in this regard total R39.3 million for the 2018/19 financial.
Other Expenses
In the 2016 State of the Nation Address by the President, the cost containment measures announced by the
Minister of Finance in 2013 were re-emphasised.it was highlighted that excessive and wasteful expenditure
must be reduced .The total general expenses for administrative purposes were reviewed in order to identify
and curb wastage as per MFMA circular 82. This group of expenditure has also been identified as an area in

24 | P a g e
which cost savings and efficiencies can be achieved. Expenditure growth has been limited to 6 per cent for
2017/18 even though the MFMA circular has determined a celling at 6.4% given the fact that our inflation
targeting of between 3 and 6 percent forecast in terms of actual gives a different picture of more than 6% and
shows stabilizing at around 5.7 and during the 2018/19 and 2019/20 financial year. The allocation amount of
other Expenses is amounting to R 94.2

25 | P a g e
LIM351 Blouberg - Table A4 Budgeted Financial Performance (revenue and expenditure)
Description Ref 2014/15 2015/16 2016/17
R thousand 1Audited
Outcome
Audited
Outcome
Audited
Outcome
Original
Budget
Adjusted
Budget
Full Year
Forecast
Pre-audit
outcome
Budget Year
2018/19
Budget Year
+1 2019/20
Budget Year
+2 2020/21
2018/19 Medium Term Revenue &
Expenditure FrameworkCurrent Year 2017/18
Expenditure By Type
Employ ee related costs 2 69,842 77,443 87,556 101,539 102,870 102,870 65,050 108,265 113,084 118,803
Remuneration of councillors 12,139 12,906 17,510 17,584 19,013 19,013 16,757 17,762 18,828
Debt impairment 3 3,856 10,831 (3,067) 8,074 8,074 8,074 7,559 8,012 8,413
Depreciation & asset impairment 2 51,686 31,712 33,726 38,000 38,315 38,315 – 39,315 41,674 44,174
Finance charges – 372 314 – – – – – – –
Bulk purchases 2 19,313 23,268 26,042 25,758 25,758 25,758 17,532 30,000 34,800 36,888
Other materials 8 1,895 5,525 5,441 5,571 6,211 6,211 4,370 7,132 7,560
Contracted serv ices 3,160 3,582 5,923 12,000 11,500 11,500 6,713 12,705 15,467 14,954
Transfers and subsidies – – – – – – – – – –
Other ex penditure 4, 5 39,918 54,785 76,772 85,994 89,171 89,171 55,981 81,592 60,215 60,666
Loss on disposal of PPE 262 518 – – – – – – – –
Total Expenditure 202,072 220,942 250,217 294,520 300,912 300,912 145,276 300,562 298,146 310,285

26 | P a g e
1.3.3.3 Capital Expenditure
The following table shows capital budget:
The total Capital Draft Budget for 2018/19 is amounting to R 60.1 Million which is equals to 20% of the
total draft Operating budget. In the outer years this amount totals R67.6 Million, for the 2019/20 and R
72.1 Million financial year.
Total new assets represent R55.6 million Infrastructure and R 3.6 million for non-infrastructure of the total
capital budget while the renewal or refurbishment of assets amount to R .800 Million which represent
20% of the total operating budget. Further detail relating to asset classes and proposed capital
expenditure is contained in MBRR A9 (Asset Management). In addition to the MBRR Table A9, MBRR
Tables SA34a, b, c provides a detailed breakdown of the capital programme relating to new asset
construction as required
Table and Graph:
Budget Year Budget Year Budget Year
2018/19 2019/20 2020/21
Capital Budget
New infrastructure Assets 55,691,650 64,850,000 65,925,000
Renewal Infrastructure Assets 800,000 1,000,000 1,700,000
Non-Infrastructure 3,615,000 2,332,000 2,971,920
TOTAL 60,106,650 68,182,000 70,596,920
Medium Term Revenue and Expenditure Framework
New infrastructure
Assets
Renewal Infrastructure
Assets
Non-Infrastructure
TOTAL
2018/19

27 | P a g e
Funding of Capital Projects
BUDGET 201819
Capital Funding
Descriptions Amount Internally generated fund 9,495,200
MIG Grant 41,316,450
INEP Grant 4,295,000
ENERGY EFFICIENCY AND DEMAND SITE MANAGEMENT 5,000,000
TOTAL 60,106,650
Funding’s of capital projects is as follows:-
Expenditure on Conditional Grants Allocation
Municipal Infrastructure Grant
The MIG funds the provisions of infrastructure to provide basic services, road and social infrastructure
for poor households in all municipal areas. MIG finance all the projects approved by COGTA. The
2018/19 projects would be as follows:-
BUDGET 201819
CAPITAL FUNDING : MIG
DESCRIBTION AMOUNT COMMUNITY ASSETS- IU C: ACQUISITION CRECHE: TOWERFONTEIN 2,000,000
COMMUNITY ASSETS - IU C: ACQUISITION COMMUNITY HALL 500,000
ROADS INFRA - IU C: ACQUISITION SENWABARWANA PHASE 9 6,998,125
ROADS INFRA - IU C: ACQUISITION SENWABARWNNA PHASE 10 6,998,125
ROADS INFRA - IU C: ACQUISITION KROEMHOEK PHASE 3 6,325,000
ROADS INFRA - IU C: ACQUISITION KROMHOEK PHASE 4 6,325,000
ROADS ASSETS - IU C: ACQUISITION AVON 7,850,200
OTHER ASSETS - IU C: ACQUISITION SENWABARWANA SPORTS 6,820,200

28 | P a g e
TOTAL 43,816,650
Integrated National Electrification Grant (INEP)
The INEP funds would use to fund the electrification projects as per 2018/19 budget, which are as
follows:-
BUDGET 201819
CAPITAL FUNDING :INP
DESCRIBTION AMOUNT
EL IU C - LV NETWORKS:ACQUISITION : ELECTRIFICATION WITTEN EXT 7 3,300,000
EL IU C - LV NETWORKS:ACQUISITION : ELECTRIFICATION RAWESHI 154,000
EL IU C - LV NETWORKS:ACQUISITION : ELECTRIFICATION CRACOUUW 280,000
EL IU C - LV NETWORKS:ACQUISITIONMIL : ELECTRIFICATION OLDLONSIGN EXT 140,000
EL IU C - LV NETWORKS:ACQUISITION : Electrification EARLYDAWN EXT 280,000
EL IU C - LV NETWORKS:ACQUISITION :ELECTRIFICATION LEKGWARA EXT 147,000
TOTAL 4,301,000
Performance indicators for capital budget
▪ Percentage of households with access to community halls within 10 kilometer radius.
▪ Percentage of households with access to sports facilities within the 10 kilometer radius.
▪ Percentage of households with access to pre-school within the 5 kilometer radius.
▪ Additional internal streets constructed and the number of households benefiting the access
roads.
▪ Renewal of Assets both internal street and Electricity
▪ Additional cost of infrastructure will provided for municipal additional assets such as furniture,
office equipment, upgrading of IT systems at satellite offices etc for day to day
administration.
1.3.3.4 Investment

29 | P a g e
The municipality is obliged to put aside a certain amount determined by Eskom for guarantee. Blouberg
Municipality made provision of R 3,079,000 for Eskom guarantee and also earn interest on that and
invested R 10 ,000,000 .

30 | P a g e
LIM351 Blouberg - Supporting Table SA16 Investment particulars by maturity
Investments by Maturity RefPeriod of
Investment
Capital Guarantee
(Yes/ No)
Variable or Fixed
interest rateInterest Rate ᶟ
Commission Paid
(Rands)
Commission
RecipientOpening balance
Interest to be
realised
Partial / Premature
Withdrawal (4)Investment Top Up Closing Balance
Name of institution & investment ID 1 Yrs/Months
Parent municipality
ABSA 20-7075-00-19 Months Eskom Guarantee 3079000 Variable 7.3 0 0 09 March 2017 3,079 29 – – 3,108
ABSA 20-7651-8423 Months Fix ed account 10000000 Variable 7.76 0 0 15 March 2017 10,000 178 – – 10,178
0 –
–
–
–
–
Municipality sub-total 13,079 – – 13,286
Type of InvestmentExpiry date of
investment

31 | P a g e
1.3.3.5 Financial position and summary of medium term revenue and expenditure.

32 | P a g e
LIM351 Blouberg - Table A6 Budgeted Financial Position
Description Ref 2014/15 2015/16 2016/17
R thousandAudited
Outcome
Audited
Outcome
Audited
Outcome
Original
Budget
Adjusted
Budget
Full Year
Forecast
Pre-audit
outcome
Budget Year
2018/19
Budget Year
+1 2019/20
Budget Year
+2 2020/21
ASSETS
Current assets
Cash 18,523 28,886 41,113 33,079 76,425 76,425 42,017 51,697 51,697 53,132
Call inv estment deposits 1 – – – 10,000 10,000 10,000 10,527 10,000 10,000 10,000
Consumer debtors 1 4,032 4,523 8,258 (493) 7,765 7,765 – 9,231 9,785 10,452
Other debtors 6,181 13,865 12,246 4,426 16,291 16,291 4,692 4,973 5,272
Current portion of long-term receiv ables 18,693 26,225 61,211 15,893 61,211 61,211 16,847 17,858 18,929
Inv entory 2 6,805 3,862 3,879 1,618 3,879 3,879 2,380 1,715 1,818 1,927
Total current assets 54,234 77,360 126,707 64,524 175,571 175,571 54,923 94,182 96,131 99,712
Non current assets
Long-term receiv ables – – – – – – – – – –
Inv estments 3,092 3,093 3,093 3,403 3,403 3,403 3,126 3,097 3,079 3,079
Inv estment property – – 205 – 205 205 – – –
Inv estment in Associate – – – – – – – – – –
Property , plant and equipment 3 760,633 808,306 856,790 945,282 945,282 945,282 – 1,002,108 1,062,235 1,125,969
Agricultural – – – – – – – – – –
Biological – – – – – – – – – –
Intangible – 130 103 – 103 103 – – –
Other non-current assets
Total non current assets 763,725 811,528 860,190 948,686 948,993 948,993 3,126 1,005,205 1,065,314 1,129,048
TOTAL ASSETS 817,959 888,889 986,897 1,013,209 1,124,565 1,124,565 58,049 1,099,387 1,161,445 1,228,760
LIABILITIES
Current liabilities
Bank ov erdraft 1 – – – – – – – – – –
Borrow ing 4 – – – – – – – – – –
Consumer deposits – – – – – – – – – –
Trade and other pay ables 4 40,470 56,080 53,284 4,288 37,296 37,296 22,529 26,400 21,600 19,000
Prov isions 5,346 6,543 7,335 – – – – – – –
Total current liabilities 45,817 62,624 60,619 4,288 37,296 37,296 22,529 26,400 21,600 19,000
Non current liabilities
Borrow ing – – – – – – – – – –
Prov isions 13,639 13,796 13,515 3,231 12,368 12,368 – 2,830 2,152 2,281
Total non current liabilities 13,639 13,796 13,515 3,231 12,368 12,368 – 2,830 2,152 2,281
TOTAL LIABILITIES 59,456 76,420 74,134 7,519 49,664 49,664 22,529 29,230 23,752 21,281
NET ASSETS 5 758,504 812,469 912,763 1,005,690 1,074,901 1,074,901 35,520 1,070,157 1,137,693 1,207,479
COMMUNITY WEALTH/EQUITY
Accumulated Surplus/(Deficit) 758,504 812,469 912,763 1,005,690 1,074,901 1,074,901 35,520 1,070,157 1,137,693 1,207,479
Reserv es 4 – – – – – – – – – –
TOTAL COMMUNITY WEALTH/EQUITY 5 758,504 812,469 912,763 1,005,690 1,074,901 1,074,901 35,520 1,070,157 1,137,693 1,207,479
2018/19 Medium Term Revenue &
Expenditure FrameworkCurrent Year 2017/18

33
33
1.3.3.6 MUNICIPAL PRIORITIES The municipal priorities change in respect of the target set for the term of the council.
NO MUNICIPAL PRIORITIES 01. Enhance Economic Development, Job Creation and Partnerships
02. Access to Water and Sanitation
03. Improved and better Roads and Public Transport infrastructure
04. Human Resource Development
05. Institutional Development and Financial Sustainability/Sound financial Management and Financial Viability
06. Access to Sports and Recreational Facilities
07 Provision of Sustainable, Alternative and Green Energy
08. Rural Development and Urban Renewal
09. Healthy and safer Environment and Waste Management
10. Better Health and Welfare services
11. Sound Land Use Development Management
12. Emergency Services and Communication
Provision of Free Basic Services : Basic and social infrastructure needs
34
34
This analysis will focus on the provision of basic and social infrastructure needs for Blouberg
communities. More emphasis will be on the provision of services such as water, sanitation, energy, and
roads.
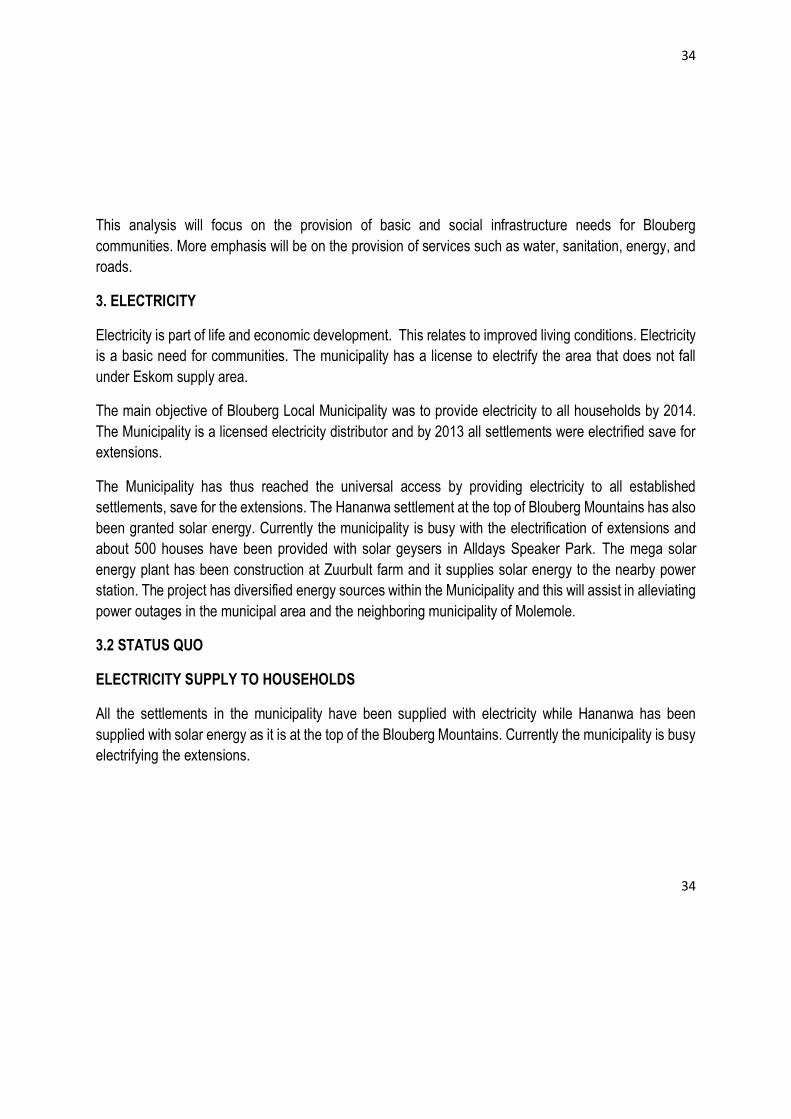
3. ELECTRICITY
Electricity is part of life and economic development. This relates to improved living conditions. Electricity
is a basic need for communities. The municipality has a license to electrify the area that does not fall
under Eskom supply area.
The main objective of Blouberg Local Municipality was to provide electricity to all households by 2014.
The Municipality is a licensed electricity distributor and by 2013 all settlements were electrified save for
extensions.
The Municipality has thus reached the universal access by providing electricity to all established
settlements, save for the extensions. The Hananwa settlement at the top of Blouberg Mountains has also
been granted solar energy. Currently the municipality is busy with the electrification of extensions and
about 500 houses have been provided with solar geysers in Alldays Speaker Park. The mega solar
energy plant has been construction at Zuurbult farm and it supplies solar energy to the nearby power
station. The project has diversified energy sources within the Municipality and this will assist in alleviating
power outages in the municipal area and the neighboring municipality of Molemole.
3.2 STATUS QUO
ELECTRICITY SUPPLY TO HOUSEHOLDS
All the settlements in the municipality have been supplied with electricity while Hananwa has been
supplied with solar energy as it is at the top of the Blouberg Mountains. Currently the municipality is busy
electrifying the extensions.

35
35
MUNICIPALITY POPULATION % of
Households
% of Households
with access to
Electricity
% of households
with no Electricity
Municipality Population 2014/15
2015/16 2016/17 2014/15
2015/16 2016/17
Blouberg 162 625 99.2% 99,5 % 97 % 0.71%
0,5% 3 %
The table above is the combination of Eskom and Municipality Villages.
3.3. PROVISION OF FREE BASIC ELECTRICITY
The municipality as well as ESKOM provides free basic electricity of 50 KWA to its indigent residents per
month. Such indigents are captured in the municipal indigent register which is updated from time to time.
Field cashiers have been appointed in all the 22 wards to register and update the indigent register as well
as a register of all municipal customers.
3.4. Free Basic Alternative Energy(FBEA)
The Municipality provide free basic alternative energy to households that do not have electricity. The
municipality provides gels, stoves and solar lamps to these households. Currently 11 villages benefit from
this program me.
3.5. CHALLENGES
The Municipality currently has a backlog of 3 % which translates to 1334 households, in ESKOM supply
extension areas. The main challenge is lack of funding and delays in the approval of designs, and in
some instances also energizing due to misunderstandings between the Municipality and ESKOM. There
is also a challenge of distribution loss in that the funds used in the bulk purchase of electricity are so huge
with low return. The challenge of illegal connection exists. There is also shortage of personnel to do meter
auditing to determine exactly the cause of distribution loss.

36
36
3.6. INTERVENTIONS
The municipality has engaged ESKOM and the Department of Energy to transfer electricity infrastructure
in the town of Senwabarwana to the municipality so that council can take full control of such infrastructure
to accommodate the growth of the town and also assist in aligning such with the municipal billing system.
The Municipality has further engaged ESKOM, CDM and the Department of Energy to assist in the
development of the energy master plan. One other intervention has been to engage ESKOM with a
priority list of settlements which should be provided with connections as a result of the growth of such
settlements and in the 2016/2017 financial year settlements such as Sesalong, Bognafarm,
Schoongezight, Grootdraai, Papegaai and Towerfontein have been connected. In the 2014\15 FY there
was a delay in the implementation of ESKOM projects but at these stage contractors have been
appointed. The Blouberg Municipality has recently electrified and energized settlements such as
Silvermyn, Motadi, Gideon, Diepsloot, and Mongalo. The municipality has enlisted the services of field
cashiers to conduct meter auditing exercise to assist in the curbing of illegal connections and distribution
loss.
3.5.2 ROADS AND STORM WATER
The Municipality takes the responsibility of ensuring that all municipal roads are in a good condition for
use by vehicles and other land modes of transport. The municipality also takes care of storm water control
which poses a serious threat to the access roads and internal streets.
3.8. STATUS QUO
CLASSIFICATION OF MUNICIPAL MAJOR ROADS
Road Number Route Category
N11 Mokopane via Blouberg and
Lephalale to Botswana
Nationally

37
37
R 521 Provincial
R 572 Alldays to Maastroom Provincial
Road Number Route Category
R 561 N11 to Maastroom Provincial
D 3325 Ga-Moleele to Harris which via
Gemarke
Provincial
D 3270 Springfield to Vergelegen Provincial
D 3278 Buffelshoek Clinic via
Bahananwa Tribal Office to
Inveraan
Provincial
D 3327 Mashalane to Bull-Bull Provincial
D 3278 Dalmyne to Bull-Bull Provincial
D1589, D3297, D3292 De Vrede via Raditshaba
to Eldorado
Provincial
D1200, D688, D2657 Dendron via Makgato to N1
(Botlokwa)
Provincial
D1468 Puraspan to Indermark
Provincial
D 3330, D3474, D3440 Ga Moleele, GaDikgale,
GaLetswalo, Raweshi, Pollen,
Mons, Swartz to Driekoppies
Provincial

38
38
D3275-D3287 Windhoek to Eldorado Provincial
D3322
Blouberg health centre via
Bahananwa Tribal Office to
Buffelshoek
Provincial
The Limpopo Department of Roads and Transport takes responsibility of the provincial road network and
some of the District Roads (although not clearly defined) within the Municipality’s area of jurisdiction. The
total length for the Provincial road network is approximately 960km, from which 262km is surfaced and
698km is gravel, leaving a backlog of 73%.
The condition of most of the Provincial gravel roads is not so good, but the Limpopo Department of Roads
and Transport performs maintenance on these roads. They re-gravel and construct culverts for some of
these roads. They are also currently running an EPWP program me whereby over 600 people have been
employed from within the Municipality’s communities, specifically for the cleaning of road reserves
alongside the main roads, and other routine maintenance of the surfaced roads.
Blouberg Municipality takes responsibility for the municipal roads network. The total length of Blouberg
road network is approximately 640km, from which 215km is access roads and 425km is internal Streets.
The conditions of municipal roads and stormwater facilities are very poor. Most of the roads are not
accessible during rainy days as they become water logged. Roads in settlements next to mountains have
been damaged by uncontrolled surface run-off water from the mountains with villages such as Mokwena,
Burgerught, Kgatla, Leipzig and Inveraan been badly affected. Ward one settlement also encounter
serious challenges of roads and storm water. The Municipality has only managed to surface 35 kilometers
of the internal streets from the Municipal Infrastructure Grant that is allocated to the Municipality annually
(also utilized for other Infrastructure Projects). There is still a total backlog of approximately 605 km which
also includes access roads, translating to 96% of backlog. The Municipality’s Technical Services
Department has a Roads and Storm Water Unit that deals mainly with the maintenance of municipal
roads. The Unit is divided into three (3) clusters that operate from Eldorado, Buffelshoek and Indermark.

39
39
Each of these clusters has a group of villages that it is responsible for, and with the minimal resources
that the Municipality has, it has also distributed them amongst these clusters and in some instances the
resources are shared. A list of priority Roads, also serving as a Roads maintenance plan has been
compiled for each of the clusters.
3.9. CHALLENGES
The main challenge is the huge percentage of backlog for municipal roads. The Municipality depends
fully on the Municipal Infrastructure Grant (MIG) for the implementation of roads projects and the grant is
never sufficient to make an impact on backlogs as it is also utilized on other infrastructure projects other
than roads.
Due to lack of funds, currently there is no Master Plan that is in place, causing poor planning for municipal
roads and storm water drainage. Most of the access roads and internal streets are not paved or tarred
as the municipality lacks enough funds to implement the project.
Most of the Municipality’s gravel roads are in a bad condition and currently there are insufficient
resources. Some of municipal resources are even shared amongst the three (3) roads maintenance
clusters. There is a shortage of skilled personnel in the municipal roads maintenance unit. The provincial
Roads and Transport Department which is also responsible for the operation, maintenance and
management of provincial networks of roads has huge capacity constraints thereby causing the
municipality with its limited resources to take over the operation and maintenance of most provincial
roads.
3.10. INTERVENTIONS
A funding model for the MIG must be reviewed in order to ensure that allocations are distributed in a
manner that will create an impact to municipal backlogs over a certain period.
Roads Master Plans must be developed in order to ensure proper planning for Roads and Storm water
drainage, also focusing on access roads.

40
40
There must be an increase in the number of resources and recruitment of skilled personnel for municipal
roads maintenance clusters.
The Department of Public Works and Roads must also allocate sufficient funds to create an impact on
the backlog for the provincial roads.
The re-gravelling and maintenance of some internal streets service was outsourced to external service
providers as a pilot.
To date areas such as Mokhurumela which had large sand streets are accessible as a result of the
project. The other areas where there was bad access streets and roads such as Inveraan are accessible.
The municipality has also purchased the low bed truck to transport its plant and machinery to improve on
the turnaround time to respond to challenges.
BLOUBERG MUNICIPALITY UPGRADING:GRAVEL TO TAR
ROUTE PARTICULARS GROWTH AREAS
PRIORIT
Y
ROAD
NO.
ROADS
PARTICULARS
APPRO
XIMAT
E
LENGT
H
(km)
LOCAL
MUNICIPA
LITY
GROWTH
POINT
LEVEL OF
GROWTH
POINT
OTHER
DEVELOPM
ENT
STRATEGY
SUPPORTE
D
1
D1589,
D3297,
D3292
De Vrede via
Raditshaba
to Eldorado
25 Blouberg Eldorado Local
Farming,
retail
development
and
administrativ
e

41
41
2
D1200,
D688,
D2657
Dendron via Makgato
to N1 (Botlokwa) 35
Molemole,
Blouberg
Dendron
(Mogwadi) District
SDR,
Agriculture,
Tourism
3 D1468
Puraspan to
Indermark
10 Blouberg Avon/
Puraspan Local
Farming,
retail
development
and linkage
with
Makhado
Municipality
4
D 3330,
D3474,
D3440
Ga Moleele,
GaDikgale,
GaLetswalo,
Raweshi, Pollen,
Mons, Swartz to
Driekoppies
30 Blouberg Senwabar
wana Local Major Link
5
D3275-
D3287 Windhoek to
Eldorado 38 Blouberg Eldorado Local
Farming,
administrativ
e and major
access
6 D3322
Blouberg health
centre via
Bahananwa Tribal
Office to Buffelshoek
12 Blouberg Senwabar
wana Local Major Access
3.11. PUBLIC TRANSPORT

42
42
There is one mode of public transport in the municipal area viz road transport. The dominant public
transport mode is the minibus taxi while another form of public transport is the bus transport with Great
North and Mmabi bus being the main operators. The challenge with the municipal public transport is that
it is only available between 6H00 in the morning and 20H00 leaving most commuters stranded outside
these stipulated times. The movements of these modes of public transport is towards all the nodal points
of Blouberg, viz, Alldays, Senwabarwana, Tolwe and Eldorado while outside Blouberg the major
destinations are Musina, Louis Trichardt, Lephalale, Steilloop and Polokwane.
STATUS OF TAXI RANK FACILITIES
LOCATION STATUS DESTINATIONS Senwabarwana The rank is formal with the
following facilities: shelter, loading bays, ablution blocks and hawkers’ facilities
The rank covers the rest of Blouberg and destinations such as Polokwane, Johannesburg,
Eldorado The rank is formal with the following facilities: shelter, loading bays, ablution blocks
The rank covers the rest of Blouberg and areas such as Senwabarwana and it connects to Polokwane via Kromhoek taxi rank
Kromhoek The rank is formal with the following facilities: shelter, loading bays, ablution blocks and hawkers’ facilities
The rank covers the rest of Blouberg and destinations such as Polokwane, Johannesburg and Louis Trichardt
Alldays The rank is formal with the following facilities: shelter, loading bays, ablution blocks
The rank covers the rest of Blouberg and destinations such as Musina and Louis Trichardt
Windhoek The rank is informal It covers Senwabarwana, Steillop
Avon The rank is informal It covers Senwabarwana, Vivo, Indermark
Buffelshoek The rank is informal It covers Senwabarwana
Vivo The rank is informal It covers Senwabarwana, Alldays, Mogwadi and Louis Trichardt
Letswatla The rank is informal It covers Senwabarwana

43
43
Mamehlabe The rank is informal It covers surrounding villages and links with Tibane taxi rank to Polokwane
3.12. PUBLIC TRANSPORT CHALLENGES
The challenge with the municipal public transport is that it is only available between 06H00 in the morning
and 20H00 leaving most commuters stranded outside these stipulated times. The other main challenge
is the bad state of roads that increases the operation and maintenance costs of public transport operators.
Lack of formal taxi ranks with all related amenities in some strategic area such as Avon, Vivo, Buffelshoek,
Windhoek and Harris which remains a challenge. Disputes over operating routes occasionally occur
resulting in conflicts among taxi associations.
3.13. PUBLIC TRANSPORT INTERVENTIONS
The roads and transport forum has been established and all taxi associations operating within Blouberg
are members of the forum. Recent conflicts between Letswatla and Bochum Taxi associations have been
resolved through the intervention of the municipality, SAPS and the District Taxi Council. The matter of
accessibility of public transport outside the 06H00 and 20H00 time periods has been referred to the
operators for rectification. The state of poor road conditions has been highlighted to the MEC for Roads
and Transport for intervention. A priority list for formalization of taxi ranks will be developed by the
municipality and the CDM in collaboration with public transport operators. Taxi and bus shelters have
been constructed along major routes such as D1200 (Senwabarwana-Windhoek road), Wegdraai to
Eldorado road, Letswatla to Windhoek road and D1598 (Kibi to Schiermoonikoog road)
3.14. TRAFFIC MANAGEMENT
The main offices for traffic management are in Senwabarwana. A new traffic station has been constructed
and operationalized at Senwabarwana and the services are rendered from the new traffic station. The
municipality has rolled out the traffic management services to Alldays and Eldorado, as part of the
decentralization of services. The learners’ licenses classes are conducted from both Alldays and
Eldorado offices. The Alldays traffic office covers Vivo in Ward 12, ward 17 and 18. The Eldorado office

44
44
covers both areas of ward 15, 16 and 21. The Alldays traffic office controls traffic to and from Zimbabwe,
Musina, Venetia Mine, Botswana, Swaartwater and surrounding villages.
STATUS OF TRAFFIC CENTRES
LOCATION STATUS SERVICE Senwabarwana: Main offices
The centre provides all services and serves as the main office of the municipality.
Fully operational
Eldorado: Satellite office The traffic service is amongst municipal services decentralized to the Eldorado satellite office.
Semi-operational
Alldays: Satellite office The traffic service is amongst municipal services decentralized to the Alldays satellite office.
semi –operational
3.15. TRAFFIC SERVICES CHALLENGES
The main challenge remains the road conditions within the municipal area, which pose a threat to the
conditions of the vehicles. Other nodal points such as Tolwe, Harris which and Laanglagte are not
covered by traffic offices, and as a result, less service is provided to those nodal points. Another factor is
the traffic congestion within Senwabarwana town, which results in traffic delays and possible accidents.
3.16. TRAFFIC SERVICES INTERVENTIONS
The challenge related to state of roads could be solved by the development of a road master plan by the
Infrastructure Development and Engineering services department in line with the Integrated Transport
Plan, which includes re-gravelling, de-bushing and tarring. Traffic congestion could be reduced by
establishing a holding area for taxis after off-loading commuters.
3.17. REGISTRATION AND LICENSING OF VEHICLES

45
45
The main offices for the registration and licensing of vehicles are in Senwabarwana. The municipality has
rolled the service out to Alldays and Eldorado, as part of the decentralization of services plan. The Alldays
driver-learner testing centre (DLTC) covers Vivo in Ward 12, ward 17 and 18. The Eldorado office covers
both areas of ward 15, 16 and 20.
STATUS OF DRIVER-LEARNER TESTING CENTRES
LOCATION STATUS SERVICE Senwabarwana: main offices
The centre provides all services including driver testing centre and testing of vehicles, and serves as the main office of the municipality.
Fully operational
Eldorado: satellite office The centre is amongst municipal services decentralized to the Eldorado satellite office, which provides for learners licensed tests, registration of vehicles and issuing of car discs.
Service to be fully operational without vehicle testing and driver testing.
Alldays: satellite office The centre is amongst municipal services decentralized to the Eldorado satellite office. which provides for learners license tests, registration of vehicles and issuing of car discs?
Service to be fully operational without vehicle testing and driver testing.
3.18. LICENSING AND VEHICLE REGISTRATION SERVICE CHALLENGES
The main challenge remains the road conditions within the municipal area, which will make it difficult to
open a driver-testing centre at Eldorado (no tar road). Another challenge is the informal operations of the
driving schools within the municipality and the high charges for testing of the students. Other nodal points
such as Tolwe, Harris which, Inveraan and Laanglagte are not covered by services, and as a result, law
enforcement service is provided to those nodal points. Another factor is the traffic congestion within
Senwabarwana town, which results in traffic delays and possible accidents. At times it makes it difficult
to tests the learners on the road.

46
46
3.19. LICENSING AND VEHICLE REGISTRATION SERVICE INTERVENTIONS
The problem related to the informal driving schools could be resolved by establishing a driving schools’
forum and training of the schools for efficient management of their schools. The challenge related to state
of roads and road markings could be solved by the development of a road master plan by the
Infrastructure Development and Engineering services department.
The municipality has constructed the new structure for licensing and vehicle registration to solve the
challenge of space.
WASTE MANAGEMENT
3.21. STATUS QUO
The Municipality has developed and adopted an Integrated Waste Management Plan (IWMP) in 2008.
The plan was revised in the 2013\14 financial year. The plan serves as a roadmap for the management
of solid waste for the entire Municipality with R293 towns and nodal points, plus some rural villages, used
as starting points since the capacity available cannot cover the entire municipal wide area. Currently the
function is rendered in fourteen settlements on a weekly basis while the towns of Alldays and
Senwabarwana receive the service on a daily basis. Currently there are two landfill sites in Alldays and
Senwabarwana. A waste transfer station at Taaibosch is complete. A waste management team is in place
and two waste removal trucks, plus a tractor, have been purchased.
THE TABLE BELOW REFLECTS WARD WASTE REMOVAL SERVICE ROLL OUT AND BACKLOGS
WARD AVAILABLE NO. OF HOUSEHOLDS BACKLOG ITO OF VILLAGES WITHIN THE WARD
1 0 11 2 0 7 3 0 6

47
47
THE TABLE BELOW REFLECTS WARD WASTE REMOVAL SERVICE ROLL OUT IN THE
MUNICIPALITY
4 0 9 5 0 7
6 0 5 7 0 6 8 1 DILAENENG 1021 6
9 0 6 10 1 AVON UP TO DIKGOMO 2979 0 11 0 6
12 2. INDERMARK UP TO DIKGOMONG
2136 0
13 2 (BURGERUGHT AND MOTLANA)
554 5
14 0 7
15 2 (KROMHOEK AND DEVREDE) 3650 0 16 0 5 17 2 (GROOTPAN AND LONGDEN) 1200 6
18 2 (TAAIBOSCH AND ALLDAYS) 2967
0
19 2 ( SENWABARWANA TOWN, DESMOND PARK, EXTENSION 5, WITTEN.
4037 0
20 0 0
8
21 0 0
10
22 0 0 5 TOTAL 14 18544 of 41 416 households
109 (24 679 households)
WARD AVAILABLE NO. OF HOUSEHOLDS
BACKLOG

48
48
3.22. CHALLENGES
Capacity constraints: this involves lack of resources (financial and human) to roll out the service to the
entire municipal area. Available plant and personnel are not enough to render the service for all areas.
For the past two financial years the Municipality could not purchase plant and refuse bins due to
budgetary constraints.
The Senwabarwana land fill site is completed and operational and waste is being dumped in the land fill
site.
Lack of education on the part of members of the community on waste matters does not help the situation.
Lot of littering occurs in the town of Senwabarwana around the CBD mainly because much business
activities are taking place there. The Department of Environmental Affairs has trained officials to enforce
both by-laws and Environmental Acts around the municipal jurisdictional area which will ease the situation
of non-compliance by the regulated community.
3.23. INTERVENTIONS
Blouberg Municipality renders the refuse removal service in 14 settlements with the, households serviced
standing at 18 544 (45%). The backlog is 22 872 (55%). Challenges are funding for roll out of the refuse
service to all settlements.
01 1 (RAWESHI) INCLUDING MINING AREA
165 10
11 1 (MACHABA)
1670 0
16 1 (ELDORADO)
1234 7
19 2 ( SENWABARWANA TOWN, DESMOND PARK, EXTENSION 5, WITTEN.
4037 0
21 1 (TOLWE)
20 9
TOTAL
3089

49
49
The Environmental Management Plan (EMP) is partially implemented; the Solid waste and refuse
removal by laws are not fully implemented due to capacity challenges that are currently being ironed out.
Intergraded Waste Management Plan is currently under review. The neighborhood funding from the
National Treasury earmarked for urban renewal shall come in handy to address some of the waste
management challenges encountered.
The Municipality is rolling out the function to a number of settlements with the recruitment of hundred
(100) general workers who were employed from the 2011\12 financial year. The number of municipal
EPWP participants has increased from 140 to 175 in the 2014\15 financial year and such number will
either be sustained or increased in subsequent years.
The program me is augmented by the integration of EPWP and Community Works Program me. Such
general workers are used to clean settlements, roads, cemeteries and any other work identified by
members of the community.
Another intervention is through partnerships with private stakeholders. Currently the Municipality has a
partnership with PEACE Foundation to deal with waste management issues. A Recycling, Reduce and
Re-Use initiative is being implemented at Alldays and Senwabarwana. Fifty (50) drums have been
mounted in both Senwabarwana and Alldays as a form of mitigating littering from the regulated
community. A total of 18 544 (45%) households receive household collection on weekly basis during
2014/15. The municipality is currently experiencing backlog of 22 872 (55%) households from various
settlements that are not saturated with population growth.
3.24. WATER PROVISION
Water is a basic need to communities. It is important that the water that is provided to communities is of
good quality and suitable for human consumption, and also suitable for good hygiene practices, noting
that without water there is no hygiene.
3.25. STATUS QUO
Blouberg Municipality serves as a Water Services Provider (WSP) responsible for the function of
operations and maintenance for the water infrastructure with a budget allocated from the Water Services

50
50
Authority (WSA) being the Capricorn District Municipality (CDM). The municipality is dependent on
underground water source as there are no dams to assist with the water provisioning.
CDM has established its own Blouberg Satellite Office, which has a manager also working with local
municipal staff. The District has, further, seconded its staff to the Blouberg Satellite Office to work on the
operations and Maintenance of the water infrastructure, most of who have been transferred from the
Department of Water Affairs in the year 2007. The Satellite office has five (5) Maintenance Camps
responsible for the maintenance of the five (5) Regional Water Schemes that are in the Blouberg
municipal Area. Capricorn District Municipality as the WSA implements water projects on the local
municipality’s behalf. Currently 72% of the households within the Blouberg municipal area have access
to water at the level of RDP standard, with only a backlog of 28%. Other Water projects are to be
implemented in the future financial years, as prioritized by CDM but in consultation with the Municipality.
Some of these projects will focus on the refurbishment of some of the old Infrastructure currently hindering
good supply of water to communities. The main sources of water are boreholes, which are not completely
sustainable as some even dry out over time. Most of the equipment for the boreholes has now aged and
therefore break easily. The aquifers are affected when boreholes are over-pumped and not given a
chance to rest.
Where there are water challenges and breakdowns, water is supplied with water tankers. The water
quality in the municipality has not attained blue drop status.
The district should strive for the attainment of the status.
3.26. PROVISION OF FREE BASIC WATER
The municipality, together with the district municipality, provides free basic water and free water to its
households in the form of supply of free diesel and payment of electricity bills to ESKOM for the supply
of electricity connections to boreholes. The challenge is in areas where there is no infrastructure or where
there are service breakdowns that the free basic service is not adequately rendered but as contingency
measure water tinkering is used.
3.27. CHALLENGES

51
51
The climate conditions and insufficient underground water sources pose a challenge to the availability
and sustainability of water supply to the municipal area.
There are capacity challenges with regard to shortage of staff e.g. pump operators, water tanker drivers,
plant operators, general foremen and scheme managers, etc. This is further compounded by lack of
resources such as excavators, water tankers, TLBs, crane truck, etc. Insufficient allocation of the budget
for the operations and maintenance of the water infrastructure by CDM does not do the area any good to
fulfill its Constitutional mandate of providing the basic supply of water.
Other human factors also pose a challenge to the sustainability of providing the service to the community.
Such includes theft of diesel engines, electrical cables, transformers and electric motors. Vandalism of
Water infrastructure and Illegal connections on the main water supply pipelines (rising mains) is also a
challenge. Unfinished projects (Limited scope of work due to budget constraints) are other human factors
that deny communities access to adequate potable water supply.

52
52
3.28. INTERVENTIONS
The WSA has to allocate sufficient funds to enable the WSP to perform proper maintenance on the water
infrastructure, to attend to breakdowns within a reasonable turnaround time and thereby provide
adequate water to communities. Further on, resources and personnel responsible for operations and
maintenance must also be increased.
Improved cost recovery strategies have to be in place in order to sustain provision of water and/or water
supply to communities.
There is a need to augment water supply from other sources such as the Glen-Alpine Dam. The WSA
has indicated that there are positive prospects of securing supply from the Glen-Alpine Dam as feasibility
study was done by the Department of Water Affairs (DWA), also aiming at securing a license transfer
from agricultural to domestic use for the source. The bulk capacity at areas already supplied to RDP
standard will be increased should the project be successful. Another source of supply is the Glenfirness
(Blouberg) Dam, which already has infrastructure that needs to be upgraded as it has now aged. The
Glenfirness (Blouberg) Dam previously supplied water to a reasonable portion of the Blouberg municipal
area. Refurbishment and/ or replacement of such old infrastructure can augment supply to communities.
There is a need for the enforcement of service level agreements (contracts) that CDM has with its service
providers for the implementation of water projects in order to ensure successful completion of the
projects.
The municipality should endeavor to comply with the green drop standard.
The water catchment facilities should be constructed in almost all areas where there are mountains as
lot of water is being wasted. The resuscitation of existing catchment areas should be prioritized taking
into account that programmes such as Community Works Program me and EPWP staff be used
alongside municipal officials and available equipment. This will be in line with the municipal vision of
turning prevailing challenges into opportunities for growth and development…as the benefits will be two
fold. The first benefit is that unguided and destructive surface run-off will be contained and the second
benefit is that the contained water in the catchment areas will be put into good use for both agricultural
and tourism beneficiation and the boost to the local community will be immense.

53
53
The separate drinking facilities should be constructed solely for animal drinking to curb the practice of
people sharing water with animals. The Department of Agriculture should be roped in to play a meaningful
role in this regard.
3.29. SANITATION
3.30. STATUS QUO
Sanitation provision is the function of the district municipality and the annual provision is made in the
budget. There is a huge backlog in the provision of the service in Blouberg Municipality mainly because
of budgetary constraints. About 65 percent of the population in Blouberg is without access to proper
sanitation facilities. There are two types of the sanitation services provided to the communities in the
Municipality namely; dry sanitation (VIP toilets) and the waterborne sewerage. The VIP toilets are
provided in the rural communities and sewerage services provided in the towns such as Senwabarwana
and Alldays; and will soon be provided in the new settlement at Tolwe.
VIP Toilets projects have been previously completed in sixty-six (66) settlements within the Municipality.
3.31. CHALLENGES
The current percentage of the backlog for sanitation is high. There are budgetary constraints with regard
to the provision of the service to cover the whole municipal area. There is always a challenge of water
borne disease outbreak particularly in areas where the water table is high.
The other challenge is with regard to substandard VIP structures constructed that are not lined from
underground. Most of the previously constructed VIP toilet units have full pits, but cannot be emptied due
to lack of resources.
There is also shortage of maintenance personnel for sewer treatment works/ waterborne sewer (1 x
Sewerage maintenance camp at Helen Franz responsible for Senwabarwana and Alldays)

54
54
3.32. INTERVENTIONS
The district municipality has increased the sanitation budget for 2015\16 financial years. The Municipality
has resolved to prioritize the service for the areas with high water table such as Ga – Mamadi (Taaibosch),
Eldorado, Innes and Slaaphoek, as well as fast developing areas such as Witten. Furthermore, provision
has been planned for new settlements such as Tolwe whose general plan is to be approved by the office
of the Surveyor-General. There is also provision from the Department of Human Settlements for rural
areas VIP toilets. A major challenge is the growing settlements that put huge demand of the service.
There has been an intervention from the Department of Human Settlements to assist the Municipality
with the eradication of sanitation backlog by initiating a Rural Household Sanitation program me,
Other forms of intervention in the provision of sanitation is the provision of low cost housing by CoGHSTA
and such provision is accompanied by the inclusion of VIP toilets.
4. ENVIRONMENTAL ANALYSIS
4.1 STATUS QUO
The municipality has a rich availability of flora and fauna which needs to be preserved for current and
future generations. Further, the municipality has a rich cultural and historical background linked to its
natural resources. The Blouberg Mountains and the Makgabeng mountains, as well as the Mogalakwena
River contain such abundance. This is augmented by the existence of wetlands at Senwabarwana,
Gemarke (Bo Birwa) and Tlhonasedimong.
4.1.1 SOIL AND GEOLOGY
The Environmental Potential Atlas of Southern Africa (ENPAT) classifies soil types in terms of their
agricultural potential. In the municipality there are three types of soils and they differ with regard to their
agricultural potential.

55
55
1. High Potential Soils- These types of soil is suitable for agricultural development and it is found in
the areas along Blouberg mountains and Mogalakwena river. It is good for crop farming and
livestock grazing.
2. Moderate Potential Soils-The soils are moderate and often used for subsistence farming and are
found in the southern and eastern part of the municipality
3. Low Potential Soils-The soil is not suitable for agricultural development because they have very
low clay content and they are widespread in the north- eastern and southern parts of the
municipality
4.2. CHALLENGES
However, poverty levels, as well as lack of knowledge on environmental preservation have rendered the
area prone to many environmental challenges. This is because most people rely on natural resources
such as wood, soil, plant and animal life for their survival.
Alien Plant and Animals
There is a prevalence of alien plant in most of the areas of the municipality. The most affected areas are
found in the ward 20,05,06, 16, and 13.
The prevalence is coupled with the increase in the alien animals in the form of donkeys. These animals
destroy the vegetation where ever they exist.
▪ Deforestation-
The problem is prevalent to the rest of rural areas of Blouberg and has done extensive damage at areas
such as Taaibosch, Makgabeng, My-Darling.
▪ Land degradation
Storm water flowing from the mountain ranges cause a lot of severe soil degradation in areas such as
Ga-Kgatla, Leipzig, Inveraan, Buffelshoek, Stoking, Mokwena, Burgerught, etc. this is further
compounded by illegal sand mining which accelerate soil erosion.

56
56
▪ Overgrazing and drought
The area is reliant on stock farming and most of the grazing areas are overstocked leading to overgrazing
and the resultant drought which comes every two years. One can safely say given poor rainfall patterns
and excessive heat the all the Blouberg area can be classified as a dry area. Overgrazing is also caused
by insufficient grazing camps and lack of adequate control over livestock.
▪ Illegal poaching of wild animals
The problem is prevalent to the three nature reserves such as Lang Jan, Malebogo and Blouberg nature
reserve and this has a devastating effect on the fauna of such ecosystems. Other areas affected by illegal
poaching are private game reserves and farms especially along the Mogalakwena River.
4.3. INTERVENTIONS
The municipality embarks on environmental campaigns to educate communities about issues of climate
change, its adaptation and mitigation programmes. A programme on tree planting is done with
stakeholders such as Venetia mine, DWA and private donors.
Another intervention practice is the availability of a by-law to deal with sand mining.
LEDET, through its environment wing enforces arrests to people found engaging in illegal poaching.
5. SOCIAL ANALYSIS
5.1 HEALTH SERVICES
5.1.1 STATUS QUO
There are 25 clinics, with inclusion of Rosenkrantz and Ngwanallela clinics from former Aganang Local
Municipality, two health centres and one hospital. Of the 25 clinics 22 not a single clinic operates for 24
hours. There is high number of people with chronic diseases in the municipality and the HIV/AIDS
infection rate is also average. For the quarter ending December 2015 all the clinics including Helen Franz
hospital the total number that tested positive was 577 with the highest number recorded by Helen Franz
hospital and Alldays clinic having 44 followed by Seakamela clinic with 53.

57
57
The lowest number recorded was Alldays mobile with zero followed by Sadu and Goedetrou with 02.
There are 42 drop in centres in the Municipality with most of them not funded. The administration of the
ARV drugs is now done in all the health facilities. Helen Franz is the only hospital in the municipality
while Ratšhaatšhaa and Blouberg are health centres. There is a backlog of about seven clinics and one
hospital in the municipality as there are some wards with no clinic.
6,9%
0%
3.20%
2.20%
5.10%
0.61%
1.90%
4.90%6.10%
8.80%
8.10%8.30%
1.20%
4.10%
1.20%1.90%
2.10%
5.50%
0.60%
1.80%
5.30%
0.60%
1.80%
5.30%4.90%4.70%
1.60% 1.50%
00.010.020.030.040.050.060.070.080.09
0.1
5.1.2 HIV INFECTION STATUS.
HIV PREVALENCE RATE IN PERCENTAGEOCT-MAR 2017
5.1.3 NORMS AND STANDARD
The walking distance for one person to walk to the nearest health facility should be five kilometers.
In case the radius is outside the area mobile clinic services is provided. All the clinics in the municipality
provide the ARVs to the patients.
5.2.4 CHALLENGES

58
58
There is a shortage of medical doctors and assistant nurses and nurses in most clinics and Helen Franz
Hospital. People still have to travel long distances looking for the ARV drugs.
The ambulances response time to calls leaves much to be desired. There is shortage of ambulance
vehicles.
There is also shortage of standard clinics in the farming areas of Tolwe, Baltimore, Maastroom and
Swaartwater.
The roads infrastructure leading to most of the clinics are very bad.
Patients have to wait for a long time to be attended by the doctors.
There is shortage of transport in the afternoons travelling to the hospital.
People still pay lot of money for the transport to Helen Franz hospital.
There is shortage of six clinics in the municipality at Tolwe, Milbank, Senwabarwana, Mamoleka and
Dilaeneng village.
5.2.3 INTERVENTIONS
The submissions for the construction of the clinics at Tolwe, Milbank, Puraspan, Senwabarwana and
Mamoleka have been forwarded to the MEC’s office (Health Department).
Burgerugh and Schoongezight clinics have been upgraded by the Department of Health while a new
clinic is planned for construction at Puraspan.
The local HIV-AIDS Council has been established and will go a long way in preventing and managing the
scourge of the AIDS epidemic.
5.2 HOUSING
5.2.1 STATUS QUO

59
59
Since 2000 there has been an allocation of over 6000 low cost housing units to communities of Blouberg
with Alldays and Senwabarwana being the biggest beneficiaries of such housing development
programmes. The municipality, together with CoGHSTA, implemented the first inclusionary housing
project in Senwabarwana in 2009\10. There is still a backlog of over 2000 housing units and the provision
of social housing units, as well as community rental units in areas such as Senwabarwana and Alldays.
Blouberg has a housing chapter in place. The department allocated 600 housing units for the 2016/2017
financial year and allocation was done in all the 22 wards. There is still a challenge of incomplete RDP
structures in some wards. For the financial year under review Tolwe was allocated only 50 housing units
and they are under construction.
5.2.2 CHALLENGES
Poor workmanship, the non-completion of low cost housing units and the non-payment of local suppliers
and labourers are some of the challenges that are associated with the provision of low cost houses to
Blouberg communities. Some incomplete houses date as far as the financial year 2000 and very few of
such have been completed through the rectification programme. Affected wards include wards 1, 2, 8
and 17.
Another challenge for the provision of housing units is the lack of strategically located land in areas such
as Alldays, plus delays in the finalisation of environmental authorization processes. There are still pockets
of incomplete housing units in some wards.
5.2.3 INTERVENTIONS
The provincial Department of Co-Operative Governance, Human Settlements and Traditional Affairs
annually provide an allocation of housing units to cater for needy qualifying citizens. A smaller fraction is
allocated for emergency housing. Consumer education programmes are being conducted to ensure that
beneficiaries of low cost housing get value for the houses built for them. The CDM also provides tents as
temporary relief for disaster stricken families whose houses have been demolished by disasters. The
municipality, in partnership with the private sector and NGOs such as AMAHA, does provide emergency
housing units to the destitute as was done recently at Avon, Buffelshoek and Werden.

60
60
Acquisition of strategically located land is a pre-requisite for the provision of different typologies of
housing and the Department of Rural Development and Land Reform and the National Housing
Development Agency have been requested to assist in this regard.
5.3 EDUCATION
5.3.1 STATUS QUO
There are 186 primaries and 84 secondary schools in the Blouberg area. The circuit offices are six and
currently the district office which is under construction in Senwabarwana has been abandoned by the
contractor and the department is doing nothing about the matter. There is one institution of higher learning
which is the Senwabarwana campus of the Capricorn FET College. The detailed condition of the schools
is in ward analysis. There is shortage of Maths and Science educators in the schools within the
municipality. Some learners are walking more than five kilometres to schools while in some cases
learners have been granted scholar transport and bicycles
There are only 5ave makeshift pre-schools structures. There are a total of 131 registered ECD centers
of which 45 are standard structures and there is a backlog of 83 centers
5.3.2. LEARNERS ENROLMENT
5.3.3. EDUCATION LEVEL
EDUCATION MALE FEMALE TOTAL

61
61
NO SCHOOLING 836 1200 2036
SOME PRIMARY 1214 1028 2241
COMPLETED PRIMARY 692 751 1443
SOME SECONDARY 7636 9077 16713
GRADE 12 3286 4793 8079
HIGHER EDUCATION 618 960 1578
5.3.4. NORMS AND STANDARDS
The teacher learner ratio according to the departmental norms and standards is 1: 40 for the primary
schools and 1: 35 for the secondary schools.
The total walking distance to and from the school is 10 kilometers.
The learners who reside outside the determined radius are provided with scholar transport and bicycles.
Every learner has access to minimum set of textbooks.
5.3.5. PRESCHOOLS
WARD AVAILABLE BACKLOG 1 2 9
2 2 5 3 2 4 4 4 4
5 4 4 6 4 2
7 1 5 8 1 6 9 1 5
10 1 1 11 0 6 12 0 2

62
62
5.3.6. CHALLENGES
The major challenge is the distance travelled by the learners to and fro the schools in the area, as well
as the conditions of school infrastructure as most of the schools were constructed by communities during
the apartheid era. There is also a shortage of Maths and Science educators. There are storm damaged
schools in the municipality and some have been fixed while others are not.
There is shortage of classrooms, learning material and furniture in some schools. There is also a
challenge of overcrowding in some schools. There are few registered ECD centers in the municipality
and lots of them are operating in the substandard structures. The funding for the ECD centers is a
challenge as the communities are responsible for the funding and remuneration of careers.
Some areas require the building of schools. The old dilapidated structures like Matsuokwane, Mphengwa,
Letswatla primary, Rasekhuta, Kgalushi and Makangwane schools require new structures. Selowe
Primary in Silvermyn is complete. Some schools have been blown away by the storms.
The scholar transport remains a challenge for some learners resulting in them walking for long distances
to schools. There is a challenge of high drop out of school in some areas. There is also higher failure rate
in some schools. There is a challenge of teenage pregnancy in schools.
5.3.7 INTERVENTIONS
13 3 4 14 2 5 15 2 0
16 2 3 17 3 6
18 2 0 19 3 0 20 4 4
21 3 5 22 2 3 TOTAL 43 75

63
63
There is provision of scholar transport and provision of bicycles to transport learners who travel long
distances to schools. Further, the provincial government provides school nutrition to all schools. The
Department of Education construct schools annually through the backlog still remains. New schools must
be prioritized for Silvermyn primary school, Senwabarwana secondary school, and Taaibosch primary
school while renovation of schools should prioritize Seiphi, Mochemi and Mokumuru. The municipality
will engage the Department of Education to affect the desired intervention. The construction of new
structures at Montz secondary and Matthews Phosa secondary school in Senwabarwana is almost
complete.
The municipality constructed four preschools in the 2014\15 financial year while six preschools are under
construction in the 2015\16 financial year. Of the six preschools under construction four are funded by
the Municipal Infrastructure Grant while two are funded from municipal generated revenue. De Beers
Consolidated Mines contributed two preschools at Siaz and Grootpan through the implementation of its
Social and Labour Plan.
The following are interventions for bettering provision of education:
Building of additional classrooms and new schools
Training of educators in content and methodology.
Conducting of winter enrichment classes

64
64
1.4 ANNUAL TABLES
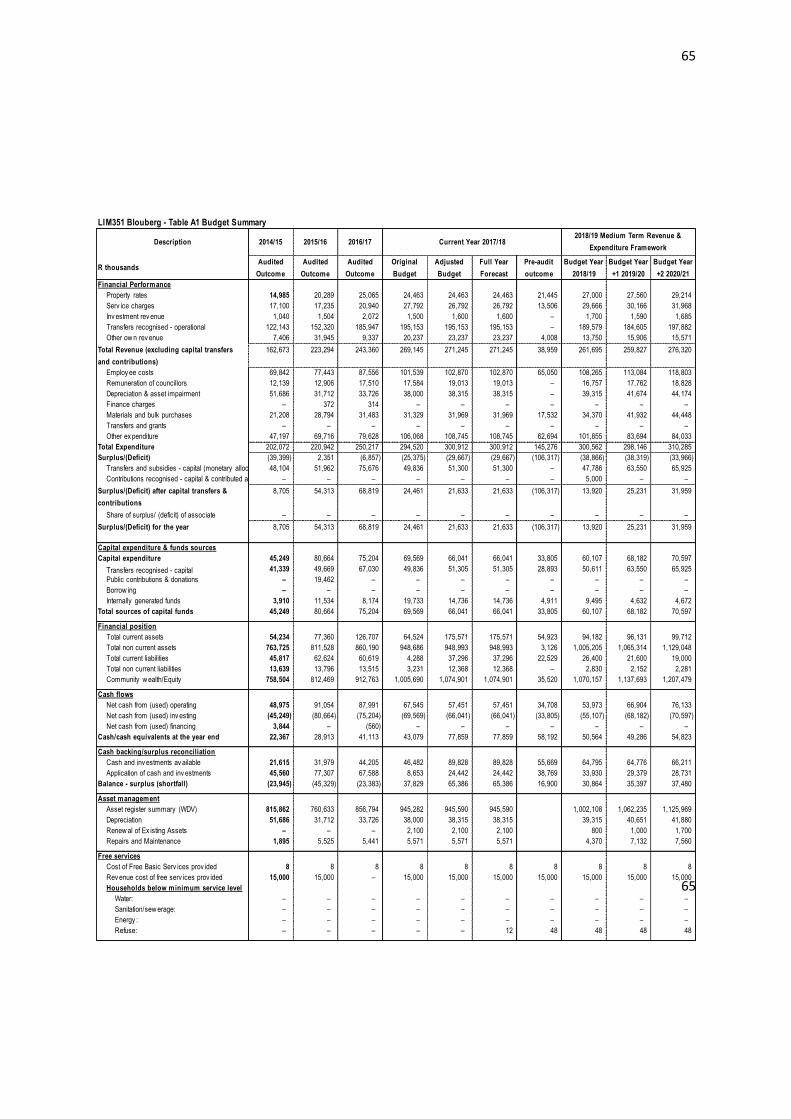
65
65
Description 2014/15 2015/16 2016/17
R thousandsAudited
Outcome
Audited
Outcome
Audited
Outcome
Original
Budget
Adjusted
Budget
Full Year
Forecast
Pre-audit
outcome
Budget Year
2018/19
Budget Year
+1 2019/20
Budget Year
+2 2020/21
Financial Performance
Property rates 14,985 20,289 25,065 24,463 24,463 24,463 21,445 27,000 27,560 29,214
Serv ice charges 17,100 17,235 20,940 27,792 26,792 26,792 13,506 29,666 30,166 31,968
Inv estment rev enue 1,040 1,504 2,072 1,500 1,600 1,600 – 1,700 1,590 1,685
Transfers recognised - operational 122,143 152,320 185,947 195,153 195,153 195,153 – 189,579 184,605 197,882
Other ow n rev enue 7,406 31,945 9,337 20,237 23,237 23,237 4,008 13,750 15,906 15,571
Total Revenue (excluding capital transfers
and contributions)
162,673 223,294 243,360 269,145 271,245 271,245 38,959 261,695 259,827 276,320
Employ ee costs 69,842 77,443 87,556 101,539 102,870 102,870 65,050 108,265 113,084 118,803
Remuneration of councillors 12,139 12,906 17,510 17,584 19,013 19,013 – 16,757 17,762 18,828
Depreciation & asset impairment 51,686 31,712 33,726 38,000 38,315 38,315 – 39,315 41,674 44,174
Finance charges – 372 314 – – – – – – –
Materials and bulk purchases 21,208 28,794 31,483 31,329 31,969 31,969 17,532 34,370 41,932 44,448
Transfers and grants – – – – – – – – – –
Other ex penditure 47,197 69,716 79,628 106,068 108,745 108,745 62,694 101,855 83,694 84,033
Total Expenditure 202,072 220,942 250,217 294,520 300,912 300,912 145,276 300,562 298,146 310,285
Surplus/(Deficit) (39,399) 2,351 (6,857) (25,375) (29,667) (29,667) (106,317) (38,866) (38,319) (33,966)
Transfers and subsidies - capital (monetary allocations) (National / Prov incial and District)48,104 51,962 75,676 49,836 51,300 51,300 – 47,786 63,550 65,925
Contributions recognised - capital & contributed assets – – – – – – – 5,000 – –
Surplus/(Deficit) after capital transfers &
contributions
8,705 54,313 68,819 24,461 21,633 21,633 (106,317) 13,920 25,231 31,959
Share of surplus/ (deficit) of associate – – – – – – – – – –
Surplus/(Deficit) for the year 8,705 54,313 68,819 24,461 21,633 21,633 (106,317) 13,920 25,231 31,959
Capital expenditure & funds sources
Capital expenditure 45,249 80,664 75,204 69,569 66,041 66,041 33,805 60,107 68,182 70,597
Transfers recognised - capital 41,339 49,669 67,030 49,836 51,305 51,305 28,893 50,611 63,550 65,925
Public contributions & donations – 19,462 – – – – – – – –
Borrow ing – – – – – – – – – –
Internally generated funds 3,910 11,534 8,174 19,733 14,736 14,736 4,911 9,495 4,632 4,672
Total sources of capital funds 45,249 80,664 75,204 69,569 66,041 66,041 33,805 60,107 68,182 70,597
Financial position
Total current assets 54,234 77,360 126,707 64,524 175,571 175,571 54,923 94,182 96,131 99,712
Total non current assets 763,725 811,528 860,190 948,686 948,993 948,993 3,126 1,005,205 1,065,314 1,129,048
Total current liabilities 45,817 62,624 60,619 4,288 37,296 37,296 22,529 26,400 21,600 19,000
Total non current liabilities 13,639 13,796 13,515 3,231 12,368 12,368 – 2,830 2,152 2,281
Community w ealth/Equity 758,504 812,469 912,763 1,005,690 1,074,901 1,074,901 35,520 1,070,157 1,137,693 1,207,479
Cash flows
Net cash from (used) operating 48,975 91,054 87,991 67,545 57,451 57,451 34,708 53,973 66,904 76,133
Net cash from (used) inv esting (45,249) (80,664) (75,204) (69,569) (66,041) (66,041) (33,805) (55,107) (68,182) (70,597)
Net cash from (used) financing 3,844 – (560) – – – – – – –
Cash/cash equivalents at the year end 22,367 28,913 41,113 43,079 77,859 77,859 58,192 50,564 49,286 54,823
Cash backing/surplus reconciliation
Cash and inv estments av ailable 21,615 31,979 44,205 46,482 89,828 89,828 55,669 64,795 64,776 66,211
Application of cash and inv estments 45,560 77,307 67,588 8,653 24,442 24,442 38,769 33,930 29,379 28,731
Balance - surplus (shortfall) (23,945) (45,329) (23,383) 37,829 65,386 65,386 16,900 30,864 35,397 37,480
Asset management
Asset register summary (WDV) 815,862 760,633 856,794 945,282 945,590 945,590 1,002,108 1,062,235 1,125,969
Depreciation 51,686 31,712 33,726 38,000 38,315 38,315 39,315 40,651 41,880
Renew al of Ex isting Assets – – – 2,100 2,100 2,100 800 1,000 1,700
Repairs and Maintenance 1,895 5,525 5,441 5,571 5,571 5,571 4,370 7,132 7,560
Free services
Cost of Free Basic Serv ices prov ided 8 8 8 8 8 8 8 8 8 8
Rev enue cost of free serv ices prov ided 15,000 15,000 – 15,000 15,000 15,000 15,000 15,000 15,000 15,000
Households below minimum service level
Water: – – – – – – – – – –
Sanitation/sew erage: – – – – – – – – – –
Energy : – – – – – – – – – –
Refuse: – – – – – 12 48 48 48 48
2018/19 Medium Term Revenue &
Expenditure FrameworkCurrent Year 2017/18
LIM351 Blouberg - Table A1 Budget Summary

66
66
Table-A2 Budget Financial Perfomance( Revenue and Expenditure by Standard Class)
LIM351 Blouberg - Table A2 Budgeted Financial Performance (revenue and expenditure by functional classification)
Functional Classification Description Ref 2014/15 2015/16 2016/17
R thousand 1Audited
Outcome
Audited
Outcome
Audited
Outcome
Original
Budget
Adjusted
Budget
Full Year
Forecast
Budget Year
2018/19
Budget Year
+1 2019/20
Budget Year
+2 2020/21
Revenue - Functional
Governance and administration 136,957 193,617 212,172 223,580 223,985 223,985 216,608 216,709 231,909
Ex ecutiv e and council – – 19,272 20,098 20,098 20,098 13,881 – –
Finance and administration 136,957 193,617 192,900 203,482 203,887 203,887 202,727 216,709 231,909
Internal audit – – – – – – – – –
Community and public safety 7,157 6,225 9,606 10,531 13,131 13,131 11,854 7,443 7,890
Community and social serv ices 2,335 1,955 4,891 6,112 6,112 6,112 4,504 – –
Sport and recreation – – – – – – – – –
Public safety 4,822 4,270 4,716 4,419 7,019 7,019 7,350 7,443 7,890
Housing – – – – – – – – –
Health – – – – – – – – –
Economic and environmental services 44,491 49,495 67,074 49,770 51,335 51,335 46,896 49,772 51,211
Planning and dev elopment 1,004 4,592 397 4,680 4,780 4,780 3,405 5,422 4,486
Road transport 43,487 44,903 66,676 45,090 46,555 46,555 43,491 44,350 46,725
Env ironmental protection – – – – – – – – –
Trading services 22,172 25,942 30,184 35,100 34,095 34,095 39,124 49,452 51,234
Energy sources 21,621 25,404 29,710 33,220 33,220 33,220 38,064 48,612 50,352
Water management – – – – – – – – –
Waste w ater management – – – – – – – – –
Waste management 551 538 474 1,880 875 875 1,060 840 882
Other 4 – – – – – – – – –
Total Revenue - Functional 2 210,777 275,278 319,036 318,981 322,545 322,545 314,481 323,377 342,245
Expenditure - Functional
Governance and administration 84,655 134,861 162,661 198,300 205,314 205,314 201,231 200,129 201,063
Ex ecutiv e and council 34,910 38,301 62,802 74,141 74,787 74,787 68,304 59,530 57,056
Finance and administration 49,746 96,561 99,859 124,159 130,527 130,527 132,927 140,599 144,007
Internal audit – – – – – – – – –
Community and public safety 22,434 26,617 31,325 34,186 33,142 33,142 33,811 29,753 31,535
Community and social serv ices 12,697 16,241 19,547 20,047 19,688 19,688 19,174 14,238 15,089
Sport and recreation – – – – – – – – –
Public safety 9,736 10,376 11,778 14,139 13,454 13,454 14,637 15,516 16,446
Housing – – – – – – – – –
Health – – – – – – – – –
Economic and environmental services 17,081 26,268 19,949 21,117 21,147 21,147 19,604 20,433 23,779
Planning and dev elopment 8,495 14,530 8,028 11,967 10,857 10,857 11,228 11,796 12,503
Road transport 8,586 11,738 11,921 9,150 10,290 10,290 8,377 8,637 11,275
Env ironmental protection – – – – – – – – –
Trading services 77,903 33,563 36,276 40,940 41,332 41,332 45,915 47,832 53,908
Energy sources 77,859 32,545 36,198 39,890 40,300 40,300 43,955 45,468 51,402
Water management – – – – – – – – –
Waste w ater management – – – – – – – – –
Waste management 43 1,018 77 1,050 1,032 1,032 1,960 2,364 2,506
Other 4 – – – – – – – – –
Total Expenditure - Functional 3 202,072 221,309 250,210 294,542 300,934 300,934 300,562 298,146 310,285
Surplus/(Deficit) for the year 8,705 53,970 68,827 24,439 21,611 21,611 13,920 25,231 31,959
Current Year 2017/182018/19 Medium Term Revenue &
Expenditure Framework

67
67
Table A3 Budget Financial Performance (Revenue and expenditure by municipal votes
LIM351 Blouberg - Table A3 Budgeted Financial Performance (revenue and expenditure by municipal vote)
Vote Description Ref 2014/15 2015/16 2016/17
R thousandAudited
Outcome
Audited
Outcome
Audited
Outcome
Original
Budget
Adjusted
Budget
Full Year
Forecast
Budget Year
2018/19
Budget Year
+1 2019/20
Budget Year
+2 2020/21
Revenue by Vote 1
Vote 1 - Ex ecutiv e and council – – 19,272 20,098 20,098 20,098 13,881 – –
Vote 2 - Finance and Administration 136,957 193,617 192,900 203,512 203,917 203,917 202,727 216,709 231,909
Vote 3 - Community Serv ices 2,335 1,955 4,891 6,112 6,112 6,112 4,504 – –
Vote 4 - Public and Safety 4,822 4,270 4,716 4,419 7,019 7,019 7,350 7,443 7,890
Vote 5 - Waste Management 551 538 474 1,880 875 875 1,060 840 882
Vote 6 - Technical administration and Trading serv ices 21,621 25,404 29,710 33,220 33,220 33,220 38,064 48,612 50,352
Vote 7 - Roads and Transport 43,487 44,903 66,676 45,090 46,555 46,555 43,491 44,350 46,725
Vote 8 - Planning and Dev elopment 1,004 4,592 397 4,650 4,750 4,750 3,405 5,422 4,486
Vote 9 - [NAME OF VOTE 9] – – – – – – – – –
Vote 10 - [NAME OF VOTE 10] – – – – – – – – –
Vote 11 - [NAME OF VOTE 11] – – – – – – – – –
Vote 12 - [NAME OF VOTE 12] – – – – – – – – –
Vote 13 - [NAME OF VOTE 13] – – – – – – – – –
Vote 14 - [NAME OF VOTE 14] – – – – – – – – –
Vote 15 - [NAME OF VOTE 15] – – – – – – – – –
Total Revenue by Vote 2 210,777 275,278 319,036 318,981 322,545 322,545 314,481 323,377 342,245
Expenditure by Vote to be appropriated 1
Vote 1 - Ex ecutiv e and council 34,910 38,301 62,802 74,141 74,787 74,787 68,304 59,530 57,056
Vote 2 - Finance and Administration 49,746 96,561 99,859 124,159 130,527 130,527 132,927 140,599 144,007
Vote 3 - Community Serv ices 12,697 16,241 19,547 20,047 19,688 19,688 19,174 14,238 15,089
Vote 4 - Public and Safety 9,736 10,376 11,778 14,139 13,454 13,454 14,637 15,516 16,446
Vote 5 - Waste Management 43 1,018 77 1,050 1,032 1,032 1,960 2,364 2,506
Vote 6 - Technical administration and Trading serv ices 77,859 32,545 36,198 39,890 40,300 40,300 43,955 45,468 51,402
Vote 7 - Roads and Transport 8,586 11,738 11,921 9,150 10,290 10,290 8,377 8,637 11,275
Vote 8 - Planning and Dev elopment 8,495 14,530 8,028 11,967 10,857 10,857 11,228 11,796 12,503
Vote 9 - [NAME OF VOTE 9] – – – – – – – – –
Vote 10 - [NAME OF VOTE 10] – – – – – – – – –
Vote 11 - [NAME OF VOTE 11] – – – – – – – – –
Vote 12 - [NAME OF VOTE 12] – – – – – – – – –
Vote 13 - [NAME OF VOTE 13] – – – – – – – – –
Vote 14 - [NAME OF VOTE 14] – – – – – – – – –
Vote 15 - [NAME OF VOTE 15] – – – – – – – – –
Total Expenditure by Vote 2 202,072 221,309 250,210 294,542 300,934 300,934 300,562 298,146 310,285
Surplus/(Deficit) for the year 2 8,705 53,970 68,827 24,439 21,611 21,611 13,920 25,231 31,959
Current Year 2017/182018/19 Medium Term Revenue &
Expenditure Framework

68
68
LIM351 Blouberg - Table A4 Budgeted Financial Performance (revenue and expenditure)
Description Ref 2014/15 2015/16 2016/17
R thousand 1Audited
Outcome
Audited
Outcome
Audited
Outcome
Original
Budget
Adjusted
Budget
Full Year
Forecast
Pre-audit
outcome
Budget Year
2018/19
Budget Year
+1 2019/20
Budget Year
+2 2020/21
Revenue By Source
Property rates 2 14,985 20,289 25,065 24,463 24,463 24,463 21,445 27,000 27,560 29,214
Serv ice charges - electricity rev enue 2 16,767 16,817 20,534 26,000 26,000 26,000 13,231 28,666 29,326 31,086
Serv ice charges - w ater rev enue 2 – – – – – – – – – –
Serv ice charges - sanitation rev enue 2 – – – – – – – – – –
Serv ice charges - refuse rev enue 2 333 418 406 1,792 792 792 275 1,000 840 882
Serv ice charges - other – – – – – – – – – –
Rental of facilities and equipment 820 1,091 1,046 300 300 300 – 315 350 371
Interest earned - ex ternal inv estments 1,040 1,504 2,072 1,500 1,600 1,600 – 1,700 1,590 1,685
Interest earned - outstanding debtors 388 306 1,961 595 595 595 – 631 654 693
Div idends receiv ed – – – – – – – –
Fines, penalties and forfeits 2,593 1,086 1,273 780 3,380 3,380 – 3,440 3,614 3,809
Licences and permits 2,161 3,162 3,489 3,669 3,669 3,669 – 4,000 3,892 4,126
Agency serv ices – 230 – 1,091 1,091 1,091 – 150 160 170
Transfers and subsidies 122,143 152,320 185,947 195,153 195,153 195,153 – 189,579 184,605 197,882
Other rev enue 2 1,443 26,093 1,567 13,803 14,203 14,203 4,008 5,214 7,235 6,402
Gains on disposal of PPE – – – – – – – – – –
Total Revenue (excluding capital transfers
and contributions)
162,673 223,317 243,360 269,145 271,245 271,245 38,959 261,695 259,827 276,320
Expenditure By Type
Employ ee related costs 2 69,842 77,443 87,556 101,539 102,870 102,870 65,050 108,265 113,084 118,803
Remuneration of councillors 12,139 12,906 17,510 17,584 19,013 19,013 16,757 17,762 18,828
Debt impairment 3 3,856 10,831 (3,067) 8,074 8,074 8,074 7,559 8,012 8,413
Depreciation & asset impairment 2 51,686 31,712 33,726 38,000 38,315 38,315 – 39,315 41,674 44,174
Finance charges – 372 314 – – – – – – –
Bulk purchases 2 19,313 23,268 26,042 25,758 25,758 25,758 17,532 30,000 34,800 36,888
Other materials 8 1,895 5,525 5,441 5,571 6,211 6,211 4,370 7,132 7,560
Contracted serv ices 3,160 3,582 5,923 12,000 11,500 11,500 6,713 12,705 15,467 14,954
Transfers and subsidies – – – – – – – – – –
Other ex penditure 4, 5 39,918 55,151 76,764 86,016 89,193 89,193 55,981 81,592 60,215 60,666
Loss on disposal of PPE 262 518 – – – – – – – –
Total Expenditure 202,072 221,309 250,210 294,542 300,934 300,934 145,276 300,562 298,146 310,285
Surplus/(Deficit) (39,399) 2,008 (6,850) (25,397) (29,689) (29,689) (106,317) (38,866) (38,319) (33,966)
Transfers and subsidies - capital (monetary
allocations) (National / Prov incial and District) 48,104 51,962 75,676 49,836 51,300 51,300 – 47,786 63,550 65,925
Transfers and subsidies - capital (monetary
allocations) (National / Prov incial Departmental
Agencies, Households, Non-profit Institutions,
Priv ate Enterprises, Public Corporatons, Higher 6 – – – – – – – – – –
Transfers and subsidies - capital (in-kind - all) – – – – – – – 5,000 – –
Surplus/(Deficit) after capital transfers &
contributions
8,705 53,970 68,827 24,439 21,611 21,611 (106,317) 13,920 25,231 31,959
Tax ation – – – – – – – – – –
Surplus/(Deficit) after taxation 8,705 53,970 68,827 24,439 21,611 21,611 (106,317) 13,920 25,231 31,959
Attributable to minorities – – – – – – – – – –
Surplus/(Deficit) attributable to municipality 8,705 53,970 68,827 24,439 21,611 21,611 (106,317) 13,920 25,231 31,959
Share of surplus/ (deficit) of associate 7 – – – – – – – – – –
Surplus/(Deficit) for the year 8,705 53,970 68,827 24,439 21,611 21,611 (106,317) 13,920 25,231 31,959
2018/19 Medium Term Revenue &
Expenditure FrameworkCurrent Year 2017/18

69
69
LIM351 Blouberg - Table A5 Budgeted Capital Expenditure by vote, functional classification and funding
Vote Description Ref 2014/15 2015/16 2016/17
R thousand 1Audited
Outcome
Audited
Outcome
Audited
Outcome
Original
Budget
Adjusted
Budget
Full Year
Forecast
Pre-audit
outcome
Budget Year
2018/19
Budget Year
+1 2019/20
Budget Year
+2 2020/21
Capital expenditure - Vote
Multi-year expenditure to be appropriated 2
Vote 1 - Ex ecutiv e and council – – – – – – – – – –
Vote 2 - Finance and Administration – – – – – – – – – –
Vote 3 - Community Serv ices – – – – – – – – – –
Vote 4 - Public and Safety – – – – – – – – – –
Vote 5 - Waste Management – – – – – – – – – –
Vote 6 - Technical administration and Trading serv ices – – – – – – – – – –
Vote 7 - Roads and Transport – – – – – – – – – –
Vote 8 - Planning and Dev elopment – – – – – – – – – –
Vote 9 - [NAME OF VOTE 9] – – – – – – – – – –
Vote 10 - [NAME OF VOTE 10] – – – – – – – – – –
Vote 11 - [NAME OF VOTE 11] – – – – – – – – – –
Vote 12 - [NAME OF VOTE 12] – – – – – – – – – –
Vote 13 - [NAME OF VOTE 13] – – – – – – – – – –
Vote 14 - [NAME OF VOTE 14] – – – – – – – – – –
Vote 15 - [NAME OF VOTE 15] – – – – – – – – – –
Capital multi-year expenditure sub-total 7 – – – – – – – – – –
Single-year expenditure to be appropriated 2
Vote 1 - Ex ecutiv e and council – – – 300 300 300 – – – –
Vote 2 - Finance and Administration 3,341 4,744 3,687 6,500 6,400 6,400 4,435 3,115 2,332 2,472
Vote 3 - Community Serv ices – 23,866 22,312 20,500 22,364 22,364 – 9,320 25,988 31,179
Vote 4 - Public and Safety – – – – – – – 250 – –
Vote 5 - Waste Management 11 350 – 600 600 600 – 250 – –
Vote 6 - Technical administration and Trading serv ices 7,971 9,317 12,696 9,233 10,642 10,642 – 12,175 20,900 20,300
Vote 7 - Roads and Transport 33,926 42,387 36,304 28,436 25,736 25,736 – 34,996 18,962 16,646
Vote 8 - Planning and Dev elopment – – 205 4,000 – – – – – –
Vote 9 - [NAME OF VOTE 9] – – – – – – – – – –
Vote 10 - [NAME OF VOTE 10] – – – – – – – – – –
Vote 11 - [NAME OF VOTE 11] – – – – – – – – – –
Vote 12 - [NAME OF VOTE 12] – – – – – – – – – –
Vote 13 - [NAME OF VOTE 13] – – – – – – – – – –
Vote 14 - [NAME OF VOTE 14] – – – – – – – – – –
Vote 15 - [NAME OF VOTE 15] – – – – – – – – – –
Capital single-year expenditure sub-total 45,249 80,664 75,204 69,569 66,041 66,041 4,435 60,107 68,182 70,597
Total Capital Expenditure - Vote 45,249 80,664 75,204 69,569 66,041 66,041 4,435 60,107 68,182 70,597
Capital Expenditure - Functional
Governance and administration 3,341 4,744 3,687 6,800 6,700 6,700 4,435 3,115 2,332 2,472
Ex ecutiv e and council 300 300 300 – – –
Finance and administration 3,341 4,744 3,687 6,500 6,400 6,400 4,435 3,115 2,332 2,472
Internal audit
Community and public safety – 23,866 22,312 20,500 22,364 22,364 11,357 9,570 25,988 31,179
Community and social serv ices – 23,866 6,592 12,500 14,364 14,364 7,249 2,500 – –
Sport and recreation – – 15,719 8,000 8,000 8,000 4,107 6,820 25,988 31,179
Public safety – – – – – – – 250 – –
Housing – – – – – – – – – –
Health – – – – – – – – – –
Economic and environmental services 33,926 42,387 36,509 32,436 25,736 25,736 17,020 34,996 18,962 16,646
Planning and dev elopment – – 205 4,000 – – – – – –
Road transport 33,926 42,387 36,304 28,436 25,736 25,736 17,020 34,996 18,962 16,646
Env ironmental protection – – – – – – – – – –
Trading services 7,982 9,667 12,696 9,833 11,242 11,242 993 12,425 20,900 20,300
Energy sources 7,971 9,317 12,696 9,233 10,642 10,642 993 12,175 20,900 20,300
Water management – – – – – – – – – –
Waste w ater management – – – – – – – – – –
Waste management 11 350 600 600 600 – 250 – –
Other – – – – – – – – – –
Total Capital Expenditure - Functional 3 45,249 80,664 75,204 69,569 66,041 66,041 33,805 60,107 68,182 70,597
Funded by:
National Gov ernment 41,339 49,669 67,030 49,836 51,305 51,305 28,893 45,611 63,550 65,925
Prov incial Gov ernment – – – – – – – – – –
District Municipality – – – – – – – – – –
Other transfers and grants – – – – – – – 5,000 – –
Transfers recognised - capital 4 41,339 49,669 67,030 49,836 51,305 51,305 28,893 50,611 63,550 65,925
Public contributions & donations 5 – 19,462 – – – – – – – –
Borrowing 6 – – – – – – – – –
Internally generated funds 3,910 11,534 8,174 19,733 14,736 14,736 4,911 9,495 4,632 4,672
Total Capital Funding 7 45,249 80,664 75,204 69,569 66,041 66,041 33,805 60,107 68,182 70,597
2018/19 Medium Term Revenue &
Expenditure FrameworkCurrent Year 2017/18

70
70
LIM351 Blouberg - Table A6 Budgeted Financial Position
Description Ref 2014/15 2015/16 2016/17
R thousandAudited
Outcome
Audited
Outcome
Audited
Outcome
Original
Budget
Adjusted
Budget
Full Year
Forecast
Pre-audit
outcome
Budget Year
2018/19
Budget Year
+1 2019/20
Budget Year
+2 2020/21
ASSETS
Current assets
Cash 18,523 28,886 41,113 33,079 76,425 76,425 42,017 51,697 51,697 53,132
Call inv estment deposits 1 – – – 10,000 10,000 10,000 10,527 10,000 10,000 10,000
Consumer debtors 1 4,032 4,523 8,258 (493) 7,765 7,765 – 9,231 9,785 10,452
Other debtors 6,181 13,865 12,246 4,426 16,291 16,291 4,692 4,973 5,272
Current portion of long-term receiv ables 18,693 26,225 61,211 15,893 61,211 61,211 16,847 17,858 18,929
Inv entory 2 6,805 3,862 3,879 1,618 3,879 3,879 2,380 1,715 1,818 1,927
Total current assets 54,234 77,360 126,707 64,524 175,571 175,571 54,923 94,182 96,131 99,712
Non current assets
Long-term receiv ables – – – – – – – – – –
Inv estments 3,092 3,093 3,093 3,403 3,403 3,403 3,126 3,097 3,079 3,079
Inv estment property – – 205 – 205 205 – – –
Inv estment in Associate – – – – – – – – – –
Property , plant and equipment 3 760,633 808,306 856,790 945,282 945,282 945,282 – 1,002,108 1,062,235 1,125,969
Agricultural – – – – – – – – – –
Biological – – – – – – – – – –
Intangible – 130 103 – 103 103 – – –
Other non-current assets
Total non current assets 763,725 811,528 860,190 948,686 948,993 948,993 3,126 1,005,205 1,065,314 1,129,048
TOTAL ASSETS 817,959 888,889 986,897 1,013,209 1,124,565 1,124,565 58,049 1,099,387 1,161,445 1,228,760
LIABILITIES
Current liabilities
Bank ov erdraft 1 – – – – – – – – – –
Borrow ing 4 – – – – – – – – – –
Consumer deposits – – – – – – – – – –
Trade and other pay ables 4 40,470 56,080 53,284 4,288 37,296 37,296 22,529 26,400 21,600 19,000
Prov isions 5,346 6,543 7,335 – – – – – – –
Total current liabilities 45,817 62,624 60,619 4,288 37,296 37,296 22,529 26,400 21,600 19,000
Non current liabilities
Borrow ing – – – – – – – – – –
Prov isions 13,639 13,796 13,515 3,231 12,368 12,368 – 2,830 2,152 2,281
Total non current liabilities 13,639 13,796 13,515 3,231 12,368 12,368 – 2,830 2,152 2,281
TOTAL LIABILITIES 59,456 76,420 74,134 7,519 49,664 49,664 22,529 29,230 23,752 21,281
NET ASSETS 5 758,504 812,469 912,763 1,005,690 1,074,901 1,074,901 35,520 1,070,157 1,137,693 1,207,479
COMMUNITY WEALTH/EQUITY
Accumulated Surplus/(Deficit) 758,504 812,469 912,763 1,005,690 1,074,901 1,074,901 35,520 1,070,157 1,137,693 1,207,479
Reserv es 4 – – – – – – – – – –
TOTAL COMMUNITY WEALTH/EQUITY 5 758,504 812,469 912,763 1,005,690 1,074,901 1,074,901 35,520 1,070,157 1,137,693 1,207,479
2018/19 Medium Term Revenue &
Expenditure FrameworkCurrent Year 2017/18

71
71
LIM351 Blouberg - Table A7 Budgeted Cash Flows
Description Ref 2014/15 2015/16 2016/17
R thousandAudited
Outcome
Audited
Outcome
Audited
Outcome
Original
Budget
Adjusted
Budget
Full Year
Forecast
Pre-audit
outcome
Budget Year
2018/19
Budget Year
+1 2019/20
Budget Year
+2 2020/21
CASH FLOW FROM OPERATING ACTIVITIES
Receipts
Property rates 6,985 13,609 24,467 23,020 23,020 23,020 11,772 25,500 27,560 29,214
Serv ice charges 12,782 10,877 15,498 26,800 26,800 26,800 13,397 27,466 30,166 31,968
Other rev enue 6,503 5,906 10,144 12,227 13,927 13,927 7,472 13,120 15,252 14,877
Gov ernment - operating 1 121,360 167,865 178,931 195,153 195,153 195,153 116,665 189,579 184,605 197,882
Gov ernment - capital 1 46,408 71,731 53,381 49,836 51,300 51,300 44,613 47,786 63,550 65,925
Interest 1,228 1,504 2,072 1,500 1,600 1,600 1,121 2,231 2,244 2,379
Div idends – – – – – – – – – –
Payments
Suppliers and employ ees (146,290) (180,066) (196,188) (240,991) (254,349) (254,349) (160,331) (251,708) (248,460) (257,698)
Finance charges – (372) (314) – – – – – (8,012) (8,413)
Transfers and Grants 1 – – – – – – – – – –
NET CASH FROM/(USED) OPERATING ACTIVITIES 48,975 91,054 87,991 67,545 57,451 57,451 34,708 53,973 66,904 76,133
CASH FLOWS FROM INVESTING ACTIVITIES
Receipts
Proceeds on disposal of PPE – – – – – – – 5,000 – –
Decrease (Increase) in non-current debtors – – – – – – – – – –
Decrease (increase) other non-current receiv ables – – – – – – – – – –
Decrease (increase) in non-current inv estments – – – – – – – – – –
Payments
Capital assets (45,249) (80,664) (75,204) (69,569) (66,041) (66,041) (33,805) (60,107) (68,182) (70,597)
NET CASH FROM/(USED) INVESTING ACTIVITIES (45,249) (80,664) (75,204) (69,569) (66,041) (66,041) (33,805) (55,107) (68,182) (70,597)
CASH FLOWS FROM FINANCING ACTIVITIES
Receipts
Short term loans – – – – – – – – – –
Borrow ing long term/refinancing – – – – – – – – – –
Increase (decrease) in consumer deposits 3,844 – – – – – – – – –
Payments
Repay ment of borrow ing – – (560) – – – – – – –
NET CASH FROM/(USED) FINANCING ACTIVITIES 3,844 – (560) – – – – – – –
NET INCREASE/ (DECREASE) IN CASH HELD 7,570 10,389 12,227 (2,024) (8,590) (8,590) 904 (1,133) (1,278) 5,537
Cash/cash equiv alents at the y ear begin: 2 14,797 18,523 28,886 45,103 86,448 86,448 57,288 51,697 50,564 49,286
Cash/cash equiv alents at the y ear end: 2 22,367 28,913 41,113 43,079 77,859 77,859 58,192 50,564 49,286 54,823
2018/19 Medium Term Revenue &
Expenditure FrameworkCurrent Year 2017/18

72
72
LIM351 Blouberg - Table A8 Cash backed reserves/accumulated surplus reconciliation
Description Ref 2014/15 2015/16 2016/17
R thousandAudited
Outcome
Audited
Outcome
Audited
Outcome
Original
Budget
Adjusted
Budget
Full Year
Forecast
Pre-audit
outcome
Budget Year
2018/19
Budget Year
+1 2019/20
Budget Year
+2 2020/21
Cash and investments available
Cash/cash equiv alents at the y ear end 1 22,367 28,913 41,113 43,079 77,859 77,859 58,192 50,564 49,286 54,823
Other current inv estments > 90 day s (3,844) (26) – – 8,566 8,566 (5,648) 11,133 12,411 8,309
Non current assets - Inv estments 1 3,092 3,093 3,093 3,403 3,403 3,403 3,126 3,097 3,079 3,079
Cash and investments available: 21,615 31,979 44,205 46,482 89,828 89,828 55,669 64,795 64,776 66,211
Application of cash and investments
Unspent conditional transfers 9,976 25,828 7,024 1,500 32,869 32,869 22,411 1,400 1,600 1,000
Unspent borrow ing – – – – – – – – –
Statutory requirements 2 6,258 12,202 12,019 2,052 2,052 2,052 10,560 17,767 20,255 23,032
Other w orking capital requirements 3 23,700 22,210 27,695 (579) (16,160) (16,160) 117 11,933 5,373 2,418
Other prov isions 5,625 17,069 20,850 5,680 5,680 5,680 5,680 2,830 2,152 2,281
Long term inv estments committed 4 – – – – – – – – – –
Reserv es to be backed by cash/inv estments 5 – – – – – – – – – –
Total Application of cash and investments: 45,560 77,309 67,588 8,653 24,442 24,442 38,769 33,930 29,379 28,731
Surplus(shortfall) (23,945) (45,331) (23,383) 37,829 65,386 65,386 16,900 30,864 35,397 37,480
2018/19 Medium Term Revenue &
Expenditure FrameworkCurrent Year 2017/18

73
73
Description Ref 2014/15 2015/16 2016/17
R thousandAudited
Outcome
Audited
Outcome
Audited
Outcome
Original
Budget
Adjusted
Budget
Full Year
Forecast
Budget Year
2018/19
Budget Year
+1 2019/20
Budget Year
+2 2020/21
CAPITAL EXPENDITURE
Total New Assets 1 45,249 80,664 75,204 67,469 66,041 66,041 59,307 67,182 68,897
Roads Infrastructure 33,926 42,387 34,404 26,836 26,836 26,836 34,496 20,593 16,215
Storm water Infrastructure – – – – – – – – –
Electrical Infrastructure 7,971 9,317 12,696 8,733 8,673 8,673 12,375 21,030 20,262
Water Supply Infrastructure – – – – – – – – –
Sanitation Infrastructure – – – – – – – – –
Solid Waste Infrastructure – – 6,592 – – – – – –
Rail Infrastructure – – – – – – – – –
Coastal Infrastructure – – – – – – – – –
Information and Communication Infrastructure – – – – – – – – –
Infrastructure 41,897 51,704 53,692 35,569 35,509 35,509 46,871 41,623 36,476
Community Facilities – 6,893 11,267 16,500 10,800 10,800 2,500 358 3,242
Sport and Recreation Facilities – 16,974 5,202 8,000 12,633 12,633 6,820 23,399 27,269
Community Assets – 23,866 16,469 24,500 23,433 23,433 9,320 23,757 30,510
Heritage Assets – – – – – – – – –
Rev enue Generating – – – – – – – – –
Non-rev enue Generating – – 205 – – – – – –
Investment properties – – 205 – – – – – –
Operational Buildings – – – – – – – – –
Housing – – – – – – – – –
Other Assets – – – – – – – – –
Biological or Cultivated Assets – – – – – – – – –
Serv itudes – – – – – – – – –
Licences and Rights – – – 300 300 300 1,555 795 843
Intangible Assets – – – 300 300 300 1,555 795 843
Computer Equipment 241 300 294 300 300 300 250 265 281
Furniture and Office Equipment 100 144 1,077 1,400 1,600 1,600 810 742 787
Machinery and Equipment 211 2,650 1,900 1,400 1,200 1,200 500 – –
Transport Assets 2,800 2,000 1,566 4,000 3,700 3,700 – – –
Land – – – – – – – – –
Zoo's, Marine and Non-biological Animals – – – – – – – – –
Total Renewal of Existing Assets 2 – – – 2,100 2,100 2,100 800 1,000 1,700
Roads Infrastructure – – – 1,600 1,600 1,600 500 600 1,100
Storm water Infrastructure – – – – – – – – –
Electrical Infrastructure – – – 500 500 500 300 400 600
Water Supply Infrastructure – – – – – – – – –
Sanitation Infrastructure – – – – – – – – –
Solid Waste Infrastructure – – – – – – – – –
Rail Infrastructure – – – – – – – – –
Coastal Infrastructure – – – – – – – – –
Information and Communication Infrastructure – – – – – – – – –
Infrastructure – – – 2,100 2,100 2,100 800 1,000 1,700
Current Year 2017/182018/19 Medium Term Revenue &
Expenditure Framework

74
74
Community Facilities – – – – – – – – –
Sport and Recreation Facilities – – – – – – – – –
Community Assets – – – – – – – – –
Heritage Assets – – – – – – – – –
Rev enue Generating – – – – – – – – –
Non-rev enue Generating – – – – – – – – –
Investment properties – – – – – – – – –
Operational Buildings – – – – – – – – –
Housing – – – – – – – – –
Other Assets – – – – – – – – –
Biological or Cultivated Assets – – – – – – – – –
Serv itudes – – – – – – – – –
Licences and Rights – – – – – – – – –
Intangible Assets – – – – – – – – –
Computer Equipment – – – – – – – – –
Furniture and Office Equipment – – – – – – – – –
Machinery and Equipment – – – – – – – – –
Transport Assets – – – – – – – – –
Land – – – – – – – – –
Zoo's, Marine and Non-biological Animals – – – – – – – – –
Total Upgrading of Existing Assets 6 – – – – – – – – –
Roads Infrastructure – – – – – – – – –
Storm water Infrastructure – – – – – – – – –
Electrical Infrastructure – – – – – – – – –
Water Supply Infrastructure – – – – – – – – –
Sanitation Infrastructure – – – – – – – – –
Solid Waste Infrastructure – – – – – – – – –
Rail Infrastructure – – – – – – – – –
Coastal Infrastructure – – – – – – – – –
Information and Communication Infrastructure – – – – – – – – –
Infrastructure – – – – – – – – –
Community Facilities – – – – – – – – –
Sport and Recreation Facilities – – – – – – – – –
Community Assets – – – – – – – – –
Heritage Assets – – – – – – – – –
Rev enue Generating – – – – – – – – –
Non-rev enue Generating – – – – – – – – –
Investment properties – – – – – – – – –
Operational Buildings – – – – – – – – –
Housing – – – – – – – – –
Other Assets – – – – – – – – –
Biological or Cultivated Assets – – – – – – – – –
Serv itudes – – – – – – – – –
Licences and Rights – – – – – – – – –
Intangible Assets – – – – – – – – –
Computer Equipment – – – – – – – – –
Furniture and Office Equipment – – – – – – – – –
Machinery and Equipment – – – – – – – – –
Transport Assets – – – – – – – – –
Land – – – – – – – – –
Zoo's, Marine and Non-biological Animals – – – – – – – – –
Total Capital Expenditure 4
Roads Infrastructure 33,926 42,387 34,404 28,436 28,436 28,436 34,996 21,193 17,315
Storm water Infrastructure – – – – – – – – –
Electrical Infrastructure 7,971 9,317 12,696 9,233 9,173 9,173 12,675 21,430 20,862
Water Supply Infrastructure – – – – – – – – –
Sanitation Infrastructure – – – – – – – – –
Solid Waste Infrastructure – – 6,592 – – – – – –
Rail Infrastructure – – – – – – – – –
Coastal Infrastructure – – – – – – – – –
Information and Communication Infrastructure – – – – – – – – –
Infrastructure 41,897 51,704 53,692 37,669 37,609 37,609 47,671 42,623 38,176
Community Facilities – 6,893 11,267 16,500 10,800 10,800 2,500 358 3,242
Sport and Recreation Facilities – 16,974 5,202 8,000 12,633 12,633 6,820 23,399 27,269
Community Assets – 23,866 16,469 24,500 23,433 23,433 9,320 23,757 30,510
Heritage Assets – – – – – – – – –
Rev enue Generating – – – – – – – – –
Non-rev enue Generating – – 205 – – – – – –
Investment properties – – 205 – – – – – –
Operational Buildings – – – – – – – – –
Housing – – – – – – – – –
Other Assets – – – – – – – – –
Biological or Cultivated Assets – – – – – – – – –
Serv itudes – – – – – – – – –
Licences and Rights – – – 300 300 300 1,555 795 843
Intangible Assets – – – 300 300 300 1,555 795 843
Computer Equipment 241 300 294 300 300 300 250 265 281
Furniture and Office Equipment 100 144 1,077 1,400 1,600 1,600 810 742 787
Machinery and Equipment 211 2,650 1,900 1,400 1,200 1,200 500 – –
Transport Assets 2,800 2,000 1,566 4,000 3,700 3,700 – – –
Land – – – – – – – – –
Zoo's, Marine and Non-biological Animals – – – – – – – – –
TOTAL CAPITAL EXPENDITURE - Asset class 45,249 80,664 75,204 69,569 68,141 68,141 60,107 68,182 70,597

75
75

76
76
ASSET REGISTER SUMMARY - PPE (WDV) 5
Roads Infrastructure 172,426 136,138 178,911 225,692 225,692 225,692 239,234 253,588 268,803
Storm water Infrastructure – –
Electrical Infrastructure 497,516 482,720 475,724 524,144 524,144 524,144 555,592 588,928 624,263
Water Supply Infrastructure
Sanitation Infrastructure –
Solid Waste Infrastructure
Rail Infrastructure
Coastal Infrastructure
Information and Communication Infrastructure
Infrastructure 669,942 618,858 654,635 749,836 749,836 749,836 794,826 842,515 893,066
Community Facilities 139,355 131,134 151,730 186,627 186,627 186,627 197,824 209,694 222,275
Sport and Recreation Facilities – – – – – – – – –
Community Assets 139,355 131,134 151,730 186,627 186,627 186,627 197,824 209,694 222,275
Heritage Assets
Rev enue Generating
Non-rev enue Generating 205 205 – – –
Investment properties – – – – 205 205 – – –
Operational Buildings – – 33,156 – – – – – –
Housing
Other Assets – – 33,156 – – – – – –
Biological or Cultivated Assets
Serv itudes
Licences and Rights – – – – 103 103 109 115 122
Intangible Assets – – – – 103 103 109 115 122
Computer Equipment – 2,080 – 615 615 615 652 691 732
Furniture and Office Equipment 1,517 1,435 3,658 2,057 2,057 2,057 2,181 2,311 2,450
Machinery and Equipment 801 1,129 2,533 1,166 1,166 1,166 1,236 1,310 1,389
Transport Assets 4,247 5,997 11,082 4,982 4,982 4,982 5,281 5,598 5,934
Land – – – – – – – – –
Zoo's, Marine and Non-biological Animals – – – – – – – – –
TOTAL ASSET REGISTER SUMMARY - PPE (WDV) 5 815,862 760,633 856,794 945,282 945,590 945,590 1,002,108 1,062,235 1,125,969
EXPENDITURE OTHER ITEMS
Depreciation 7 51,686 31,712 33,726 38,000 38,315 38,315 39,315 40,651 41,880
Repairs and Maintenance by Asset Class 3 1,895 5,525 5,441 5,571 5,571 5,571 4,370 7,132 7,560
Roads Infrastructure 310 2,615 3,263 1,000 1,000 1,000 600 1,636 1,734
Storm water Infrastructure – – – – – – – – –
Electrical Infrastructure 930 1,548 1,743 1,219 1,219 1,219 1,000 1,060 1,124
Water Supply Infrastructure – – – – – – – – –
Sanitation Infrastructure – – – – – – – – –
Solid Waste Infrastructure – – 5 – – – – – –
Rail Infrastructure – – – – – – – – –
Coastal Infrastructure – – – – – – – – –
Information and Communication Infrastructure – – – – – – – – –
Infrastructure 1,240 4,163 5,012 2,219 2,219 2,219 1,600 2,696 2,858
Community Facilities 204 – 56 300 300 300 100 100 100
Sport and Recreation Facilities – – – 300 300 300 – – –
Community Assets 204 – 56 600 600 600 100 100 100
Heritage Assets – – – – – – – – –
Rev enue Generating – – – – – – – – –
Non-rev enue Generating – – – – – – – – –
Investment properties – – – – – – – – –
Operational Buildings 365 874 – 795 795 795 300 324 349
Housing – – – – – – – – –
Other Assets 365 874 – 795 795 795 300 324 349
Biological or Cultivated Assets – – – – – – – – –
Serv itudes – – – – – – – – –
Licences and Rights – – – – – – 550 583 618
Intangible Assets – – – – – – 550 583 618
Computer Equipment – – – 117 117 117 – – –
Furniture and Office Equipment 47 68 27 106 106 106 400 424 449
Machinery and Equipment – 271 63 1,522 1,522 1,522 120 127 135
Transport Assets 40 150 283 212 212 212 1,300 2,878 3,051
Land – – – – – – – – –
Zoo's, Marine and Non-biological Animals – – – – – – – – –
TOTAL EXPENDITURE OTHER ITEMS 53,582 37,238 39,167 43,571 43,886 43,886 43,685 47,784 49,441
Renewal and upgrading of Existing Assets as % of total capex 0.0% 0.0% 0.0% 3.0% 3.1% 3.1% 1.3% 1.5% 2.4%
Renewal and upgrading of Existing Assets as % of deprecn 0.0% 0.0% 0.0% 5.5% 5.5% 5.5% 2.0% 2.5% 4.1%
R&M as a % of PPE 0.2% 0.7% 0.6% 0.6% 0.6% 0.6% 0.4% 0.7% 0.7%
Renewal and upgrading and R&M as a % of PPE 0.0% 1.0% 1.0% 1.0% 1.0% 1.0% 1.0% 1.0% 1.0%

77
77
LIM351 Blouberg - Table A10 Basic service delivery measurement
2014/15 2015/16 2016/17
Outcome Outcome OutcomeOriginal
Budget
Adjusted
Budget
Full Year
Forecast
Budget Year
2018/19
Budget Year
+1 2019/20
Budget Year
+2 2020/21
Current Year 2017/182018/19 Medium Term Revenue &
Expenditure FrameworkDescription Ref
Electricity (at least min.serv ice lev el) – – – – – 60 60 60 60
Electricity - prepaid (min.serv ice lev el) – – – – – 43,747 44,243 44,749 13,348
Minimum Service Level and Above sub-total – – – – – 43,807 44,303 44,809 13,408
Electricity (< min.serv ice lev el) – – – – – – – – –
Electricity - prepaid (< min. serv ice lev el) – – – – – – – – –
Other energy sources – – – – – – – – –
Below Minimum Service Level sub-total – – – – – – – – –
Total number of households 5 – – – – – 43,807 44,303 44,809 13,408
Refuse:
Remov ed at least once a w eek – – – – – – – – –
Minimum Service Level and Above sub-total – – – – – – – – –
Remov ed less frequently than once a w eek – – – – – 11,549 11,549 11,549 11,549
Using communal refuse dump – – – – – – – – –
Using ow n refuse dump – – – – – – – – –
Other rubbish disposal – – – – – – – – –
No rubbish disposal – – – – – – 36,011 36,011 36,011
Below Minimum Service Level sub-total – – – – – 11,549 47,560 47,560 47,560
Total number of households 5 – – – – – 11,549 47,560 47,560 47,560
Households receiving Free Basic Service 7
Water (6 kilolitres per household per month) – – – – – – – – –
Sanitation (free minimum lev el serv ice) 1,136 544 522 778 778 778 778 778 778
Electricity /other energy (50kw h per household per month) – – – – – – – – –
Refuse (remov ed at least once a w eek) 4,908 7,598 7,598 34,656 34,656 34,656 35,049 35,450 35,450
Cost of Free Basic Services provided - Formal Settlements (R'000) 8
Water (6 kilolitres per indigent household per month) – – – – – – – – –
Sanitation (free sanitation serv ice to indigent households) – – – – – – – – –
Electricity /other energy (50kw h per indigent household per month) – – – – – – – – –
Refuse (remov ed once a w eek for indigent households) 8 8 8 8 8 8 8 8 8
Cost of Free Basic Services provided - Informal Formal Settlements (R'000) – – – – – – – – –
Total cost of FBS provided 8 8 8 8 8 8 8 8 8
Highest level of free service provided per household
Property rates (R v alue threshold) – – –
Water (kilolitres per household per month) – – –
Sanitation (kilolitres per household per month) – – –
Sanitation (Rand per household per month) – – –
Electricity (kw h per household per month) 10,263 11,563 10,763 11,763 11,763 11,763 11,763 11,763 11,763
Refuse (av erage litres per w eek) 1,170 1,170 1,170 1,170 1,170 1,170
Revenue cost of subsidised services provided (R'000) 9
Property rates (tariff adjustment) ( impermissable values per section 17 of MPRA ) 15,000 15,000 15,000 15,000 15,000 15,000 15,000 15,000
Property rates ex emptions, reductions and rebates and impermissable values in
excess of section 17 of MPRA) – – – – – – – – –
Water (in excess of 6 kilolitres per indigent household per month) – – – – – – – – –
Sanitation (in excess of free sanitation service to indigent households) – – – – – – – – –
Electricity /other energy (in excess of 50 kwh per indigent household per month) – – – – – – – – –
Refuse (in excess of one removal a week for indigent households) – – – – – – – – –
Municipal Housing - rental rebates
Housing - top structure subsidies 6
Other
Total revenue cost of subsidised services provided 15,000 15,000 – 15,000 15,000 15,000 15,000 15,000 15,000

78
78
PART 2-SUPPORTING DOCUMENTATION
2.1 Overview of annual budget process
Section 53 of the MFMA requires the Mayor of the municipality to provide general political guidance in the budget process and the setting of priorities that must guide the preparation of the budget. In addition Chapter 2 of the Municipal Budget and Reporting Regulations states that the Mayor of the municipality must establish a Budget Steering Committee to provide technical assistance to the Mayor in discharging the responsibilities set out in section 53 of the Act. The Budget Steering Committee consists of the Municipal Manager and senior officials of the municipality. The primary aims of the Budget Steering Committee is to ensure:
• that the process followed to compile the budget complies with legislation and good budget practices;
• that there is proper alignment between the policy and service delivery priorities set out in the Blouberg’s IDP and the budget, taking into account the need to protect the financial sustainability of municipality;
• that the municipality’s revenue and tariff setting strategies ensure that the cash resources needed to deliver services are available; and
• that the various spending priorities of the different municipal departments are properly evaluated and prioritised in the allocation of resources.
To achieve the above, the IDP revision process plan as well as the budget process timetable were considered and approved by Council. Below is the schedule for the IDP/Budget process for the 2017/2018 Financial Year as adopted by Council. 2.2 The annual budget is aligned to the main strategic goals and objectives, which are as follows:

79
79
LIM351 Blouberg - Supporting Table SA4 Reconciliation of IDP strategic objectives and budget (revenue)
Strategic Objective GoalGoal
Code2014/15 2015/16 2016/17
R thousand
Audited
Outcome
Audited
Outcome
Audited
Outcome
Original
Budget
Adjusted
Budget
Full Year
Forecast
Budget Year
2018/19
Budget Year
+1 2019/20
Budget Year
+2 2020/21
Basic serv ices Deliv ery and
infrastructure Dev eopment
Serv ice Deliv ery 65,108 70,845 96,861 80,190 81,654 81,654 81,426 93,802 97,959
Local Economic Dev elopment
and spatial planning
Economic Grow th &
Dev elopment and pov erty
allev iation
1,004 4,592 397 10,230 12,126 12,126 10,427 12,868 12,376
Municipal transformation and
institutional dev elopment
Serv ice Deliv ery 7,810 6,225 9,606 8,981 4,780 4,780 4,204 – –
Good Gov ernance and Public
participation and finacial
v iability
Publishing the municipal
outcomes on the w ebsite and
effecting community
participation in the community
and implementation of batho
pele in the rev enue
management strategy
136,856 193,250 212,180 219,588 223,993 223,993 218,425 216,706 231,909
Allocations to other priorities 2
Total Revenue (excluding capital transfers and contributions) 1 210,777 274,912 319,044 318,988 322,553 322,553 314,481 323,377 342,245
Current Year 2017/182018/19 Medium Term Revenue &
Expenditure FrameworkRef

80
80
LIM351 Blouberg - Supporting Table SA5 Reconciliation of IDP strategic objectives and budget (operating expenditure)
Strategic Objective GoalGoal
Code2014/15 2015/16 2016/17
R thousand
Audited
Outcome
Audited
Outcome
Audited
Outcome
Original
Budget
Adjusted
Budget
Full Year
Forecast
Budget Year
2018/19
Budget Year
+1 2019/20
Budget Year
+2 2020/21
Electrical Infrastructure Serv ices Deliv ery 77,859 32,545 36,198 39,890 40,300 40,300 42,725 47,968 51,402
Community & Social Serv ice Serv ices Deliv ery 22,434 16,241 31,325 34,186 33,142 33,142 33,311 29,753 31,535
Waste Management Serv ices Deliv ery 43 1,018 77 1,050 1,032 1,032 2,230 2,364 2,506
Road Infrastructure
Dev elopment
Serv ices Deliv ery 8,586 11,738 11,921 9,150 10,290 10,290 7,677 10,637 11,275
Good Gov ernmance & public
Participation and financial
v iability
Fanancial Viability 84,655 144,871 162,669 198,277 205,292 205,292 203,491 195,629 201,063
Local Economic Dev elopment Economic Grow th &
Dev elopment
8,495 14,530 8,028 11,967 10,857 10,857 11,128 11,796 12,503
Allocations to other priorities
Total Expenditure 1 202,072 220,942 250,217 294,520 300,912 300,912 300,562 298,146 310,285
Current Year 2017/182018/19 Medium Term Revenue &
Expenditure FrameworkRef

81
81
LIM351 Blouberg - Supporting Table SA6 Reconciliation of IDP strategic objectives and budget (capital expenditure)
Strategic Objective GoalGoal
Code2014/15 2015/16 2016/17
R thousand
Audited
Outcome
Audited
Outcome
Audited
Outcome
Original
Budget
Adjusted
Budget
Full Year
Forecast
Budget Year
2018/19
Budget Year
+1 2019/20
Budget Year
+2 2020/21
Community & Social Serv ices Serv ice Deliv ery A – 23,866 22,312 20,500 22,364 22,364 9,570 25,988 31,179
Waste management Serv ice Deliv ery B 11 350 – 600 600 600 250 – –
Roads infrastructure
Dev elopment
Serv ice Deliv ery C 33,926 42,387 36,304 28,436 25,736 25,736 34,996 18,962 16,646
Electricity Infrascture
Dev elopment
Serv ice Deliv ery D 7,971 9,317 12,696 9,233 10,642 10,642 12,175 20,900 20,300
Gov ernance and
administration
Municipal offices(assets) E 3,341 4,744 3,687 6,800 6,700 6,700 3,115 2,332 2,472
Local Economic Dev elopment Economic Grow th &
Dev elopment
F – – 205 4,000 – – – – –
G
H
I
J
K
L
M
N
O
P
Allocations to other priorities 3
Total Capital Expenditure 1 45,249 80,664 75,204 69,569 66,041 66,041 60,107 68,182 70,597
Current Year 2017/182018/19 Medium Term Revenue &
Expenditure FrameworkRef

82
82
Measurable performance objectives and indicators
Ratios
17%
Total Operating Expenditure 291,379,426
Taxation Expense -
Total Capital Expenditure 57,640,450
The municipality meet the norm at 17%
A. Asset Management/Utilisation
1Capital Expenditure to
Total Expenditure
Total Capital Expenditure /
Total Expenditure (Total
Operating expenditure +
Capital expenditure) × 100
10% -
20%
10%
Total Repairs and Maintenance
Expenditure 5,570,000
PPE at carrying value 57,640,450
Investment Property at Carrying
value -
The municipality meet the norm at 10%
2
Repairs and Maintenance
as a % of Property, Plant
and Equipment and
Investment Property
(Carrying Value)
Total Repairs and Maintenance
Expenditure/ Property, Plant
and Equipment and Investment
Property (Carrying value) x 100
8%

83
83
The attainment of these objectives and strategies will require the collective efforts of all spheres of
government and the private sector. While there has been no commitment on these objectives from other
spheres of government it is pre-empted that through the IGR fora there will be a buy-in and commitment
of resources for the attainment of such. It should be noted that there is an observation that with the
resources available at the national fiscus not all millennium development goals will be attained as
planned.
IDENTIFIED STRATEGIES TO ADDRESS CHALLENGES IDENTIFIED IN THE ANALYSIS PHASE OF
THE IDP
KPA 1: SPATIAL PLANNING AND RATIONALE
STRATEGIC ISSUES
OBJECTIVES STRATEGIES
1 Access to land and housing
• To provide different housing typologies to 10 000 households by 2020
• To demarcate sites where there is a need
• Acquisition of strategically located land with the assistance of the Department of Rural Development and Land Reform, the National Housing Agency and COGHSTA
• Development and implementation of a Land Use Management plan.
2 Month
Cash and cash equivalents 52,016,685
Unspent Conditional Grants -
Overdraft -
Short Term Investments -
Total Annual Operational
Expenditure291,379,426
The municipality meet the norm at 2 Months
B. Liquidity Management
1
Cash / Cost Coverage
Ratio (Excl. Unspent
Conditional Grants)
((Cash and Cash Equivalents -
Unspent Conditional Grants -
Overdraft) + Short Term
Investment) / Monthly Fixed
Operational Expenditure
excluding (Depreciation,
Amortisation, Provision for Bad
Debts, Impairment and Loss on
Disposal of Assets)
1 - 3
Months

84
84
• Development and implementation of master plans to guide the growth of settlements starting with growth points and corridors of development
• Formalization of existing settlements
• Implementation of tenure upgrading programmes to ensure security of tenure for residents
• Development of good relations with traditional authorities
• Engaging the COGHSTA on the provision of quality low cost houses as well as rental housing for the gap market
• Radical shift away from Apartheid style of segregated development according to class to the implementation of integrated human settlements along the breaking new ground policy
• Identification and demarcation of land for residential, business, agriculture and industrial purposes especially in areas of strategic importance
• Building the planning capacity of the municipal personnel
KPA 2: BASIC SERVICE DELIVERY
STRATEGIC
ISSUES
OBJECTIVES
STRATEGIES
1 Access to clean
water
To provide clean drinking
water to all villages
according to RDP
• Long term strategy is to move away from reliance on
underground water to reliance on surface water using the

85
85
standards by the end of
2020
Glen Alpine and Blouberg (Masetheku) dams as major
sources of water
• The District, as the WSA, must engage DWAE and Water
Users Association of the Glen Alpine dam and the
Mogalakwena River to change the use of water from
commercial agricultural use to domestic use
• The local municipality, together with the district, must
review and implement the Water Services Development
Plan which will also guide on the maintenance and
upgrading of water assets to cover for the growth of
settlements especially growth points and corridors of
development.
• Develop systems to detect water leakages in
communities
• Rehabilitation and maintenance of existing boreholes
and water infrastructure
• Improvement of cost recovery strategy to curb wastage of
water
• Identification of illegal connections and curbing them
especially those affecting the rising main
• Implementation of a Free Basic Water strategy
• User paying for higher level of services
• The usage of term contractors to avoid water services
interruptions
• Resuscitation and training of water committees in
communities
• Embark on awareness campaigns on water saving
techniques among community members

86
86
• To curb or reduce theft of diesel engine pumps there
should be a change to electric water pumps and
installation of tracking devices such as micro-chips
• Engage the Municipal Demarcation Board and CDM to
grant powers and functions of water and sanitation to
Blouberg Municipality.
2 Access to
sanitation
To provide each
household with a VIP
toilet according to
National sanitation policy
standards by 2020
To have awareness
programmes in place
focusing on health and
hygiene related to
sanitation
• Construction of sanitation facilities that adhere to policy
standards with the priority targeting areas where the
underground water table is closer to the surface
• Enter into partnership with NGOs to fast track the
provision of the service
• Provision of Free Basic Sanitation to indigent households
• User paying for higher level of services
3 Access to
energy services
To provide all
outstanding villages with
electricity by 2020
To ensure minimal
energy consumption by
users as per the national
energy reduction strategy
To also ensure the
provision of electricity
connections to settlement
extensions
• Using own electricity license to electrify extensions in
villages that have grown over the years since their
electrification.
• Soliciting ESKOM for the provision of electricity to
extensions to reduce backlogs in areas of ESKOM
supply
• Having a fully functional local energy forum
• Exploration of alternative sources of energy(non grid)
• Development and implementation of an energy master
plan
• Provision of Free Basic Electricity to indigent households

87
87
• Embark on energy saving campaigns to reduce
unnecessary energy consumption
4 Access to roads
and storm water
To tar additional 150 km
of roads and re – gravel
500 km of access roads
by the end of 2020
To grade internal streets
on a continuous basis
To ensure access to
storm water facilities by
al communities
To construct low water
bridges
To build bus stop shelters
and taxi ranks in strategic
locations
• Engagement of Roads Agency-Limpopo on the tarring of
roads especially the ones linking to nodes of economic
activities
• Engagement of the Department of Public Works and
Roads for a grading programme and adherence to such
• Sustaining and beefing up the municipal roads unit and
capacity building to the three clusters established
• Partnership with the local mining houses (De Beers and
Coal of Africa) to help in funding and implementing some
of the programmes on building new roads and
maintaining existing ones.
• Embark on programmes of upgrading some internal
streets with the provision of storm water drainage
facilities
• Coordination of roads development and maintenance
• Development of Integrated Roads and Transport master
plan developments
• Sustaining the local roads and transport forum

88
88
5 Public transport To ensure all settlements
have access to affordable
and sustainable public
transport
To ensure availability of
infrastructure to support
public transport
To build capacity to the
transport industry
• Engage public transport operators to extend areas of
coverage as well as hours of operation
• Embark on campaigns that promote the use of public
transport development especially to reduce global
warming
• Construction of new taxi ranks and upgrading of informal
taxi ranks
• Construction of taxis and bus shelters along major roads
• Capacity building to the taxi industry e.g. on business
management, safety awareness, customer care etc.
6 Waste
management
To provide and improve
waste management and
refuse removal to 100%
of the population by 2020
• Development of a waste management roll out plan
• Provision of onsite storage systems
• Establishment of compliant\licensed landfill sites
• Provision of regular waste collection
• Purchase and maintenance of additional waste bins,
waste compactor and waste plant.
• Provision of environmental awareness of the detrimental
effects of waste.
• Sustaining the use of 100 general workers to rollout the
function
• Integrating the CWP and EPWP and the use of municipal
staff into the waste programme

89
89
6 Access to
educational
facilities
To ensure that all
learners have access to
education by 2018.
Standard ECD facilities-
85% BY 2030
Establish and support
learner ship programmes
through SETAs
• Building additional classrooms in areas with few
classrooms
• Identification of inaccessible educational facilities
• Engagement of the departments of education and public
works to provide the necessary infrastructure
• Fostering partnerships to achieve the objective
• Provision of learner with bicycles and scholar transport
• Building of new schools
• Promotion of ABET projects
6 Access to
health
To ensure that all
residents in the municipal
area have access to
primary health care
facilities within 5km
walking distance by 2020
• Coordination of the establishment of and increasing
clinics and mobile centres in the area
• Lobbying the Department of Health to upgrade old clinics
such as Schoongezight and build new ones in areas
outside the norm
• Upgrading Ratšhaatšhaa and Blouberg health centres to
be a fully fledged hospitals
• Provision of mobile health facilities
• Establishment of a programme of volunteerism
7 Access to
communication
To give 80% of the
population access to
posts and
telecommunication by
2020
• Building of new post offices
• Establishment of telecentres
• Facilitating the increase in cellular network coverage by
partnering with major cellular operators to provide such
• Supporting and encouraging the establishment of
Thusong Service Centres (MPCC)
• Supporting and facilitating the establishment of a
community radio station

90
90
• Establishing a local publication and newsletters
8 Emergency
services
To provide 100% of the
population with access to
emergency services by
2016
• Development of a disaster management plan
• Building emergency stations
09 Sports and
recreation
To ensure and improve
access to recreation and
sporting facilities to 90%
of the population by the
end 2018
To promote the effective
use and maintenance of
sports facilities
• Encouraging people to participate in sporting activities
• Construction of multipurpose sports complex
• Renovation and upgrading existing sports grounds
• Diversification of sporting codes
Encouraging coaching clinics and sporting competitions
10 Environment To provide a sound
environmental
conservation and
management plan.
To have a well
coordinated
environmental strategy
by 2020
• Adoption of Integrated Environmental Management
principles for all development projects
• Development and conducting environmental awareness
campaigns
• Exploration and promotion of alternative energy sources
which are not harmful to the environment.
• Ensuring compliance with environmental laws, especially
NEMA.
11 HIV-AIDS To reduce and prevent
the infection of HIV-AIDS
related deaths.
• Co-coordinating and supporting municipality – based
AIDS awareness in conjunction with the Department of
Health and Social Development
• Developing HIV-AIDS support programmes

91
91
KPA 3: LOCAL ECONOMIC DEVELOPMENT
STRATEGIC AREA
OBJECTIVES STRATEGIES
1 Economic development
• To promote job creation in the municipality by 6% annually
• To create and promote LED initiatives in the SMME sector
• To broaden the skills base of the communities
• To acquire strategically located land for economic development
• Reviewing current LED strategy and subsequent implementation through partnership
• Planning and coordinating LED activities
• Supporting entrepreneurial development
• Supporting and promoting local procurement
• Implementation of local empowerment strategies that include joint venturing in the implementation of projects
• Skills development and capacity building programmes for locals.
• Engage the Capricorn FET College to ensure the curriculum offers market-related programmes
• Develop a database of unemployed graduates and prioritize re-skilling where needed
To establish programmes
to deal with the effects of
HIV-AIDS, especially for
AIDS orphans
To encourage home
based care
• Partnering with the private sector to deal with the scourge
of HIV.

92
92
• Engage the SETAs to assist on skills development programmes for community members
• Lobby for the establishment of additional institutions of higher learning
• Supporting and promoting labour intensive methods in community based infrastructure projects.
• Together with the provincial and national government there is a need to embark on programmes such as Community Work Programme and Expanded Public Works Programme to create a safety job net for local communities
• Place marketing and investor attraction (development of place marketing brochures and video and placing such on the municipal website)
• Identification of strategically located land and acquisition thereof
• Provision of preferential tariffs on rates and taxes to help in the expansion and retention of business, farms and industries
• Provision of supporting infrastructure such as roads networks, energy supply and water and sanitation supply to aid business development

93
93
KPA 4, GOOD GOVERNANCE AND PUBLIC PARTICIPATION
STRATEGIC AREA
STRATEGIC OBJECTIVES STRATEGIES
1. Good governance and public participation
• Enhance total community participation
• Ensure the attainment of a clean audit in line with Operation clean target of 2014
• Sustain good community participation practice as contained in the communication strategy
• Develop and implement action plan to address all issues raise by the Auditor—General
• Capacitate and strengthen the MPAC
• Establish and capacitate the risk unit and risk committee
• Sustain the functionality of the internal audit committee
• Establish an internal pre-audit committee
2. General planning (long term planning)
• To ensure forward long term planning in line with the national government vision 2030
• Municipality to develop a growth and development strategy (Blouberg Vision 2030)
• Cluster development along nodes and corridors of development
• Quantify all backlogs and develop a priority list for all such backlogs as reflected in the tables below

94
94
KPA 5, FINANCIAL VIABILITY
STRATEGIC AREA
STRATEGIC OBJECTIVES STRATEGIES
1 Financial sustainability
To increase municipal revenue base by 80% by 2014 To recover all outstanding debts by end of 2013\14 financial year To provide deserving indigents with free basic services To improve the assets management capacity of the municipality
• Development of a financial plan
• Development and improvement of financial management policies in line with the Municipal Finance Management Act
• Reduction of operational expenditure by cutting down on unnecessary costs
• Employment of knowledgeable personnel
• Capacity building to all municipal staff and councilors on financial management
• Update the indigent register from time to time
• Beefing up cost recovery measures
• Cost recovery awareness campaigns
• Procuring or upgrading of financial system
• Sustain the current pilot project of field cashiers
• Embark on a process of unbundling of municipal assets

95
95
KPA 6, MUNICIPAL TRANSFORMATION AND ORGANIZATIONAL DEVELOPMENT
STRATEGIC AREA
STRATEGIC OBJECTIVES STRATEGIES
1. Municipal transformation and organizational development
• To address the retention of skilled personnel
• To address skills gaps
• To address the plight of special focus groups
• To decentralize municipal services to communities for them to access such within reduced distances
• Development and implementation of the staff retention policy
• Development and implementation of a credible WSDP especially to attend to training and development in priority areas such as Finance, Engineering, Auditing and Town planning
• Beefing up the special focus unit to have personnel responsible for children and the elderly
• Sustain existing satellite offices and establish new ones
2.4 Overview of Budget Related policy

96
96
Key to budget-related policies;
Budget Related Policy
The purpose of budget-related and financial policies is to provide a sound environment to manage the
financial affairs of the municipality. The following are key budget relating policies:
Tariff Structure – the policy prescribes the procedures for calculating tariffs. This policy is required in
terms of Section 74 of the Local Government Municipal Systems Act, Act 22 of 2000.
Indigent Support Policy – to provide access to and regulate free basic services to all indigent
households.
Credit Control and Debt Collection Policy – to provide for credit and debt collection procedures and
mechanisms to ensure that all consumers pay for the services that are supplied.
Budget Policy – this policy set out the principles which must be followed in preparing a medium term
revenue and expenditure framework budget. It further ensures that the budget reflects the strategic
outcomes embodied in the IDP and related strategic policies.
Investment Policy – this policy was compiled in accordance with the Municipal Investment Regulations
and ensures that cash resources are managed in the most efficient and effective manner possible.
Asset Management Policy – the objective of the policy is to prescribe the accounting and
administrative procedures relating to property, plant and equipment (assets).

97
97
Supply Chain Management Policy – this policy is developed in terms of Section 111 of the Municipal
Finance Management Act, Act 56 of 2003. The principles of this policy is to give effect to a fair,
equitable, transparent, competitive and cost-effective system for the procuring of goods and services,
disposing of goods and selecting of contractors in the provision of municipal services.
Cash Management Policy- to ensure that there is a proper cash flow management and control.
Payroll Policy: To provide guidelines and restrictions with regard to the compensation of employees
for the fulfillment of their employment obligations within Blouberg Local Municipality.
Fund Reserve Policy: In terms of regulation 8 of the Municipal Budget and Reporting Regulations.,
each Municipality must have a funding and reserves policy
Property Rates and By-Law Policy - to enable the municipality to levy rates on ratable properties
and apply rebates and discounts on certain categories of properties.
Unauthorized, irregular, or fruitless and wasteful: The objective of this policy document is to clearly
define the responsibilities of the Blouberg Local Municipality in terms of the Municipal Finance
Management Act with respect to Unauthorized, Irregular, Fruitless and Wasteful expenditure.
Draft cost containment measures policy in terms of draft Regulation issued by 16 February 2018
The following policies were reviewed
Indigent Support Policy.
Tariff Policy-Rates increased.
Impairment Policy

98
98
Credit control and debt management
Assets management
The summary of amendments:
Indigent policy
Households earning a joint income of not more than R 3400 per month (proof of pay slips/copy of
recent bond statements). Residents of Blouberg Local Municipality and Residents in possession of a
valid South African Identity Document.
The discount of 70% to pensioners on property rates.
Tariffs Policy
Sale of Electricity,
The electricity tariffs
Electricity tariffs will be increase by 6 % as proposed and submitted to NERSA but not yet received the
approval.
Refuse and Other Revenue source,
In terms of MFMA Circular 86 National Treasury encourage municipalities to maintain tariff increase at
levels that reflect an appropriate balance between the affordability to poorer households and other
customers while ensuring the financial sustainability of the municipality. The Consumer Price index
(CP) inflation has however breached the upper limit of the 3 to 6 per cent target band; therefore
municipalities are now required to justify all increases in excess of the 6.4 per cent projected inflation
target in their budget narratives.
Therefore Municipal services tariffs will increase by 6 per cent of the services offered by municipality
revenue sources e.g. Refuse removal, Advertisements, Animal pounds and Cemeteries ect.
Impairment Policy

99
99
The policies was showing as per Grap standard, Therefore we outline what required as Grap to say the
methodology for assessing individual significate debtors.
Credit control and debt management policy
Insert the date which meter reading where taken (20 and 26 of each month) and Municipality can make
use of technology (sms, email) for sending invoices to facilitate timeous receipt.
Assets Management
The Grap alignment was not correct; therefore, we redrafted and align the policy with Grap standard.
Property Rate
CATEGORY CURRENT TARIFF(17/18)
PROPOSED TARIFF (CENT IN A RAND) (2018/19)
Residential 0.0059 0.0063
Residential property consent use 0.0094 0.010
Residential impermissible or illegal use
0.0118 0.013
Residential vacant land 0.0083 0.088
Farms 0.0083 0.088
State owned properties 0.0349 0.0370
Businesses\ commercial 0.0083 0.0083
2.5 Overview of Budget assumptions
2.5.1 General inflation outlook and its impact on the municipal activities

100
100
There are three key factors that have been taken into consideration in the compilation of the
2018/19 MTREF:-
National Government macro-economic targets;
• The impact of municipal cost drivers;
• The increase in the cost of remuneration, Employee costs plus councillors remuneration is 36 per cent
of total operating expenditure in the 2019/20 MTREF.
2.5.2 Interest rates for borrowing and investment of funds
The MFMA specifies that borrowing can only be utilized to fund capital or refinancing of borrowing in certain conditions. The Municipality is not intended to take any borrowings to finance its capital assets for the 2018/19 budget year to minimize the interest rate costs and risks. 2.5.3 Collection rate for revenue services It is also assumed that current economic conditions, and relatively controlled inflationary conditions, will continue for the forecasted term. It is also assumed that the revenue will increase after the demarcation has been finalised and all the wards has been allocated according to the demarcation board approval. The rate of revenue collection is currently expressed as a percentage (76 per cent) of annual billings. 5.2.4 Operational and Capital Grants It has been assumed that 100 per cent of the grants will be received. 5.2.4 Salary increases Circular No. 91 state that, “The Salary and Wage Collective Agreement for the period 01 July 2015 to 31 June 2018 has come to an end. The process is under consultation; therefore, in the absence of other information from the South African Local Government Bargaining Council communication will be provided at a later stage”. Therefore, the municipality for salaries budget used 8% this percentage is between the inflation rate of 5.3% plus 3.7%, which is the municipal provision as we are waiting for job description result during April. For councillor’s remuneration municipality used 6%, which is latest approved upper limit.

101
101
5.2.4 Ability of the municipality to spend and deliver on the programmes MFMA circular No.71 state that at least 10-20 per cent of total expenditure will be spent on the implementation of capital projects. During the preparation of 2018/19 budget we anticipated to spend 20 percent of total expenditure to capital projects. 5.2.5 And also The following assumptions were used in compiling the budget;
• Ensuring that expenditure is aligned to revenue and that the municipality has sufficient cash to finance the expenditure.
• Ensure that the municipality avoids borrowings.
• Ensure that the budget respond to priorities enlisted in the IDP.
• Review of all programmes and cost centers to minimize wastage.
• Ensure that services are cost reflective, affordable and sustainable.
• Ensure that realistic revenue targets are set based on trends.
• Ensuring that service delivery and capital projects use labour intensive methods wherever appropriate
• Ensuring that service providers use labour intensive approaches;
• Supporting labour intensive LED projects
• Participating fully in the Expanded Public Works Programme; and
• Implementing interns programmes to provide young people with on-the-job training.
• Price benchmarking;
• Encourage the enforcement of remedial actions (penalties, litigations, restrictions etc.) on all suppliers that act fraudulently; and
• Refinement to the register for tender defaulters and the database of restricted supplies which must be checked prior to awarding of contracts in order to ensure that no restricted companies are awarded contracts.
• Follow the national guide on the salary and CPI.
• NERSA guideline on tariff increase
• National guide in the application of cost containment measures as per MFMA circular 86

102
102
2.6 Overview of budget funding
The funding of operating and capital expenditure are funded as follow:
The municipality fund the operational expenditure from municipal own revenue which is services
charges and grants.
2.6.1. Operating and Capital Expenditure
For Blouberg Local Municipality to continue improving the quality of services provided to its citizens it
needs to generate the required revenue. We believe that with a new demarcation will increase our
source of revenue.The below table shows that the operating and capital expenditure are funded.
Table-1 Summary of revenue classified by main revenue source

103
103
Property Rates
Property rates cover the cost of the provision of general services. Determining the effective property
rate tariff is therefore an integral part of the municipality’s budgeting process. The municipal property
Rates is calculated based latest consolidated valuation roll received from the municipal property
Description 2014/15 2015/16 2016/17
R thousandsAudited
Outcome
Audited
Outcome
Audited
Outcome
Original
Budget
Adjusted
Budget
Full Year
Forecast
Pre-audit
outcome
Budget Year
2018/19
Budget Year
+1 2019/20
Budget Year
+2 2020/21
Financial Performance
Property rates 14,985 20,289 25,065 24,463 24,463 24,463 21,445 27,000 27,560 29,214
Serv ice charges 17,100 17,235 20,940 27,792 26,792 26,792 13,506 29,666 30,166 31,968
Inv estment rev enue 1,040 1,504 2,072 1,500 1,600 1,600 – 1,700 1,590 1,685
Transfers recognised - operational 122,143 152,320 185,947 195,153 195,153 195,153 – 189,579 184,605 197,882
Other ow n rev enue 7,406 31,968 9,337 20,237 23,237 23,237 4,008 13,750 15,906 15,571
Total Revenue (excluding capital transfers
and contributions)
162,673 223,317 243,360 269,145 271,245 271,245 38,959 261,695 259,827 276,320
Employ ee costs 69,842 77,443 87,556 101,539 102,870 102,870 65,050 108,265 113,084 118,803
Remuneration of councillors 12,139 12,906 17,510 17,584 19,013 19,013 – 16,757 17,762 18,828
Depreciation & asset impairment 51,686 31,712 33,726 38,000 38,315 38,315 – 39,315 41,674 44,174
Finance charges – 372 314 – – – – – – –
Materials and bulk purchases 21,208 28,794 31,483 31,329 31,969 31,969 17,532 34,370 41,932 44,448
Transfers and grants – – – – – – – – – –
Other ex penditure 47,197 70,082 79,621 106,091 108,768 108,768 62,694 101,855 83,694 84,033
Total Expenditure 202,072 221,309 250,210 294,542 300,934 300,934 145,276 300,562 298,146 310,285
Surplus/(Deficit) (39,399) 2,008 (6,850) (25,397) (29,689) (29,689) (106,317) (38,866) (38,319) (33,966)
Transfers and subsidies - capital (monetary allocations) (National / Prov incial and District)48,104 51,962 75,676 49,836 51,300 51,300 – 47,786 63,550 65,925
Contributions recognised - capital & contributed assets – – – – – – – 5,000 – –
Surplus/(Deficit) after capital transfers &
contributions
8,705 53,970 68,827 24,439 21,611 21,611 (106,317) 13,920 25,231 31,959
Share of surplus/ (deficit) of associate – – – – – – – – – –
Surplus/(Deficit) for the year 8,705 53,970 68,827 24,439 21,611 21,611 (106,317) 13,920 25,231 31,959
Capital expenditure & funds sources
Capital expenditure 45,249 80,664 75,204 69,569 66,041 66,041 33,805 60,107 68,182 70,597
Transfers recognised - capital 41,339 49,669 67,030 49,836 51,305 51,305 28,893 50,611 63,550 65,925
Public contributions & donations – 19,462 – – – – – – – –
Borrow ing – – – – – – – – – –
Internally generated funds 3,910 11,534 8,174 19,733 14,736 14,736 4,911 9,495 4,632 4,672
Total sources of capital funds 45,249 80,664 75,204 69,569 66,041 66,041 33,805 60,107 68,182 70,597
2018/19 Medium Term Revenue &
Expenditure FrameworkCurrent Year 2017/18
LIM351 Blouberg - Table A1 Budget Summary

104
104
valuator during the current year (General valuation roll and supplementary valuation roll). 2018/19 in
2020/21. This budget is based on the MPRA, revised randage and property rate policy for 2018/19.
Interest earned – External investments
The budget for interest receive on external investment is the overage of interest received from 2015/16
to 2016/17 as per audited AFS. Included in the budget for interest received on external investment is
the interest expected to receive for 2018/19 financial year amounting to R 1.7 million.

105
105
2.7 The following table shows the Expenditure on allocations and grant programmes ( SA 18)
LIM351 Blouberg - Supporting Table SA18 Transfers and grant receipts
Description Ref 2014/15 2015/16 2016/17
R thousandAudited
Outcome
Audited
Outcome
Audited
Outcome
Original
Budget
Adjusted
Budget
Full Year
Forecast
Budget Year
2018/19
Budget Year
+1 2019/20
Budget Year
+2 2020/21
RECEIPTS: 1, 2
Operating Transfers and Grants
National Government: 121,458 148,137 167,663 170,505 170,505 170,505 172,408 184,605 197,882
Local Gov ernment Equitable Share 117,073 143,794 155,297 161,111 161,111 161,111 167,730 182,071 195,348
Finance Management 1,800 1,800 2,433 2,533 2,533 2,533 2,534 2,534 2,534
EPWP Incentiv e 1,651 1,613 1,808 1,562 1,562 1,562 1,089 – –
Municipal Sy stems Improv ement 934 930 – – – – 1,055 – –
– – 2,255 2,255 2,255 – – –
– – – – – – – – –
Other transfers/grants MSIG – – 8,125 3,044 3,044 3,044 – – –
Provincial Government: – – – – – – – – –
– – – – – – – – –
– – – – – – – – –
– – – – – – – – –
– – – – – – – – –
Other transfers/grants MSIG – – – – – – – – –
District Municipality: 684 1,266 2,250 4,550 4,550 4,550 3,300 – –
CDM-EPWP 684 1,266 2,250 1,550 1,550 1,550
CDM-Landfil – – – 3,000 3,000 3,000 3,300 – –
Other grant providers: – – 19,525 20,098 20,098 20,098 13,871 – –
NSF -Grant – – 19,525 20,098 20,098 20,098 13,871 – –
Total Operating Transfers and Grants 5 122,142 149,403 189,438 195,153 195,153 195,153 189,579 184,605 197,882
Capital Transfers and Grants
National Government: 46,408 71,731 53,381 49,836 51,304 51,304 47,786 63,550 65,925
Municipal Infrastructure Grant (MIG) 43,408 64,731 44,381 42,836 44,304 44,304 43,491 44,350 46,725
–
–
–
–
ELECTRIFICATION 3,000 7,000 9,000 7,000 7,000 7,000 4,295 19,200 19,200
Provincial Government: – – – – – – – – –
Other capital transfers/grants [insert
description] – – – – – – – – –
District Municipality: – – – – – – – – –
CDM-EPWP – – – – – – – – –
Other grant providers: – – – – – – 5,000 – –
NSF -Grant – – – – – – – – –
Enegy – – – – – – 5,000 – –
Total Capital Transfers and Grants 5 46,408 71,731 53,381 49,836 51,304 51,304 52,786 63,550 65,925
TOTAL RECEIPTS OF TRANSFERS & GRANTS 168,550 221,134 242,819 244,988 246,457 246,457 242,365 248,155 263,807
Current Year 2017/182018/19 Medium Term Revenue &
Expenditure Framework

106
106
2.7.1 Operating Expenditure Framework The Blouberg Local Municipality ’s expenditure framework for the 2018/19 budget and MTREF is informed by the following: • Balanced budget constraint (operating expenditure should not exceed operating revenue)
• Funding of the budget over the medium-term as informed by Section 18 and 19 of the MFMA;
• The capital programmes
• Operational gains and efficiencies will be directed to funding the capital budget and other core services; and
• Strict adherences to the principle of no project plan no budget.

107
107
LIM351 Blouberg - Supporting Table SA19 Expenditure on transfers and grant programme
Description Ref 2014/15 2015/16 2016/17
R thousandAudited
Outcome
Audited
Outcome
Audited
Outcome
Original
Budget
Adjusted
Budget
Full Year
Forecast
Budget Year
2018/19
Budget Year
+1 2019/20
Budget Year
+2 2020/21
EXPENDITURE: 1
Operating expenditure of Transfers and Grants
National Government: 121,458 148,137 167,663 170,505 170,505 170,505 172,408 184,605 197,882
Local Gov ernment Equitable Share 117,073 143,794 155,297 161,111 161,111 161,111 167,730 182,071 195,348
Finance Management 1,800 1,800 2,433 2,533 2,533 2,533 2,534 2,534 2,534
EPWP Incentiv e 1,651 1,613 1,808 1,562 1,562 1,562 1,089 – –
Municipal Sy stems Improv ement 934 930 – – – – 1,055 – –
– – 2,255 2,255 2,255 – – –
– – – – – – – – –
CDM-EPWP –
Other transfers/grants MSIG – – 8,125 3,044 3,044 3,044 – – –
Provincial Government: – – – – – – – – –
– – – – – – – – –
– – – – – – – – –
– – – – – – – – –
– – – – – – – – –
Other transfers/grants MSIG – – – – – – – – –
District Municipality: 684 1,266 2,250 4,550 4,550 4,550 3,300 – –
CDM-EPWP 684 1,266 2,250 1,550 1,550 1,550
CDM-Landfil – – – 3,000 3,000 3,000 3,300 – –
Other grant providers: – – 19,525 20,098 20,098 20,098 13,871 – –
NSF -Grant – – 19,525 20,098 20,098 20,098 13,871 – –
Total operating expenditure of Transfers and Grants: 122,142 149,403 189,438 195,153 195,153 195,153 189,579 184,605 197,882
Capital expenditure of Transfers and Grants
National Government: 46,408 71,731 53,381 49,836 51,304 51,304 47,786 63,550 65,925
Municipal Infrastructure Grant (MIG) 43,408 64,731 44,381 42,836 44,304 44,304 43,491 44,350 46,725
–
–
–
–
ELECTRIFICATION 3,000 7,000 9,000 7,000 7,000 7,000 4,295 19,200 19,200
Provincial Government: – – – – – – – – –
Other capital transfers/grants [insert
description] – – – – – – – – –
District Municipality: – – – – – – – – –
CDM-EPWP
Other grant providers: – – – – – – 5,000 – –
NSF -Grant
Enegy – – – – – – 5,000 – –
Total capital expenditure of Transfers and Grants 46,408 71,731 53,381 49,836 51,304 51,304 52,786 63,550 65,925
TOTAL EXPENDITURE OF TRANSFERS AND GRANTS 168,550 221,134 242,819 244,988 246,457 246,457 242,365 248,155 263,807
Current Year 2017/182018/19 Medium Term Revenue &
Expenditure Framework

108
108
2.8 Allocation grant made by the Municipality
Municipality does not have or made allocation grant
2.9 The following tables shows the councilor and board member allowance and employers
benefits
2.9.1 Employee related cost
The budgeted allocation for employee related costs for the 2018/19 budget year is R 107.6 million. This
budget amount is made of current employee as reflected in 2017/18 adjusted budget plus 08 percent
increase no budget for vacant post, however the municipality will adjust the employees related cost
during the 2018/19 compilation of final budget.
2.9.2 Remuneration of councillors
The cost associated with the remuneration of councillors is determined by the Minister of Cooperative
Governance and Traditional Affairs in accordance with the Remuneration of Public Office Bearers Act,
1998 (Act 20 of 1998). The most recent proclamation in this regard has been taken into account in
compiling the Municipality’s budget. The determination of salaries, allowances and benefits of different
members of Council is based on 06 percent council upper limit approved during this financial year.

109
109
Summary of Employee and Councillor
remunerationRef 2014/15 2015/16 2016/17
R thousandAudited
Outcome
Audited
Outcome
Audited
Outcome
Original
Budget
Adjusted
Budget
Full Year
Forecast
Budget Year
2018/19
Budget Year
+1 2019/20
Budget Year
+2 2020/21
1 A B C D E F G H I
Councillors (Political Office Bearers plus Other)
Basic Salaries and Wages 7,448 7,940 9,384 8,294 7,756 7,756 8,595 9,110 9,657
Pension and UIF Contributions 956 1,024 963 2,322 2,721 2,721 2,939 3,115 3,302
Medical Aid Contributions – – – – –
Motor Vehicle Allow ance 2,738 2,941 6,151 2,806 3,654 3,654 3,947 4,184 4,435
Cellphone Allow ance 997 1,001 1,013 1,003 1,023 1,023 1,105 1,171 1,242
Housing Allow ances – – – 158 158 158 171 181 192
Other benefits and allow ances – – – – 3,600 3,600 – – –
Sub Total - Councillors 12,139 12,906 17,510 14,584 18,913 18,913 16,757 17,762 18,828
% increase 4 6.3% 35.7% (16.7%) 29.7% – (11.4%) 6.0% 6.0%
Senior Managers of the Municipality 2
Basic Salaries and Wages 3,281 3,643 2,526 4,096 5,146 5,146 4,558 5,003 5,483
Pension and UIF Contributions 665 636 544 723 723 723 681 844 911
Medical Aid Contributions – – – – – –
Ov ertime – – – – – –
Performance Bonus – – – – – –
Motor Vehicle Allow ance 3 1,347 1,233 1,182 1,374 1,374 1,374 1,304 1,602 1,731
Cellphone Allow ance 3 125 107 148 148 148 160 172 186
Housing Allow ances 3 – – – – – –
Other benefits and allow ances 3 – 3 3 3 3 3 3
Pay ments in lieu of leav e
Long serv ice aw ards
Post-retirement benefit obligations 6
Sub Total - Senior Managers of Municipality 5,294 5,637 4,359 6,344 7,394 7,394 6,706 7,624 8,314
% increase 4 6.5% (22.7%) 45.5% 16.6% – (9.3%) 13.7% 9.0%
Other Municipal Staff
Basic Salaries and Wages 37,386 41,820 48,714 52,503 52,503 52,503 55,953 60,105 63,712
Pension and UIF Contributions 8,593 9,328 10,433 13,110 12,510 12,510 13,511 14,322 15,181
Medical Aid Contributions 2,314 2,855 3,272 3,662 3,662 3,662 3,954 4,192 4,443
Ov ertime 1,034 1,143 1,214 759 1,259 1,259 1,360 1,441 1,528
Performance Bonus – 800 800 800 653 692 734
Motor Vehicle Allow ance 3 8,047 8,356 9,119 12,803 12,803 12,803 13,827 14,657 15,536
Cellphone Allow ance 3 1,432 1,387 1,621 1,571 1,571 1,571 1,696 1,798 1,906
Housing Allow ances 3 273 263 225 136 236 236 255 270 286
Other benefits and allow ances 3 5,469 6,655 5,665 6,752 9,583 9,583 10,350 10,971 11,629
Pay ments in lieu of leav e – – – – – – – – –
Long serv ice aw ards – – – – – – – – –
Post-retirement benefit obligations 6 – – – – – – – – –
Sub Total - Other Municipal Staff 64,548 71,806 80,264 92,095 94,926 94,926 101,559 108,448 114,954
% increase 4 11.2% 11.8% 14.7% 3.1% – 7.0% 6.8% 6.0%
Total Parent Municipality 81,981 90,349 102,133 113,023 121,233 121,233 125,021 133,834 142,096
10.2% 13.0% 10.7% 7.3% – 3.1% 7.0% 6.2%
Current Year 2017/182018/19 Medium Term Revenue &
Expenditure Framework

110
110
2.10 The following table shows the monthly targets for revenue and expenditure and cash flow

111
111
LIM351 Blouberg - Supporting Table SA30 Budgeted monthly cash flow
MONTHLY CASH FLOWS
R thousand July August Sept. October November December January February March April May JuneBudget Year
2018/19
Budget Year
+1 2019/20
Budget Year
+2 2020/21
Cash Receipts By Source 1
Property rates 254 5,611 5,759 206 6,362 5,284 254 254 254 254 254 752 25,500 27,560 29,214
Serv ice charges - electricity rev enue 2,822 2,504 1,947 1,725 2,562 2,666 2,897 2,085 1,936 2,813 1,625 1,084 26,666 29,326 31,086
Serv ice charges - w ater rev enue – – – – – – – – – – – – – – –
Serv ice charges - sanitation rev enue – – – – – – – – – – – – – – –
Serv ice charges - refuse rev enue 67 88 67 58 96 67 67 67 59 48 67 51 800 840 882
Serv ice charges - other – – – – – – – – – – – – – – –
Rental of facilities and equipment 26 26 26 26 26 26 26 26 26 26 26 26 315 350 371
Interest earned - ex ternal inv estments – – 260 – 200 – 300 – – 350 – 590 1,700 1,590 1,685
Interest earned - outstanding debtors 43 46 53 45 42 42 46 40 48 49 45 32 531 654 693
Div idends receiv ed – – – –
Fines, penalties and forfeits 287 387 207 337 287 287 307 287 187 300 287 284 3,440 3,614 3,809
Licences and permits 306 306 306 306 306 306 306 306 306 306 306 634 4,000 3,892 4,126
Agency serv ices 13 13 13 13 13 13 13 13 13 13 13 13 150 160 170
Transfer receipts - operational 68,446 – – 2,015 – 48,504 – 2,126 68,488 – – – 189,579 184,605 197,882
Other rev enue 325 225 1,225 425 425 325 425 425 525 425 425 38 5,214 7,235 6,402
Cash Receipts by Source 72,588 9,206 9,862 5,156 10,318 57,519 4,640 5,629 71,842 4,584 3,048 3,503 257,895 259,827 276,320
Other Cash Flows by Source
Transfer receipts - capital 22,369 – – – – 20,195 – – 5,223 – – – 47,786 63,550 65,925
Transfers and subsidies - capital (monetary
allocations) (National / Prov incial Departmental
Agencies, Households, Non-profit Institutions,
Priv ate Enterprises, Public Corporatons, Higher
Educational Institutions) & Transfers and
subsidies - capital (in-kind - all) – – 5,000 – – – – – – – – – 5,000 – –
Proceeds on disposal of PPE – – – – – – – – – – – –
Short term loans – – – – – – – – – – – –
Borrow ing long term/refinancing – – – – – – – – – – – –
Increase (decrease) in consumer deposits – – – – – – – – – – – –
Decrease (Increase) in non-current debtors – – – – – – – – – – – –
Decrease (increase) other non-current receiv ables – – – – – – – – – – – –
Decrease (increase) in non-current inv estments – – – – – – – – – – – –
Total Cash Receipts by Source 94,957 9,206 14,862 5,156 10,318 77,714 4,640 5,629 77,065 4,584 3,048 3,503 310,681 323,377 342,245
Medium Term Revenue and Expenditure
FrameworkBudget Year 2018/19

112
112
Cash Payments by Type
Employ ee related costs 9,970 9,670 8,570 8,970 8,970 8,990 8,970 8,970 8,980 8,970 8,970 8,264 108,265 113,084 118,803
Remuneration of councillors 1,316 1,403 1,403 1,403 1,403 1,403 1,403 1,403 1,403 1,403 1,403 1,414 16,757 17,762 18,828
Finance charges – – – – – – – – – – – – – 8,012 8,413
Bulk purchases - Electricity 2,163 2,819 2,916 2,965 2,482 2,872 2,564 2,524 2,301 2,414 2,017 1,964 30,000 41,674 44,174
Bulk purchases - Water & Sew er – – – – – – – – – – – – – – –
Other materials 248 332 150 335 360 266 350 156 563 985 156 469 4,370 34,800 36,888
Contracted serv ices 1,059 1,059 1,059 1,059 1,059 1,059 1,059 1,059 1,059 1,059 1,059 1,059 12,705 7,132 7,560
Transfers and grants - other municipalities – – – – – – – – – – – – –
Transfers and grants - other – – – – – – – – – – – – – – –
Other ex penditure 5,074 3,074 1,044 8,074 6,074 9,074 8,074 9,074 1,974 10,074 14,074 3,932 79,611 34,008 31,445
Cash Payments by Type 19,829 18,356 15,141 22,805 20,347 23,663 22,419 23,185 16,279 24,904 27,678 17,102 251,708 256,472 266,111
Other Cash Flows/Payments by Type
Capital assets 7,434 8,589 7,475 6,794 9,245 4,163 5,462 3,127 2,909 1,491 1,500 1,919 60,107 68,182 70,597
Repay ment of borrow ing – – – – – – – – – – – – – – –
Other Cash Flow s/Pay ments – – – – – – – – – – – – – –
Total Cash Payments by Type 27,262 26,946 22,616 29,599 29,592 27,826 27,881 26,312 19,187 26,395 29,178 19,021 311,814 324,654 336,708
NET INCREASE/(DECREASE) IN CASH HELD 67,695 (17,740) (7,754) (24,443) (19,273) 49,887 (23,241) (20,683) 57,877 (21,811) (26,130) (15,518) (1,133) (1,278) 5,537
Cash/cash equiv alents at the month/y ear begin: 51,697 119,392 101,652 93,898 69,455 50,182 100,069 76,828 56,145 114,022 92,211 66,082 51,697 50,564 49,286
Cash/cash equiv alents at the month/y ear end: 119,392 101,652 93,898 69,455 50,182 100,069 76,828 56,145 114,022 92,211 66,082 50,564 50,564 49,286 54,823

113
113
2.11 The following table shows the service delivery budget implementation plan

114
114
LIM351 Blouberg - Supporting Table SA26 Budgeted monthly revenue and expenditure (municipal vote)
Description Ref
R thousand July August Sept. October November December January February March April May JuneBudget Year
2018/19
Budget Year
+1 2019/20
Budget Year
+2 2020/21
Revenue by Vote
Vote 1 - Ex ecutiv e and council 6,935 1 1 6,935 1 1 1 2 1 1 1 2 13,881 – –
Vote 2 - Finance and Administration 86,756 63 1,693 1,693 638 35,241 639 1,254 69,117 1,503 1,453 2,677 202,727 216,709 231,909
Vote 3 - Community Serv ices – – 1,089 – 500 1,500 – 1,000 – – 415 4,504 – –
Vote 4 - Public and Safety 432 442 488 674 461 455 633 425 923 904 562 951 7,350 7,443 7,890
Vote 5 - Waste Management 72 82 72 72 92 72 92 105 72 102 72 158 1,060 840 882
Vote 6 - Technical administration and Trading serv ices 2,309 1,070 2,857 1,821 1,910 1,562 4,533 3,309 5,834 3,045 2,452 7,361 38,064 48,612 50,352
Vote 7 - Roads and Transport 20,369 – – – – 20,244 – – 2,878 – – – 43,491 44,350 46,725
Vote 8 - Planning and Dev elopment 250 900 500 300 120 150 160 105 150 250 250 270 3,405 5,422 4,486
Vote 9 - [NAME OF VOTE 9] – – – – – – – – – – – – – – –
Vote 10 - [NAME OF VOTE 10] – – – – – – – – – – – – – – –
Vote 11 - [NAME OF VOTE 11] – – – – – – – – – – – – – – –
Vote 12 - [NAME OF VOTE 12] – – – – – – – – – – – – – – –
Vote 13 - [NAME OF VOTE 13] – – – – – – – – – – – – – – –
Vote 14 - [NAME OF VOTE 14] – – – – – – – – – – – – – – –
Vote 15 - [NAME OF VOTE 15] – – – – – – – – – – – – – – –
Total Revenue by Vote 117,123 2,558 6,699 11,495 3,221 58,224 7,557 5,201 79,975 5,805 4,790 11,833 314,481 323,377 342,245
Budget Year 2018/19Medium Term Revenue and Expenditure
Framework

115
115
Expenditure by Vote to be appropriated
Vote 1 - Ex ecutiv e and council 6,385 6,315 7,305 6,385 7,185 6,005 5,000 4,385 5,385 4,125 5,385 4,444 68,304 59,530 57,056
Vote 2 - Finance and Administration 10,807 10,807 10,807 10,807 10,807 10,807 10,807 10,807 10,807 10,807 10,807 14,046 132,927 140,599 144,007
Vote 3 - Community Serv ices 1,556 1,556 1,556 1,556 1,556 1,556 1,556 1,556 1,556 1,556 1,556 2,056 19,174 14,238 15,089
Vote 4 - Public and Safety 1,220 1,220 1,220 1,220 1,220 1,220 1,220 1,220 1,220 1,220 1,220 1,220 14,637 15,516 16,446
Vote 5 - Waste Management 106 186 96 186 186 125 186 186 205 186 186 127 1,960 2,364 2,506
Vote 6 - Technical administration and Trading serv ices 3,560 3,960 3,860 3,560 3,760 3,060 3,560 3,900 3,560 3,960 3,560 3,650 43,955 45,468 51,402
Vote 7 - Roads and Transport 670 700 740 640 680 740 640 690 740 640 610 890 8,377 8,637 11,275
Vote 8 - Planning and Dev elopment 927 927 927 1,007 927 927 927 907 927 927 927 967 11,228 11,796 12,503
Vote 9 - [NAME OF VOTE 9] – – – – – – – – – – – – – – –
Vote 10 - [NAME OF VOTE 10] – – – – – – – – – – – – – – –
Vote 11 - [NAME OF VOTE 11] – – – – – – – – – – – – – – –
Vote 12 - [NAME OF VOTE 12] – – – – – – – – – – – – – – –
Vote 13 - [NAME OF VOTE 13] – – – – – – – – – – – – – – –
Vote 14 - [NAME OF VOTE 14] – – – – – – – – – – – – – – –
Vote 15 - [NAME OF VOTE 15] – – – – – – – – – – – – – – –
Total Expenditure by Vote 25,232 25,672 26,512 25,362 26,322 24,441 23,897 23,652 24,401 23,422 24,252 27,400 300,562 298,146 310,285
Surplus/(Deficit) before assoc. 91,892 (23,114) (19,813) (13,866) (23,101) 33,783 (16,340) (18,451) 55,574 (17,617) (19,461) (15,567) 13,920 25,231 31,959
Tax ation – – – – – – – – – – – – – – –
Attributable to minorities – – – – – – – – – – – – – – –
Share of surplus/ (deficit) of associate – – – – – – – – – – – – – – –
Surplus/(Deficit) 1 91,892 (23,114) (19,813) (13,866) (23,101) 33,783 (16,340) (18,451) 55,574 (17,617) (19,461) (15,567) 13,920 25,231 31,959

116
116
2.12 Contract having future budgetary implication
Blouberg Local Municipality does not have Contract having future budgetary implication
2.13 Capital expenditure details
2.13.1 New assets
The budget for capital expenditure estimated to be R28.6 million. This budget consist of the purchase of
Computers, Vehicles, Furniture and Equipment, construction of halls, and roads
The funding for capital expenditure would be as follows
R41.3 million from MIG grant
R 4.2 million from INEP grant
R9.0 million internally generated fund
Internally generated funds would be funded by the income received / generated from municipal
operating revenue (property rate, rentals etc.) which is not committed to any purpose. Internal
generated funds would fund the following assets
2.13.2 Renewal of existing assets and Repairs and Maintenance
The total of renewal of existing assets and Repairs and Maintenance is amounting to R 0.800 million
both roads and electricity.

117
117
The following are details of capital expenditure.
BUDGET 201819
CAPITAL FUNDING : MIG
DESCRIBTION AMOUNT COMMUNITY ASSETS- IU C: ACQUISITION CRECHE: TOWERFONTEIN 2,000,000
COMMUNITY ASSETS - IU C: ACQUISITION COMMUNITY HALL 500,000
ROADS INFRA - IU C: ACQUISITION SENWABARWANA PHASE 9 6,998,125
ROADS INFRA - IU C: ACQUISITION SENWABARWNNA PHASE 10 6,998,125
ROADS INFRA - IU C: ACQUISITION KROEMHOEK PHASE 3 6,325,000
ROADS INFRA - IU C: ACQUISITION KROMHOEK PHASE 4 6,325,000
ROADS ASSETS - IU C: ACQUISITION AVON 7,850,200
OTHER ASSETS - IU C: ACQUISITION SENWABARWANA SPORTS 6,820,200
TOTAL 43,816,650
BUDGET 201819
CAPITAL FUNDING :INP
DESCRIBTION AMOUNT
EL IU C - LV NETWORKS:ACQUISITION : ELECTRIFICATION WITTEN EXT 7 3,300,000
EL IU C - LV NETWORKS:ACQUISITION : ELECTRIFICATION RAWESHI 154,000
EL IU C - LV NETWORKS:ACQUISITION : ELECTRIFICATION CRACOUUW 280,000
EL IU C - LV NETWORKS:ACQUISITIONMIL : ELECTRIFICATION OLDLONSIGN EXT 140,000
EL IU C - LV NETWORKS:ACQUISITION : Electrification EARLYDAWN EXT 280,000
EL IU C - LV NETWORKS:ACQUISITION :ELECTRIFICATION LEKGWARA EXT 147,000

118
118
TOTAL 4,301,000
2.14 Legislation compliance status
Every municipality is required by Acts to develop and adopt its Budget through the legal framework
provided. In order to comply with the MFMA implementation requirement have been adhered to through
the following activities:
In year reporting Reporting to National Treasury in electronic format was fully complied with on a monthly basis. Section 71 reporting to the Executive Mayor (within 10 working days) has done and includes monthly published financial performance on the Blouberg’s website has progressively improved. Internship programme The Blouberg is participating in the Municipal Financial Management Internship programme since 2005 and has employed five interns undergoing training in various divisions of the Financial Services Department. From 2005 interns three are permanently appointed as managers, three as accountant and five as clerks. Minimum competence level Municipal manager and all senior manages the are attending the MFMA certificate and also budget and treasury officials. Budget and Treasury Office The Budget and Treasury Office has been established in accordance with the MFMA. Audit and Risk Committee An Audit Committee has been established and is fully functional.

119
119
Annual Report Annual report is compiled in terms of the MFMA and National Treasury requirements. Policies An amendment of the municipal policies has done .

120
120
2.14 Other supporting documents
2.14.1. Draft IDP
2.14.2 Draft SDBIP
2.14.3 Budget tables schedule A

121
121
Municipality does not have long –term borrowing in the next coming three years and the past
four years.
➢ SA 21 Transfers and grant made by the municipality.
There is no transfer and grand made by the municipality.
➢ SA 31 Municipality does not have entities
Municipality does not have entities.
➢ SA 32 List of external mechanism
Municipality does not have external mechanism
➢ SA 33 Contract having future budgetary implications
Municipality does not have contract having future budgetary implications.
➢ SA 34b Capital expenditure on the renewal of existing assets by assets of class.
The capital expenditure on the renewal of existing assets of class is amount to R 2,1 million for
roads and Electricity.

122
122
Municipal Manager‘s quality certification.
QUALITY CERTIFICATE
I Machaba Junias Municipal Manager of Blouberg Local Municipality., hereby certify that the Annual
budget 2018/19 financial year and supporting documentation have been prepared in accordance with
the Municipal Finance Management Act and the regulation made under the Act .
Print Name: Machaba M. J
Municipal Manager of Blouberg Municipality: Lim351
Signature..................................................
Date.......................................