like symptoms using only basic clinical data. Coronavirus ...
29
Page 1/29 Development of Machine Learning models to predict RT- PCR results for Severe Acute Respiratory Syndrome Coronavirus 2 (SARS-CoV-2) in patients with inuenza- like symptoms using only basic clinical data. Thomas Langer ( [email protected] ) Universita degli Studi di Milano-Bicocca https://orcid.org/0000-0002-9725-8520 Martina Favarato Universita degli Studi di Milano-Bicocca Scuola di Medicina e Chirurgia Riccardo Giudici Azienda Socio Sanitaria Territoriale Grande Ospedale Metropolitano Niguarda Gabriele Bassi niguard Roberta Garberi Universita degli Studi di Milano-Bicocca Scuola di Medicina e Chirurgia Fabiana Villa Universita degli Studi di Milano-Bicocca Scuola di Medicina e Chirurgia Hedwige Gay Universita degli Studi di Milano-Bicocca Scuola di Medicina e Chirurgia Anna Zeduri Universita degli Studi di Milano-Bicocca Scuola di Medicina e Chirurgia Sara Bragagnolo Universita degli Studi di Milano-Bicocca Scuola di Medicina e Chirurgia Alberto Molteni Universita degli Studi di Milano-Bicocca Scuola di Medicina e Chirurgia Andrea Beretta Azienda Socio Sanitaria Territoriale Grande Ospedale Metropolitano Niguarda Matteo Corradin Azienda Socio Sanitaria Territoriale Grande Ospedale Metropolitano Niguarda Mauro Moreno Azienda Socio Sanitaria Territoriale Grande Ospedale Metropolitano Niguarda Chiara Vismara Azienda Socio Sanitaria Territoriale Grande Ospedale Metropolitano Niguarda Carlo Federico Perno Azienda Socio Sanitaria Territoriale Grande Ospedale Metropolitano Niguarda Massimo Buscema University of Colorado Denver Enzo Grossi
Transcript of like symptoms using only basic clinical data. Coronavirus ...

Page 1/29
Development of Machine Learning models to predict RT-PCR results for Severe Acute Respiratory SyndromeCoronavirus 2 (SARS-CoV-2) in patients with in�uenza-like symptoms using only basic clinical data.Thomas Langer ( [email protected] )
Universita degli Studi di Milano-Bicocca https://orcid.org/0000-0002-9725-8520Martina Favarato
Universita degli Studi di Milano-Bicocca Scuola di Medicina e ChirurgiaRiccardo Giudici
Azienda Socio Sanitaria Territoriale Grande Ospedale Metropolitano NiguardaGabriele Bassi
niguardRoberta Garberi
Universita degli Studi di Milano-Bicocca Scuola di Medicina e ChirurgiaFabiana Villa
Universita degli Studi di Milano-Bicocca Scuola di Medicina e ChirurgiaHedwige Gay
Universita degli Studi di Milano-Bicocca Scuola di Medicina e ChirurgiaAnna Zeduri
Universita degli Studi di Milano-Bicocca Scuola di Medicina e ChirurgiaSara Bragagnolo
Universita degli Studi di Milano-Bicocca Scuola di Medicina e ChirurgiaAlberto Molteni
Universita degli Studi di Milano-Bicocca Scuola di Medicina e ChirurgiaAndrea Beretta
Azienda Socio Sanitaria Territoriale Grande Ospedale Metropolitano NiguardaMatteo Corradin
Azienda Socio Sanitaria Territoriale Grande Ospedale Metropolitano NiguardaMauro Moreno
Azienda Socio Sanitaria Territoriale Grande Ospedale Metropolitano NiguardaChiara Vismara
Azienda Socio Sanitaria Territoriale Grande Ospedale Metropolitano NiguardaCarlo Federico Perno
Azienda Socio Sanitaria Territoriale Grande Ospedale Metropolitano NiguardaMassimo Buscema
University of Colorado DenverEnzo Grossi

Page 2/29
Bracco SPARoberto Fumagalli
Universita degli Studi di Milano-Bicocca Scuola di Medicina e Chirurgia
Original research
Keywords: Severe Acute Respiratory Syndrome Coronavirus 2, Emergency Service, Hospital, Pandemics, CriticalCare, Arti�cial Intelligence, Supervised Machine Learning
Posted Date: September 14th, 2020
DOI: https://doi.org/10.21203/rs.3.rs-38576/v2
License: This work is licensed under a Creative Commons Attribution 4.0 International License. Read FullLicense
Version of Record: A version of this preprint was published on December 1st, 2020. See the published version athttps://doi.org/10.1186/s13049-020-00808-8.

Page 3/29
AbstractBackground: Reverse Transcription-Polymerase Chain Reaction (RT-PCR) for Severe Acute Respiratory SyndromeCoronavirus 2 (SARS-COV-2) diagnosis currently requires quite a long time span. A quicker and more e�cientdiagnostic tool in emergency departments could improve management during this global crisis. Our main goalwas assessing the accuracy of arti�cial intelligence in predicting the results of RT-PCR for SARS-COV-2, usingbasic information at hand in all emergency departments.
Methods: This is a retrospective study carried out between February 22, 2020 and March 16, 2020 in one of themain hospitals in Milan, Italy. We screened for eligibility all patients admitted with in�uenza-like symptoms testedfor SARS-COV-2. Patients under 12 years old and patients in whom the leukocyte formula was not performed inthe ED were excluded. Input data through arti�cial intelligence were made up of a combination of clinical,radiological and routine laboratory data upon hospital admission. Different Machine Learning algorithmsavailable on WEKA data mining software and on Semeion Research Centre depository were trained using both theTraining and Testing and the K-fold cross-validation protocol.
Results: Among 199 patients subject to study (median [interquartile range] age 65 [46-78] years; 127 [63.8%] men),124 [62.3%] resulted positive to SARS-COV-2. The best Machine Learning System reached an accuracy of 91.4%with 94.1% sensitivity and 88.7% speci�city.
Conclusion: Our study suggests that properly trained arti�cial intelligence algorithms may be able to predictcorrect results in RT-PCR for SARS-COV-2, using basic clinical data. If con�rmed, on a larger-scale study, thisapproach could have important clinical and organizational implications.
BackgroundAt the end of 2019, an outbreak of pneumonia, of unknown origin at the time, turned out to have stemmed fromWuhan, Hubei, China and consequently spread throughout the world, reaching Italy in February 2020 (1-3).
A new betacoronavirus, subsequently named Severe Acute Respiratory Syndrome Coronavirus 2 (SARS-COV-2),was identi�ed as the cause of the epidemic (4). The infection with SARS-COV-2 has, in humans, a broad spectrumof clinical presentations (5) and was named Coronavirus Disease 2019 (COVID-19). Initial symptoms arenonspeci�c and similar to other seasonal viral diseases, which entail fever, dry cough and fatigue. This could leadto a fairly impossible clinical diagnosis. Therefore, etiological diagnosis relies on Reverse Transcription-Polymerase Chain Reaction (RT-PCR) to detect the genome of SARS-COV-2.
There are several important limitations to RT-PCR. First, current techniques take up to 6-8 hours in order to obtainplausible results and often laboratories cannot handle the overload. Second, not all hospitals have the equipmentand staff to run tests 24/7. Consequently, swabs are sent out to other facilities, thus slowing down the processand swamping central laboratories. Third, RT-PCR, on a retropharyngeal swab, may result falsely negative in theinitial phase of the disease, in spite of the presence of typical symptoms (6-8). Last of all, this technique carries acertain cost, which could mean a considerable �nancial burden weighing upon both health systems and patients.
A direct consequence of these limitations is the time spent by a large number of patients awaiting results in theemergency department before a decision can be taken as to where admit them to, e.g. in wards and intensive careunits focused on COVID-19 patients, or in “non-infective” wards of the hospital (9-13). This is particularly

Page 4/29
troublesome for critically ill patients requiring immediate endotracheal intubation and mechanical ventilation.Specialized medical staff need to attend to these patients in emergency departments where, however, the healthsystem is already under a lot of pressure.
Finding an easy and fast method of predicting positivity or negativity to SARS-COV-2, would prove to be of greatclinical value. Algorithms have already been proposed using advanced imaging, e.g. chest computed tomography(CT) (14, 15). However, not all hospitals or countries can carry out a CT scan on every patient.
The main goal of our study was therefore to develop a machine learning model to predict the results of RT-PCR forSARS-COV-2 using only basic clinical, radiological and routine laboratory data at hand in all emergencydepartments.
We hypothesized that using Arti�cial Neural Networks (ANNs), and other Machine Learning Systems (MLS), wouldallow to obtain accurate results on RT-PCR testing for SARS-COV-2 and that these systems could possibly beapplied in the future. The performance of different ANNs and MLS was analyzed so as to distinguish betweenpatients resulting positive or negative to SARS-COV-2, thus identifying those variables which express themaximum amount of relevant information.
MethodsStudy design and selection of Participants
This retrospective, single centre study, was approved by the Institutional Review Board of our hospital (N°3733).The need for informed consent from individual patients was waived owing to the retrospective nature of the study.While not developed speci�cally for models using machine learning (16), the study followed the guidelines of theTransparent reporting of a multivariable prediction model for individual prognosis or diagnosis (TRIPOD) (17).”
All patients admitted to the emergency department of our hospital between February 22, 2020 and March 16,2020, were screened for eligibility. Symptoms of presentation compatible with COVID-19 (fever, sore throat, cough,dyspnoea, chest pain, headache, syncope, asthenia, arthralgia, diarrhoea, nausea and vomit) constituted theinclusion criteria. Age < 12 years and absence of evaluation of the leukocyte formula (de�ned as percentages ofthe �ve types of leukocytes: neutrophils, lymphocytes, eosinophils, basophils and monocytes) in the emergencydepartment constituted exclusion criteria.
Data collection
Clinical data regarding the admission to the emergency department were retrieved from the Patient DataManagement System of our hospital. Data included age, gender, presence and type of comorbidities, reportedsymptoms and medication currently being taken. Each drug was placed in a speci�c category.
In our hospital, there is no formal checklist to collect the medical and medication history. Therefore, if speci�ed bythe ER physicians, comorbidities and medication use were considered as present, otherwise if not speci�ed, theywere considered as absent. In addition, information regarding vital signs upon admission to the emergencydepartment (�rst measurement), presence and type of ventilatory support, routinely performed blood tests, major

Page 5/29
electrocardiographic characteristics (presence of sinus rhythm and ST abnormalities) and chest X-rays (presenceof any type of parenchymal involvement, presence of pleural effusion) were collected.
The results of the RT-PCR swab for SARS-COV-2 were recorded. Should the outcome have proved negative in asymptomatic patient, our hospital made it mandatory for a second swab to be carried out after 48 hours andthese swabs were checked to con�rm negativity. The complete list of collected variables is summed up in Table 1.
Table 1. Variables under study (n=74)

Page 6/29
Demographic Data
Age (years)
Sex (M; F)
Medical History (yes; no)
Asthma
Atrial �brillation
Autoimmune/in�ammatory disease
Chronic Interstitial lung disease
Chronic kidney disease
Chronic liver disease
Chronic obstructive pulmonary disease (COPD)
Diabetes mellitus
Hematologic malignancy
Human immunode�ciency virus
Hypertension
Ischemic cardiomyopathy
Smoking (active)
Solid organ tumor
Medication history (yes; no)
5-alpha-reductase inhibitors
Angiotensin converting enzyme inhibitor
Anti-arrhythmic drugs
Antibiotics before Emergency Department
Anticoagulant therapy
Anti-epileptic therapy
Anti-platelets therapy
Beta blocker
Calcium channel antagonist
Diuretics
Drugs for psychiatric disorders

Page 7/29
Hydroxymethylglutaryl-CoA reductase inhibitors
Immunosuppressant drugs
Sartans
Reported Signs and Symptoms (yes; no)
Arthralgia
Asthenia
Chest pain
Cough
Dyspnea
Fever
Gastrointestinal symptoms
Headache
Sore throat
Syncope
Vital signs, ECG and Chest X-ray �ndings
Glasgow coma scale, score (3-15)
Body temperature, Celsius
Systolic blood pressure, mmHg
Diastolic blood pressure, mmHg
Heart rate, beats per min
Sinus rhythm no. (%)
Normal ST segment no. (%)
Respiratory rate, breaths per min
Oxygen supplementation no. (%)
Non-Invasive Ventilation no. (%)
Chest X-rays opacity no. (%)
Chest X-rays pleural effusion no. (%)
Laboratory �ndings
Total white blood cell count, 103/µL
Neutrophils, %

Page 8/29
Lymphocytes, %
Monocytes, %
Eosinophils, %
Basophils, %
Total red blood cells count, 106/µL
Haematocrit, %
Haemoglobin, g/dL
Mean corpuscular haemoglobin concentration, g/dL
Mean corpuscular haemoglobin, pg
Mean red blood cell volume, µm3
Red blood cells distribution width,%
Platelets, 103/µL
Glycaemia, mg/dL
Creatinine, mg/dL
Urea, mg/dL
Sodium, mEq/L
Total bilirubin, mg/dL
C-reactive protein, mg/dL
Swab test for SARS-COV-2 (TARGET)
Negative (yes; no)
Positive (yes; no)
Medical and medication history and reported sign and symptoms were collected by physicians in the EmergencyRoom. Clinical �ndings refer to data gathered in the Emergency Room at hospital admission.
Statistical analysis and sample size
All data were tested for consistency with variance and normality of distribution using the Shapiro-Wilk test.Normally distributed data were expressed as mean ± standard deviation, while non-normally distributed data werereported as median and interquartile range. Binary data were summed up in percentages, frequency of occurrence,

Page 9/29
and compared through Chi-Square test. Continuous variables were compared through Student T-Test or WilcoxonRank-Sum test, as appropriate.
Pearson's and Spearman’s correlation was used to assess the correlation between collected variables (continuousand nominal, respectively) and RT-PCR for SARS-COV-2 results. A P-value lower than 0.05 was considered asstatistically signi�cant. Analysis was performed with SigmaPlot v.12.0 (Systat Software Inc., USA).
The study was carried out on a convenience sample of 200 patients admitted to the emergency department andtested for SARS-COV-2.
Machine Learning Methods
Training and Testing validation protocol
The target variable to be predicted was the result of the RT-PCR for SARS-COV-2 performed in the emergencydepartment. In order to predict and estimate the results of the RT-PCR for SARS-COV-2 using an input of 74variables under study (Table 1), different Machine Learning algorithms available on WEKA data mining software(18-20) and on Semeion Research Centre depository (Massimo Buscema, Deep Supervised ANNs, Semeion SW#12, version 33.0, 1999-2019) were trained. These classi�cation tools were �rst applied to predict RT-PCR resultsusing the Training and Testing validation protocol, with the following steps:
1. Subdivision of the dataset into two sub-samples, A and B, each containing 50% of records and having anequal proportion of cases and controls (in our case SARS-COV-2 positive and SARS-COV-2 negative). The twosub-samples were obtained through the application of the TWIST algorithm, (i.e. they were not obtained byrandom extraction), in order to create two subsamples with similar probability density for all the inputvariables (see below). A homogeneity check was performed to con�rm the substantial equivalence of the twosubsets with regard to the distribution of variables. In the �rst run, A was used as Training Set and B asTesting Set.
2. Application of ANN on the Training Set. In this phase, the ANN learned to associate the input variables withthose indicated as targets.
3. After the training phase, the weights matrix produced by the algorithm was saved and frozen together with allparameters used for the training.
4. The Testing Set was then shown to a virgin twin (same architecture and base parameters) ANN with the sameweights matrix of the trained ANN, acting as �nal classi�er. This operation took place for all records and theresults (right or wrong classi�cation) was not communicated to the classi�er. This allowed to assess thegeneralization ability of trained ANN.
5. In a second run, another virgin ANN was applied to subset B which was used as training subset and then tosubset A which was used as testing subset.
�. Therefore, the results are relevant to two sequences of training testing protocol: A-B and B-A.
Results were drawn up in terms of sensitivity (correct classi�cation of positive patients), speci�city (correctclassi�cation of negative patients), global accuracy (arithmetic mean between sensitivity and speci�city). Overallresults are expressed as average of the two experiments. This crossover procedure allows to classify blindly allrecords with the trained algorithm ensuring the generalization capability of the model on records never seenbefore.
Page 10/29
The machine learning algorithms developed at the University of Waikato, New Zealand, available on the WEKAdata mining software are listed in Table 2 (21-27), while two ANNs (Self Momentum Back Propagation and SineNet) (28, 29) were implemented in “Supervised ANNs Software”, developed at the Semeion Research Center inRome, Italy (Buscema; Supervised ANNs. Semeion software #12, version 33.0). Table 3 shows the main featuresof Semeion Machine Learning Systems.
Table 2. Nicknames of Machine Learning Systems in WEKA software Package.
Machine Learning software Nick name
Logistic (21) Logistic
Pruned decision tree (22) J 48
Multi Layer Perceptron (24) MLP
NaivBayes (23) NaivBayes
RandomForest (25) RandomForest
RotationForest (26) RotationForest
Sequential Minimal Optimization (27) SMO
K Nearest Neighborhood (30) KNN47
Additive Logistic Regression (31) Logit Boost48
Table 3. Main Features of Semeion Machine Learning Systems employed in the study.

Page 11/29
ANNsArchitecture
Hidden layers LearningRate
Epochs Initialization OutputFunction
Nick name
Conic Net (32) 5 Layers=
4x12x12x12
0.01 1000 Auto-encoders
Soft Max D_FF_Conic(4x12x12x12)
5 Layers=
6x12x12x12
0.01 1000 Auto-encoders
Soft Max D_FF_Conic(6x12x12x12)
Sine Net (33-35) 1 Layer= 48 0.1 2000 Random Soft Max D_FF_Sn (48)
Back Propagation(28)
0 Layer= L 0.1 1000 Random Soft Max D_FF_Bp (0)
1 Layer= 24 0.1 1000 Random Soft Max D_FF_Bp
(24)
5 Layers=
16x16x16x16
0.01 2000 Auto-encoders
Soft Max D_FF_Bp
(16x16x16x16)
Bi-Modal Net 1 Layer= 48 0.1 1000 Random Soft Max D_FF_Bm
(48)
Gauss Net (36) 1 Layer= 64 0.01 1000 Random Soft Max D_FF_GNet
(64)
However, since noisy input attributes can sometimes hide the small meaningful information embedded in otherattributes, a pruning procedure was used as a pre-processing tool to eliminate noisy variables before the outcomeprediction of the main test. In order to conduct this procedure, an input selection algorithm named TWIST(Training With Input Selection and Testing) was applied (37, 38). This selection algorithm was recently developedat the Semeion Research Center in Rome, Italy (Buscema M (2006-2012) TWIST Input Search, Semeion software#39, version 5.1, 2006-2016).
TWIST algorithm
As previously shown (39), the TWIST algorithm is a complex algorithm able to search for the best distribution ofthe global dataset divided in two optimally balanced subsets containing a minimum number of input features,useful for optimal pattern recognition. TWIST is an evolutionary algorithm based on a paper about GeneticDoping Systems (20), which has already been applied to medical data with very promising results (39-43). Adetailed description of the algorithm is available in the Online supplement.
Page 12/29
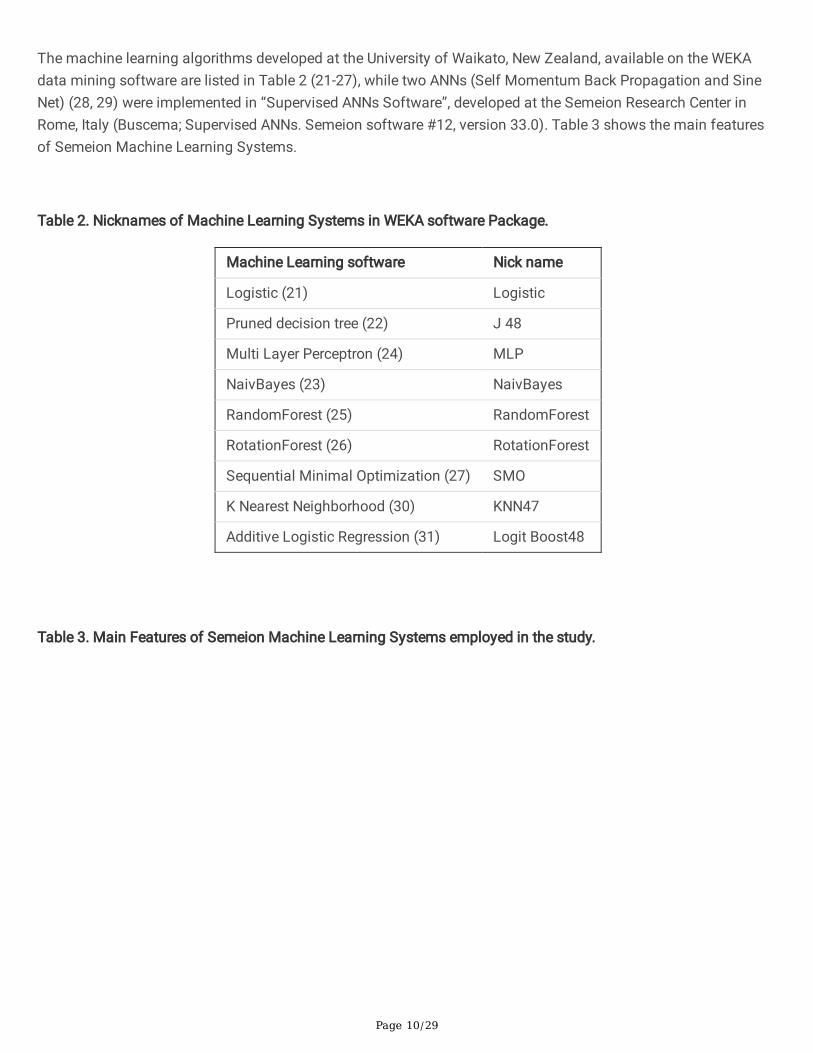
5-K-fold
In addition to the Training and Testing validation protocol, a 5 K-fold cross-validation protocol was applied (44), inorder to analyze data also with a standard and popular approach. The dataset was randomly split in 5 groups(folds) with a similar number of subjects. Each unique group was used as a hold out, or validation dataset, andthe remaining groups were used as training datasets. The model �tted on the training set was evaluated on thevalidation set. Five different models for each employed machine learning system were created, and each modelprovided an evaluation score. The skill of the 5 models was summarized as mean sensitivity, speci�city, overallaccuracy and balanced accuracy.
Assessment of model calibration
Cost Curves (45) were applied to the studied algorithms in order to assess model calibration (Results presented inthe Online Supplement).
ResultsThree hundred forty-seven patients ful�lled the inclusion criteria, 148 patients presented exclusion criteria (9patients <12 years, 139 patients without leukocyte formula), leaving 199 patients for the analysis.
Population description and classic statistics
Table 4 summarizes the main characteristics of the overall study population (n=199) and of the two subgroups,i.e. patients who tested positive (n=124) and negative (n=75) to SARS-COV-2. There were no missing dataregarding the recorded variables. A comparison between the characteristics of the study population (n=199) andof patients excluded do to the absence of leukocyte formula (n=139) can be found in the Online Data Supplement(Table S3).
Table 4. Characteristics of the study population.

Page 13/29
Demographic characteristics Overall
population(n=199)
Positive
(n=124)
Negative
(n=75)
P
Age, years 65 [46-78] 65 [49-77] 66 [38-82] 0.94
Male no. (%) 127 (63.8) 78 (62.9) 49 (65.3) 0.85
Medical History no. (%)
Asthma 13 (6.6) 9 (7.3) 4 (5.4) 0.83
Atrial �brillation 19 (9.6) 11 (8.9) 8 (10.7) 0.87
Autoimmune/in�ammatory disease 6 (3.0) 3 (2.4) 3 (4) 0.84
Chronic Interstitial lung disease 1 (0.5) 1 (0.8) 0 (0.0) 0.80
Chronic kidney disease 11 (5.5) 8 (6.5) 3 (4.0) 0.68
Chronic liver disease 7 (3.5) 3 (2.4) 4 (5.3) 0.49
Chronic obstructive pulmonary disease 15 (7.5) 5 (4.0) 10 (13.3) 0.03
Diabetes mellitus 29 (14.6) 16 (12.9) 13 (17.3) 0.51
Hematologic malignancy 6 (3.0) 4 (3.2) 2 (2.7) 0.84
Human immunode�ciency virus 1 (0.5) 0 (0.0) 1 (1.3) 0.80
Hypertension 85 (42.7) 55 (44.4) 30 (40) 0.65
Ischemic cardiomyopathy 19 (9.6) 10 (8.1) 9 (12.0) 0.51
Smoking (active) 12 (6.0) 4 (3.2) 8 (10.7) 0.07
Solid organ tumour 16 (8.0) 7 (5.7) 9 (12.0) 0.18
Medication history no. (%)
5-alpha-reductase inhibitors 12 (6.0) 9 (7.3) 3 (4.0) 0.53
Angiotensin converting enzyme inhibitors 33 (16.6) 21 (16.9) 12 (16.0) 0.98
Anti-arrhythmic drugs 11 (5.5) 6 (4.8) 5 (6.7) 0.82
Antibiotics before Emergency Department 47 (23.6) 36 (29.0) 11 (14.7) 0.03
Anticoagulant drugs 25 (12.6) 15 (12.1) 10 (13.3) 0.97
Anti-epileptic drugs 10 (5.0) 1 (0.8) 9 (12.0) 0.002
Antiplatelets drugs 33 (16.6) 20 (16.1) 13 (17.3) 0.98
Beta blockers 40 (20.1) 24 (19.4) 16 (21.3) 0.88
Calcium channel antagonists 27 (13.6) 18 (14.5) 9 (12.0) 0.77
Diuretics 35 (17.6) 21 (16.9) 14 (18.7) 0.91
Drugs for psychiatric disorders 7 (3.5) 1 (0.8) 6 (8.0) 0.02

Page 14/29
Hydroxymethylglutaryl-CoA (HMG-CoA) reductase inhibitors
28 (14.1) 18 (14.5) 10 (13.3) 0.98
Immunosuppressant drugs 12 (6.0) 8 (6.5) 4 (5.3) 0.99
Sartans 24 (12.1) 19 (15.3) 5 (6.7) 0.11
Reported Signs and Symptoms - no. (%)
Arthralgia 7 (3.5) 6 (4.8) 1 (1.3) 0.37
Asthenia 18 (9.1) 9 (7.3) 9 (12.0) 0.38
Chest pain 7 (3.5) 7 (5.7) 0 (0.0) 0.09
Cough 130 (65.3) 91 (73.4) 39 (52) 0.004
Dyspnea 75 (37.7) 43 (34.7) 32 (42.7) 0.33
Fever 174 (87.4) 119 (96.0) 55 (73.3) <0.001
Gastrointestinal symptoms 27 (13.6) 18 (14.5) 9 (12.0) 0.77
Headache 12 (6.0) 8 (6.5) 4 (5.3) 0.99
Sore throat 8 (4.0) 3 (2.4) 5 (6.7) 0.27
Syncope 5 (2.5) 2 (1.6) 3 (4.0) 0.57
Vital signs, ECG and Chest X-ray �ndings
Glasgow coma scale, score (3-15) 15 [15-15] 15 [15-15] 15 [15-15] >0.99
Body temperature, Celsius 37.6 ± 0.9 37.8 ± 0.8 37.2 ± 1 <0.001
Systolic blood pressure, mmHg 131 ± 22 133 ± 19 128 ± 25 0.09
Diastolic blood pressure, mmHg 75 [65-80] 75 [70-80] 70 [65-80] 0.09
Heart rate, beats per min 90 [80-105] 90 [83- 105] 90 [80-105] 0.87
Sinus rhythm no. (%) 185 (93) 117 (94.4) 68 (90.7) 0.48
Normal ST segment no. (%) 198 (99.5) 123 (99.2) 75 (100.0) 0.80
Respiratory rate, breaths per min 18 [16-22] 18 [16-22] 18 [16-24] 0.80
Oxygen supplementation no. (%) 51 (25.6) 27 (21.8) 24 (32.0) 0.15
Non-Invasive Ventilation no. (%) 8 (4.0) 4 (3.2) 4 (5.3) 0.72
Chest X-rays opacity no. (%) 158 (79.4) 104 (83.9) 54 (72.0) 0.07
Chest X-rays pleural effusion no. (%) 20 (10.1) 7 (5.7) 13 (17.3) 0.01
Laboratory �ndings
Total white blood cell count, 103/µL 6.64 [4.65-9.65] 5.44 [4.21-7.23]
9.28 [6.87-13.64]
<0.001
Neutrophils, % 72.5 [64.4-81.7] 70.4 [62.5-79.9]
76.7 [68.4-85.3]
0.001

Page 15/29
Lymphocytes, % 18.0 [10.5-25.1] 20.6 [12.9-27.7]
14.5 [7.4-19.8]
<0.001
Monocytes, % 7.9 [5.6-10.2] 8.0 [6-10.9] 7.6 [5.4-9.7] 0.18
Eosinophils, % 0 [0-0.3] 0 [0-0.2] 0.2 [0-1.2] <0.001
Basophils, % 0.3 [0.2-0.4] 0.2 [0.2-0.4] 0.3 [0.2-0.5] 0.03
Total red blood cells count, 106/µL 4.80 [4.29-5.25] 4.88 [4.42-5.28]
4.52 [4.01-5.14]
0.01
Haematocrit, % 41.6 ± 5.3 42.1 ± 4.5 40.8 ± 6.3 0.10
Haemoglobin, g/dL 13.7 ± 1.9 14.0 ± 1.6 13.3 ± 2.2 0.01
Mean corpuscular haemoglobin concentration,g/dL
33.1 [32-33.9] 33.2 [32.5-34.1]
32.8 [31.6-33.8]
0.01
Mean corpuscular haemoglobin, pg 29.2 [28.1-30.5] 29.2 [27.9-30.5]
29.3 [28.6-30.2]
0.56
Mean red blood cell volume, µm3 88.3 [85.4-91.4] 87.7 [84.5-90.4]
89.7 [87-92.6]
0.002
Red blood cells distribution width,% 13.2 [12.4-14.4] 13.1 [12.3-13.9]
13.6 [12.5-15.5]
0.01
Platelets, 103/µL 193 [162-244] 183 [145-234]
221 [175-283]
<0.001
Glycaemia, mg/dL 120 [104-142] 120 [104-138]
117 [101-158]
0.80
Creatinine, mg/dL 1.0 [0.8-1.3] 0.98 [0.82-1.21]
1.09 [0.83-1.45]
0.19
Urea, mg/dL 35 [23-54.5] 34 [22-49] 41.5 [26-64.5]
0.07
Sodium, mEq/L 138 [135-140] 138 [134-140]
138 [136-141]
0.37
Total bilirubin, mg/dL 0.5 [0.4-0.7] 0.5 [0.3-0.6] 0.5 [0.4-0.7] 0.05
C-reactive protein, mg/dL 4.1 [1.2-9] 4.0 [1.3-8.9] 4.5 [0.9-9.3] 0.90
Variables are ordered by categories. Continuous variables are expressed as median [interquartile range] or mean ±Standard Deviation, as appropriate. Medical and medication history, reported signs and symptoms were collectedfrom physicians of the Emergency Department. Clinical �ndings (Vital signs, ECG – Electrocardiogram, Chest X-ray and Laboratory �ndings) refer to the �rst measurements performed in the Emergency department.
Median age in the overall population was 65 [46-78] years, with similar distribution in the two subgroups (65 [49-77] vs. 66 [38-82] years p=.94, for positive and negative patients, respectively). Most patients were male (63.8%)with no signi�cant difference between the two subgroups (62.9% vs. 65.3%, p=.85). The most commoncomorbidities were hypertension (42.7%) and diabetes (14.6%) with similar prevalence between patients with and

Page 16/29
without SARS-COV-2. A lower prevalence of Chronic obstructive pulmonary disease (COPD) was observed inpatients with COVID-19 (4.0% vs. 13.3% p=.03).
Regarding current medications, positive patients had lower chronic use of anti-epileptics and drugs for psychiatricdisorders, as compared to patients that tested negative (0.8% vs. 12.0%, p=.002 and 0.8% vs. 8.0%, p=.02,respectively). Furthermore, administration of antibiotics before access to the emergency department was higher inthe positive subgroups (29.0% vs. 14.7%, p=.03).
As for reported signs and symptoms, fever and coughing were more prevalent in patients with COVID-19 (96.0%vs. 73.3%, p<.001 and 73.4% vs. 52.0%, p=.004, respectively).
Several clinical �ndings turned out to be signi�cantly different between the two population studies (Table 4). Inparticular, SARS-COV-2 positive patients had a slightly higher external body temperature (37.8 ± 0.8 vs. 37.2 ± 1.0,p=<.001), lower prevalence of pleural effusion at chest X-ray (5.7% vs. 17.3%, p=.01) and a signi�cant differenceregarding the complete blood count and leukocyte formula (Table 4).
Table 5 summarizes the positive and negative linear correlation index between descriptive variables and theresults of RT-PCR for SARS-COV-2.
Table 5 Study variables positively and negatively correlated with SARS-COV-2 positivity. Asterisks indicatevariables included in the TWIST model.

Page 17/29
Positive linear correlation
VARIABLES PearsonR
VARIABLES PearsonR
*Fever 0.33 *Sinus Rhythm 0.06
*Body temperature (degree Celsius) 0.27 *Chronic kidney disease 0.05
Lymphocytes percentage 0.26 *Monocytes percentage 0.05
Cough 0.22 Hypertension 0.04
*Total red blood cells count (106/µL) 0.19 Asthma 0.04
*Haemoglobin (g/dL) 0.17 *Age 0.04
Glasgow coma scale (GCS) 0.17 Gastrointestinal symptoms 0.04
*Antibiotics before EmergencyDepartment
0.16 *Calcium channel antagonist 0.04
*Chest pain 0.15 Mean corpuscular haemoglobinconcentration (%)
0.03
*Chest X-rays opacity 0.14 Respiratory rate (breaths/min) 0.03
*Sartans 0.13 *Female 0.02
*Systolic blood pressure (mmHg) 0.12 *Headache 0.02
Haematocrit (%) 0.12 *Immunosuppressant drugs 0.02
Arthralgia 0.09 *Hydroxymethylglutaryl-CoA (HMG-CoA)
reductase inhibitors
0.02
*Diastolic blood pressure (mmHg) 0.07 Hematologic malignancy 0.02
P wave present and normal 0.07 *Angiotensin converting enzyme inhibitor 0.01
*5-alpha-reductase inhibitors 0.07 Heart rate (beats per minute) 0.00
Chronic Interstitial lung disease 0.06
Negative linear correlation
VARIABLES PearsonR
VARIABLES PearsonR
*Total white blood cells count (103/µL)
-0.46 *Dyspnoea -0.07
*Eosinophils percentages -0.34 *Ischemic cardiomyopathy -0.06
Platelets (103/µL) -0.33 *Basophils percentage -0.06
*Anti-epileptic therapy -0.25 Diabetes mellitus -0.06
*Calcium (mg/dL) -0.22 Creatinine (mg/dL) -0.06
Mean red blood cell volume (µm3) -0.21 *Mean corpuscular haemoglobin (pg) -0.06

Page 18/29
(µ )
Neutrophils percentages -0.19 *Non Invasive Ventilation -0.05
*Drugs for psychiatric disorders -0.19 Autoimmune/in�ammatory disease -0.04
*Chest X-rays pleural effusion -0.19 Red blood cells distribution width (%) -0.04
*Chronic obstructive pulmonarydisease
-0.17 Anti-arrhythmic drugs -0.04
*Smoking (active) -0.15 Syncope -0.04
*Urea (mg/dL) -0.14 Glycaemia (mg/dL) -0.03
*Total bilirubin (mg/dL) -0.14 *Diuretics -0.03
Oxygen supplementation -0.11 Atrial �brillation -0.03
*Solid organ tumour -0.11 C-reactive protein (mg/dL) -0.03
*Sore throat -0.10 *Male -0.02
Human Immunode�ciency Virus -0.09 Beta blocker -0.02
Asthenia -0.08 Anticoagulant therapy -0.02
Chronic liver disease -0.08 *Anti-platelets therapy -0.02
*Sodium (mEq/L) -0.07
Variables were divided according to their positive or negative correlation to the target variable (positivity of RT-PCRfor SARS-COV-2) and are listed in decreasing order of positive or negative correlation coe�cient, respectively.Asterisks indicate variables included in the TWIST model.
Prediction of the PCR Outcome with Machine Learning Algorithms
The TWIST system selected 42 variables of the original attributes. Selected variables are marked with and asteriskin Table 5. A global dataset of 42 input and 2 target attributes was thus generated. Thereafter, two optimalsubsets were created, in order to apply the training and testing procedure described above.
Table 6 shows the results obtained by the application of an array of machine learning systems to the variablesselected by TWIST system. These results are the average of two training-testing procedures (A-B and B-Asequences). Detailed predictive results for each experiment (A-B and B-A) is available in Table S1 in the OnlineSupplement.
Table 6 Predictive results with variables selection using Semeion (*) and WEKA (**) Machine learning systems.

Page 19/29
Machine learning system Sensitivity Speci�city Overallaccuracy
Balancedaccuracy
Variance PPV
AUROC
D_FF_Conic(4x12x12x12)* 94.1 88.7 91.4 92.2 0.5 93.5 0.90
D_FF_Conic(6x12x12x12)* 92.5 90.2 91.3 91.7 0.0 94.1 0.91
D_FF_Bp(24) * 89.2 93.0 91.1 90.6 1.0 95.6 0.93
D_FF_Bp(16x16x16x16)* 93.2 88.7 91.0 91.7 1.0 93.4 0.92
D_FF_GNet(64)* 90.7 90.2 90.5 90.6 1.0 94.0 0.90
D_FF_Sn(48)* 91.7 88.9 90.3 90.6 1.0 93.2 0.92
D_FF_Bm(48)* 91.6 88.9 90.2 90.6 1.0 93.2 0.91
D_FF_Conic(48)* 91.6 88.7 90.2 90.6 0.0 93.3 0.92
D_FF_Bp(0)* 89.1 90.3 89.7 89.6 2.1 93.8 0.91
MLP** 81.0 84.8 82.9 82.3 3.1 89.8 0.90
RandomForest** 86.6 65.3 75.9 78.7 1.6 80.6 0.86
NaiveBayes** 85.8 64.5 75.1 78.1 4.2 81.0 0.83
RotationForest** 88.3 60.8 74.6 78.1 0.0 79.1 0.85
Logistic** 80.7 67.9 74.3 76.0 1.0 80.8 0.63
LogitBoost** 81.0 61.2 71.1 73.4 1.6 77.6 0.81
J48** 77.4 60.7 69.0 71. 4 0.5 77.0 0.57
SMO** 96.8 27.9 62.4 70.3 9.9 61.5 0.65
kNN** 75.9 36.5 56.2 60.9 2.6 66.6 0.56
Employed machine learning systems are listed in decreasing order of overall accuracy. The results are theaverage of two testing experiments with training-testing A-B and B-A sequence. A hundred cases werepresented in subset A and ninety-nine cases in subset B. Overall accuracy = Arithmetic average of sensitivityand speci�city; Balanced accuracy = Weighted average of sensitivity and speci�city; PPV = Positive PredictiveValue; AUROC = Area Under the Receiver Operator Curve. Sensitivity, Speci�city, Overall accuracy, Balancedaccuracy, Variance and PPV are all expressed as percentage.
The best machine learning system reached ad accuracy of 91.4% with 94.1% sensitivity (correct prediction ofpositivity to SARS-COV-2) and 88.7% speci�city (correct prediction of negativity to SARS-COV-2).
Table 7 shows the results obtained through applying a selected number of machine learning systems to thevariables selected by the TWIST system. These results are the average of �ve Training-Testing procedures of a K-fold cross-validation protocol. Detailed predictive results for each experiment are available in Table S2 in theOnline Supplement.

Page 20/29
Table 7. Predictive results with 5-K fold protocol, using Semeion (*) and WEKA (**) machine learning systems.
Machine learning system Sensitivity Speci�city Overallaccuracy
Balancedaccuracy
Variance PPV
AUROC
D_FF_Conic(6x12x12x12)* 89.2 86.2 87.7 88.0 2.6 92.1 0.86
D_FF_Conic(4x12x12x12)* 87.5 84.6 86.0 86.5 3.4 91.0 0.84
D_FF_Sn(48)* 88.3 83.2 85.8 86.4 4.3 90.4 0.85
D_FF_Bp(24) * 88.3 77.6 83.0 84.3 6.0 87.1 0.81
RandomForest** 90.0 58.0 74.0 78.1 3.2 78.9 0.83
Logistic** 82.5 62.5 72.5 75.1 5.6 79.7 0.74
Employed machine learning systems are listed in decreasing order of overall accuracy. The results are theaverage of �ve testing experiments. Overall accuracy = Arithmetic average of sensitivity and speci�city;Balanced accuracy = Weighted average of sensitivity and speci�city; PPV = Positive Predictive Value; AUROC =Area Under the Receiver Operator Curve. Sensitivity, Speci�city, Overall accuracy, Balanced accuracy, Varianceand PPV are all expressed as percentage.
DiscussionIn our exploratory, model development study, we analyzed data of 199 adult patients admitted to the emergencydepartment of the largest hospital in Milan, Lombardy, with symptoms compatible with COVID-19 during the �rst 3weeks of SARS-COV-2 outbreak in Italy. In the present manuscript, we describe this population and highlight thedifferences between patients who actually tested positive to SARS-COV-2 and those who did not. Few attempts inapplying arti�cial intelligence to rapidly predict positivity/negativity to SARS-COV-2 were made since the outbreak,using mostly CT imaging and lab results, collected in Chinese population (46-48). Nevertheless, we present the�rst European attempt and promising results applying arti�cial intelligence to predict the results of RT-PCR forSARS-COV-2, using only basic clinical data, available in the vast majority of emergency departments all over theworld. The wide application of a similar decision support tool could have a major clinical and organizationalimpact during the current pandemic.
In our study, several differences were observed between the two study groups (Table 4). However, none of these, ora combination of them, allows, so far, to clearly differentiate between patients with COVID-19 and patients withother diseases, having a similar clinical presentation. Our data underline the key �nding of Coronavirus-inducedalterations in the white blood cell differential count (Table 4). On the one hand, in contrast to other reports (49-52)we did not observe a marked lymphocytopenia, possibly because of the early stage of the viral disease. On theother, other subtypes such as eosinophils might play a key role in COVID-19 (53).
When applying arti�cial intelligence to our dataset, in particular ANNs and MLS, we were able to predict with highsensitivity and speci�city the results of RT-PCR for SARS-COV-2 (Table 6).

Page 21/29
Arti�cial Neural Networks allow forecasting through understanding of the relationship between variables, inparticular through the application of nonlinear relationships (39, 54, 55). These systems initially learn from a setof data with a known solution (training). Thereafter, the networks, inspired by the analytical processes of thehuman brain, are able to reconstruct imprecise rules, which may be underlying a complex dataset (testing).Machine learning systems and, in particular, ANNs analyse real-world data very e�ciently. The internal validity oftheir assessment is provided by uniquely strict validation protocols, seldom used in classical statistics (54, 56,57).
In the present manuscript, it was possible to predict with reasonable accuracy the status of being positive ornegative to SARS-COV-2 based on 42 simple variables. This was achieved using the TWIST algorithm, which doesnot have, at the moment, the same popularity of other techniques, such as K Fold, Boosting and others.Nevertheless, it has been used extensively in the past 15 years in different contexts (58-60). The reason of its lowdiffusion is partly that TWIST is very complex to program, as it includes two evolutionary algorithms that worktogether managing a huge population of ANNs, kNN and Naive Bayes algorithms. The execution of TWIST needstherefore to be programmed in C language to be su�ciently fast. Thus, for its complexity and for needed runningtime, TWIST is not suitable for programming in Phyton, R or similar languages.
TWIST system allowed reaching a global accuracy of 91.4% with the best machine learning system: 94.1%sensitivity (correct prediction of positivity to SARS-COV-2) and 88.7% speci�city (correct prediction of negativity toSARS-COV-2). Considering the eight best machine-learning systems their average performance was the following:sensitivity of 91.8%, speci�city of 89.6% and global accuracy of 90.8%.
Comparing the two testing procedures (A-B and B-A), explained in the mathematical section, the differences inpredicting values between these two experiment is small, therefore reasonably excluding over�tting of the model(17). Furthermore, also the Cost Curves performed to assess mode calibration have shown acceptable results(Figures S2-S5 of the Online Supplement)
In order to analyze our dataset also with a more popular and widely applied procedure, we applied a 5 k-fold cross-validation protocol, using a selected number of machine learning systems (Table 7). With this type of analysis, thebest machine learning system obtained an overall accuracy of 87.7% with a sensibility and speci�city of 89.2%and 86.2%, respectively. Global average performance was the following: sensitivity of 87.6%, speci�city of 75.4%and a global accuracy of 81.5%.
Comparing these results with those obtained by the same machine learning systems, using the AB -BA Train-Testing protocol (shown in Table 6), the latter allows to obtain slightly better predictive results, reasonably relatedto the optimal splitting of the records, with an average performance of 89.1% speci�city, 82.2% speci�city and85.7% global accuracy. The high variance of results obtained with the K-Fold protocol and the low variance of thesame results using TWIST protocol is suggestive of the high polarization affecting the K-Fold protocol with thiskind of data. This is the reason why we have chosen to rely on an optimized distribution of records in training andtesting subsets, rather than on a random allocation. Nevertheless, also the application of a standard K-fold cross-validation, i.e. a system widely available, was able to predict accurately the results of RT-PCR for SARS-COV-2.
It is useful to analyse variables selected by AI, as they certainly bear speci�c clinical information. As mentionedabove, the white blood cells and their differential count are certainly very informative.

Page 22/29
Indeed, total white blood cell count (R = -0.46), lymphocytes (R = 0.26) and eosinophils (R = -0.34) correlated eithernegatively or positively with the presence of COVID-19 and were included in the model.
In addition, the �nal model included also variables with very low correlation with RT-PCR results, such as dyspnea(R= -0.07), basophils (R =-0.06), mean cell haemoglobin (R = -0.06), non-invasive ventilation (R = -0.05),monocytes (R = 0.05), age (R= 0.04), female sex (R= 0.02) and headache (R = 0.02). The fact that these variableshave been included in the model con�rms the ability of ANN to handle highly nonlinear functions.
Other authors have applied AI for the diagnosis of SARS-COV-2. Rao et al. employed an AI framework to a mobilephone-based survey, exclusively based on pre-hospital clinical symptoms and demographic characteristics toassess the probability of SARS-COV-2 infection (61). Three different research groups tried to predict positivity toSARS-COV-2 using, among other variables, CT scans (15, 46, 62). Chest CT scan was analysed via deep learningby Li et al. to differentiate SARS-COV-2 induced viral pneumonia from other lung diseases (63). Two otherresearch groups developed machine learning models and online applications, using only lab test results (47, 48).
Our model signi�cantly differs from the abovementioned. First, it relies on basic clinical information, available inalmost every emergency department. The required information is quickly obtainable for every patient at hospitaladmission. For this reason, we decided to include chest X-Ray rather than CT in our model. Indeed, despite CTbeing certainly more sensitive in identifying alterations typical of viral pneumonia (14), not every SARS-COV-2suspect will have access to a CT scan. Second, our study is the �rst one analysing data from a European country.While there is no evidence so far, it is possible that different ethnicities will show slightly different responses toviral invasion.
Limitations
This exploratory study has certainly several limitations. First, it is a retrospective, single-center study. Second, thestudy was conducted on a convenience sample of 200 patients. This aspect has two important implications: i) inthis exploratory model development study no formal a priori sample size determination was performed and ii) thesmall sample size and the high number of input variables bear an intrinsic risk of over-�tting (64). An additionallimitation is the high exclusion rate (40%), potentially leading to a selection bias. However, the main reason forpatients’ exclusion was the lack of data regarding the leukocyte formula. This exam was not part of the standardbiochemical panel in our emergency department at the beginning of the pandemic. The clinical implications ofthis laboratory exam became quickly evident and the test was therefore frequently added to the biochemical panellater on in the pandemic. In light of this explanation and of the comparison between included and excludedpatients (Table S3) we think that it is safe to exclude the presence of a selection bias. Furthermore, fororganizational issues we were not able to perform an external validation, which certainly would have strengthenedour results. In addition, some fundamental clinical data, such as arterial blood gas analysis were not available forall patients and this information was thus not included in the model. Given the typical profound hypoxemia ofpatients with COVID-19, it is conceivable that adding these variables to the system could further improve itsaccuracy. Finally, while no de�nitive data are available regarding the accuracy of RT-PCR testing for SARS-COV-2(65), several studies have described a certain percentage of false negative results (6-8). However, every negativeresult was re-tested after 48 hours. This methodological aspect should reduce the risk of falsely negative results.

Page 23/29
Possible clinical and organizational implications
Facing a highly contagious viral outbreak requires a complex effort in terms of political, economic, social andhealth systems re-organization (66, 67). A fundamental aspect is to de�ne a clear management protocol, in orderto separate infected from non-infected patients, i.e., those admitted for other clinical conditions. Indeed, it is ofparamount importance to set up clearly separate pathways, in order to avoid the spread of viral infections withinthe hospital. A quick and reliable system to identify SARS-COV-2 infected patients is therefore fundamental.Currently, the gold standard for the diagnosis is a RT-PCR assay searching for SARS-COV-2 genome (10). This typeof molecular assay has certainly several limitations. During the �rst month of outbreak in Italy, the processing ofsamples became more e�cient, theoretically reducing the technical time needed for the result. Despite this, theproblem of delayed diagnosis still exists. This is due to the availability RT-PCR machines, considering the highdemand during the outbreak. Furthermore, laboratories of referral hospitals, such as ours, analyse samples alsoarriving from smaller hospitals not equipped for SARS-COV-2 testing. Finally, of course, RT-PCR is not a perfecttest, and false negative result have been described, even in the presence of strong clinical suspicion for COVID-19(6-8).
For these reasons, applying AI as a rapid decision support tool for the diagnosis of COVID-19 and therefore tospeed up the sorting of infected from non-infected patients would be of great clinical help. Indeed, a simple onlinesoftware, fed with basic clinical data, easily obtainable in almost every emergency department, could applytrained ANNs to predict with high accuracy the RT-PCR result. The results obtained from this software should ofcourse be integrated with available clinical data.
The application of AI to clinical practice is still limited for its complexity and for limited in-hospital availability oftechnical infrastructures and support. This, of course, could be particular troublesome for small centres withlimited resources. The decision support software that could integrate the information contained in the presentmanuscript could ideally retrieve data directly from the electronic patient management system. Otherwise, datacould be manually entered in an online software, which however signi�cantly increases the risk of errors. An activesupport from and collaboration with the local information technology infrastructure is therefore fundamental inorder to be able, in the future, to integrate AI into clinical practice.
Finally, it is conceivable that the information obtained from the present study might be useful also at the end ofthe current pandemic. Indeed, it is likely that SARS-COV-2 might become a seasonal virus. In this regard, the earlyidenti�cation would be a key factor to reduce the risk of a further epidemic outbreak.
ConclusionsIn summary, our exploratory study suggests that basic clinical data might be su�cient for properly trained ANNsand MLS algorithms to predict with good accuracy the positivity and negativity to SARS-COV-2. If con�rmed inlarger multicentre studies, this could have important clinical and organizational implications. Indeed, while notdirectly changing the treatment of COVID-19 patients, it could reduce the time patients spend unnecessarily in theemergency department awaiting the results of RT-PCR, could reduce the workload of intensive care staff and,�nally, reduce the risk of collapsing healthcare systems.
List Of Abbreviations

Page 24/29
ANNs: Arti�cial Neural Networks
CT: Computed Tomography
COPD: Chronic obstructive pulmonary disease
COVID-19: Coronavirus Disease 2019
MLS: Machine Learning Systems
RT-PCR: Reverse Transcription- Polymerase Chain Reaction
SARS-COV-2: Severe Acute Respiratory Syndrome Coronavirus 2
TWIST: Training With Input Selection and Testing
DeclarationsEthics approval and consent to participate
This study was approved by the Institutional Review Board of our hospital (N°3733). The need for informedconsent from individual patients was waived owing to the retrospective nature of the study and considering thecomplete data anonymization.
Consent for publication
This study was approved by the Institutional Review Board of our hospital (N°3733). The need for informedconsent from individual patients was waived owing to the retrospective nature of the study and considering thecomplete data anonymization.
Availability of data and materials
The dataset analysed during the current study is available from the corresponding author on reasonable request.
Competing interests
The authors declare that they have no competing interests relevant to the manuscript.
Funding
This research did not receive any grant from funding agencies in the public, commercial or not-for-pro�t sectors.
Authors' contributions
All authors contributed to the study conception and design. Material preparation, data collection and analysiswere performed by TL, MF, RG, FV, HG, EG, AM, AZ, SB, MB. The �rst draft of the manuscript was written by TL, MF,EG, FV, RG, AM and all authors commented on previous versions of the manuscript. All authors read and approvedthe �nal manuscript.
Acknowledgements

Page 25/29
The authors wish to acknowledge Dr. Arturo Chieregato (Department of Anaesthesia and Intensive Care Medicine,Niguarda Ca' Granda, Milan, Italy), Dr. Massimo Puoti (Department of Infectious Disease, Niguarda Ca' Granda,Milan, Italy) and the following collaborators for their help and important contribution in data analysis: GiuliaMassini and Francesca della Torre, Semeion Research Center of Sciences of Communication, Rome, Italy. Finally,the authors wish to thank Mrs. Convery Geraldine for proofreading this manuscript.
References1. WHO. Pneumonia of unknown cause – China 2020 [cited 2020 28 February]. Available from:
https://www.who.int/csr/don/05-january-2020-pneumonia-of-unkown-cause-china/en/.
2. Grasselli G, Zangrillo A, Zanella A, Antonelli M, Cabrini L, Castelli A, et al. Baseline Characteristics andOutcomes of 1591 Patients Infected With SARS-CoV-2 Admitted to ICUs of the Lombardy Region, Italy. JAMA.2020.
3. Grasselli G, Greco M, Zanella A, Albano G, Antonelli M, Bellani G, et al. Risk Factors Associated With MortalityAmong Patients With COVID-19 in Intensive Care Units in Lombardy, Italy. JAMA internal medicine. 2020.
4. Zhu N, Zhang D, Wang W, Li X, Yang B, Song J, et al. A Novel Coronavirus from Patients with Pneumonia inChina, 2019. N Engl J Med. 2020;382(8):727-33.
5. Mission W-CJ. Report of the WHO-China Joint Mission on Coronavirus Disease 2019 (COVID-19) 2020 [cited2020 10 March]. Available from: https://www.who.int/publications-detail/report-of-the-who-china-joint-mission-on-coronavirus-disease-2019-(covid-19).
�. Li Q, Guan X, Wu P, Wang X, Zhou L, Tong Y, et al. Early Transmission Dynamics in Wuhan, China, of NovelCoronavirus-Infected Pneumonia. N Engl J Med. 2020.
7. Guo L, Ren L, Yang S, Xiao M, Chang, Yang F, et al. Pro�ling Early Humoral Response to Diagnose NovelCoronavirus Disease (COVID-19). Clin Infect Dis. 2020.
�. Lippi G, Simundic AM, Plebani M. Potential preanalytical and analytical vulnerabilities in the laboratorydiagnosis of coronavirus disease 2019 (COVID-19). Clin Chem Lab Med. 2020.
9. Grasselli G, Zangrillo A, Zanella A, Antonelli M, Cabrini L, Castelli A, et al. Baseline Characteristics andOutcomes of 1591 Patients Infected With SARS-CoV-2 Admitted to ICUs of the Lombardy Region, Italy. Jama.2020;323(16):1574-81.
10. Wu Z, McGoogan JM. Characteristics of and Important Lessons From the Coronavirus Disease 2019 (COVID-19) Outbreak in China: Summary of a Report of 72314 Cases From the Chinese Center for Disease Controland Prevention. JAMA. 2020.
11. Chen N, Zhou M, Dong X, Qu J, Gong F, Han Y, et al. Epidemiological and clinical characteristics of 99 casesof 2019 novel coronavirus pneumonia in Wuhan, China: a descriptive study. Lancet. 2020;395(10223):507-13.
12. Drosten C, Gunther S, Preiser W, van der Werf S, Brodt HR, Becker S, et al. Identi�cation of a novel coronavirusin patients with severe acute respiratory syndrome. N Engl J Med. 2003;348(20):1967-76.
13. Cui J, Li F, Shi ZL. Origin and evolution of pathogenic coronaviruses. Nat Rev Microbiol. 2019;17(3):181-92.
14. Ai T, Yang Z, Hou H, Zhan C, Chen C, Lv W, et al. Correlation of Chest CT and RT-PCR Testing in CoronavirusDisease 2019 (COVID-19) in China: A Report of 1014 Cases. Radiology. 2020:200642.
15. Mei X, Lee H-C, Diao K-y, Huang M, Lin B, Liu C, et al. Arti�cial intelligence–enabled rapid diagnosis ofpatients with COVID-19. Nature Medicine. 2020.

Page 26/29
1�. Collins GS, Moons KGM. Reporting of arti�cial intelligence prediction models. Lancet. 2019;393(10181):1577-9.
17. Collins GS, Reitsma JB, Altman DG, Moons KG. Transparent reporting of a multivariable prediction model forindividual prognosis or diagnosis (TRIPOD): the TRIPOD statement. BMJ (Clinical research ed).2015;350:g7594.
1�. Hall M, Frank E, Holmes G, Pfahringer B, Reutemann P, Witten I. The WEKA data mining software: An update.SIGKDD Explor Newsl. 2008;11:10-8.
19. Buscema M, Grossi E, Intraligi M, Garbagna N, Andriulli A, Breda M. An optimized experimental protocol basedon neuro-evolutionary algorithms application to the classi�cation of dyspeptic patients and to the predictionof the effectiveness of their treatment. Artif Intell Med. 2005;34(3):279-305.
20. Buscema M. Genetic doping algorithm (GenD): theory and applications. Expert Systems. 2004;21(2):63-79.
21. W. HD, Stanley L. Applied Logistic Regression 2000.
22. J. R, Quinlan. C4.5: Programs for Machine Learning: Morgan Kaufmann Publishers Inc.; 1993.
23. George H. John, Langley P. Estimating Continuous Distributions in Bayesian Classi�ers. 2013.
24. Collobert R, Bengio S. Links between Perceptrons, MLPs and SVMs. Icml ’04. 2004:23.
25. F L. Implementing Breiman’s Random Forest Algorithm into Weka 2005.
2�. Rodriguez JJ, Kuncheva LI, Alonso CJ. Rotation forest: A new classi�er ensemble method. IEEE Trans PatternAnal Mach Intell. 2006;28(10):1619-30.
27. Keerthi SS, Gilbert EG. Convergence of a Generalized SMO Algorithm for SVM Classi�er Design.2002;46(1):351-60.
2�. Buscema M. Back propagation neural networks. Subst Use Misuse. 1998;33(2):233-70.
29. Buscema M, Terzi S, Breda M. Using sinusoidal modulated weights improve feed-forward neural networkperformances in classi�cation and functional approximation problems. 2006;3:885-93.
30. Wang J, Zucker J-d. Solving the multiple-instance problem: A lazy learning approach2000. 1119-26 p.
31. Friedman J, Hastie T, Tibshirani R. Additive Logistic Regression: A Statistical View of Boosting. 2000;28:337-407.
32. Buscema PM, Massini G, Fabrizi M, Breda M, Della Torre F. The ANNS approach to DEM reconstruction.Computational Intelligence. 2018;34(1):310-44.
33. Buscema M, Terzi S, Breda M. Improve Feed-Forward Neural Network Performances in Classi�cation andFunctional Approximation Problems. WSEAS Transactions on Information Science & Applications.2006;3(5):885-93.
34. Buscema M, inventorSine Net : an arti�cial neural network2003.
35. Buscema M, Terzi S, Breda M, editors. A feed Forward sine based neural network for functional approximationof a waste incinerator emissions. 8th WSEAS Int Conference on Automatic Control, Modeling and Simulation2006 March 12 th -14 th, 2006.; Praga.
3�. Buscema PM. Gauss Net Equations. Semeion Archives2015.
37. Buscema M, Breda M, Lodwick W. Training with Input Selection and Testing (TWIST) Algorithm: A Signi�cantAdvance in Pattern Recognition Performance of Machine Learning. Journal of Intelligent Learning Systemsand Applications. 2013;5:29-38.

Page 27/29
3�. Pace F, Riegler G, de Leone A, Pace M, Cestari R, Dominici P, et al. Is it possible to clinically differentiateerosive from nonerosive re�ux disease patients? A study using an arti�cial neural networks-assistedalgorithm. Eur J Gastroenterol Hepatol. 2010;22(10):1163-8.
39. Coppede F, Grossi E, Migheli F, Migliore L. Polymorphisms in folate-metabolizing genes, chromosomedamage, and risk of Down syndrome in Italian women: identi�cation of key factors using arti�cial neuralnetworks. BMC Med Genomics. 2010;3:42.
40. Lahner E, Intraligi M, Buscema M, Centanni M, Vannella L, Grossi E, et al. Arti�cial neural networks in therecognition of the presence of thyroid disease in patients with atrophic body gastritis. World J Gastroenterol.2008;14(4):563-8.
41. Buri L, Hassan C, Bersani G, Anti M, Bianco MA, Cipolletta L, et al. Appropriateness guidelines and predictiverules to select patients for upper endoscopy: a nationwide multicenter study. Am J Gastroenterol.2010;105(6):1327-37.
42. Street ME, Grossi E, Volta C, Faleschini E, Bernasconi S. Placental determinants of fetal growth: identi�cationof key factors in the insulin-like growth factor and cytokine systems using arti�cial neural networks. BMCPediatr. 2008;8:24.
43. Buscema M, Grossi E, Capriotti M, Babiloni C, Rossini P. The I.F.A.S.T. model allows the prediction ofconversion to Alzheimer disease in patients with mild cognitive impairment with high degree of accuracy. CurrAlzheimer Res. 2010;7(2):173-87.
44. Little M, Varoquaux G, Saeb S, Lonini L, Jayaraman A, Mohr D, et al. Using and understanding cross-validation strategies. Perspectives on Saeb et al. GigaScience. 2017;6.
45. Drummond C, Holte RC. Cost curves: An improved method for visualizing classi�er performance. MachineLearning. 2006;65(1):95-130.
4�. Feng C, Huang Z, Wang L, Chen X, Zhai Y, Zhu F, et al. A Novel Triage Tool of Arti�cial Intelligence AssistedDiagnosis Aid System for Suspected COVID-19 pneumonia In Fever Clinics. medRxiv.2020:2020.03.19.20039099.
47. Wu J, Zhang P, Zhang L, Meng W, Li J, Tong C, et al. Rapid and accurate identi�cation of COVID-19 infectionthrough machine learning based on clinical available blood test results. medRxiv.2020:2020.04.02.20051136.
4�. Meng Z, Wang M, Song H, Guo S, Zhou Y, Li W, et al. Development and utilization of an intelligent applicationfor aiding COVID-19 diagnosis. medRxiv. 2020:2020.03.18.20035816.
49. Li YX, Wu W, Yang T, Zhou W, Fu YM, Feng QM, et al. [Characteristics of peripheral blood leukocyte differentialcounts in patients with COVID-19]. Zhonghua nei ke za zhi. 2020;59(0):E003.
50. Zhang JJ, Dong X, Cao YY, Yuan YD, Yang YB, Yan YQ, et al. Clinical characteristics of 140 patients infectedwith SARS-CoV-2 in Wuhan, China. Allergy. 2020.
51. Wan S, Xiang Y, Fang W, Zheng Y, Li B, Hu Y, et al. Clinical Features and Treatment of COVID-19 Patients inNortheast Chongqing. Journal of Medical Virology.n/a(n/a).
52. Wang D, Hu B, Hu C, Zhu F, Liu X, Zhang J, et al. Clinical Characteristics of 138 Hospitalized Patients With2019 Novel Coronavirus-Infected Pneumonia in Wuhan, China. Jama. 2020.
53. Liu F, Xu A, Zhang Y, Xuan W, Yan T, Pan K, et al. Patients of COVID-19 may bene�t from sustained lopinavir-combined regimen and the increase of eosinophil may predict the outcome of COVID-19 progression. Int JInfect Dis. 2020.

Page 28/29
54. Vomweg TW, Buscema M, Kauczor HU, Teifke A, Intraligi M, Terzi S, et al. Improved arti�cial neural networksin prediction of malignancy of lesions in contrast-enhanced MR-mammography. Med Phys. 2003;30(9):2350-9.
55. Penco S, Grossi E, Cheng S, Intraligi M, Maurelli G, Patrosso MC, et al. Assessment of the role of geneticpolymorphism in venous thrombosis through arti�cial neural networks. Ann Hum Genet. 2005;69(Pt 6):693-706.
5�. Andriulli A, Grossi E, Buscema M, Festa V, Intraligi NM, Dominici P, et al. Contribution of arti�cial neuralnetworks to the classi�cation and treatment of patients with uninvestigated dyspepsia. Dig Liver Dis.2003;35(4):222-31.
57. Mecocci P, Grossi E, Buscema M, Intraligi M, Savare R, Rinaldi P, et al. Use of arti�cial networks in clinicaltrials: a pilot study to predict responsiveness to donepezil in Alzheimer's disease. J Am Geriatr Soc.2002;50(11):1857-60.
5�. Cosmi V, Mazzocchi A, Milani GP, Calderini E, Scaglioni S, Bettocchi S, et al. Prediction of Resting EnergyExpenditure in Children: May Arti�cial Neural Networks Improve Our Accuracy? Journal of clinical medicine.2020;9(4).
59. Buscema M, Grossi E, Intraligi M, Garbagna N, Andriulli A, Breda M. An Optimized Experimental ProtocolBased on Neuro-Evolutionary Algorithms. Application to the Classi�cation of Dyspeptic Patients and to thePrediction of the Effectiveness of Their Treatment. Arti�cial Intelligence in Medicine. 2005;34:279-305.
�0. Podda GM, Grossi E, Palmerini T, Buscema M, Femia EA, Della Riva D, et al. Prediction of high on-treatmentplatelet reactivity in clopidogrel-treated patients with acute coronary syndromes. International journal ofcardiology. 2017;240:60-5.
�1. Rao A, Vazquez JA. Identi�cation of COVID-19 Can be Quicker through Arti�cial Intelligence framework usinga Mobile Phone-Based Survey in the Populations when Cities/Towns Are Under Quarantine. Infect ControlHosp Epidemiol. 2020:1-18.
�2. Xiong Z, Fu L, Zhou H, Liu JK, Wang AM, Huang Y, et al. [Construction and evaluation of a novel diagnosisprocess for 2019-Corona Virus Disease]. Zhonghua Yi Xue Za Zhi. 2020;100(0):E019.
�3. Li L, Qin L, Xu Z, Yin Y, Wang X, Kong B, et al. Arti�cial Intelligence Distinguishes COVID-19 from CommunityAcquired Pneumonia on Chest CT. Radiology. 2020:200905.
�4. Wolff RF, Moons KGM, Riley RD, Whiting PF, Westwood M, Collins GS, et al. PROBAST: A Tool to Assess theRisk of Bias and Applicability of Prediction Model Studies. Annals of internal medicine. 2019;170(1):51-8.
�5. WHO. Coronavirus disease (COVID-19) technical guidance: Laboratory testing for 2019-nCoV in humans 2020[cited 2020 15 March]. Available from: https://www.who.int/emergencies/diseases/novel-coronavirus-2019/technical-guidance/laboratory-guidance.
��. Grasselli G, Pesenti A, Cecconi M. Critical Care Utilization for the COVID-19 Outbreak in Lombardy, Italy: EarlyExperience and Forecast During an Emergency Response. Jama. 2020.
�7. Spina S, Marrazzo F, Migliari M, Stucchi R, Sforza A, Fumagalli R. The response of Milan's Emergency MedicalSystem to the COVID-19 outbreak in Italy. The Lancet. 2020;395(10227):e49-e50.
Supplementary Files

Page 29/29
This is a list of supplementary �les associated with this preprint. Click to download.
STRED2000269OSMR1clean.docx