Lightweighting technology development and trends in U.S ... · LIGHTWEIGHTING TECHNOLOGY...
24
WWW.THEICCT.ORG © INTERNATIONAL COUNCIL ON CLEAN TRANSPORTATION, 2016 Lightweighting technology development and trends in U.S. passenger vehicles Authors: Aaron Isenstadt and John German (ICCT); Piyush Bubna and Marc Wiseman (Ricardo Strategic Consulting); Umamaheswaran Venkatakrishnan and Lenar Abbasov (SABIC); Pedro Guillen and Nick Moroz (Detroit Materials); Doug Richman (Aluminum Association); Greg Kolwich (FEV) Date: 16 December 2016 Keywords: Passenger vehicles, advanced technologies, lightweighting, fuel-efficiency, technology innovation Introduction In 2012, the U.S. Environmental Protection Agency (EPA) and the Department of Transportation’s National Highway Traffic Safety Administration (NHTSA) finalized a joint rule establishing new greenhouse gas and fuel economy standards for vehicles. 1 The standards apply to new passenger cars and light-duty trucks, model years 2012 through 2025. A mid-term review of the 2022–2025 standards is in process and will be finished by 2018 at the latest, and a proposed determination was released in late November 2016. Assuming the fleet mix remains unchanged, the standards require these vehicles to meet an estimated combined average fuel economy of 34.1 miles per gallon (mpg) in model year 2016, and 49.1 mpg in model year 2025, which equates to 54.5 mpg as measured in terms of carbon dioxide emissions with various credits for additional climate benefits available. The standards require an average 1 U.S. Environmental Protection Agency and National Highway Traffic Safety Administration, “EPA/NHTSA Final Rulemaking to Establish 2017 and Later Model Years Light-Duty Vehicle Greenhouse Gas Emissions and Corporate Average Fuel Economy Standards” (2012). https://www3.epa.gov/otaq/climate/regs- light-duty.htm#2017-2025 improvement in fuel economy of about 4.1 percent per year. The original technology assessments performed by the agencies to inform the 2017–2025 rule were conducted five years ago. The ICCT is now col- laborating with automotive suppliers on a series of working papers evaluating technology progress and new developments in engines, trans- missions, vehicle body design and lightweighting, and other measures that have occurred since then. Each paper will evaluate: WORKING PAPER 2016-25 Acknowledgements: Thanks to Sean Osborne and Joel Kopinsky from the ITB Group for their input and reviews. Design Aluminum Rulemaking Steel & Composite range Net Costs range 0% $0 Total Costs % weight reduction Summary Figure. Total cost as a function of percent vehicle weight reduction (composites include plastics, but not carbon fiber). The cost-effectiveness of aluminum is on track to meet the cost per percent weight reduction in the 2017–2025 rule, improved steels and composites are likely to reduce weight at little or no net cost, and design improvements reduce both weight and cost. Overall, the cost of reducing weight will likely be less than a third of the projections in the rule. When the multiple other benefits of reducing weight are also considered (ride, handling, braking, performance, load capacity), it becomes clear that increased use of lightweight materials and improved vehicle designs will be limited only by the speed at which computer-design tools improve and new materials can be brought to the market.
Transcript of Lightweighting technology development and trends in U.S ... · LIGHTWEIGHTING TECHNOLOGY...

WWW.THEICCT.ORG© INTERNATIONAL COUNCIL ON CLEAN TRANSPORTATION, 2016
Lightweighting technology development and trends in U.S. passenger vehiclesAuthors: Aaron Isenstadt and John German (ICCT); Piyush Bubna and Marc Wiseman (Ricardo Strategic Consulting);
Umamaheswaran Venkatakrishnan and Lenar Abbasov (SABIC); Pedro Guillen and Nick Moroz (Detroit Materials);
Doug Richman (Aluminum Association); Greg Kolwich (FEV)
Date: 16 December 2016
Keywords: Passenger vehicles, advanced technologies, lightweighting, fuel-efficiency, technology innovation
IntroductionIn 2012, the U.S. Environmental Protection Agency (EPA) and the Department of Transportation’s National Highway Traffic Safety Administration (NHTSA) finalized a joint rule establishing new greenhouse gas and fuel economy standards for vehicles.1 The standards apply to new passenger cars and light-duty trucks, model years 2012 through 2025. A mid-term review of the 2022–2025 standards is in process and will be finished by 2018 at the latest, and a proposed determination was released in late November 2016.
Assuming the fleet mix remains unchanged, the standards require these vehicles to meet an estimated combined average fuel economy of 34.1 miles per gallon (mpg) in model year 2016, and 49.1 mpg in model year 2025, which equates to 54.5 mpg as measured in terms of carbon dioxide emissions with various credits for additional climate benefits available. The standards require an average
1 U.S. Environmental Protection Agency and National Highway Traffic Safety Administration, “EPA/NHTSA Final Rulemaking to Establish 2017 and Later Model Years Light-Duty Vehicle Greenhouse Gas Emissions and Corporate Average Fuel Economy Standards” (2012). https://www3.epa.gov/otaq/climate/regs-light-duty.htm#2017-2025
improvement in fuel economy of about 4.1 percent per year.
The original technology assessments performed by the agencies to inform the 2017–2025 rule were conducted five years ago. The ICCT is now col-laborating with automotive suppliers
on a series of working papers evaluating technology progress and new developments in engines, trans-missions, vehicle body design and lightweighting, and other measures that have occurred since then. Each paper will evaluate:
WORKING PAPER 2016-25
Acknowledgements: Thanks to Sean Osborne and Joel Kopinsky from the ITB Group for their input and reviews.
Design
Aluminum
Rulemaking
Steel &Composite range
Net Costsrange
0%$0
Tota
l Co
sts
% weight reduction
Summary Figure. Total cost as a function of percent vehicle weight reduction (composites include plastics, but not carbon fiber). The cost-effectiveness of aluminum is on track to meet the cost per percent weight reduction in the 2017–2025 rule, improved steels and composites are likely to reduce weight at little or no net cost, and design improvements reduce both weight and cost. Overall, the cost of reducing weight will likely be less than a third of the projections in the rule. When the multiple other benefits of reducing weight are also considered (ride, handling, braking, performance, load capacity), it becomes clear that increased use of lightweight materials and improved vehicle designs will be limited only by the speed at which computer-design tools improve and new materials can be brought to the market.

LIGHTWEIGHTING TECHNOLOGY DEVELOPMENT AND TRENDS IN U.S. PASSENGER VEHICLES
2 INTERNATIONAL COUNCIL ON CLEAN TRANSPORTATION WORKING PAPER 2016-25
• How the current rate of progress (costs, benefits, market penetra-tion) compares to projections in the rule
• Recent technology develop-ments that were not considered in the rule and how they impact cost and benefits
• Customer acceptance issues, such as real-world fuel economy, performance, drivability, reliabil-ity, and safety.
This paper provides an analysis of lightweighting (mass reduction) deve lopments and t rends i n passenger vehic le design and technology. It is the product of a collaboration between ICCT, Ricardo Strategic Consulting, SABIC, FEV, Aluminum Association, and Detroit Materials. The paper relies on data from publicly available sources and data and information from the par-ticipating automotive suppliers.
BackgroundWeight/mass reduction differs fundamentally from the technolo-gies evaluated in the other working papers and technology briefs in this series.2 Engine, transmission, hybrid, and thermal management tech-nologies are all designed to reduce losses and increase the efficiency of the power train. In contrast, weight reduction reduces the load placed on the vehicle. Reduced load reduces the amount of energy (i.e., fuel) necessary to move the vehicle, regardless of the efficiency of the propulsion system, and increases acceleration, which is a function of force divided by mass.
Energy must be delivered to the wheels to overcome wind resistance and tire rolling resistance, and to accelerate the vehicle. Figure 1 illus-trates the energy requirements for combined city/highway driving on
2 For the collection of papers in this series, see http://www.theicct.org/series/us-passenger-vehicle-technology-trends.
the U.S. vehicle certification test cycles.3 Weight directly affects the power needed to accelerate the vehicle and the energy dissipated by the brakes (the lighter the vehicle, the less energy dissipated while braking) and to tire rolling resistance (rolling resistance is directly pro-portional to the weight on the tire).4 Thus, weight reduction has larger proportional impacts on the total vehicle load than aerodynamic or tire rolling resistance improvements.
Weight reduction also improves performance. A secondary way to improve efficiency is to downsize the engine to maintain constant performance, as smaller engines are more efficient. Numerous studies have indicated that a 10% weight reduction can reduce fuel con-sumption by 6%–7% if the engine is downsized to maintain constant
3 U.S. EPA, “Where the Energy Goes: Gasoline Vehicles,” accessed July 2016, http://www.fueleconomy.gov/feg/atv.shtml.
4 Jim Francfort and Richard Carlson (2013), Vehicle Mass Impact on Vehicle Losses and Fuel Economy. Presented at 2013 Department of Energy (DOE) Vehicle Technologies Program Annual Merit Review, 14 May 2013, Washington, DC. Project ID LM070.
performance and by 4%–5% if the engine is not downsized.
Th is report focuses on mass reduction while keeping approxi-mately constant vehicle size, safety, and performance.
TECHNOLOGY HISTORY
Steel has been the primary material used in vehicles for decades. As shown in Figure 2, the proportions of plastics and aluminum have gradually increased over t ime, but unti l recently they were used primarily for independent components, such as bumpers (plastics) and engines (aluminum) that had little impact on safety and noise, vibration, and harshness (NVH).
The key technology breakthrough for advanced materials and improved l ightwe ight des ign has been computers. Computer-aided design, computer simulations, and on-board computer controls have transformed all aspects of technology develop-ment and enabled the large majority of the power-train technology and vehicle-engineering improvements of the last 40 years.
Engine Losses: 68% - 72%thermal, such as radiator,exhaust heat, etc. (58% - 62%)combustion (3%)pumping (4%)friction (3%)
Parasitic Losses: 4% - 6%(e.g., water pump,alternator, etc.)
Power to Wheels: 18% - 25%Dissipated aswind resistance: (9% - 12%)rolling resistance (5% - 7%)braking (5% - 7%)
Idle Losses: 3%In this figure, they are accounted for as part of the engine and parasitic losses.
Drivetrain Losses: 5% - 6%
Energy Requirements for Combined City/Highway Driving
Figure 1. Energy requirements for combined city/highway driving on U.S. vehicle certification test cycles. Greater mass generates greater rolling resistance and braking losses. (Source: fueleconomy.gov)

LIGHTWEIGHTING TECHNOLOGY DEVELOPMENT AND TRENDS IN U.S. PASSENGER VEHICLES
WORKING PAPER 2016-25 INTERNATIONAL COUNCIL ON CLEAN TRANSPORTATION 3
Computer simulations and computer-aided design (CAD) are especially important for lightweight materials. There are hundreds of parts that interact in a motor vehicle. Changing the materials used in them can have unexpected effects on crash results or on NVH. In the past, manufacturers had to rely upon theory and component testing to anticipate those effects. That is a slow and expensive process, due to the need to build prototypes for each part iteration. Fortunately, computer simulation models have been improving rapidly and are becoming sophisticated and accurate enough to be the primary design tool.7 5,6,7
5 C. Caffrey et al., “Cost-Effectiveness of a Lightweight Design for 2020–2025: An Assessment of a Light-Duty Pickup Truck,” SAE Technical Paper 2015-01-0559, 2015, doi:10.4271/2015-01-0559.
6 Stephen Goguen, Carol Schutte, Will Joost (2015). Lightweight Materials. Presented at the 2015 Department of Energy Vehicle Technologies Program Annual Merit Review, 8–12 June 2015, Washington, DC. Slide 4.
7 Matthew Monaghan, “The Next Wave of Crash Simulation,” Automotive Engineering, October 7, 2014, p. 28. Derek C. Fulk,
The importance of computer simu-lations can be illustrated with crash safety ratings. NHTSA established its New Car Assessment Program (NCAP) in 1978 to evaluate the performance of vehicle designs in frontal crashes, adding side crash ratings in 1997 and
High Performance Computing Study for Composite Intensive Vehicle Design, presented at the 2016 SAE Government/Industry Meeting, 20 January 2016. Numerous presentations at successive U.S. Department of Energy Annual Merit Reviews highlight the increasing use and reliability of computer modeling and simulation of materials. Three examples of the many ongoing studies incorporating computational modeling/simulation (year presented in parentheses): Xin Sun, Development of 3rd Generation Advanced High Strength Steels (AHSS) with an Integrated Experimental and Simulation Approach (2014); Mark Horstemeyer, A Systematic Multiscale Modeling and Experimental Approach to Understand Corrosion at Grain Boundaries in Magnesium Alloys (2015, Project ID LM095); Lou Hector, Integrated Computational Materials Engineering Approach to Development of Lightweight 3GAHSS Vehicle Assembly (2016, Project ID LM080). All are available at http://energy.gov/eere/vehicles/vehicle-technologies-office-annual-merit-review-presentations.
rollover assessments in 2001. Vehicles were assigned a crash rating from 1 to 5 stars, based upon the results of crash tests. Earlier safety improve-ments tended to add components and increase the thickness of materials, which also increased vehicle weight.
As simulation models improved and computers became faster and cheaper, manufacturers were able to start modeling part interactions during crashes. This was a boon to safety design, as manufacturers were able to integrate the crash structure into the body, improving occupant protection in a crash while reducing the weight of the crash structure. By the mid-2000s, the rapid increase in vehicles with 5-star crash ratings caused NHTSA to reevaluate its NCAP program and implement new crash tests and rating criteria starting with 2011. And none too soon. Among the 2010 models NHTSA tested, nearly every vehicle earned a five-star rating for the frontal-impact test. The ones that didn’t still earned four stars.
59.2%1.0%
8.8%
7.3%
4.4%
7.0%
2.1% 10.2%
Ave
rag
e E
PA
Mid
size
Veh
icle
Wei
ght
(lb
s.)
Mat
eria
l Per
cent
age
of
To
tal V
ehic
le, b
y w
eig
ht
Steel & Iron
High Strength Steel
Cast Aluminum
Foam/carpet
Rubber
Plastic
Glass
Misc.
Model Year
EPA Midsize Wt
High Strength Steel
Polymers/Composites
Aluminum
Magnesium0.0%
5.0%
10.0%
15.0%
20.0%
25.0%
2800
2900
3000
3100
3200
3300
3400
3500
3600
3700
1980 1985 1990 1995 2000 2005
Figure 2. Left: approximate make-up of a 2011 Silverado 1500 used by FEV to assess the cost-effectiveness of lightweighting a pickup truck.5 Right: Historical trends in lightweight material make-up for an average vehicle.6

LIGHTWEIGHTING TECHNOLOGY DEVELOPMENT AND TRENDS IN U.S. PASSENGER VEHICLES
4 INTERNATIONAL COUNCIL ON CLEAN TRANSPORTATION WORKING PAPER 2016-25
While NHTSA revised its crash ratings in 2011, the Insurance Institute for Highway Safety (IIHS) did not revise their crash rating system. The percentage of vehicles achieving IIHS’s Top Safety Pick increased with remarkable rapidity from 2011 to 2013 (Table 1), especially given that vehicles are usually redesigned only every four to five years, illustrating the continued rapid improvement in vehicle structure design.
Table 1: Percent of Nameplates Achieving IIHS Top Safety Pick
2011 2012 2013
Ford 52% 75% 93%
Toyota 52% 65% 77%
GM 54% 74% 78%
Source: Ford Sustainability Report8
The sophistication and accuracy of computer simulations has now reached the point where they can be used for the next step in vehicle design: to simultaneously optimize the material, shape, and thickness of every part on the vehicle for weight reduction and NVH, in addition to crash protection.
In addition to the direct benefits, this ability to optimize design also enables secondary weight reduction. For example, if the body is lighter, then brakes and suspension can also be made lighter without affecting perfor-mance. This leads to additional weight reduction and reduces cost. Secondary weight savings have been discussed for many years, but have not been feasible in the past due to uncertainties about how they would affect safety, noise, and vibration—concerns that computer simulations can resolve.
A 2014 news story on development of the aluminum body Ford F-150 illustrates the improvements that have already occurred.9 The story noted
8 Ford Motor Company, Sustainability Report 2012–13. Retrieved from http://corporate.ford.com/microsites/sustainability-report-2012-13/vehicle-data#b
9 Deepa Seetharaman, “Ford’s bet on F-150 reflects new tech, Mulally’s imprint,”
that advances in computer-assisted engineering were “one key factor that enabled Ford to take one of the biggest gambles in its history.” It cited Peter Reyes, the engineer in charge of the F-150 project, noting that “15 years ago, it took nine months for Ford Motor Co to make two possible designs for a vehicle frame. Now, . . . he can create 100 different examples in that time.” According to Reyes, “Ford used [computer-aided engineering (CAE)] tools to digitally experiment with more lightweight materials and test those components against ‘a blizzard of stiffness and strength requirements’ . . .” And Reyes also noted that “Ford expects to make up the premium by reducing its recycling costs, since there will be less metal to recycle, and by slimming down the engine and other components, since they won’t have to move so much weight.”
Another example comes from GM.10 A 2013 Automotive News article
Reuters, January 13, 2014, http://finance.yahoo.com/news/fords-bet-f-150-reflects-050615777.html.
10 Mike Colias, “Crash diet gets results
noted that in-house software used by the automaker “can run hundreds of thousands of virtual scenarios that test how hundreds of components will hold up at various thicknesses and material types.” According to the story, “Engineers can virtually shrink by a millimeter the thickness of, say, a shock tower, and then run an analysis to see how that might affect the performance of dozens or hundreds of other parts.”
In summary, since 1975 the use of advanced materials has played a larger and larger role in lightweighting strategy, and presently offers a larger weight reduction contribution than front-wheel drive schemes and vehicle frame construction type (unibody, body-on-frame, spaceframe, etc.), as shown in Figure 3.11
at GM,” Automotive News, February 18, 2013, http://www.autonews.com/article/20130218/OEM03/302189922/crash-diet-gets-results-at-gm.
11 MacKenzie, D., Zoepf, S., Heywood, J., “Determinants of US passenger car weight,” International Journal of Vehicle Design, 2014, 65 (1): 73-93 doi:10.1504/IJVD.2014.060066.
Front-Wheel Drive
Construction Type
Materials
Engine Cylinders
-800
-600
-400
-200
0
1975 1980 1985 1990 1995 2000 2005
Cum
ulat
ive
Co
ntri
but
ion
Sinc
e 19
75 (
kg)
Figure 3. Cumulative contribution of weight reduction in vehicles since 1975 showing increased role of materials usage responsible for lightweighting strategy. (Source: MacKenzie, D., Zoepf, S., Heywood, J., “Determinants of US passenger car weight,” International Journal of Vehicle Design, 2014, 65 (1): 73-93 doi:10.1504/IJVD.2014.060066.)

LIGHTWEIGHTING TECHNOLOGY DEVELOPMENT AND TRENDS IN U.S. PASSENGER VEHICLES
WORKING PAPER 2016-25 INTERNATIONAL COUNCIL ON CLEAN TRANSPORTATION 5
Market Penetration TrendsMean vehicle weight remained roughly constant from 2004 to 2015, increasing by at most 118 pounds or approximately 3% of vehicle weight of the lightest year (Table 2). However, power has increased, as evidenced by the decreasing ratio of weight to horsepower. The average power in 2015 is projected to be 233 horsepower.12
Over this 11-year time frame, the proportion of cars in total annual new-vehicle sales increased from 52% to nearly 60%, while truck share fell to 40%.13 It should be noted that NHTSA and EPA classify two-wheel drive (2WD) crossover utility vehicles as cars (“car SUVs”, or CUVs), while other sources usually define them as light trucks. These 2WD CUVs and
12 U.S. Environmental Protection Agency, “Light-Duty Automotive Technology, Carbon Dioxide Emissions, and Fuel Economy Trends: 1975 Through 2015” (2015). https://www3.epa.gov/fueleconomy/fetrends/1975-2015/420r15016.pdf
13 The market share values in 2015 are projected based on manufacturers’ pre-model year reports. These values predict a slight increase and decrease in car and truck shares, respectively. However, as reported by Auto News, car share (not including 2WD CUVs) fell 2.3% to 43.3% of the 17.47m light duty vehicles sold in 2015. Crossover sales alone were 29.6% of the market. For more information, see U.S. Fleet Sales in the Auto News Data Center at http://www.autonews.com/section/datalist22.
SUVs have held approximately 10% of the market since 2011. Sales of CUVs, in general, surged 63% since 2009, and combined sales of pickups, SUVs, and vans increased 15% since 2013. It is clear from this information that actual truck share did not decrease slightly from 2013 to 2015, but rather increased significantly.
Although several segments are included in “trucks,” the only truck
segment with consistently increasing weight since 2004 is pickup trucks, which almost all have body-on-frame designs.14 They averaged a 50 lb/year increase (Figure 4). Thus, the relatively constant weight of trucks overall (Table 2) is due, in part, to the market shift from truck-based SUVs
14 The Honda Ridgeline pickup is based upon a unibody design, although Honda added ladder bars to create a hybrid unibody/body-on-frame vehicle.
Table 2. Mean weight of cars and trucks, 2005—2015.
2004 2005 2006 2007 2008 2009 2010 2011 2012 2013 2014 2015
Car Weight (lbs) 3462 3463 3534 3507 3527 3464 3474 3559 3452 3465 3497 3509
Car SUV* (lbs) 3854 3848 3876 3935 3902 3846 3949 3890 3915 3966 3865 3903
Truck weight (lbs) 4783 4763 4758 4871 4837 4753 4784 4824 4809 4824 4790 4808
Weight/HP 19.5 19.4 19.1 18.9 18.7 18.8 18.7 17.9 17.9 17.7 17.7 17.5
Car share 48.0% 50.5% 52.9% 52.9% 52.7% 60.5% 54.5% 47.8% 55.0% 54.1% 49.2% 49.0%
Car SUV share 4.1% 5.1% 5.0% 6.0% 6.6% 6.5% 8.2% 10.0% 9.4% 10.0% 10.1% 10.6%
Truck share 48.0% 44.4% 42.1% 41.1% 40.7% 33.0% 37.2% 42.2% 35.6% 35.9% 40.7% 40.4%
* Car SUV is the term used in the EPA 2015 Fuel Economy Trends Report to refer to 2WD CUVs and SUVs.Source: U.S. 2015 Fuel Economy Trends Report12
Cars
Car SUVs
Vans
Truck SUVs
Pickups
3000
3500
4000
4500
5000
5500
2005 2006 2007
Model Year
2008 2009 2010 2011 2012 2013 2014 2015
Ave
rag
e w
eig
ht (
lbs)
Figure 4. Average vehicle class weight. (Source: U.S. Environmental Protection Agency, “Light-Duty Automotive Technology, Carbon Dioxide Emissions, and Fuel Economy Trends: 1975 Through 2015” (2015).)

LIGHTWEIGHTING TECHNOLOGY DEVELOPMENT AND TRENDS IN U.S. PASSENGER VEHICLES
6 INTERNATIONAL COUNCIL ON CLEAN TRANSPORTATION WORKING PAPER 2016-25
to much lighter car-based SUVs over the last 11 years.
As shown in Figure 5, passenger vehicles have reduced fuel con-sumption by 21% since 2004, despite maintaining the same average weight. Since each point in the chart represents a different vehicle make, the trend of reduced fuel consump-tion at constant weight holds true across manufacturers.
In both the 2004 and 2015 model years, vehicle efficiency (in terms of fuel consumption per weight) was reasonably similar for all vehicles (individual manufacturers deviated from the average by no more than 10% in 2004 and 8% in 2015, with the vast majority within 5% in both years). This trend is evidenced by the data points hovering around the horizontal lines at about 2 (2004) and 1.6 (2015) gal/ton-100mi. One conclusion is that, although lighter vehicles have lower fuel consumption, vehicles on average consume similar amounts of fuel relative to their vehicle mass. Reduction of vehicle mass therefore leads to reduced fuel consumption for all vehicles.
Thus , passenger veh ic les a re becoming safer (Table 1), more powerful (Table 2), and more fuel efficient (Figure 6), all without reducing weight (Figure 4). Clearly, any lightweighting that has occurred in the past decade has been used primarily to offset the increased weight of upscale features, safety enhancements , and increased vehicle size.
Car, 2004
Truck, 2004
Car, 2015
Truck, 2015
2.0
2.5
3.0
3.5
4.0
4.5
5.0
5.5
Fue
l Co
nsum
pti
on
(gal
/10
0m
i)
Curb Weight (lbs)
3000 3500 4000 4500 5000 5500
Figure 6. Change in passenger-vehicle fuel consumption and weight across manufacturers. (Source: EPA 2015 Fuel Economy Trends report.)
2004 average
2015 average
0.4
0.8
1.2
1.6
2.0
2.4
2.8
3.2
1600 2000 2400 2800 3200 3600 4000 4400 4800 5200 5600 6000 6400 6800
Fue
l con
sum
pti
on p
er t
on (
gal
/ton
-10
0m
i)
Weight (lbs)
Cars 2004 Car SUVs 2004 Truck SUVs 2004 Vans 2004 Pickups 2004Cars 2015 Car SUVs 2015 Truck SUVs 2015 Vans 2015 Pickups 2015
Figure 5. Change in combined-cycle, unadjusted fuel consumption per ton as a function of vehicle weight from 2004 to 2015. Each point indicates a different manufacturer. (Source: EPA 2015 Fuel Economy Trends Report.)
LIGHTWEIGHTING TECHNOLOGY DEVELOPMENT AND TRENDS IN U.S. PASSENGER VEHICLES
WORKING PAPER 2016-25 INTERNATIONAL COUNCIL ON CLEAN TRANSPORTATION 7
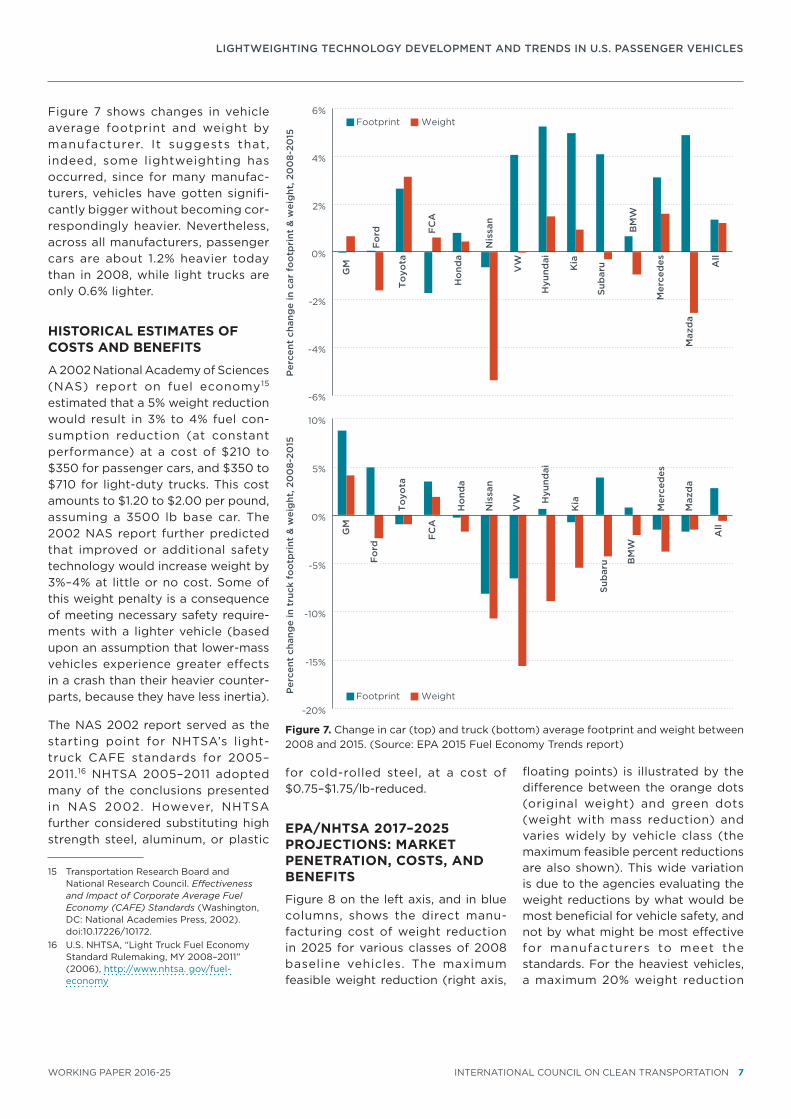
Figure 7 shows changes in vehicle average footprint and weight by manufacturer. It suggests that, indeed, some lightweighting has occurred, since for many manufac-turers, vehicles have gotten signifi-cantly bigger without becoming cor-respondingly heavier. Nevertheless, across all manufacturers, passenger cars are about 1.2% heavier today than in 2008, while light trucks are only 0.6% lighter.
HISTORICAL ESTIMATES OF COSTS AND BENEFITS
A 2002 National Academy of Sciences (NAS) report on fuel economy15 estimated that a 5% weight reduction would result in 3% to 4% fuel con-sumption reduction (at constant performance) at a cost of $210 to $350 for passenger cars, and $350 to $710 for light-duty trucks. This cost amounts to $1.20 to $2.00 per pound, assuming a 3500 lb base car. The 2002 NAS report further predicted that improved or additional safety technology would increase weight by 3%–4% at little or no cost. Some of this weight penalty is a consequence of meeting necessary safety require-ments with a lighter vehicle (based upon an assumption that lower-mass vehicles experience greater effects in a crash than their heavier counter-parts, because they have less inertia).
The NAS 2002 report served as the starting point for NHTSA’s light-truck CAFE standards for 2005–2011.16 NHTSA 2005–2011 adopted many of the conclusions presented in NAS 2002. However, NHTSA further considered substituting high strength steel, aluminum, or plastic
15 Transportation Research Board and National Research Council. Effectiveness and Impact of Corporate Average Fuel Economy (CAFE) Standards (Washington, DC: National Academies Press, 2002). doi:10.17226/10172.
16 U.S. NHTSA, “Light Truck Fuel Economy Standard Rulemaking, MY 2008–2011” (2006), http://www.nhtsa. gov/fuel-economy
for cold-rolled steel, at a cost of $0.75–$1.75/lb-reduced.
EPA/NHTSA 2017–2025 PROJECTIONS: MARKET PENETRATION, COSTS, AND BENEFITS
Figure 8 on the left axis, and in blue columns, shows the direct manu-facturing cost of weight reduction in 2025 for various classes of 2008 baseline vehicles. The maximum feasible weight reduction (right axis,
floating points) is illustrated by the difference between the orange dots (original weight) and green dots (weight with mass reduction) and varies widely by vehicle class (the maximum feasible percent reductions are also shown). This wide variation is due to the agencies evaluating the weight reductions by what would be most beneficial for vehicle safety, and not by what might be most effective for manufacturers to meet the standards. For the heaviest vehicles, a maximum 20% weight reduction
GM
Fo
rd
To
yota
FC
A
Ho
nda
Nis
san
VW
Hyu
ndai
Kia
Sub
aru
BM
W
Mer
ced
es
Maz
da
All
-6%
-4%
-2%
0%
2%
4%
6%
Per
cent
cha
nge
in c
ar f
oo
tpri
nt &
wei
ght
, 20
08-
2015
Footprint Weight
Footprint Weight
GM
Fo
rd
To
yota
FC
A
Ho
nda
Nis
san
VW H
yund
ai
Kia
Sub
aru B
MW
Mer
ced
es
Maz
da
All
-20%
-15%
-10%
-5%
0%
5%
10%
Per
cent
cha
nge
in t
ruck
fo
otp
rint
& w
eig
ht, 2
00
8-20
15
Figure 7. Change in car (top) and truck (bottom) average footprint and weight between 2008 and 2015. (Source: EPA 2015 Fuel Economy Trends report)

LIGHTWEIGHTING TECHNOLOGY DEVELOPMENT AND TRENDS IN U.S. PASSENGER VEHICLES
8 INTERNATIONAL COUNCIL ON CLEAN TRANSPORTATION WORKING PAPER 2016-25
(about 1,200 pounds) is achievable for roughly $1,000, and a minimum 1.5% reduction (about 90 pounds) is estimated to cost $6 (as shown in Figure 8, these are the maximum and minimum levels of mass reduction). Note that the cost rises faster than the amount of weight reduction. This reflects the formula developed by EPA and NHTSA to estimate light-weighting, $4.36/pound/% reduction, which increases cost as the amount of mass reduction increases.17
The agencies also found that a 10% weight reduction corresponds to roughly 5% reduction in fuel consumption, without maintaining constant performance. The agencies estimate that downsizing power-train and other components to maintain performance on a lightweighted vehicle results in 6%–8% fuel con-sumption reduction overall.
Table 3. Agency-projected mass reduction levels from 2008 baseline and direct manufacturing costs (DMC)
2021 2025 DMC
Mass Tech. -6% -8%
$0.26/lb—$0.35/lb
True Mass -5% -7%
Mass Penalty 1% 1%
Table 3 shows the agency-estimated f leetwide penetrat ion of mass reduction. A true mass reduction of 7% is predicted by 2025, at a cost of less than $0.35/lb.
EPA and NHTSA are confident the shape of the footprint-based curves does not incentivize downsizing or upsizing, which could compromise functionality or attributes of a specif ic vehic le. For example, building a smaller vehicle means the manufacturer has to meet a higher
17 California Air Resources Board (CARB) estimated lightweighting cost was only about half of this, $2.30/pound/% reduction.
mpg target for that vehicle and does not help the manufacturer comply with the standards. Instead, manu-facturers will reduce mass while maintaining size, through a com-bination of material substitution, design optimization, and advanced manufacturing (including improved manufacturing/joining and parts consolidation, e.g.).
Non-power - t ra in components account for 74%–76% of vehicle weight (see Table 4) . Agency analysis focused on efforts to specifi-cally reduce the weight of individual components, including power train components, but did not consider mass reductions that occur as a result of efficiency improvements to the power train (e.g., changing the engine from iron to aluminum was included, but engine downsizing due to turbocharging was not).
The most significant amounts of mass reduction occur during vehicle redes igns , when compet i tors ’ vehicles are benchmarked and all components and subsystems are considered for weight reduction.
“Primary reduction” is defined as mass the manufacturer intended to reduce. “Secondary reduction” is defined as ancillary systems and components that can now be lighter as a result of primary reduction.
As documented in the rulemaking support documents, the agencies gathered information on primary and secondary mass reduction e f f o r t s f ro m te a rd ow n s a n d literature reviews. Literature reports of secondary mass reduction varied widely: for every 1 ki logram of primary mass reduction, estimates of secondary mass reduction range from 0.5 kg to 1.25 kg. Improved CAD/CAE and simulation tools facilitate mass reduction, lowering costs. However, complete optimi-zation is limited by a given OEM’s use of shared components and platforms among models. Tooling and equipment capital costs also limit an OEM’s ability to optimize completely. All of this leads to some level of excess mass present on the vehicle, which is unavoidable.
0%
3.5% 10%
20%
20%
20%
1000
2000
3000
4000
5000
6000
7000
$0
$200
$400
$600
$800
$1,000
$1,200
Smallcar
Standardcar
Largecar
SmallMPV
LargeMPV
Truck
Lum
ped
Par
amet
er M
od
el W
eig
ht
Dir
ect
Man
ufac
turi
ng C
ost
DMC range original weight weight with maximum reduction
Figure 8. Agency-estimated direct manufacturing costs and vehicle weight reduction for neutral safety.
LIGHTWEIGHTING TECHNOLOGY DEVELOPMENT AND TRENDS IN U.S. PASSENGER VEHICLES
WORKING PAPER 2016-25 INTERNATIONAL COUNCIL ON CLEAN TRANSPORTATION 9
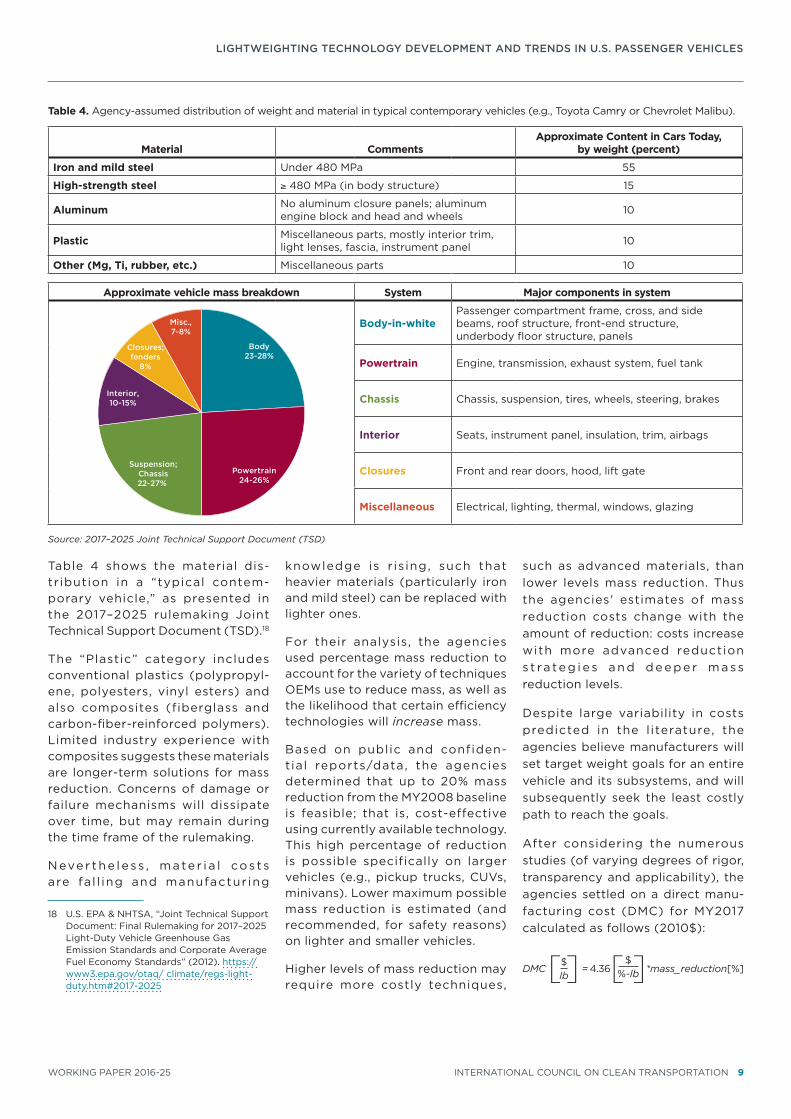
Table 4 shows the material dis-tribution in a “typical contem-porary vehicle,” as presented in the 2017–2025 rulemaking Joint Technical Support Document (TSD).18
The “Plastic” category includes conventional plastics (polypropyl-ene, polyesters, vinyl esters) and also composites (fiberglass and carbon-fiber-reinforced polymers). Limited industry experience with composites suggests these materials are longer-term solutions for mass reduction. Concerns of damage or failure mechanisms will dissipate over time, but may remain during the time frame of the rulemaking.
N eve r t h e l e ss , m ate r i a l co s t s are fa l l ing and manufactur ing
18 U.S. EPA & NHTSA, “Joint Technical Support Document: Final Rulemaking for 2017–2025 Light-Duty Vehicle Greenhouse Gas Emission Standards and Corporate Average Fuel Economy Standards” (2012). https://www3.epa.gov/otaq/ climate/regs-light-duty.htm#2017-2025
knowledge is r is ing, such that heavier materials (particularly iron and mild steel) can be replaced with lighter ones.
For their analysis, the agencies used percentage mass reduction to account for the variety of techniques OEMs use to reduce mass, as well as the likelihood that certain efficiency technologies will increase mass.
Based on public and confiden-tial reports/data, the agencies determined that up to 20% mass reduction from the MY2008 baseline is feasible; that is, cost-effective using currently available technology. This high percentage of reduction is possible specifically on larger vehicles (e.g., pickup trucks, CUVs, minivans). Lower maximum possible mass reduction is estimated (and recommended, for safety reasons) on lighter and smaller vehicles.
Higher levels of mass reduction may require more costly techniques,
such as advanced materials, than lower levels mass reduction. Thus the agencies’ estimates of mass reduction costs change with the amount of reduction: costs increase with more advanced reduction s t ra te g i e s a n d d e e p e r m a ss reduction levels.
Despite large variability in costs predicted in the l iterature, the agencies believe manufacturers will set target weight goals for an entire vehicle and its subsystems, and will subsequently seek the least costly path to reach the goals.
After considering the numerous studies (of varying degrees of rigor, transparency and applicability), the agencies settled on a direct manu-facturing cost (DMC) for MY2017 calculated as follows (2010$):
DMC[lb$] = 4.36[%-lb
$]*mass_reduction[%]
Table 4. Agency-assumed distribution of weight and material in typical contemporary vehicles (e.g., Toyota Camry or Chevrolet Malibu).
Material CommentsApproximate Content in Cars Today,
by weight (percent)
Iron and mild steel Under 480 MPa 55
High-strength steel ≥ 480 MPa (in body structure) 15
Aluminum No aluminum closure panels; aluminum engine block and head and wheels 10
Plastic Miscellaneous parts, mostly interior trim, light lenses, fascia, instrument panel 10
Other (Mg, Ti, rubber, etc.) Miscellaneous parts 10
Approximate vehicle mass breakdown System Major components in system
Body23-28%
Powertrain24-26%
Suspension;Chassis22-27%
Interior,10-15%
Closures;fenders
8%
Misc.,7-8%
Body-in-whitePassenger compartment frame, cross, and side beams, roof structure, front-end structure, underbody floor structure, panels
Powertrain Engine, transmission, exhaust system, fuel tank
Chassis Chassis, suspension, tires, wheels, steering, brakes
Interior Seats, instrument panel, insulation, trim, airbags
Closures Front and rear doors, hood, lift gate
Miscellaneous Electrical, lighting, thermal, windows, glazing
Source: 2017–2025 Joint Technical Support Document (TSD)

LIGHTWEIGHTING TECHNOLOGY DEVELOPMENT AND TRENDS IN U.S. PASSENGER VEHICLES
10 INTERNATIONAL COUNCIL ON CLEAN TRANSPORTATION WORKING PAPER 2016-25
Thus, a 20% reduction would cost 4.36*0.20=$0.87/lb, and a 10% reduction would cost ~$0.44/lb. As an example, a 3,800-lb vehicle with 10% weight reduction (380 lbs) would cost an additional $167; a 15% reduction (570 lbs) would cost $373. These figures are significantly lower than the NAS 2002 estimate, whose reported cost range applied for only a 5% decrease in weight. The DMC for mass reduction is considered to be “flat” on the learning curve: on average a 2% reduction in DMC/year.
S imi lar ly, ind i rect costs were determined to increase in complexity (and cost) with higher levels of mass reduction.
A couple of important studies were still being conducted when the inputs to the final rule analysis f rom the peer-review process were required. The results of those studies were not incorporated, thus the NPRM cost estimates were used. Reevaluation of the mass-reduction cost estimates is likely when the studies’ results are incorporated into the mid-term evaluation.
Based on studies and simulations, the agencies estimated that each 10% reduction in mass (up to a maximum of 20%) results in a 5.1% reduction in fuel consumption, which does not include engine downsizing or other powertrain changes that keep performance levels constant. This level of effectiveness scales in a linear fashion from 0% to 20% mass reduction. The agencies estimate that downsizing power train and other components to maintain per-formance on a lightweighted vehicle results in 6% to 8% fuel consump-tion reduction overall. To avoid double-counting the effectiveness of engine downsizing (in simulated vehicles with downsized engines), the agencies removed this amount from the lightweighting effective-ness value.
Current fuel consumption reduction and cost
CURRENT PRODUCTION COSTS AND BENEFITS
Lightweighting has become a key technical strategy for meeting future CAFE standards, reducing battery size and increasing range for electric vehicles, and improving performance. A number of lightweight materials are now in production, including high-strength steels, aluminum alloys, magnesium, plastics, and composites. These materials must be cost effective compared to alternative technologies, both at high volume for mainstream products and at low volume for luxury vehicles, high-performance vehicles, and new model entries.
In fact, manufacturers already produce vehicles with substantial mass reductions, as shown in Table 5. The vehicles listed in Table 5 are merely a selection of numerous makes/models that have already shed a remarkable amount of weight within a single redesign. For almost all vehicles listed, the weight-reduction percentage is similar to, if not greater than, the 7%
mass reduction predicted by EPA/NHTSA for the 2017–2025 time frame.
For all these vehicles, the impressive weight reductions were achieved using a multi-material approach and updated manufacturing processes/computer simulations. No single material or method dominates the others.
ALUMINUM19
The 2015 Ford F-150 is the poster-child for aluminum lightweighting.
19 Curb weight for older model years available from Autobytel Inc. (2016). [U.S. passenger vehicle specifications]. Retrieved from http://www.autobytel.com, and from US News Rankings and Reviews. (2016). [U.S. passenger vehicle specifications and reviews]. Retrieved from http://usnews.rankingsandreviews.com/cars-trucks/browse/. “2013 Acura MDX Model Information,” Acura, accessed September 19, 2016, http://owners.acura.com/vehicles/information/2013/MDX/specs#mid^YD2H2DJNW. Sean Szymkowski, “Opel Details How The 2016 Astra Shed Its Weight,” GM Authority, August 27, 2015, http://gmauthority.com/blog/2015/08/opel-details-how-the-2016-astra-shed-its-weight/. “2017 Acadia Features and Specs,” GMC, accessed September 19, 2016, http://www.gmc.com/suvs/acadia-mid-size-suv/features-specs/trims.html. “2017 Volt Models and Specs,”
Table 5. Sample of vehicle mass reductions
Vehicle Make Model YearWeight
reduction (kg)Weight
reduction (%) Relative to
Ford F-150 2016 288 14% 2014
Acura MDX 2017 172 8% 2013
GM Cadillac CTS 2017 95 5% 2013
Audi Q7 2016 115 5% 2015
Chyrsler Pacifica 2017 146 7% 2016
Nissan Leaf 2016 59 4% 2012
Opel Astra 2016 173 12% 2015
Chevrolet Malibu 2016 135 9% 2015
GMC Acadia 2017 318 15% 2016
Chevrolet Volt 2017 110 6% 2014
Chevrolet Cruze 2017 103 7% 2015
Mazda Miata 2016 67 6% 2015
BMW M3/M4 2017 63 4% 2013
Chevrolet Equinox 2018 182 10% 2016
Chevrolet Camaro 2016 177 10% 2015
Source: U.S. News Car Rankings and Advice, autobytel.com, Acura, gmauthority.com, GMC, Chevrolet, Nissan, Mazda, Ford, Cadillac, Audi, Opel, Auto Week, BMW, Auto News18

LIGHTWEIGHTING TECHNOLOGY DEVELOPMENT AND TRENDS IN U.S. PASSENGER VEHICLES
WORKING PAPER 2016-25 INTERNATIONAL COUNCIL ON CLEAN TRANSPORTATION 11
Its weight was reduced by as much as 700 lbs (318 kg) from MY2014, a 14% decrease (this was on the 8-foot Styleside Supercab 3.5L EcoBoost V6).20 Its fuel consumption, including a downsized engine lineup, decreased by 11.7%,21 which is more than the 9.8% effectiveness estimated in the rulemaking, assuming every 10% of mass reduction leads to a 7% decrease in fuel consumption with engine
Chevrolet, accessed September 19, 2016, http://www.chevrolet.com/volt-electric-car/specs/trims.html. “2017 Cruze Models and Specs,” Chevrolet, accessed September 19, 2016, http://www.chevrolet.com/cruze-compact-car/specs/trims.html. Chevrolet Pressroom. (2015). LIGHTER 2016 CAMARO DELIVERS BENCHMARK PERFORMANCE. Retrieved from http://media.chevrolet.com/media/us/en/chevrolet/news.detail.html/content/Pages/news/us/en/2015/sep/0914-camaro.html. “2016 Mazda MX-5 Miata Specifications,” Mazda USA, accessed September 19, 2016, https://www.mazdausa.com/vehicles/mx-5-miata/specs. “F-150 Specifications,” Ford, accessed September 19, 2016, http://www.ford.com/trucks/f150/specifications/. “2017 CTS Sedan Dimensions,” Cadillac, accessed September 19, 2016, http://www.cadillac.com/sedans/cts-sedan/dimensions.html. “2017 Q7,” Audi USA, accessed September 19, 2016, https://www.audiusa.com/models/audi-q7. “Astra 5-Türer Modelle & Technische Daten,” Opel, accessed September 19, 2016, http://www.opel.de/fahrzeuge/modelle/personenwagen/astra-5-tuerer/modelle-technische-daten.html. “2017 GMC Acadia first drive: A lighter shade of crossover,” Auto Week, May 25, 2016, http://autoweek.com/article/car-reviews/2017-gmc-acadia-first-drive-lighter-shade-crossover. “The M4 Coupe Features & Specs,” BMW USA, accessed September 19, 2016, http://www.bmwusa.com/Standard/Content/Vehicles/2017/M/M4Coupe/Features_and_Specs/M4CoupeSpecifications.aspx. “Nissan Leaf Specifications,” Nissan, accessed September 22, 2016, http://www.nissanusa.com/electric-cars/leaf/versions-specs/. Nick Bunkley, “Chevy will equip next Equinox with diesel engine in global push,” Auto News, September 22, 2016, http://www.autonews.com/article/20160922/OEM04/160929920/chevy-will-equip-next-equinox-with-diesel-engine-in-global-push.
20 Ford Motor Company, “F-150 Specifications,” accessed September 19, 2016, http://www.ford.com/trucks/f150/specifications/capacities/.
21 U.S. EPA, Fuel Economy datasets and guides [light duty vehicle fuel economy model year data] (2016). Retrieved from https://www.fueleconomy.gov/feg/download.shtml
downsizing to maintain equivalent performance. Aluminum makes up more than 95% of the truck’s body (the frame is 77% high-strength steel), and contributes nearly two-thirds of the overall mass reduction.22
Ford addressed aluminum joining issues by using rivets, which are more expensive than welds. Potential material cost issues were mitigated by recycling scrap aluminum: Ford recoups about $1/lb for scrap aluminum, which greatly offsets the $2.19/lb initial material cost. The net cost (over conventional steel) is around $445/truck, instead of $725 without recycling.23 Due to the lower strength of aluminum (compared to steel), thicker sheets are needed. For the body of the F-150, aluminum substitution resulted in a 40% weight reduction. One could expect that, for components whose strength is less critical for safety and performance/handling, aluminum could offer greater weight reduction.
Aluminum producers are continu-ously developing stronger aluminum alloys. Novelis, for example, is now offering manufacturers aluminum sheets that are two to three times stronger than previous sheets.24 As a result, such sheets can be used in safety-critical parts without as much additional material.
22 Lindsay Brooke, “2015 F-150: Ford picks up the lightweight benchmark,” Automotive Engineering, September 2, 2014. p. 19. Deepa Seetharaman, “Ford’s bet on F-150 reflects new tech, Mulally’s imprint,” Yahoo Finance, January 13, 2014, http://finance.yahoo.com/news/fords-bet-f-150-reflects-050615777.html
23 Joann Muller, “Inside the Numbers: Why Ford Won’t Lose Its Shirt Building the Pricey New Aluminum F-150 Pickup,” Forbes Autos, November 10, 2014, http://www.forbes.com/sites/joannmuller/2014/11/10/inside-the-numbers-how-ford-wont-lose-its-shirt-building-the-pricey-new-aluminum-f-150-pickup/2/#6f8430bd73dd
24 Richard Truett, “Novelis: Automakers test stronger aluminum,” Auto News, August 10, 2015, http://www.autonews.com/article/20150810/OEM01/308109982/novelis:-automakers-test-stronger-aluminum
Of course, aluminum currently remains a relatively more expensive option than steel, despite the fact that, since 2011, prices have dropped 33%.25
STEEL
While some recent studies addressed total vehicle mass reduction by exploring potential technologies in all vehicle subsystems, the most common focus area continues to be the vehicle body structure. This is because the body structure:
1. Represents up to 25% of the vehicle mass (specific to vehicle design)
2. Is essential to meeting multiple safety, strength, stiffness, and noise transmission targets
3. Is subject to multiple integra-tion constraints (configuration, packaging, and exterior styling)
4. Is a major driver of significant capital investment
5. Has the most impact on OEM
body shop infrastructure.
Automotive body engineers will typically carefully balance all of the above within their specific program constraints. To date, steel, combined with efficient engineering practices, has been selected as the best solution for almost all body structures.
The s tee l i ndust ry has been responsive to the lightweighting needs of the automotive industry, as manifested by the steady evolution of automotive steel grades over the past 15 years and their quick adoption by the automakers. Legacy vehicle architectures continue to be replaced with more mass efficient advanced high-strength steel (AHSS) intensive architectures.
25 Firat Kayakiran, “Auto industry drives comeback in aluminum prices,” Auto News, January 28, 2015, http://www.autonews.com/article/20150128/OEM10/150129811/auto-industry-drives-comeback-in-aluminum-prices

LIGHTWEIGHTING TECHNOLOGY DEVELOPMENT AND TRENDS IN U.S. PASSENGER VEHICLES
12 INTERNATIONAL COUNCIL ON CLEAN TRANSPORTATION WORKING PAPER 2016-25
A u t o m a ke r s h ave e m b ra c e d steel-intensive solutions for body structures and closures because it provides exceptional safety, strength, and durability without limiting vehicle design. They continue to leverage the broad spectrum of steel grades ranging from mild to press-hardened steels to place the right grade in the right location for enhanced structural performance and expressive styling.
Some current examples of light-weighting with steel include:
1. The 2015 Nissan Murano saved 146 lbs using AHSS.
2. More than 70% of the 2015 Colorado/Canyon body structure is HSS.
3. The 2015 Chrysler 200 body structure is 60% AHSS.
4. The 2015 Ford Edge body structure uses more HSS than its predecessor.
5. The 2015 Hyundai Genesis is built on a redesigned platform with increased use of AHSS.
6. Although the 2016 Chevy Malibu is larger, it is also lighter and more efficient through increased use of AHSS in the body structure and closures. This all-new steel body structure accounts for more than one-third of the Malibu’s nearly 300-pound weight reduction.
7. The 2016 Kia Optima features a uniquely engineered body structure that is more than 50% AHSS and showcases a variety of high-tensile strength steel alloys. The chassis is also stiffer and more durable due to the increased use of AHSS.
8. The new N issan Max ima ’s redesigned platform features increased use of AHSS, including the first use of 1.2 GPa high-strength steel in a Nissan sedan. This resulted in 82 lbs of mass reduction, which contributed to 15% better highway fuel
economy, and 25% improvement in torsional rigidity.
9. The 2016 Hyundai Tucson body shell has been made stiffer, lighter, and safer due to the extensive use of AHSS as well as Tailor Welded Blanks. Over 50% of the new Tucson structure and chassis subsystems is made of AHSS.
10. The 2017 GMC Acadia, which leverages a variety of AHSS grades in the body structure and closures, is 700 lbs lighter than its predecessor.
11. The 2017 Cadillac XT5, which replaces the SRX, uses a signifi-cant amount of AHSS grades in the body structure and closures, which contributes to an overall vehicle weight reduction of 278 lbs.
PLASTICS AND COMPOSITES
Plastics and composites present major weight reduction opportuni-ties across each application segment. Today, these materials make up about 50 percent of a car’s volume, yet account for less than 10 percent of a car’s total weight. Thermoplastic-based materials in particular provide an array of properties that make them attractive for manufacturing (low density, high strength and rigidity, and tailored thermal expansion properties and recyclability).
Given the different requirements of individual parts and systems, one must take an application-specific view when considering opportunities to take advantage of the many benefits provided by these materials. Today, a wide number of opportunities across all vehicle segments are available to take advantage of thermoplastics as a strong, lightweight choice.
The body and chassis components of cars make up about 60% to 65% of vehicle mass. While steel has been the traditional material, and the steel industry continues to develop newer ultra-high strength steel grades,
for some part applications thermo-plastics and composites offer lower density, higher specific stiffness and strength, greater corrosion resistance, and flexibility of design.
A good example lies in the chassis area, in which engineering thermo-plastics are replacing multiple metal-based crash and energy management solutions in front and rear bumpers.26
A thermoplastic rear bumper beam can save up to 2kg of weight, while also providing excellent energy absorption and increasing the flexibility of the part compared to steel.27 Thermoplastic energy a b s o r b e r s o l u t i o n s c a n h e l p vehicle manufacturers design to, and comply with, Global Technical Requirements (GTRs) for pedestrian safety bumper systems.28
Ford’s 2014 Fusion Mondeo was launched with a single-piece front bumper energy absorber (EA) with tuning flexibility to meet the competing requirements that exist in the global market.29 Made from a polycarbonate (PC)/polybutylene terephthalate (PBT) blend, the EA is 40% lighter and 10% less costly than a comparable part made out of steel.
26 E. Jaarda and D. Nagwanshi, “Prototype Design and Testing of a Global Energy Absorber Concept for Coupled Pedestrian and Vehicle Protection,” SAE Technical Paper 2007-01-1758, 2007, doi:10.4271/2007-01-1758.
27 D. Nagwanshi and S. Kulkarni, “Light Weight Solitary Beam Design to Meet Low Speed Vehicle Damageability and RCAR Impact Requirements,” SAE Technical Paper 2009-26-0007, 2009, doi:10.4271/2009-26-0007. D, Mana et al., “Thermoplastic Rear Bumper Beams for Automobile Low-Speed Rear Impact,” SAE Technical Paper 2011-01-0544, 2011, doi:10.4271/2011-01-0544.
28 D. Nagwanshi, M. Marks, and S. Bobba, “Part 581, IIHS Damageability and Lower Leg Impact Compliant Bumper - Challenges and Solutions,” SAE Technical Paper 2012-01-0274, 2012, doi:10.4271/2012-01-0274.
29 “Sabic materials used in applications honored at SPE’s Automotive Awards,” Plastics Today, November 13, 2013, accessed September 19, 2016, http://www.plasticstoday.com/materials/sabic-materials-used-applications-honored-spe’s-automotive-awards/102562021919602

LIGHTWEIGHTING TECHNOLOGY DEVELOPMENT AND TRENDS IN U.S. PASSENGER VEHICLES
WORKING PAPER 2016-25 INTERNATIONAL COUNCIL ON CLEAN TRANSPORTATION 13
The part is 20% lighter than thicker polypropylene-based EAs.
Long glass fiber reinforced polypro-pylene (LGFPP), a composite resin, is replacing metal in several structural applications like front end modules (FEMs), door modules, inner tailgate component and instrument panels.30 As much as 50% in weight savings is possible with this polypropylene-based material, which offers the high stiffness and dimensional stability for the production of quality parts.
Traditionally, metals like formed steel heavily dominated the exterior body application space. Aluminum is increasing its share, because its processes are similar to steel. While thermosets and thermoplastics are still a niche offering in the industry, they are finding their place, too. A few examples can be found in fenders, and both closures and body panels.
Fenders in a conductive polyphenyl-ene oxide/polyamide thermoplastic blend (known as NORYL GTX resin) can result in a significant weight reduction compared to steel. It is a technology that can seamlessly be fitted to a car, similar to steel. It can follow the whole manufactur-ing process from the body-in-white through electrocoat (up to 200°C bake temperature), and painting (with electrostatic painting) to the final assembly. This so-called on-line painting does not require additional coating, resulting in both energy savings and volatile organic compounds (VOC) reduct ion , making the manufacturing phase more environmentally friendly. A typical fender with 0.77mm thick steel has a total weight of 4.8 kg per car. The same fender in thermoplas-tic with a thickness of 2.1mm has a
30 S. Warden, Lightweight Design with STAMAX Long Glass Polypropylene (LGFPP) Resin. Presented at the SPE® Auto TPO show, Detroit, Michigan, October 2011. A. Yanev et.al. “Further Weight Reduction of Applications in Long Glass Reinforced Polymers,” AIP Conf. Proc. 1593, 499 (2014).
total weight of 1.9 kg, which results in a 2.9 kg weight reduction per car. Because of the design freedom with thermoplastics, they also offer further options for function integra-tion and assembly simplification, which, again, can result in additional weight reduction.
Similar to fenders, which are painted on-line, thermoplastics can also be found in body panels, which are off-line painted. Often this is used in a modular way, meaning that the body panels are molded, painted and preassembled before they are offered to the final assembly line. The weight savings, function integration, and assembly simpli-fication parallel those of fenders, discussed above.
Closures such as doors and tailgates are built out of several different components. In thermoplastics, each individual component offers we igh t reduc t ion oppor tun i -ties. Due to thermoplastic design freedom, extra weight reduction can be achieved through component interplay combined with clever assembly-integration or function-integration options.
Thermoplastic materials have a high degree of design freedom. Next to weight reduction, improved aero-dynamics is key to reduction of CO2 emissions. Air guides, spoilers, air intake, flow guides and air fins can easily be integrated in plastic exterior body panels, which all help to improve aerodynamics.
MANUFACTURING AND COMPUTATION
Ricardo led an investigation of lightweight design philosophy and manufacturing costs on two recent production vehicles, the BMW i3 and Audi A8. The study assessed the state-of-the-art in mainstream production and identified good practices for weight reduction and its
impact on cost structure.31 Another objective was to find ways to reduce capital cost in tooling. Traditional car manufacturing is extremely cap-ital-intensive, requiring major auto manufacturers to produce similar designs at very large volumes. This acts as a barrier for companies to engage in design and deployment of new l ightweight mater ia ls . Specifically, Ricardo investigated the i3 composite floor design, use of plastic and aluminum in the i3 door, and the A8 steel B-pillar.
The study was accompl i shed using Ricardo’s manufactur ing cost model , which determines bottom-up costs for the formation o f ind iv idua l par ts and the i r assembly into components. The model inc ludes the ab i l i ty to analyze key business drivers such as tooling investment, equipment cost, process time, materials, scrap, automation, labor, supply chain impacts, and factory overheads. This Ricardo toolset and approach has been validated by industry experts representing automakers, suppliers, academia, consultants and national laboratories.
The BMW i3 achieved a 35% weight reduction in the floor assembly, compared to the traditional steel floor of the Toyota Corolla, through the use of lightweight aluminum and resin injected carbon fiber fabric (CFRP). The Corolla floor assembly consists of 18 stamped steel parts joined by spot welds. In contrast, the i3 floor assembly uses two CFRP panels that are adhesively bonded to a welded framework of aluminum parts. Results from detailed cost analysis of fabrication and assembly
31 P. Bubna and M. Wiseman, “Impact of Light-Weight Design on Manufacturing Cost - A Review of BMW i3 and Toyota Corolla Body Components,” SAE Technical Paper 2016-01-1339, 2016, doi:10.4271/2016-01-1339. P. Bubna et al., “Barriers to Entry in Automotive Production and Opportunities with Emerging Additive Manufacturing Techniques,” SAE Technical Paper 2016-01-0329, 2016, doi:10.4271/2016-01-0329.

LIGHTWEIGHTING TECHNOLOGY DEVELOPMENT AND TRENDS IN U.S. PASSENGER VEHICLES
14 INTERNATIONAL COUNCIL ON CLEAN TRANSPORTATION WORKING PAPER 2016-25
of each component show that the i3 floor assembly is more expensive to manufacture than the Corolla’s. At $30/kg for carbon fiber fabric the implied cost of lightweighting is $5.70/lb. The cost-benefit declines to $3.84/lb at the anticipated future price of $15/kg. Figure 9 shows these results.
While carbon fiber fabric cost is the primary contributor to the piece price of the i3 floor, process cost is another driver of high cost to manufacture. A majority of the floor is made of two carbon fiber panels which are fabricated via an extensive process that starts from cutting of woven carbon fiber fabric followed by preforming, ultrasonic cutting, high pressure resin transfer molding and a water-jet cutting operation. This adds significant cost to the component as opposed to fast and efficient stamping of traditional steel parts. On the other hand, the design strategy adopted in the i3 floor allows signifi-cant reduction in capital tooling cost. The estimates show 56% upfront cost savings compared to the tradi-tional Corolla floor. These savings are achieved by reducing the number of unique components in the i3 floor design made possible by incorpora-tion of two large carbon fiber panels.
Ricardo’s interactions with industry indicate that currently acceptable cost per pound weight savings is $1–$3. This range of acceptable incre-mental cost is based on operational cost benefits of fuel efficiency as well as cost of reducing CO2 emissions from other competing methods such as alternative powertrain options. Thus, while the composite floor design of the BMW i3 achieves 35% weight savings and 56% reduction in capital investment in tooling, it does not appear to be a cost-effective strategy for conventional vehicles at the current price of $30/kg for carbon fiber fabric, or even with the projected price of $15/kg. Material cost needs to be less than $15/kg accompanied
by reductions in process costs to gain wider commercial acceptance.
However, it is important to note that the value of weight reduction is higher on fuel cell and battery-electric vehicles, as it allows a direct reduction in the amount of battery cells or the size of the fuel cell stack, with major secondary cost reductions. Lower capital investment in body-part design is also attractive for these vehicles, as they are produced at low volumes today. While it was beyond the scope of the project to assess the compound benefits of lightweighting in BEVs and FCEVs, lightweight designs such as the composite floor could be attractive in these applications.
The BMW i3 front door is not carbon fiber, but instead uses aluminum
and polypropylene to achieve a 36% lighter component than the tradi-tional all-steel door of the Corolla. Results from the Ricardo cost model show that the i3 front door is more expensive to manufacture than the Corolla’s. However, the cost benefit of lightweighting outweighs the incre-mental cost of manufacturing. As an example, at 50,000 units/year the implied cost of lightweighting for this assembly is estimated at $0.95/lb, which is well within the industry’s interest zone of $1–$3 incremental cost per pound saved.
Material cost of the i3 door is 29% higher than the Corolla’s due to poly-propylene and aluminum being more expensive than steel. Process cost of the i3 door is also higher than the Corolla due to its very different design
$34 $36 $41 $51
$141$164 $164 $166 $170
$211
$125 $125 $127 $131$171
$1,103
$696$657
$0
$100
$200
$700
$800
$900
$1,000
$1,100
$1,200
300k 200k 100k 50k 10k 1k
Flo
or
asse
mb
ly p
iece
pri
ce (
US
D)
i3 (near future, Carbon Fiber Fabric $15/kg)i3 (current, Carbon Fiber Fabric $30/kg)Corolla
Annual Volume
Figure 9. Calculated floor assembly piece price for Toyota Corolla and BMW i3 at current and future carbon fiber fabric rate
$32 $34 $38 $48
$138
$1,082
$994
$53 $53 $55 $64
$142
$0
$50
$100
$1,000
$1,050
$1,100
300k 200k 100k 50k 10k 1kAnnual Volume
Fro
nt d
oo
r p
iece
pri
ce (
US
D)
i3 Corolla
Figure 10. Calculated front door price for Toyota Corolla and BMW i3
LIGHTWEIGHTING TECHNOLOGY DEVELOPMENT AND TRENDS IN U.S. PASSENGER VEHICLES
WORKING PAPER 2016-25 INTERNATIONAL COUNCIL ON CLEAN TRANSPORTATION 15
strategy. Steel door parts, like those of the Corolla, are primarily made by stamping, which is a very fast process and requires minimal labor at high volumes. Some of the i3 door parts are also stamped, but a majority undergo energy intensive and time consuming processes such as injection molding, extrusion and post machining. Tooling cost for the i3 door is estimated to be 8% less compared to the Corolla’s.
While this is not a signif icant reduction, a deep dive into the tooling cost distribution reveals that BMW has offset high die costs of plastic Class-A parts by using several aluminum extrusions in the structure of the door, which cost sig-nificantly less in tooling compared to stamping. This is an effective strategy in reducing weight without increasing capital cost while achieving overall attractive cost-benefit.
Use of plastic and aluminum in the BMW i3 door results in 36% weight savings compared to traditional steel doors at a cost of just under $1 per pound and appears to be a cost- effective light-weighting strategy.
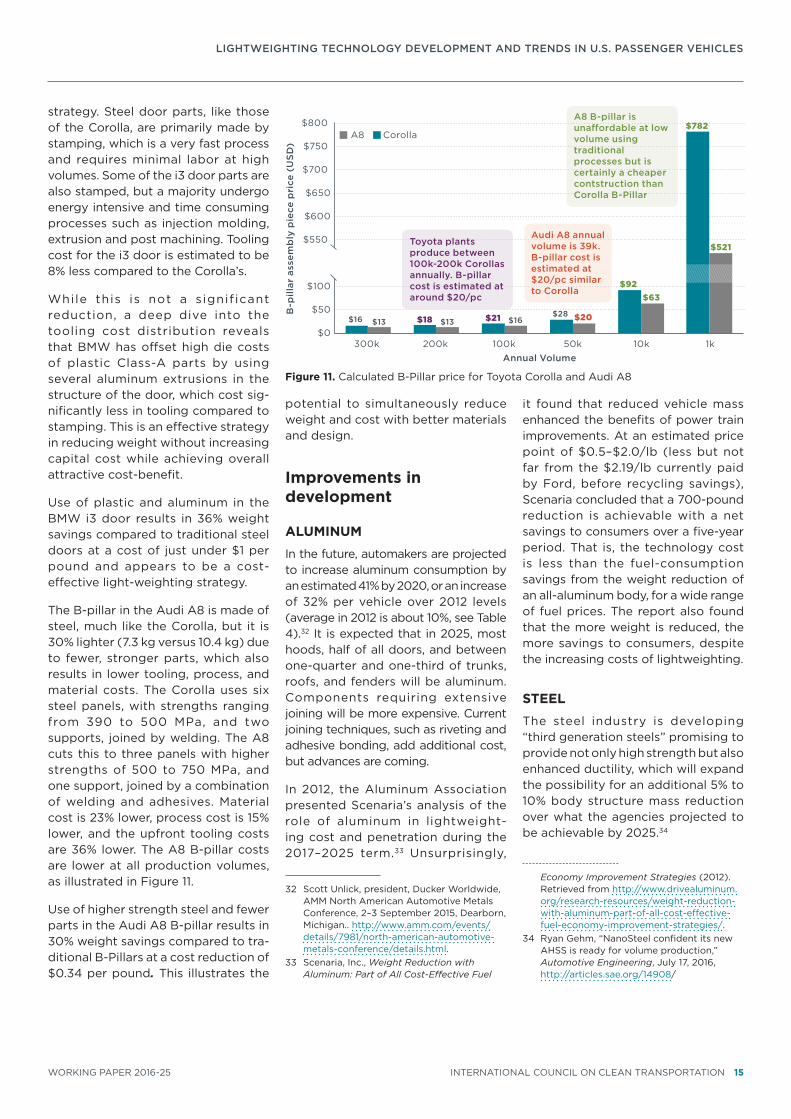
The B-pillar in the Audi A8 is made of steel, much like the Corolla, but it is 30% lighter (7.3 kg versus 10.4 kg) due to fewer, stronger parts, which also results in lower tooling, process, and material costs. The Corolla uses six steel panels, with strengths ranging from 390 to 500 MPa, and two supports, joined by welding. The A8 cuts this to three panels with higher strengths of 500 to 750 MPa, and one support, joined by a combination of welding and adhesives. Material cost is 23% lower, process cost is 15% lower, and the upfront tooling costs are 36% lower. The A8 B-pillar costs are lower at all production volumes, as illustrated in Figure 11.
Use of higher strength steel and fewer parts in the Audi A8 B-pillar results in 30% weight savings compared to tra-ditional B-Pillars at a cost reduction of $0.34 per pound. This illustrates the
potential to simultaneously reduce weight and cost with better materials and design.
Improvements in development
ALUMINUM
In the future, automakers are projected to increase aluminum consumption by an estimated 41% by 2020, or an increase of 32% per vehicle over 2012 levels (average in 2012 is about 10%, see Table 4).32 It is expected that in 2025, most hoods, half of all doors, and between one-quarter and one-third of trunks, roofs, and fenders will be aluminum. Components requiring extensive joining will be more expensive. Current joining techniques, such as riveting and adhesive bonding, add additional cost, but advances are coming.
In 2012, the Aluminum Association presented Scenaria’s analysis of the role of aluminum in lightweight-ing cost and penetration during the 2017–2025 term.33 Unsurprisingly,
32 Scott Unlick, president, Ducker Worldwide, AMM North American Automotive Metals Conference, 2–3 September 2015, Dearborn, Michigan.. http://www.amm.com/events/details/7981/north-american-automotive-metals-conference/details.html.
33 Scenaria, Inc., Weight Reduction with Aluminum: Part of All Cost-Effective Fuel
it found that reduced vehicle mass enhanced the benefits of power train improvements. At an estimated price point of $0.5–$2.0/lb (less but not far from the $2.19/lb currently paid by Ford, before recycling savings), Scenaria concluded that a 700-pound reduction is achievable with a net savings to consumers over a five-year period. That is, the technology cost is less than the fuel-consumption savings from the weight reduction of an all-aluminum body, for a wide range of fuel prices. The report also found that the more weight is reduced, the more savings to consumers, despite the increasing costs of lightweighting.
STEEL
The steel industry is developing “third generation steels” promising to provide not only high strength but also enhanced ductility, which will expand the possibility for an additional 5% to 10% body structure mass reduction over what the agencies projected to be achievable by 2025.34
Economy Improvement Strategies (2012). Retrieved from http://www.drivealuminum.org/research-resources/weight-reduction-with-aluminum-part-of-all-cost-effective-fuel-economy-improvement-strategies/.
34 Ryan Gehm, “NanoSteel confident its new AHSS is ready for volume production,” Automotive Engineering, July 17, 2016, http://articles.sae.org/14908/
$16 $18 $21 $28
$92
$782
$521
$13 $13 $16 $20
$63
$0
$50
$100
$550
$600
$650
$700
$750
$800
300k 200k 100k 50k 10k 1kAnnual Volume
B-p
illar
ass
emb
ly p
iece
pri
ce (
US
D)
A8 Corolla
A8 B-pillar is una�ordable at low volume using traditional processes but is certainly a cheaper contstruction than Corolla B-Pillar
Audi A8 annual volume is 39k. B-pillar cost is estimated at $20/pc similar to Corolla
Toyota plants produce between 100k-200k Corollas annually. B-pillar cost is estimated at around $20/pc
Figure 11. Calculated B-Pillar price for Toyota Corolla and Audi A8

LIGHTWEIGHTING TECHNOLOGY DEVELOPMENT AND TRENDS IN U.S. PASSENGER VEHICLES
16 INTERNATIONAL COUNCIL ON CLEAN TRANSPORTATION WORKING PAPER 2016-25
In a project for the Department of Energy, IBIS Associates demon-strated that optimizing a midsize steel vehicle (part redesign, body panel weight reduction, etc.) could reduce its mass by 3.2%–16.5% at a cost of -$1.90 to -$0.79 per pound reduced. That is, weight optimization reduced the cost of the vehicle.35
A new effort to lightweight cast components of vehicles through part redesign, advanced processes, and novel material introduction has yielded new lightweighting solutions and offers significant weight reduction opportunities. According to Metal Casting Design and Purchasing, the average 2010 light-duty vehicle had over 600 pounds of castings, which was approximately 15% of the total vehicle weight.36 Cast components are employed in nearly every subsystem of the vehicle, engine, drivetrain, and suspension. Examples of cast components are shown in Figure 12. The choice of material is driven pre-dominantly by cost and performance, and includes ductile iron, low-strength steels, high-strength aluminum, and even super-alloys.
The past two decades have seen an increase in the use of aluminum castings to replace low-strength ferrous castings in an effort to reduce vehicle weight, particularly in suspension parts and other subsystem noncritical performance parts such as housings. This has led to the intro-duction of aluminum knuckles and control arms. Aluminum allowed man-ufacturers to reduce weight without the need to drastically redesign the component, proliferating aluminum across many vehicle platforms despite the increased material cost.
35 Anthony Mascarin et al., Technical Cost Modeling for Vehicle Lightweighting:40% and 45% Weight Reduction [Project ID # LM090]. Presented at the DOE 2015 Annual Merit Review, 11 June 2015, Washington, DC.
36 N. Leider, “Automotive Castings in Ample Supply,” Metal Casting Design & Purchasing, March/April 2014, p. 41. http://www.afsinc.org/multimedia/contentMCDP.cfm?ItemNumber=16157.
Recognizing this trend towards lighter castings, the Department of Energy in 2013 introduced material perfor-mance goals associated with light-weighting of light-duty vehicles, spe-cifically calling for the displacement of conventional ferrous castings with low-density magnesium, aluminum, and advanced high-strength steel (AHSS) castings.37
Lightweight ferrous castings have not been a major focus of the automotive industry to date, due to the obvious benefits of lower-density casting
37 U.S. Department of Energy, Vehicle Technologies Office, Workshop Report: Light-Duty Vehicles Technical Requirements and Gaps for Lightweight and Propulsion Materials (2013). Retrieved from http://www1.eere.energy.gov/vehiclesandfuels/pdfs/wr_ldvehicles.pdf.
materials and the challenge of casting the high-melting point ferrous alloys into thin-wall part designs. Yet, ferrous alloys, especially steel, potentially offer advantages in terms of both weight reduction and weight reduction per unit cost increment compared to non-ferrous alloys. New multiphasic steels conceivably provide a much higher specific strength (strength per density, aluminum = 90 KN*m/kg, bainitic steel = 321 KN*m/kg) than that of even aerospace aluminums, despite having more than twice the density (ρaluminum = ~2.7 g/cc, ρsteel = ~7.8 g/cc). The production of aluminum at high volume costs roughly $2.50/lb whereas steel is estimated at less than $2.00/lb (Table 6).38 This next
38 Estimates provided by Detroit Materials via email, July 5, 2016.
Figure 12. Castings account for a large number of components within each light-duty vehicle subsystem, made from a series of materials, namely aluminum, ductile iron, steel, and recently magnesium.
Table 6. Comparison of selection of common casting materials utilized by the transportation industry for vehicle lightweighting.
Tensile Strength
(MPa)
Yield Strength
(MPa)Ductility
(%)Modulus
(GPa)Density (g/cm3)
Cost ($/lb)
DM Micro-Alloyed UHSS 1440 1100 11 250 7.75 $2.00
ADI 900 650 9 160 7.10 $1.90
Sibodur 700 440 10 175 7.10 $1.20
EN-GJS 450 310 10 175 7.20 $0.90
Aluminum 240 196 8 77 2.71 $2.50
Source: Detroit Materials.

LIGHTWEIGHTING TECHNOLOGY DEVELOPMENT AND TRENDS IN U.S. PASSENGER VEHICLES
WORKING PAPER 2016-25 INTERNATIONAL COUNCIL ON CLEAN TRANSPORTATION 17
generation of lightweighting via thin-wall ultrahigh-strength steel (UHSS) components will require sig-nificant engineering of not only the material but also the manufacturing process in order to offer cost-effective solutions.
Recent developments in micro-alloyed steels featuring carefully engineered quantities of manganese, molybdenum and s i l icon have resulted in an UHSS with extremely high specific strength after heat treatment, with the ability to cast uniquely thin-wal l shapes and complex geometries through simple low-cost gravity fed sand casting processes. Initial results collected by Detroit Materials Inc., an advanced materials development firm, indicate that these new alloys have the ability to cast shapes with transitions from greater than 30 mm in thickness to less than 3 mm without the effects of hot-tearing or substantial porosity (Figure 13).
This series of UHSS alloys can then be heat-treated to provide extreme strength without significantly sac-rificing ductility. Quenching while avoiding a martensitic transition reduces the d istort ion of the material during heat treatment, also a significant advantage for thin
and complex castings. This creates a material with a specific strength well beyond that of high-strength aluminums, ductile irons, highly alloyed ductile irons such as Sibodur, and even austempered ducti le irons (ADI), as shown in Figure 14. If specific strength is normalized with the high production volume cost ($/lb) of each material, micro-alloyed UHSS also has a strong advantage in terms of lightweight-ing potential per dollar. Even though the production cost of quench and tempered UHSS is substantially higher than low-strength ductile
iron (EN-GJS-45-10), primarily due to the cost of heat treatment, it still offers cost savings per pound compared to aluminum.
Comparing normalized specific strength against ductile iron (EN-GJS-45-10) allows for an under-standing of the potential for weight reduction, shown in the left half Figure 15. Based on this approach, micro-alloyed UHSS castable alloys reduce weight by 67% compared to ductile iron when designing based on tensile strength and 71% reduction based on yield strength—higher than other castable alloys. Combining the
Figure 13. Left, 50 mm × 100 mm × 2.6 mm coupon cast with Detroit Materials UHSS alloy. Right, geometrically complex casting of a differential case using Detroit Materials UHSS alloy.
0
50
100
150
200
DM ADI Sibodur EN-GJS Aluminum
Spec
ific
pro
per
ty (
KN
-m/k
g)
UTS/Density YS/Density
0
20
40
60
80
100
120
DM ADI Sibodur EN-GJS Aluminum
Spec
ific
pro
per
ty p
er d
olla
r (K
N-m
/$-k
g) UTS/$*Density YS/$*Density
Figure 14. Left, comparison of specific strength of micro-alloyed UHSS to standard automotive casting materials in terms of both ultimate tensile strength (UTS/Density) and yield strength (YS/Density). Right, comparison of specific strength of material also normalized to high-volume production costs, including heat treatment, per pound of material.
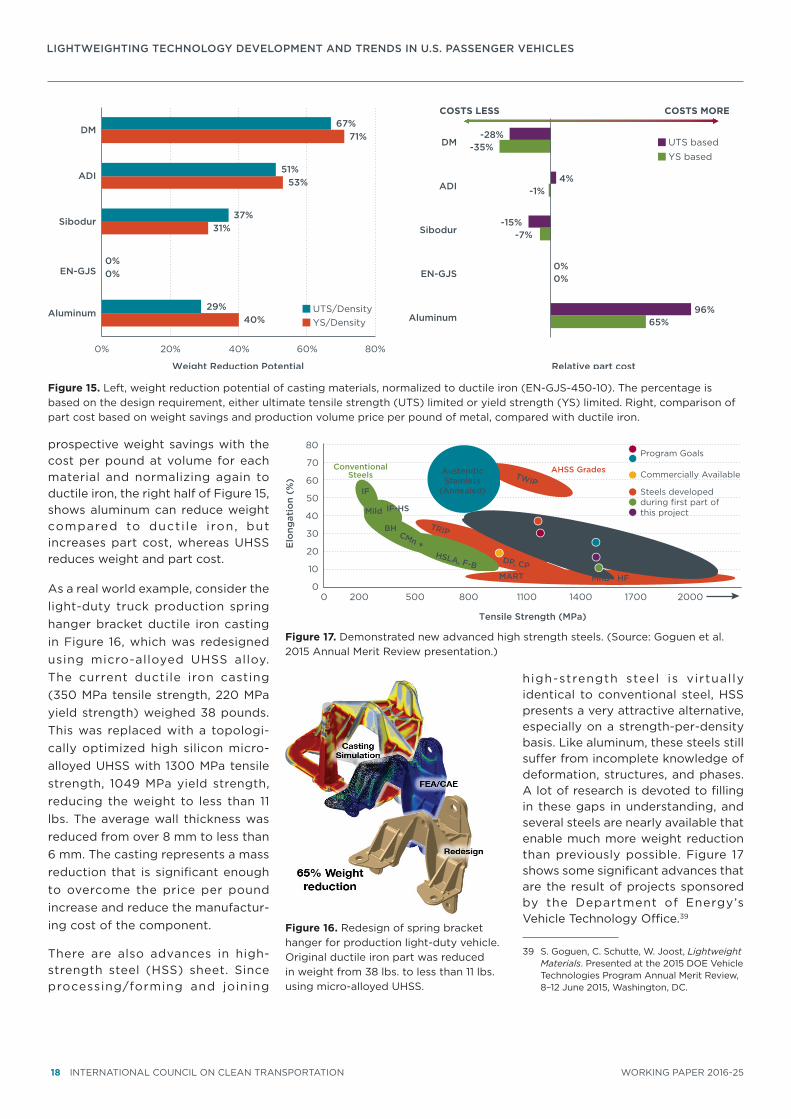
LIGHTWEIGHTING TECHNOLOGY DEVELOPMENT AND TRENDS IN U.S. PASSENGER VEHICLES
18 INTERNATIONAL COUNCIL ON CLEAN TRANSPORTATION WORKING PAPER 2016-25
prospective weight savings with the cost per pound at volume for each material and normalizing again to ductile iron, the right half of Figure 15, shows aluminum can reduce weight compared to ducti le i ron, but increases part cost, whereas UHSS reduces weight and part cost.
As a real world example, consider the light-duty truck production spring hanger bracket ductile iron casting in Figure 16, which was redesigned using micro-alloyed UHSS alloy. The current ductile iron casting (350 MPa tensile strength, 220 MPa yield strength) weighed 38 pounds. This was replaced with a topologi-cally optimized high silicon micro-alloyed UHSS with 1300 MPa tensile strength, 1049 MPa yield strength, reducing the weight to less than 11 lbs. The average wall thickness was reduced from over 8 mm to less than 6 mm. The casting represents a mass reduction that is significant enough to overcome the price per pound increase and reduce the manufactur-ing cost of the component.
There are also advances in high-strength steel (HSS) sheet. Since processing/forming and joining
high-strength steel is virtual ly identical to conventional steel, HSS presents a very attractive alternative, especially on a strength-per-density basis. Like aluminum, these steels still suffer from incomplete knowledge of deformation, structures, and phases. A lot of research is devoted to filling in these gaps in understanding, and several steels are nearly available that enable much more weight reduction than previously possible. Figure 17 shows some significant advances that are the result of projects sponsored by the Department of Energy’s Vehicle Technology Office.39
39 S. Goguen, C. Schutte, W. Joost, Lightweight Materials. Presented at the 2015 DOE Vehicle Technologies Program Annual Merit Review, 8–12 June 2015, Washington, DC.
Figure 16. Redesign of spring bracket hanger for production light-duty vehicle. Original ductile iron part was reduced in weight from 38 lbs. to less than 11 lbs. using micro-alloyed UHSS.
40%
0%
31%
53%
71%
29%
0%
37%
51%
67%
0% 20% 40% 60% 80%
Aluminum
Sibodur
ADI
DM
Weight Reduction Potential
65%
0%
-7%
-1%
-35%
96%
0%
-15%
4%
-28%
COSTS LESS COSTS MORE
Aluminum
EN-GJSEN-GJS
Sibodur
ADI
DM
Relative part cost
UTS/DensityYS/Density
UTS basedYS based
Figure 15. Left, weight reduction potential of casting materials, normalized to ductile iron (EN-GJS-450-10). The percentage is based on the design requirement, either ultimate tensile strength (UTS) limited or yield strength (YS) limited. Right, comparison of part cost based on weight savings and production volume price per pound of metal, compared with ductile iron.
20
30
10
50
40
00 200 500 800
Tensile Strength (MPa)
1100 1400 1700 2000
60
80
70
Elo
ngat
ion
(%)
ConventionalSteels
AHSS GradesAusteniticStainless
(Annealed)IF
IF-HS
MART MnB+ HF
3rd GEN AHSS
TWIP
Current 3rd GEN AHSSDP, CP
Mild
BHCMn +
TRIP
HSLA, F-B
Program Goals
Commercially Available
Steels developedduring first part of this project
Figure 17. Demonstrated new advanced high strength steels. (Source: Goguen et al. 2015 Annual Merit Review presentation.)

LIGHTWEIGHTING TECHNOLOGY DEVELOPMENT AND TRENDS IN U.S. PASSENGER VEHICLES
WORKING PAPER 2016-25 INTERNATIONAL COUNCIL ON CLEAN TRANSPORTATION 19
PLASTICS AND COMPOSITES
New designs and functional inte-gration can reduce mass, size, and cost simultaneously while improving performance.
Broader adoption of thermoplastic materials is expected in applications where they are proven, and greater penetration is expected in new applica-tions as they are validated. Functional integration is also a significant method for reducing material cost and weight. By integrating components and materials, designs may be optimized and simplified. This is a particular benefit of polymer based or multi-material based design solutions. The industry is expected to validate a greater number of applications based on hybrid solutions or use of multiple materials, such as thermoplastics and metal. For example metal/plastic hybrid reinforcements for vehicle BIW components like A/B/C pillars, floor rockers, and floor cross-bars shows potential for 5–8 kg reduction from the BIW without compromising crashworthiness.40 Another example is integrated pump and valve solutions, which share housings, reduce the risk of leakage from fasteners and connec-tions, and are used to improve power-train system performance.
One such application already on a production vehicle is a floor rocker reinforcement on the 2015 Jeep Renegade, which replaces multiple steel stampings and not only meets requirements for side-crash perfor-mance but achieves about 50% weight savings.41 The part, molded out of a
40 D. Munjurulimana et al., “Body-in-White Reinforcements for Light-Weight Automobiles,” SAE Technical Paper 2016-01-0399, 2016. doi:10.4271/2016-01-0399. D. Nagwanshi et al. (2016). Vehicle Lightweighting and Improved Crashworthiness—Plastic/Metal Hybrid Solutions for BIW. Presented at Society of Plastic Engineers Annual Technology Conference (SPE ANTEC), 23–25 May 2016, Indianapolis, IN.
41 Lilli Sherman, Plastics Technology (February 2016). Several ‘Firsts’ Among 2015 SPE Automotive Innovation Awards.
blend of polyamide and modified poly-phenylene ether polymer, is based on a thermoplastic honeycomb design with metal flanges. The part is electrocoat capable and allows for easy assembly.
Another s igni f icant change is continuing improvements in higher-temperature-resistant polymers, which allow lower density materials to be used for further replacement of metals. The future is oriented around fully harnessing the potential of thermoplastic composite materials. Wi t h co n t i n u e d a d va n ce s i n materials, processing methods, and joining technologies, further weight reduction opportunities will open and allow vehicle manufacturers to target new applications.
Continuous fiber composite materials are very attractive for lightweighting because of their excellent strength and stiffness properties and low density; however, high costs and long cycle times limit high volume production, especially those that are thermoset-based. Thermoplastic-based continuous fiber composite solutions can help bridge the gap to reduced cycle times.
As a noteworthy example of the potential, Ford implemented the first mass-production carbon-fiber wheel on the Shelby GT350R Mustang.42
With this progress and continued innovation, one can expect usage of thermoplastics and composite solutions to grow. Still, the pace of change and the extent of penetration are uncertain. Composite materials, in particular, present significant com-plexities. Despite the challenges, the potential benefits are significant.
Retrieved from http://www.ptonline.com/articles/several-firsts-among-2015-spe-automotive-innovation-awards
42 Ford Motor Company, “Ford releases details on world’s first mass-produced carbon fiber wheels for Shelby GT350R Mustang,” July 20, 2015. Retrieved from https://media.ford.com/content/fordmedia/fna/us/en/news/2015/07/10/gt350r-carbon-fiber-wheels.html.
ASSEMBLY/JOINING/BONDING
Joints and bonds are an indispensible part of any vehicle assembly. Yet the properties of joints are quite complex. Conventional steel fastening—generally, welding or bolts—can add weight and create stress concentra-tions (at holes, or contact points), but can also usually be simply repaired and is in widespread use. Adhesive bonding distributes loads over a broader surface and can weigh less, but is comparatively less well understood and more difficult to repair. Combining the benefits of both methods of assembly could enable more varied multi-material construc-tion, which is key to lightweighting.
As an example of current research in this area, engineers at the Composite Vehicle Research Center at Michigan State University have demonstrated reparable, multi-material bonds in three different joint types. Like other advanced lightweighting research, advanced computational simulations helped the development of these new adhesives.43
The market for structural adhesives in vehicles is growing at 4%–5%/year ($2b in 2014).44 Currently, an average car contains almost 30 pounds of adhesives, and much of this is very strong, able to withstand stresses exceeding 6000 psi. As more composites, aluminum, and magnesium are added to steel vehicles, these adhesives will provide more structural purposes, due to the difficulty in welding dissimilar metals and the incompatibility with composites.
43 M. Haq, L. Drzal, Active, Tailorable Adhesives for Dissimilar Material Bonding, Repair and Assembly [Project ID #: LM087]. Presented at the 2016 Annual Merit Review, 6–10 June 2016, Washington, DC.
44 James R. Hagerty, Mike Ramsey, “Super Glues Are the Secret to Making Cars Lighter,” Wall Street Journal, September 8, 2014, http://www.wsj.com/articles/super-glues-are-the-secret-to-making-cars-lighter-1410196062.

LIGHTWEIGHTING TECHNOLOGY DEVELOPMENT AND TRENDS IN U.S. PASSENGER VEHICLES
20 INTERNATIONAL COUNCIL ON CLEAN TRANSPORTATION WORKING PAPER 2016-25
Although adhesives have a variety of uses (stiffening, noise dampening, replacing welds/rivets), they do not yet perform well at high temperatures, and are degraded by oil, grease, and dirt. They can also make disassembly more difficult. The biggest challenge is a lack of training/knowledge with adhesives among engineers. For example, it is not as easy to evaluate whether glue is “tight” as it is with a screw.
Tape can be used for bonding, too.45 Tape also has the advantage that it can be used to help stiffen panels and sheet metal. Thus, thinner/lighter steel, backed with tape, can achieve the same rigidity as a thicker, heavier panel. In this way, weight can be reduced by as much as 20%. Nitto Denko Corp., a tape supplier, forecasts tape revenue to soar 39% to $1.36b by March 2017 from $984.4m in 2013–2014.
NEW ARCHITECTURES/COMPUTATION
A potential hindrance to vehicle design optimization for lightweight-ing is that global manufactur-ers offer a wide variety of vehicle models across numerous markets with different fuel economy/GHG standards and customer expecta-tions. One solution to this challenge is a unified global platform, in which bodies are shared and the number of overall models is reduced.46 For example, under the Toyota New Global Architecture (TNGA), Toyota
45 Hans Greimel, “Tape emerges as go-to wonder bond,” Auto News, August 4, 2014, http://www.autonews.com/article/20140804/OEM10/308049984/tape-emerges-as-go-to-wonder-bond.
46 Larry P. Vellequette, “Comau helps automakers meet changing mpg goal,” Auto News, August 4, 2014, http://www.autonews.com/article/20140804/OEM10/308049973/comau-helps-automakers-meet-changing-mpg-goals. Hans Greimel, “Toyota expects weight savings, mpg gains,” Auto News, November 25, 2013, http://www.autonews.com/article/20131125/OEM01/311259956/toyota-expects-weight-savings-mpg-gains
expects to reduce vehicle weight by 20% in transforming its entire lineup by 2020. With this strategy, fewer models can achieve greater optimi-zation and correspondingly greater efficiency. Some manufacturers are even working together to produce specific parts and designs for one another, in an effort to reduce costs.47
Consumer AcceptanceLightweighting has many benefits beyond fuel savings that have sub-stantial value to customers. These benefits include better performance, ride, handling, and braking, as well as higher towing and payload capacity. For the 2025 rule, EPA and NHTSA did not evaluate the value of these benefits to consumers, instead assigning the entire cost of lightweighting to fuel consumption/CO2 reductions. This is not appropriate and dramatically understates the benefits of light-weighting and overstates the cost to reduce fuel consumption and CO2.
The additional value of lightweight-ing is supported by a 2015 report published by the National Academy of Sciences (NAS),48 which projected that manufacturers will reduce light-truck mass by 20% in 2025, despite very high cost ($1,617–$2,343 for a 5,550 pound truck). They reached this determination because “implementa-tion of mass reduction techniques can provide several benefits that might be attractive to an OEM.”
As an example, the Ford Motor Company website for the F-150 pickup truck 49 does not even
47 Larry P. Vellequette, “Comau helps automakers meet changing mpg goals,” Auto News, August 4, 2014, http://www.autonews.com/article/20140804/OEM10/308049973/comau-helps-automakers-meet-changing-mpg-goals.
48 National Research Council, Cost, Effectiveness, and Deployment of Fuel Economy Technologies for Light-Duty Vehicles (Washington, DC: National Academies Press), 2015. doi:10.17226/21744. (see pp. 6–10, specifically).
49 http://www.ford.com/trucks/f150/
mention improved fuel economy when discussing the aluminum body benefits on the front page:
“ THE MATERIAL THAT MADE EVERY OTHER TRUCK HISTORY”
“ The use of high-strength, military-grade, aluminum alloy not only makes F-150 lighter and more agile than ever before, it’s also one of the reasons it can haul and tow more than any other half-ton pickup. See the story of this revolutionary advance in truck manufacturing.”
And manufacturers themselves are expressing a high level of confidence in lightweighting. A 2014 DuPont-sponsored WardsAuto survey determined that lightweighting goals are at the top of manufacturers’ design efforts.50 49% of companies surveyed said that lightweighting is their main strategy for meeting 2025 standards. 39% cited engine efficiency and 26% focused on electrification, rounding out the top three answers. Power-train systems are the biggest target: aluminum will be heavily relied upon, along with plastics and composites. No single material was identified as most heavily relied upon in the future, although aluminum and magnesium were deemed likely among metals, followed by steel. And, of course, multi-material solutions will also be significant in reducing weight.
Manufacturers are not confident that current technology can be used to achieve the desired weight reductions. Two-thirds of respondents believed emissions standards would become more stringent, but less than one-fifth are confident today’s material portfolio is sufficient to meet 2025 CAFE standards. Instead, OEMs seek more support from advanced materials suppliers.
50 “Lightweighting goals top automotive design and manufacturing survey,” Composites World, August 11, 2014, http://www.compositesworld.com/news/lightweighting-goals-top-automotive-design-and-manufacturing-survey.

LIGHTWEIGHTING TECHNOLOGY DEVELOPMENT AND TRENDS IN U.S. PASSENGER VEHICLES
WORKING PAPER 2016-25 INTERNATIONAL COUNCIL ON CLEAN TRANSPORTATION 21
SafetyThe past ten years have seen extensive analyses of the impact of vehicle size and weight on injuries and fatalities in crashes, but these analyses implicitly assume that the material composition of the vehicle does not change. Recently, a study from Lawrence Berkeley National Laboratory concluded that there was little correlation between fatality risk per vehicle mile travelled (VMT) and curb weight or footprint.51
Aluminum and high-strength steel also have better crash properties than conventional steel, as they absorb a higher percentage of the crash forces. In fact, the early deployment of high-strength steel was done primarily to improve safety and crash projection; the fuel-economy improvement was not considered the primary benefit. For example, the 2006 Honda Civic increased its used of 590 MPa steel from 11% to 38% to simulta-neously improve fuel economy and crash performance. The 2006 Civic increased its IIHS Side Impact score by one rating category due to the addition of high-strength steel, used extruded aluminum for the bumper beams to increase absorpt ion efficiency, and used magnesium for the steering wheel hub/core due to magnesium’s low inertia and high tunability for breakaway (to protect unbelted drivers).52
DiscussionThere are two different ways to reduce costs of materials used in building cars and trucks. One is to optimize design and thickness, using steadily improving
51 Tom Wenzel, Relationships between Vehicle Mass, Footprint, and Societal Risk. Presented at the 2014 DOE Vehicle Technologies Program Annual Merit Review, 17 June 2014, Washington, DC.
52 Mark Pafumi and Peter Cardimen, Maximizing the Safety and Fuel Economy Balance with Material and Design Optimization. Presented at the 2006 SAE Government/Industry Meeting, Washington DC, 9 May 2006.
computational tools. This reduces the use of unneeded material, resulting in both cost and weight reductions. The second is to use higher-strength materials, such that the higher cost of the substituted material is offset by the lower amount of material needed. The Ricardo evaluation of the Audi A8 B-pillar is an excellent example of how higher-strength materials and improved design can simultaneously reduce weight and cost.
As discussed above, teardown studies of lightweighting costs were not finished in time to be considered in the 2017-2025 rule. There are also numerous material improvements that were not considered in the 2017–2025 rule. These include higher strength aluminum, improved joining techniques for mixed materials, third-generation steels with higher strength and enhanced ductility, a new generation of UHSS cast components, and metal/plastic hybrid components.
These ongoing improvements in materials and design will lower vehicle-production costs below the levels projected by the agencies. For example, Figure 18 shows the cost per kilogram reduced of various materials
as a function of the percent change in mass. Each point represents a single reported value of a specific part or material. Sources include both current/in-production and estimated/developing costs and benefits.53
The blue line shows the agencies’ predicted cost-benefit curve: the slope is about $9.59 per percent weight reduction per ki logram reduced. Ricardo and the Department of Energy independently developed estimates for industry maximum
53 P. Bubna and M. Wiseman, “Impact of Light-Weight Design on Manufacturing Cost - A Review of BMW i3 and Toyota Corolla Body Components,” SAE Technical Paper 2016-01-1339, 2016, doi:10.4271/2016-01-1339. Detroit Materials email correspondence, July 5, 2016. Mascarin et al., Technical Cost Modeling for Vehicle Lightweighting: 40% and 45% Weight Reduction [Project ID # LM090]. Presented at the 2015 Annual Merit Review, 11 June 2015, Washington, DC. Joann Muller, “Inside the Numbers: Why Ford Won’t Lose Its Shirt Building the Pricey New Aluminum F-150 Pickup,” Forbes Autos, November 10, 2014, http://www.forbes.com/sites/joannmuller/2014/11/10/inside-the-numbers-how-ford-wont-lose-its-shirt-building-the-pricey-new-aluminum-f-150-pickup/2/#6f8430bd73dd. Martin Kahl, Xavier Boucherat, “Special Report: Vehicle Lightweighting,” Automotive World, February 2016, http://www.automotiveworld.com/research/special-report-vehicle-lightweighting/
AGENCY ESTIMATED MAXINCREMENTAL COST
Aluminum
Carbon Fiber
HSS
Magnesium
RICARDO AND DEPT OFENERGY INCREMENTAL MAXCOST RANGE
ALUMINUM TRENDLINE
-$5
$0
$5
$10
$15
$20
$25
$30
$35
0% 10% 20% 30% 40% 50% 60% 70% 80%
Uni
t Cos
t ($
/kg
red
uced
)
Percent of Mass Reduction
Figure 18. Potential mass reduction (%) vs. cost per kg reduced.
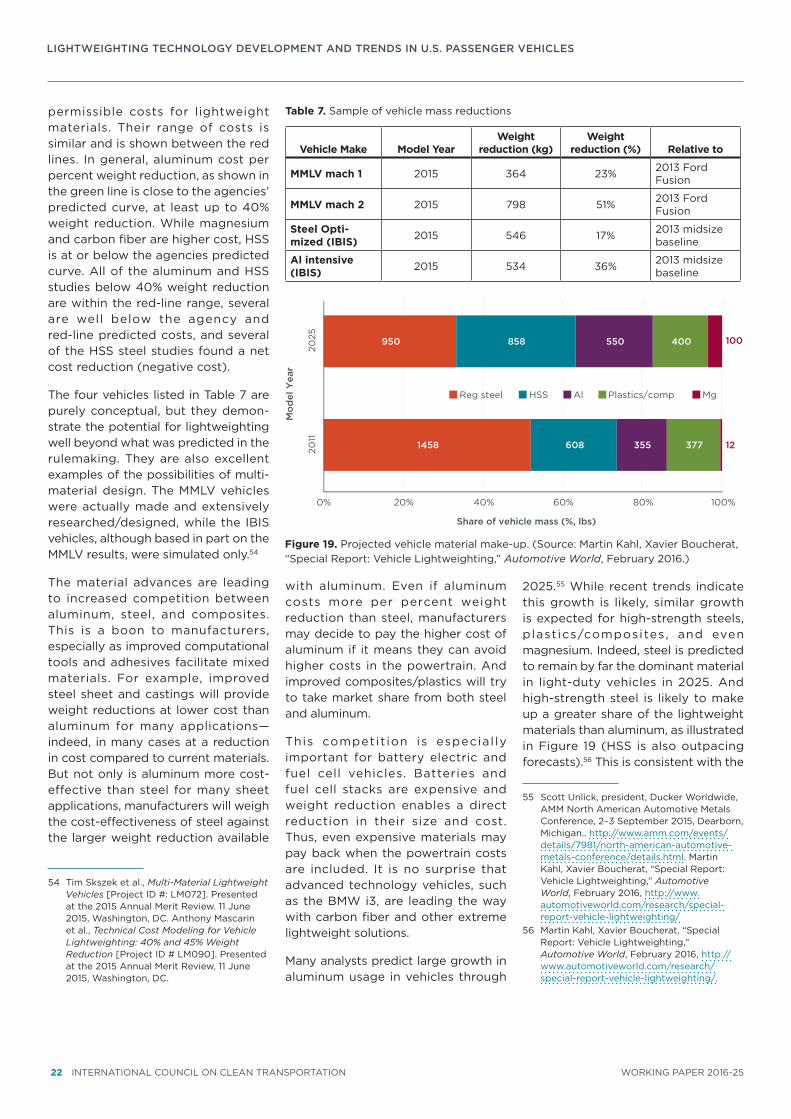
LIGHTWEIGHTING TECHNOLOGY DEVELOPMENT AND TRENDS IN U.S. PASSENGER VEHICLES
22 INTERNATIONAL COUNCIL ON CLEAN TRANSPORTATION WORKING PAPER 2016-25
permissible costs for lightweight materials. Their range of costs is similar and is shown between the red lines. In general, aluminum cost per percent weight reduction, as shown in the green line is close to the agencies’ predicted curve, at least up to 40% weight reduction. While magnesium and carbon fiber are higher cost, HSS is at or below the agencies predicted curve. All of the aluminum and HSS studies below 40% weight reduction are within the red-line range, several are well below the agency and red-line predicted costs, and several of the HSS steel studies found a net cost reduction (negative cost).
The four vehicles listed in Table 7 are purely conceptual, but they demon-strate the potential for lightweighting well beyond what was predicted in the rulemaking. They are also excellent examples of the possibilities of multi-material design. The MMLV vehicles were actually made and extensively researched/designed, while the IBIS vehicles, although based in part on the MMLV results, were simulated only.54
The material advances are leading to increased competition between aluminum, steel, and composites. This is a boon to manufacturers, especially as improved computational tools and adhesives facilitate mixed materials. For example, improved steel sheet and castings will provide weight reductions at lower cost than aluminum for many applications—indeed, in many cases at a reduction in cost compared to current materials. But not only is aluminum more cost-effective than steel for many sheet applications, manufacturers will weigh the cost-effectiveness of steel against the larger weight reduction available
54 Tim Skszek et al., Multi-Material Lightweight Vehicles [Project ID #: LM072]. Presented at the 2015 Annual Merit Review. 11 June 2015, Washington, DC. Anthony Mascarin et al., Technical Cost Modeling for Vehicle Lightweighting: 40% and 45% Weight Reduction [Project ID # LM090]. Presented at the 2015 Annual Merit Review, 11 June 2015, Washington, DC.
with aluminum. Even if aluminum costs more per percent weight reduction than steel, manufacturers may decide to pay the higher cost of aluminum if it means they can avoid higher costs in the powertrain. And improved composites/plastics will try to take market share from both steel and aluminum.
This competit ion is especial ly important for battery electric and fuel cell vehicles. Batteries and fuel cell stacks are expensive and weight reduction enables a direct reduction in their size and cost. Thus, even expensive materials may pay back when the powertrain costs are included. It is no surprise that advanced technology vehicles, such as the BMW i3, are leading the way with carbon fiber and other extreme lightweight solutions.
Many analysts predict large growth in aluminum usage in vehicles through
2025.55 While recent trends indicate this growth is likely, similar growth is expected for high-strength steels, plast ics/composites, and even magnesium. Indeed, steel is predicted to remain by far the dominant material in light-duty vehicles in 2025. And high-strength steel is likely to make up a greater share of the lightweight materials than aluminum, as illustrated in Figure 19 (HSS is also outpacing forecasts).56 This is consistent with the
55 Scott Unlick, president, Ducker Worldwide, AMM North American Automotive Metals Conference, 2–3 September 2015, Dearborn, Michigan.. http://www.amm.com/events/details/7981/north-american-automotive-metals-conference/details.html. Martin Kahl, Xavier Boucherat, “Special Report: Vehicle Lightweighting,” Automotive World, February 2016, http://www.automotiveworld.com/research/special-report-vehicle-lightweighting/
56 Martin Kahl, Xavier Boucherat, “Special Report: Vehicle Lightweighting,” Automotive World, February 2016, http://www.automotiveworld.com/research/special-report-vehicle-lightweighting/.
0% 20% 40% 60% 80% 100%
1458 608 355 377 122011
950 858 550 400 100
2025
Share of vehicle mass (%, lbs)
Mo
del
Yea
r
Reg steel HSS Al Plastics/comp Mg
Figure 19. Projected vehicle material make-up. (Source: Martin Kahl, Xavier Boucherat, “Special Report: Vehicle Lightweighting,” Automotive World, February 2016.)
Table 7. Sample of vehicle mass reductions
Vehicle Make Model YearWeight
reduction (kg)Weight
reduction (%) Relative to
MMLV mach 1 2015 364 23% 2013 Ford Fusion
MMLV mach 2 2015 798 51% 2013 Ford Fusion
Steel Opti-mized (IBIS) 2015 546 17% 2013 midsize
baseline
Al intensive (IBIS) 2015 534 36% 2013 midsize
baseline

LIGHTWEIGHTING TECHNOLOGY DEVELOPMENT AND TRENDS IN U.S. PASSENGER VEHICLES
WORKING PAPER 2016-25 INTERNATIONAL COUNCIL ON CLEAN TRANSPORTATION 23
new generation of steels forecast by Detroit Materials.
Many improvements in both materials and design have already been incor-porated into the fleet. This is illus-trated by the many recent vehicle redesigns that reduced weight by at least 4%, as summarized in Table 5. Not only is lightweighting already matching the agencies’ projections for 2021, if not 2025, but there are two more redesign cycles before 2025. Given the steady, ongoing improvements in both materials and design, it is reasonable to assume that this 5% weight reduction will also be achieved in each of the next two design cycles. Thus, by 2025 weight should be reduced by about 15%.
Most of this weight reduction will come from increased use of aluminum and high-strength steel and improved designs. Improved designs will reduce cost, as they allow for reductions in material use. As discussed above, more ductile sheet steel, new steel castings, and improved composites/plastics should enable weight reduction at little cost, if not cost reductions. As discussed above and shown in Figure 18, aluminum should cost approximately as much as estimated by the agencies in the rule. Figure 20 combines these approximate trends in a plot of total cost versus percent weight reduction. Although the amount of weight reduction (and cost) contributed by each option is still somewhat uncertain, all three will contribute substantially and overall weight reduction is likely to be split fairly evenly between these three methods. Thus, not only is it likely that weight can be reduced by 15% by 2025, or roughly twice the agency’s projections, it is likely that overall costs of this 15% weight reduction will be less than a third of that estimated by the agencies.
Data from Ducker Worldwide and Henkel Automotive Division, NA.
The benefits of weight reduction and better design extend far beyond fuel economy. Lighter-weight vehicles accelerate faster, and ride, handling, and braking are all improved, plus the design improvements reduce NVH and improve crash protection. Not to mention the increased load and towing capacity for trucks and the large secondary cost reductions for battery-electric and fuel cell vehicles. In fact, fuel economy may not even be the primary reason for the current proliferation of lighter vehicle designs.
SummaryMany advances in lightweighting have surpassed agency predic-tions in 2012. Stronger and lighter materials are available at lower costs than assumed. Advances in modeling/simulation tools and joining techniques have opened the floodgates to unprecedented levels of material/design optimization. And even more improvements in both materials and design are on their way.
Suppliers are rapidly developing the advanced materials and methods for major lightweighting endeavors,
as well as the computational tools for simulating full vehicles all the way down to nanoscopic material behavior. These tools and techniques build upon an already highly sophis-ticated arsenal that manufacturers are using today to make vehicles stronger and lighter than antici-pated in the rulemaking (Table 5). Many recent vehicle redesigns have reduced weight by at least 4%, already meeting or exceeding 2021 projections in the rule. There are numerous material improve-ments in development that were not considered in the rule, such as higher strength aluminum, improved jo in ing techn iques for mixed materials, third-generation steels with higher strength and enhanced ductility, a new generation of UHSS cast components, and metal/plastic hybrid components.
The cost-effectiveness of aluminum is on track to meet the cost per percent weight reduction in the 2017–2025 rule, improved steels and composites are likely to reduce weight at little or no net cost, and design improvements reduce both weight and cost. Overall, the cost of reducing weight will likely be less than a third of the projections in the rule. When the multiple other
Design
Aluminum
Rulemaking
Steel &Composite range
Net Costsrange
0%$0
Tota
l Co
sts
% weight reduction
Figure 20. Total cost as a function of percent vehicle weight reduction. Note that composites include plastics, but not carbon fiber.

LIGHTWEIGHTING TECHNOLOGY DEVELOPMENT AND TRENDS IN U.S. PASSENGER VEHICLES
24 INTERNATIONAL COUNCIL ON CLEAN TRANSPORTATION WORKING PAPER 2016-25
benefits of reducing weight are considered (ride, handling, braking, performance, load capacity), it is clear that implementation of light-weight materials and better design will be limited only by the speed at which computational tools improve and better materials can be brought to the market. This conclusion is supported by the 2014 WardsAuto survey, which found lightweighting
goals are at the top of manufactur-ers’ design efforts.
Thus, the primary question is, how fast can tools and materials improve and better designs be incorporated into vehicles? The current generation of vehicle redesigns are routinely achieving about 5% weight reduction on average (some are much higher). There are two redesign cycles before
2025 and, given the accelerating pace of computational tool devel-opment and improved materials, it is reasonable that each of these redesign cycles should achieve at least a 5% weight reduction.
Overall, about a 15% weight reduction should be feasible by 2025 at costs about a third of those estimated in the 2017–2025 rule.