Lightweight, High-Resolution Monitoring for Troubleshooting Production Systems S. Bhatia, A. Kumar,...
35
Lightweight, High-Resolution Monitoring for Troubleshooting Production Systems S. Bhatia, A. Kumar, M. E. Fiuczynski, L. Peterson (Princeton & Google), OSDI’08 Shimin Chen LBA Reading Group
-
Upload
derick-obrien -
Category
Documents
-
view
223 -
download
1
Transcript of Lightweight, High-Resolution Monitoring for Troubleshooting Production Systems S. Bhatia, A. Kumar,...

Lightweight, High-Resolution Monitoring for Troubleshooting Production SystemsS. Bhatia, A. Kumar, M. E. Fiuczynski, L. Peterson (Princeton & Google), OSDI’08
Shimin ChenLBA Reading Group

Introduction
Troubleshooting complex software systems is difficult Undetected software bugs Intermittent hardware failures Configuration errors Unanticipated workloads
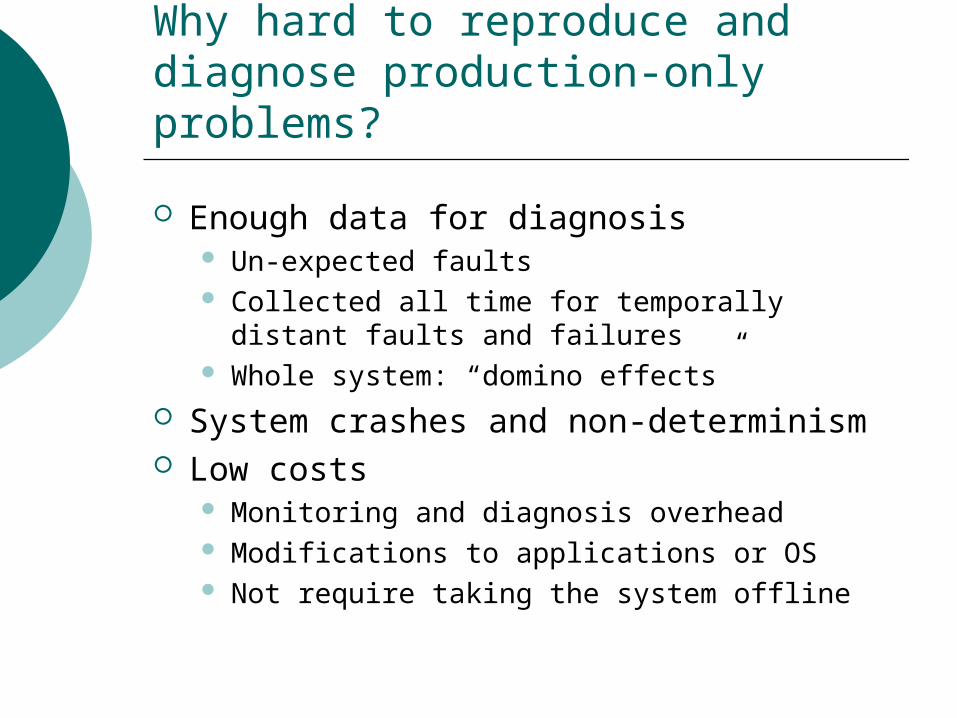
Why hard to reproduce and diagnose production-only problems?
Enough data for diagnosis Un-expected faults Collected all time for temporally distant faults
and failures Whole system: “domino effects”
System crashes and non-determinism Low costs
Monitoring and diagnosis overhead Modifications to applications or OS Not require taking the system offline
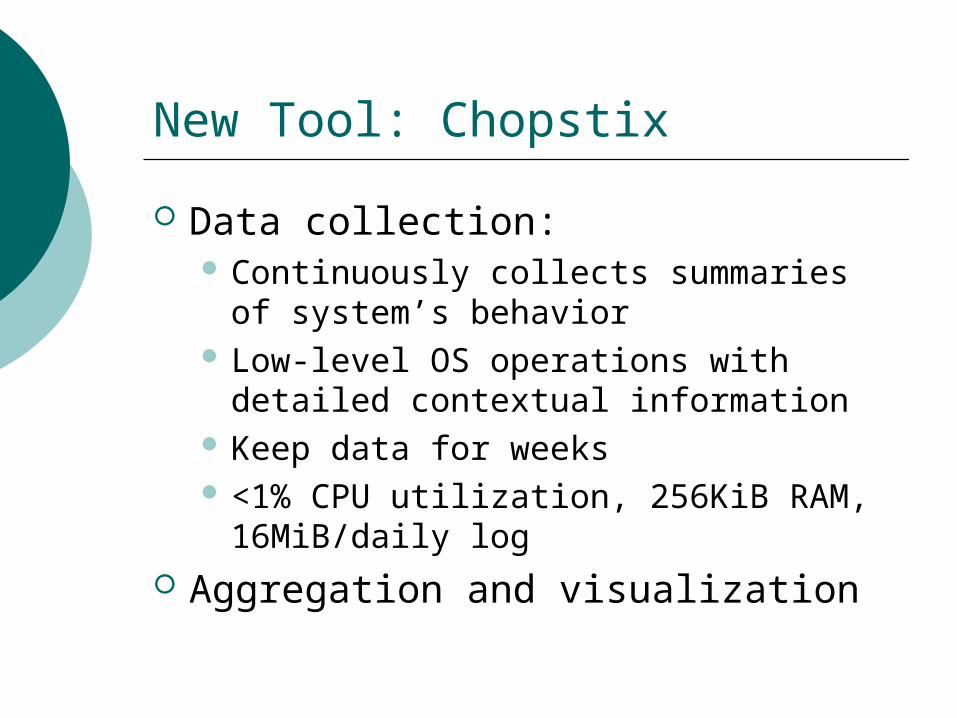
New Tool: Chopstix
Data collection: Continuously collects summaries of
system’s behavior Low-level OS operations with detailed
contextual information Keep data for weeks <1% CPU utilization, 256KiB RAM,
16MiB/daily log Aggregation and visualization

Help diagnose a class of problems
For example:“What was the system doing last Wednesday around 5pm when the ssh prompt latency was temporarily high, yet system load appeared to be low?
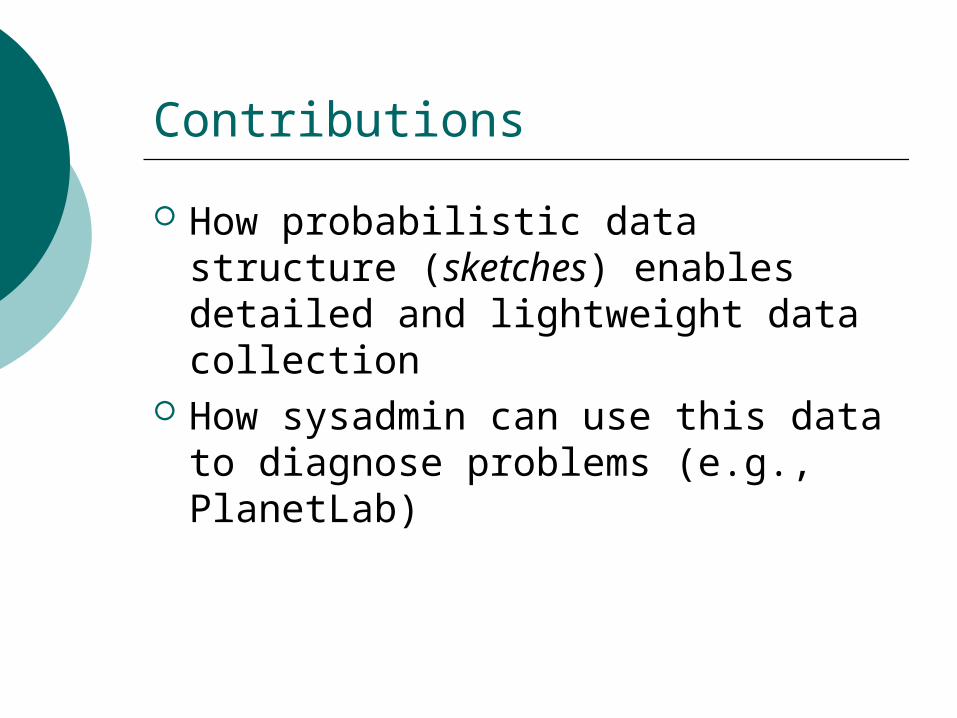
Contributions
How probabilistic data structure (sketches) enables detailed and lightweight data collection
How sysadmin can use this data to diagnose problems (e.g., PlanetLab)
Outline
Introduction System Design (Section 2 & 4) Usage Model (Section 3) Evaluation (Section 5) Discussion (Section 6) Summary
System Components
Data collector Implemented in the kernel Companion user process periodically
copies data from the kernel to disk A polling process fetches data from
every machine in a networked system to a central location
Aggregator Visualizer
Data Collector
Goal: low resource usage & high coverage Solution: sketch-based sampling
Problem of uniform sampling: Infrequent events less likely to be recorded
The idea of sketch: Sampling rate is adjusted for different event
frequency Here, “sketch” means event frequency

Data Collector: five steps
1. A trigger fires for a potentially interesting event;2. The relevant event data structure is retrieved and
a sketch is updated;3. A sampling function is evaluated to determine if
this event should be recorded;4. If so, a sample of relevant information is saved;5. A user-level process periodically polls the kernel
for this data and resets the data structure, thereby defining a data collection epoch.
Event Triggers
Polling has problems Waste when no activity Polling frequency may not be high enough if
high activity Triggers:
Instrument OS interfaces in kernel: E.g., calls to page allocators
For HW stats, such as L2 misses, make the processor generate periodic interrupts. Interrupt handlers are the triggers.
1. A trigger fires for a potentially interesting event;

Sketch Update
“sketch” means event frequency in a given data-collection epoch
To reduce space overheads, use a hash table for all sketches hash key: event type, VM addr, executable
identifier, uid, etc. (event type specific) Experiments show low probability of false
negatives When an event is triggered, compute the hash
index, increment the sketch with a weight Weight: jiffies of the event Longer events have larger weights
2. The relevant event data structure is retrieved and a sketch is updated;

Logarithm Sampling Function
Goal: # samples of any one event = log (event frequency) Implementation:
Choose an integer t=2k
If event frequency is power of t, record sample In other words, if event frequency is an integer with k
zeros, 2k zeros, 3k zeros, …, in the least significant bits, record sample
How to choose t? Low watermark and high watermark (CPU cycles
consumed by Chopstix) Double t if > high watermark in previous epoch Halve t if < low watermark in previous epoch
3. A sampling function is evaluated to determine if this event should be recorded;
Event Sample
Stack trace, uid, program id, other event-specific details
Kernel stack trace: tracing frame pointer User-level stack trace: similar
But stop if the stack is paged out
4. If so, a sample of relevant information is saved;
Epochs
Periodically copy samples and hash table out
Reinitialize hash table Double copies of in-kernel Chopstix
data structure for fast swap
5. A user-level process periodically polls the kernel for this data and resets the data structure, thereby defining a data collection epoch.

Vital Signs (Event Types)
11 vital signs: 1. CPU utilization2. scheduling delay3. resource blocking4. disk I/O activity5. user page allocation6. kernel page allocation7. L2-cache utilization8. system call invocation9. signal delivery10. socket transmission11. mutex/semaphore locking.

More details

Aggregator & Visualizer
Macromedia Flash web interface
Outline
Introduction System Design Usage Model Evaluation Discussion Summary
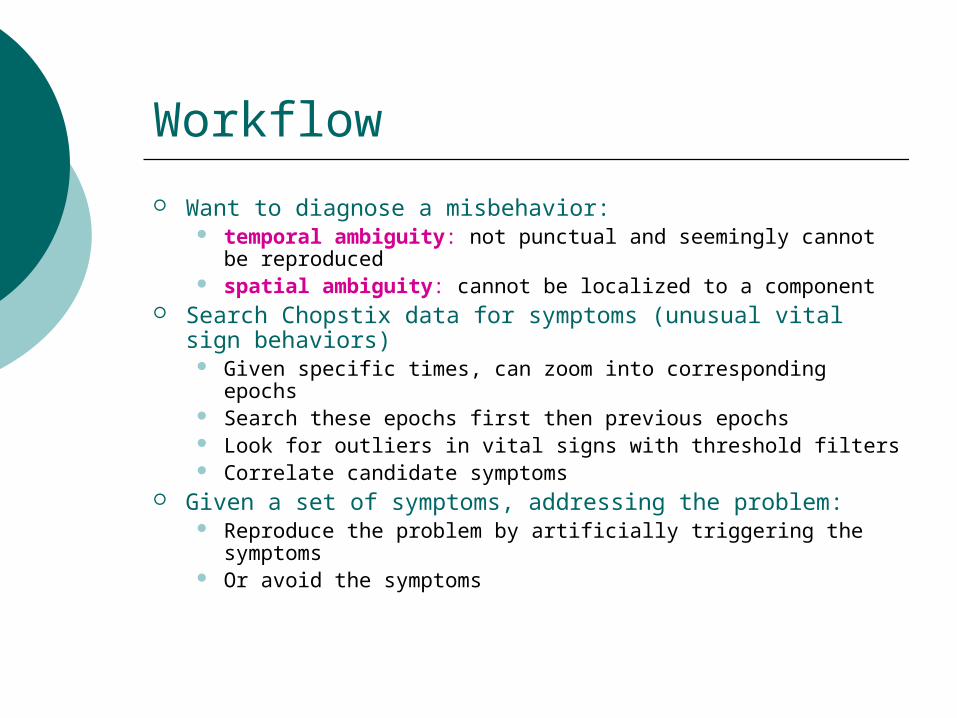
Workflow
Want to diagnose a misbehavior: temporal ambiguity: not punctual and seemingly cannot
be reproduced spatial ambiguity: cannot be localized to a component
Search Chopstix data for symptoms (unusual vital sign behaviors)
Given specific times, can zoom into corresponding epochs Search these epochs first then previous epochs Look for outliers in vital signs with threshold filters Correlate candidate symptoms
Given a set of symptoms, addressing the problem: Reproduce the problem by artificially triggering the
symptoms Or avoid the symptoms

Correlating Symptoms
Interpreting symptoms is “art” The paper describes a collection of
10 guiding rules for understanding symptoms

Rules:
Rule #1: High CPU utilization (cpuu) with a low (nearly-zero) L2-cache-miss rate is a symptom of a busy loop
Rule #2: An increase in the net (user or kernel) memory allocated is an indicator of a memory leak
Rule #3: Unsatisfied I/O requests indicate bad blocks on the disk size of data requested > size of data returned

Rules:
Rule #4: When the combined value of cpuu for processes is low, scheduling delay (sched) is high, and the total cpuu is high for the system, it is often a sign of a kernel bottleneck
See paper for the others
Case Study: observed behavior
Planetlab nodes were observed to crash every 1–7 days without leaving any information on the console or in the system logs.
Shortly before such crashes it was observed that ssh sessions to nodes would stall for tens of seconds.
Some nodes that were running an identical software stack did not suffer these crashes, indicating that the problem was load-dependent.
KDB, NMI watchdog not effective

First Attempt
Resource blocking High I/O activity Find that request-response latencies
stayed low and I/O thruput degraded negligibly during these periods
Not the problem
Second Attempt
Rule #4 High scheduling delays with heavy
CPU utilization A bug in the scheduling loop

Other Examples
Brief descriptions of five other examples in the paper
Outline
Introduction System Design Usage Model Evaluation Discussion Summary
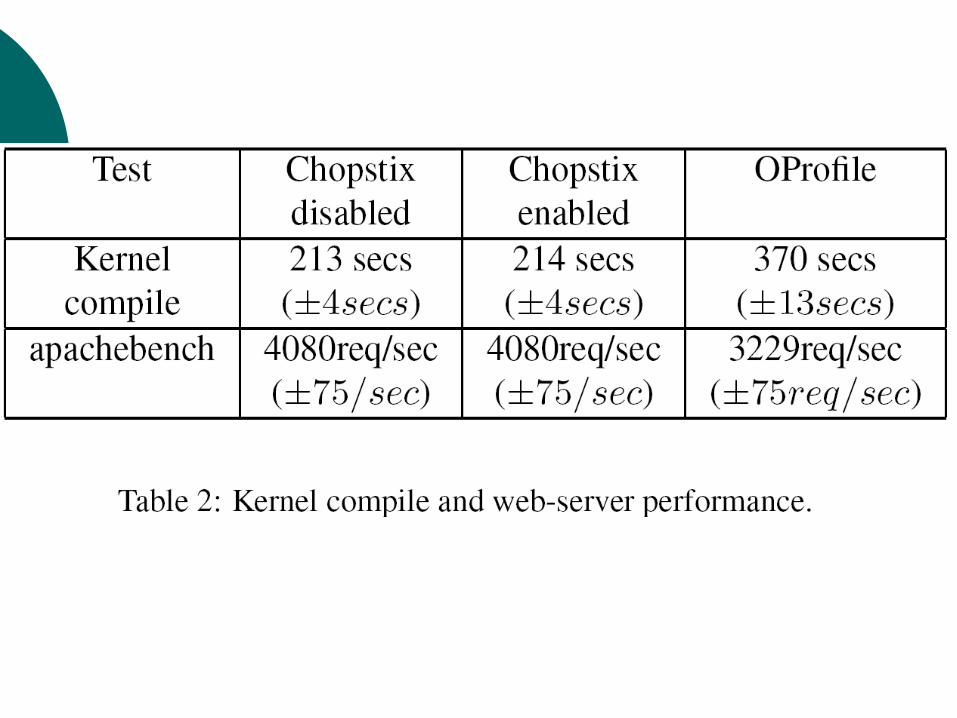
Experimental Setup
Core2Duo, 4GB RAM Linux 2.6.20.1 NMI interrupts for every 107 CPU
cycles and for every 6*105 L2-cache misses

Aggregation/Visualization
Using the data set spanning three days, initialization cost: ~80 seconds if not cached ~3 seconds if cached

Coverage of sketches
Compute the false negative probs The formula is not explained
Vary hash table size and threshold value t in practice
Hash table size: 128—4KiB False negative for each vital signs:
10-3 to 10-4
Discussions
Properties of problems that may be diagnosed via Chopstix: Impact system’s behavior System must stay longer than one
epoch Applicable to other OS
General schemes should be portable Implementation details may vary
Summary
Chopstix: Log succinct summaries Low-level OS events Sketch-based sampling
Real implementation Experience with Planetlab Guiding rules for interpreting vital
signs


![Bhatia small wind[1]](https://static.fdocuments.us/doc/165x107/5576957bd8b42af5528b5134/bhatia-small-wind1.jpg)