Lightning Location Relative to Storm Structure in a Mesoscale
49
Lightning Location Relative to Storm Structure in a Leading-line, Trailing-stratiform Mesoscale Convective System Lawrence D. Carey 1* , Martin J. Murphy 2 , Tracy L. McCormick 3† , and Nicholas W. S. Demetriades 2 1 Department of Atmospheric Sciences Texas A&M University, College Station, TX 2 Vaisala, Tucson, AZ 3 Department of Marine, Earth and Atmospheric Sciences North Carolina State University, Raleigh, NC Submitted to the Journal of Geophysical Research 21 November 2003 * Corresponding Author: Dr. Larry D. Carey, Department of Atmospheric Sciences, Texas A&M University, 3150 TAMU, College Station, TX 77843-3150. Phone: 979-847-9090. E-mail: [email protected] † Current Affiliation: National Weather Service, Boston Forecast Office, Taunton, MA
Transcript of Lightning Location Relative to Storm Structure in a Mesoscale

Lightning Location Relative to Storm Structure in a Leading-line, Trailing-stratiform
Mesoscale Convective System
Lawrence D. Carey1*, Martin J. Murphy2, Tracy L. McCormick3†, and
Nicholas W. S. Demetriades2
1Department of Atmospheric Sciences
Texas A&M University, College Station, TX
2Vaisala, Tucson, AZ
3Department of Marine, Earth and Atmospheric Sciences
North Carolina State University, Raleigh, NC
Submitted to the Journal of Geophysical Research
21 November 2003
* Corresponding Author: Dr. Larry D. Carey, Department of Atmospheric Sciences, Texas A&M University, 3150 TAMU, College Station, TX 77843-3150. Phone: 979-847-9090. E-mail: [email protected] † Current Affiliation: National Weather Service, Boston Forecast Office, Taunton, MA

Abstract. Horizontal and line-normal, vertical cross-sections and composite images of Dallas-
Fort Worth Lightning Detection and Ranging (LDAR II) VHF radiation sources and radar
reflectivity over a thirty minute period provide a unique perspective on lightning pathways
within a leading-line, trailing-stratiform (LLTS) mesoscale convective systems (MCS) on June
16th 2002. The overwhelming majority of VHF lightning sources occurred within the leading
convective line in a bi-modal pattern in the vertical with upper and lower maxima centered at
about 9.5 km and 4.5 km AGL, respectively. A persistent, primary lightning pathway sloped
rearward (by 40-50 km) and downward (by 4-5 km) from the upper VHF source maximum in the
convective line, through the transition zone, and into the radar bright band of the stratiform
region. This slanted pathway was similar to hypothetical trajectories taken by snow particles that
were detrained at the top of the dissipating convection, moved rearward at about 10 m s-1 in the
storm relative front-to-rear flow and downward at about 1 m s-1. A secondary lightning zone
occurred 65-110 km rearward of the convective line in a spatially distinct horizontal layer (3 km
deep) centered at a height of about 8.5 km AGL. The observed total lightning structure was
placed in the context of existing conceptual models of the kinematic, microphysical, radar, and
electrical structure of LLTS MCSs.
ii
1. Introduction
Mesoscale convective systems (MCSs) produce a significant fraction of the warm season
rainfall, lightning, and severe weather in the central United States [e.g., Fritsch et al., 1986;
Goodman and MacGorman, 1986; Houze et al., 1990]. As a result, the concomitant kinematic,
microphysical, electrical, and lightning characteristics of MCSs over this region have received
considerable research attention [e.g., Houze, 1993; MacGorman and Rust, 1998].
Nearly all studies of lightning in MCSs have analyzed exclusively ground flashes in relation
to storm structure [e.g., MacGorman and Rust, 1998 for a review]. One notable exception is
Mazur and Rust [1983], who observed the total lightning structure roughly perpendicular to what
appeared to be a leading-line, trailing-stratiform (LLTS) MCS with radar. Total lightning flash
density in the stratiform region was typically much smaller than in the convective cells.
Lightning possessing radial extent in excess of 20 km tended to occur rearward of the deep
convective cells and in the stratiform region. Since their lightning observations were limited to a
radar beam that was approximately fixed in elevation and azimuth angle, only a two-dimensional
view of mid-level precipitation and lightning flash density could be obtained as the MCS moved
toward the radar (i.e., range vs. time). As a result, little is currently known about the three
dimensional location of lightning within LLTS MCSs.
Recently, lightning networks measuring the time of arrival of impulsive VHF (very high
frequency) radiation using GPS (Global Positioning System) timing have been developed that
provide an accurate and detailed depiction of three-dimensional lightning structure [Rison et al.,
1999]. Results from these networks have provided an unprecedented view of lightning within
isolated convection, multicell storms and supercells [Rison et al., 1999; Krehbiel et al., 2000;
Coleman et al., 2003].
1

Herein, we report on unique observations of the total (i.e., both in-cloud and cloud-to-
ground) lightning structure of a symmetric LLTS MCS [Houze et al., 1989] recorded by the
Vaisala Dallas-Fort Worth (DFW) Lightning Detection and Ranging (LDAR II) research
network on June 16th 2002. The VHF derived three-dimensional composite lightning structure
was placed in the context of the DFW Weather Surveillance Radar 1988 Doppler (WSR-88D) (or
KFWS) composite reflectivity structure, providing a fresh perspective on lightning location
within LLTS MCSs. To our knowledge, these are the first such documented observations of
VHF-based total lightning pathways within a LLTS MCS.
2. Background
A review of the literature regarding lightning in MCSs (e.g., MacGorman and Rust, 1998)
reveals at least three remaining fundamental questions: 1) where is lightning typically located
and how is it distributed in three dimensions, 2) where do in-cloud (IC) and cloud-to-ground
(CG) lightning flashes originate and how do they propagate, and 3) what is the source of charge
for both IC and CG lightning flashes, especially those of positive polarity, in the stratiform
region? The second question is the subject of ongoing research and a future paper using this data
set while the third question is beyond the scope of the available data. In the present study, we
directly address the first question.
To investigate this first issue and place the results in the proper context, it is helpful to have a
basic understanding of the kinematic and microphysical conceptual model (Figure 1) of a mature
LLTS MCS [e.g., Houze et al., 1989]. The model consists of a leading line of deep convective
cells (labeled CONV in Figure 1) that are characterized by enhanced radar reflectivity, intense
upper level divergence, and strong (≈ 10 m s-1) updrafts. New cells develop at the leading edge
2
of the MCS while more mature and then decaying convective cells are found rearward. Behind
the decaying convective cells, there is often a gap or transition zone (labeled TZ in Figure 1) of
lesser radar reflectivity at low altitudes.
Rearward of the transition zone, there is enhanced reflectivity over a broad (i.e., mesoscale)
area in the trailing stratiform region. Compared to the convective line, precipitation and hence
radar reflectivity is generally weaker and more horizontally and vertically homogeneous within
the stratiform region. Significant kinematic features in the trailing stratiform region include the
ascending front-to-rear (labeled FTR in Figure 1) flow at upper levels and descending rear-to-
front (labeled RTF in Figure 1) flow at lower levels. In the stratiform region, ascending and
descending motion are gentle compared to the convective region (≈± 0.1 m s-1).
The widespread stratiform precipitation is caused by the storm-relative rearward advection
(FTR horizontal flow ≈ 10-20 m s-1) of ice particles (asterisks in Figure 1) that are detrained
from the convective updraft at mid-to-upper levels and that subsequently grow by deposition in
the weak mesoscale updrafts. Ice particles can also grow via aggregation. A relative maximum
in aggregation efficiency occurs between about -10° C and -15°C, with a peak around -12°C
[Hobbs et al., 1974]. Since aggregates of ice crystals (i.e., snow) have typical fall speeds (≈ 1-2
m s-1) that are approximately an order of magnitude larger than the gentle upward motion in the
FTR flow, their trajectories descend through the weak mesoscale updraft (Figure 1) toward the
melting level. As the snow approaches warmer air just above the melting level, it may continue
to grow in diameter (D) via aggregation since particle “stickiness” increases rapidly again
between -5° C and 0° C [Hobbs et al., 1974]. As a result, radar reflectivity (Z, where Z ~ D6)
begins to increase more rapidly with decreasing height just above the melting level. Finally, the
aggregates fall through the 0°C level, below which they melt into rain. As the aggregates begin
3

to melt, reflectivity increases even faster because the reflectivity of water-coated ice particles is
roughly five times larger than that of ice particles of equivalent size and shape. As aggregates
fall further, they melt enough to collapse into a smaller diameter and their fall speeds increase.
This decrease in hydrometeor size and concentration causes the reflectivity to decrease rapidly
again toward the surface. The radar reflectivity maximum that results at temperatures just
warmer than 0° C is called the bright band (labeled BB in Figure 1). A more complete review of
MCS kinematics and microphysics is beyond the scope of this paper and can be found in Houze
[1993] by the interested reader.
Significant progress in the observation and modeling of the electrical structure and CG
lightning properties of LLTS MCSs has occurred in the last twenty years [e.g., see MacGorman
and Rust, 1998 for a review]. A detailed and complete review of this voluminous work is well
beyond the scope of this paper and is not necessary to address the primary question at hand.
However, when appropriate, we will place our results regarding total lightning location within
the context of some of this prior research, including important results regarding CG lightning
properties, electric fields, and numerical models of LLTS MCSs.
It is important to note that the conceptual model of a LLTS MCS represented in Figure 1 is
two-dimensional (i.e., distance perpendicular to the convective line, or line-normal distance,
versus height). In this simplified conceptual model, it is assumed that the microphysics,
kinematics and radar structure of a LLTS MCS are also essentially two-dimensional and that
first-order structure and evolution of the LLTS MCS can be described and modeled entirely in
this two-dimensional domain. Variations along or parallel to the convective line are considered
to be less significant in describing MCS structure and evolution. Two-dimensionality is a key
simplifying assumption that has also been used effectively to describe a conceptual model of the
4

electrical structure of LLTS MCSs from multiple in-situ balloon soundings of the electric field
[e.g., Schuur et al., 1991; Stolzenburg et al., 1994; Stolzenburg et al., 1998; Stolzenburg et al.,
2001] and to numerically model the integrated kinematic, microphysical and electrical structure
of the stratiform region of a LLTS MCS [Schuur and Rutledge, 2000a]. As discussed below, the
assumption of line normal, two-dimensionality has also been an effective (although not
exclusive) framework in which to describe the first-order lightning structure of the LLTS MCS
studied herein.
3. Data and Methodology
We employed KFWS WSR-88D reflectivity; CG flash location, time, and polarity from the
National Lightning Detection Network (NLDN: owned and operated by Vaisala) [Cummins et
al., 1998]; and the time and three-dimensional location of VHF radiation sources associated with
total (i.e., both IC and CG) lightning as measured by Vaisala’s DFW LDAR II network for a
LLTS MCS that passed directly over the network from about 0609 to 0639 UTC on June 16th
2002. Since positive CG lightning flashes characterized by peak currents less than 10 kA were
likely associated with misidentified in-cloud lightning, they were removed from our data sample
[Cummins et al. 1998; Wacker and Orville 1999a,b].
3.1 Dallas-Fort Worth Radar Data
This study used KFWS level-II WSR-88D archive data (digital base data in polar format)
[Crum et al., 1993] on June 16th 2002 for a thirty minute period from 0609 to 0639 UTC, while a
large portion of a LLTS MCS was within 100 km of the DFW LDAR II network (Figure 2).
During this period, a portion of the convective line, transition zone, and stratiform region passed
5
over the interior of the seven sensor LDAR II network. The KFWS radar was located
approximately 44 km to the southwest of the center of the LDAR II network (Figure 2). The
WSR-88D was operating in “severe weather” mode during the analysis period. In this scanning
mode, the radar makes 16 unique 360˚ azimuthal sweeps (comprising one volume scan) at 14
unique 360˚ azimuthal sweep angles varying in elevation from 0.5-19.5˚ in 5 min. Volume start
times included 0609, 0614, 0619, 0624, 0629, and 0634 UTC. For the WSR-88D, severe
weather mode scanning strategy provides the most complete vertical and temporal coverage of a
storm because each volume scan is faster and has more sweeps than during any other scanning
strategy.
The REORDER software program [Oye and Case, 1995] was employed to convert the level-
II WSR-88D data from polar (radar) coordinates to a Cartesian coordinate system (X, Y, Z), in
which the radar was located at the origin and the (X, Y) axes were aligned in the cardinal
directions (west-to-east, south-to-north). The Cartesian grid was given a horizontal and vertical
spacing of 1.0 km and 0.5 km, respectively. The x-, y-, and z- radii of influence were set to 1.0
km, and a three-dimensional Cressman weighting scheme [Cressman, 1959] was used to derive
Cartesian grid points from polar radar data. Our analysis domain was a 200 km × 200 km box
centered on the KFWS radar.
To analyze the LLTS MCS in the line-normal (X′) versus line-parallel (Y′) framework
discussed above, the KFWS radar data were also interpolated onto another grid that was rotated
and shifted relative to the original (X, Y) coordinate system (Figure 2). To determine the grid
transformation for each radar volume, the Y′-axis was first aligned approximately parallel to the
back of the MCS convective line such that the low-level, line-parallel mean 40 dBZ echo surface
was located at X′=0 (Figure 2, Figure 3). The X′-axis was then defined as the line perpendicular
6
to the Y′-axis, which passed through the location of the KFWS radar (X=0, Y=0). Practically
speaking, this grid transformation was implemented by first rotating the radar data in REORDER
by specifying that the X′-axis be aligned along an azimuth angle of 130° from the KFWS radar
and then linearly shifting the now rotated-Y-axis in the positive X′ direction by 13 to 44 km,
depending on the location of the back of the convective line during each radar volume time. To
become the Y′ axis, the rotated-Y-axis was shifted by 25 km in the positive X′ direction at 0619
UTC (Figure 2).
3.2. Dallas-Fort Worth Lightning Detection and Ranging II Network and Data
The DFW LDAR II network is an array of seven VHF antennas and receivers tuned to an
unused television channel. The system is the result of an official technology transfer of the
original Lightning Detection and Ranging (LDAR) system developed at the NASA Kennedy
Space Center [Lennon and Maier, 1991; Mazur et al., 1997], which was based on Proctor [1971].
The system is also the product of collaboration between Vaisala and the New Mexico Institute of
Mining and Technology, and in terms of functionality, the system is more similar to the
Lightning Mapping Array (LMA) described by Rison et al. [1999]. VHF time-of-arrival (TOA)
systems respond to short, impulsive bursts of VHF radiation having a typical duration of a few
microseconds [Mazur et al. 1997]. Because of their short duration and the fact that VHF signals
propagate along a line-of-sight path, if their times of arrival are measured accurately enough at a
sufficient number of stations, these short bursts can be modeled as point sources in three
dimensions. In the LDAR II network, the times of arrival are measured by demodulating the
VHF signals into a 5-MHz base band and then marking the times of peaks in the demodulated
signal via a GPS receiver. Every 100 microseconds, each sensor may provide the time and
7

amplitude of the largest peak that occurred during the 100-microsecond interval if that peak was
above a digital threshold.
Rison et al. [1999] discussed the validity of using the point source model for nearly all
pulses, and this has been verified through direct measurements of the location accuracy of the
LDAR and LMA by Maier et al. [1995] and Thomas et al. [2002], respectively. Rison et al.
[1999] first estimated the three-dimensional accuracy of the LMA to be about 0.1 km over the
network (diameter ~30 km). They inferred this from the chi-square distribution for the
localizations, which showed that their localizations were consistent with an RMS time error of
about 50 ns. In both experiments in which location accuracy was measured directly, airborne
VHF transmitters were collocated with GPS receivers and the sensor arrays were used to locate
the transmitters. For the LMA, Thomas et al. [2002] found results consistent with the estimates
of Rison et al. [1999], and Maier et al. [1995] measured a three-dimensional accuracy of about
0.1 km within the LDAR network. An analysis of random time errors in the DFW network
indicates a value of about 75 ns RMS. This random error suggests a median three-dimensional
accuracy of 0.25 km or better within the perimeter of the network for sources emanating from an
altitude of 3 km or above. A median accuracy of about 2 km is expected at distances of 100-150
km from the DFW International Airport (approximately the center of the network), depending on
source altitude.
The detection efficiency of the system can be estimated from the sensor characteristics and
the distribution of radiated signals, in this case, the distribution of source power. Because the
LDAR II is presently a research network, the sensors’ noise levels are monitored regularly, and
their gains and thresholds are adjusted as needed. On 16 June 2002, all seven sensors were
operational, although two were operated at somewhat lower sensitivity than normal. Source
8

power estimates from the LMA have been presented by Thomas et al. [2001]. The source power
distribution and sensor characteristics are used to produce a detection efficiency estimate for the
individual VHF sources. To produce flash detection efficiency, we assume that each flash
produces 50 sources, a rather conservative number given the results of Boccippio et al. [2001].
We further assume that at least two sources must be detected before we acknowledge the flash.
Using this method and the sensor characteristics on 16 June 2002, we estimate a flash detection
efficiency of over 90% out to a distance of 100 km from the DFW airport.
In this study, we used the three-dimensional LDAR II source data for a thirty minute period
from 0609 UTC to 0639 UTC on June 16th 2002. Using the three-dimensional location
(longitude, latitude, Z) and time (T) of each LDAR II VHF radiation source, we first determined
the KFWS-relative VHF source location in (X, Y, Z) and then calculated the VHF lightning
source density (km-3 min-1) at each grid point in the transformed, line-parallel versus line-normal
radar coordinate system (X′, Y′, Z) described above for each five minute period centered on the
start of each radar volume time.
Since the features of interest are close (< 100 km) to the center of the LDAR II network and
because there is some uncertainty in the estimation of LDAR II detection efficiency, the source
densities were not range normalized for the variability of the VHF source detection efficiency
with range. The calculated VHF source densities are therefore an underestimate of the true
values. We urge caution in comparing these magnitudes to similar cases of MCSs that were
observed under different conditions (e.g., different VHF lightning network, different network
configuration, different ranges etc.). Evidence of likely range effects in the calculated source
densities and their impact on our conclusions will be discussed below (Section 4). As shown
below, it is the line-normal spatial patterns of VHF source density that are important in this study
9

and not the actual magnitudes. Furthermore, we show below that this pattern can be interpreted
with confidence in our analysis domain.
3.3 Composite Radar and Lightning Images
Conceptual models of the microphysics and kinematics [e.g., Figure 1; Houze et al., 1989]
and also the electrical structure [e.g., Stolzenburg et al., 1994; 1998] for the archetypical LLTS
MCS have often been developed using line-normal composites of many observations from a
single or multiple like LLTS MCSs. This approach is pragmatic because it allows the
development of a model with limited observations. As discussed earlier, the line-normal
framework is the natural coordinate system in which to develop an idealized model for LLTS
MCSs. For these reasons, we chose to create a line normal composite of radar reflectivity and
VHF lightning source density from thirty minutes of data on June 16th 2002 (0609 – 0639 UTC),
while a portion of the LLTS MCS passed directly over the DFW LDAR II network.
Two different composites of radar and lightning data were actually created: 1) X′-Y′ or a
horizontal composite in the line-parallel versus line-normal directions, and 2) X′-Z′ or a vertical
composite in the line-normal direction. The X′-Y′ composite allowed us to explore both the
validity of the line-normal two-dimensionality assumption for our LLTS MCS and also potential
range effects associated with range variability in the VHF source detection efficiency.
To create the X′-Y′ radar composite, we averaged the radar reflectivity at each X′-Y′ grid
box at the height of 2 km AGL for all six radar volumes. To create the X′-Y′ VHF lightning
source density (km-3 hr-1) composite, we summed all VHF sources at each X′-Y′ grid box
through the entire vertical depth of the MCS (i.e., 0 to 18 km AGL) for the entire thirty minute
period and then divided by the total volume of the grid column (18 km3) and the integration time
10
(0.5 hr).
To create the X′-Z or line-normal radar composite, we averaged the radar reflectivity at each
X′-Z grid location for all values of Y′ (i.e., in the line-parallel direction) for all six radar
volumes. To create the X′-Z or line-normal VHF lightning source density (km-3 hr-1) composite,
we summed all VHF sources at each X′-Z grid box through the entire line parallel length of the
MCS in our analysis domain (200 km) for the entire thirty minute period and then divided by the
total volume of the grid column (200 km3) and the integration time (0.5 hr).
4. Results
4.1 Cloud-to-ground Lightning and Low-level Horizontal Radar Structure
The relationship between NLDN detected CG flash location, polarity, and horizontal storm
structure is depicted in Figure 2 for the LLTS MCS on June 16th 2002 at 0619 UTC, which was
the center time for our analysis period. This case exhibited a typical low level radar reflectivity
structure. System motion was roughly perpendicular to the orientation of the convective line, or
toward the southeast (130°) at 21 m s-1, as expected for a LLTS MCS. Convective cells within
the leading line were characterized by moderate to high values of reflectivity (40 – 55 dBZ) and
were distributed uniformly along the line within the analysis domain. Consistent with the life
cycle of a convective cell, which begins near the front of the convective line, the highest
reflectivity tended to be associated with the developing-to-mature cells in the forward-to-center
portions of the line. Rearward of the convective line was a clear transition zone, which was
characterized by a reflectivity minimum (25 – 30 dBZ) at 2 km. Reflectivity and hence
precipitation rates increased again (30 – 40 dBZ) in the trailing stratiform region of the MCS.
Some isolated maxima in radar reflectivity (40 – 45 dBZ) occurred in and around the LDAR II
11

network within the stratiform region. There were some asymmetries in the convective line
structure toward the extreme northeast and southwest of Figure 2. The stratiform region was not
as well developed rearward of the southwest portion of the convective line.
As in past studies [e.g., Orville et al, 1988; Rutledge and MacGorman, 1988; Rutledge et al.,
1990; Stolzenburg, 1990; Holle et al., 1994; among others], the leading convective line for the
MCS contained roughly an order of magnitude more CG flashes than the stratiform region (i.e.,
12 times more overall) while in the vicinity of the KFWS radar (0500-0700 UTC). Ground flash
locations in the convective line tended to cluster in and around convective cells with enhanced (>
45 dBZ) radar reflectivity (e.g., Toracinta et al., 1996). Consistent with earlier studies [e.g.,
Orville et al., 1988; Rutledge and MacGorman 1988; Engholm et al., 1990; Stolzenburg, 1990;
Rutledge et al., 1990; among others], the MCS in our study generated a larger percentage of
positive polarity CG flashes in the stratiform region (26.5 %) than in the convective line (2.0 %)
during this period. Similar to MCSs studied in Rutledge and MacGorman [1988] and Rutledge
and Petersen [1994], many of the positive flashes in the stratiform region clustered near local
reflectivity maxima (Figure 2). As in Petersen and Rutledge (1992), the mean positive peak
currents were significantly larger in the stratiform region (31.5 kA) than the convective line (22.8
kA) during this time. These peak currents are consistent with the large database of MCS peak
current values compiled in MacGorman and Morgenstern [1998]. In all respects, the horizontal
radar structure and CG lightning properties of the June 16th 2002 MCS were fairly typical for
LLTS MCSs in the central United States and elsewhere.
12

4.2 Line-Normal Vertical Radar and Total Lightning Structure
The vertical radar and total lightning structure of the MCS at 0619 UTC are presented in a
series of four vertical cross-sections in Figures 3a-d. The vertical cross-sections were taken
normal (X′) to the convective line at four positions along the line (Y′ = 61, 51, 41, and 31 km)
that passed through the interior of the LDAR II network, which was centered at about X′ = -25
km or toward the forward portion of the stratiform region (Figures 2 and 3).
Although there was some variability, the four cross-sections (Figures 3a-d) revealed a fairly
consistent line-normal vertical structure of radar reflectivity, which compared favorably with the
conceptual model in Figure 1. The convective line was located from about X′ = -15 km to X′ =
20 km. The 10 dBZ echo top reached up to about 12 km AGL. Newer, taller, more intense
convection was located toward the front of the line. The 30 dBZ echo reached up to 8-9 km
AGL there. More mature, shorter, and less intense convective echoes were located toward the
rear of the line, such that the reflectivity contours slumped downward and rearward with each
successively older cell. The transition zone was evident as a reflectivity minimum from near the
surface to mid-levels in the MCS and was centered at about X′ = -15 km to -20 km. The radar
bright band, which clearly identified the stratiform precipitation region from about X′ = -25 km
to X′ = -100 km, was located at heights just below the melting level as expected. Due to the
relatively coarse resolution of the KFWS WSR-88D (1° × 1 km), the reflectivity maximum
associated with the bright band was smeared in the vertical such that it was about 2 to 2.5 km
thick. Several reflectivity maxima in excess of 45 dBZ were located within the broad, bright
band region from about 2.5 to 4 km AGL. Above the radar bright band, precipitation structure
was fairly homogeneous as expected in the stratiform region. However, there was a tendency for
larger values of reflectivity to exist at a given height in the forward portions of the stratiform
13
region. In other words, the reflectivity contours did slant downward gently with increasing
distance rearward of the convective line. A prominent forward anvil was evident up to 50 km or
more in advance of the convective line at heights from 4 to 12 km. According to the radar, little
or no precipitation reached the ground beneath the forward anvil.
The line-normal structure of the VHF lightning source density, which was computed over a
five minute period and across a 10 km wide portion of the MCS in the line parallel direction, was
remarkably similar in each of the four vertical cross-sections (Figures 3a-d). In the convective
region, the peak source density occurred in a bi-modal pattern. A broad, upper-level maximum
in the VHF lightning source density was located between about 8 and 11 km AGL in the
convective line. Another broad maximum in the source density was found at lower-levels in the
convection from about 3 to 6 km AGL. A relative lack of VHF lightning sources existed at mid-
levels (6 to 8 km) in the convective line. Narrow fingers of enhanced VHF lightning source
density bridged this mid-level gap between the bi-modal source density maxima at lower- and
upper-levels.
In the convective region, the lower-level maximum in VHF lightning source density tended
to follow the radar reflectivity contours, sloping slightly downward from the mature portions of
the convective line to the dissipating, rear portion of the convective line. Some VHF lightning
sources were located within the transition zone at low levels. In at least one cross-section
(Figure 3d), the low-level source density maximum in the mature-to-dissipating convection
appeared to continue its downward and rearward slant through the transition zone and into the
front edge of the stratiform region. Interestingly, relatively few VHF lightning sources were
located within the newest, developing-to-mature convective cells at low-to-mid levels, when
compared to the mature-to-dissipating cells. This result appears to confirm the findings of
14

Mazur and Rust (1983), who observed an overall maximum in total flash density at the rear of
the convective line in a squall line system.
The upper-level VHF source density maximum in the convective region was relatively steady
in altitude from about X′ = 0 km to X′ = 25 km. Rearward (X′ < 0) of the mature convective line
at upper levels (Z = 9 km AGL), the lightning source density maximum sloped downward by 4-5
km and rearward by 40-50 km along with the radar reflectivity contours, following the tops of
the dissipating convective cells, across the transition zone, into the front part of the stratiform
precipitation region, and terminating at the top of the bright band (just warmer than
environmental 0°C at Z = 4.5 km AGL). It is important to note that the VHF source density
continues to extend downward at about the same slope rearward of the transition zone even
though the radar reflectivity either levels out or actually slopes strongly upward over the
beginning portions of the stratiform region (Figs. 3a-d).
The distinctive slantwise pattern in the VHF source density was remarkably similar in each
of the four vertical cross-sections (Figures 3a-d). In each cross-section, the sloping VHF
lightning source density maximum ended at or very close to an enhanced (> 45 dBZ) reflectivity
maximum in the bright band. Interestingly, a positive ground flash occurred (see Figure 2; X =
3.4 km and Y = 40.2 km) during this period beneath one of these reflectivity enhancements in the
stratiform region at about X′ = -45 km in Figure 3d (at Y′ = 31 km), similar to the results of
Rutledge and MacGorman [1988] and Rutledge and Petersen [1994]. Note that the reflectivity
enhancement and the positive ground flash occurred about where the sloping VHF source density
maximum terminated in the bright band (c.f. Figure 2 and 3d). Further research on individual
NLDN and LDAR II lightning flashes is required to substantiate any further relationship between
15
these features and to establish the origin of the positive CG flash in question. This will be
pursued in a future study.
Overall, relatively fewer VHF sources occurred within the stratiform region compared to the
convective region. VHF source density decreased with increasing distance rearward of the
convective line. There were very few VHF sources at low levels in the stratiform region. These
trends may be partially associated with the decreased source detection efficiency of the LDAR II
network with range, which is potentially significantly poorer at low levels (< 3 km altitude) for
distant sources because of interference between direct and ground-reflected signals in the vicinity
of the LDAR antennas (Terman et al 1955). However, the paucity of VHF sources in the
stratiform region, particularly below 3 km height, is consistent with low CG flash density in the
stratiform region of this and most other MCSs (e.g., Rutledge and MacGorman, 1988) and with
generally weaker electric fields and charge densities below 3 km in stratiform precipitation
(Stolzenburg et al., 1994). Some interesting lightning features were detected toward the rear of
the stratiform region, where the LDAR flash detection efficiency was estimated to be > 90%. In
Figure 3a, a horizontally oriented maximum in the VHF source density was located at upper
levels (7.5 km to 10 km AGL) from X′ = -85 km to -105 km. Another smaller, weaker grouping
of VHF sources aloft occurred at about X′ = -115 km to -120 km. Both isolated maxima toward
the rear of the stratiform region were approximately 2.5 km thick and were centered at about 8.5
to 9 km AGL. Other isolated, individual VHF sources were detected at altitudes below these
features.
There was a relative dearth of VHF lightning sources detected in the forward anvil region
shown in Figures 3a-d. Although this may be partly related to LDAR source detection efficiency
issues at these ranges (50 to 100 km), there was clearly less lightning just forward of the
16

convection than just to the rear of the line. One positive ground flash occurred (see Figure 2; X
= 75.6 km and Y = 4.5 km) about 10 km forward of the convective line (X′ = 32 km) in between
the cross sections depicted in Figures 3a,b (or Y′ = 61 and 51 km, respectively). More LDAR
VHF sources occurred forward of the convective line (X′ > 20) in Figures 3a,b compared to
Figures 3c,d where no positive ground flashes were detected by the NLDN during this period.
Careful inspection of Figure 3a revealed that a finger of VHF sources did emanate from the
convective line toward the ground flash in question. Unique association of the positive ground
flash and the VHF sources forward of the convective line will require further detailed analysis
and comparison of individual NLDN and LDAR II lightning flashes, which is beyond the scope
of this study.
Even when averaged over five minutes and across 10 km in the line-parallel direction, fine
scale structure in the VHF lightning source density was still evident within the general pattern
described above. As expected, this fine scale structure in the source density increased with
decreasing averaging times and distances (not shown), as the pattern of VHF sources from
individual flashes began to dominate the line-normal lightning structure. The origin,
propagation, and structure of individual lightning flashes in the MCS were beyond the scope of
this study and are the subject of future research.
4.3 Composite Horizontal Radar and Total Lightning Structure
The mesoscale radar and VHF lightning source density structure was quasi-steady over the
30 minute period centered on 0619 UTC (i.e., generally the same as in Figures 3a-d). Rather
than show more individual cross-sections, we chose to create thirty minute composites of radar
and VHF lightning source density structure during this period. The thirty minute horizontal
17

composite of low-level (2 km) radar reflectivity and VHF lightning source density through the
depth of the MCS was created in a line-parallel versus line-normal framework (X′-Y′) as
described in Section 3.3 and is shown in Figure 4.
As expected, the VHF lightning sources were overwhelmingly concentrated in the convective
line, with some tendency for source density maxima to occur in the rear portions of the line, as in
Mazur and Rust (1983). More specifically, there was an order of magnitude (10 times) more
VHF lightning radiation sources in the convective region compared to the stratiform region.
VHF source density maxima in the convective line were well correlated with enhancements in
the radar reflectivity, as in Mazur and Rust (1983). At ranges < 80 km from the center of the
LDAR network, the VHF source densities in the convective line were of comparable values (3-
16 km-3 hr-1) and there was little evidence for significant range effects associated with decreasing
detection efficiency with range. At distant range (> 100 km), the source densities in the
convective line dropped dramatically to values between 0.25 and 2 km-3 hr-1. This significant
decrease in source densities along the convective line to the south was likely associated with
rapidly decreasing detection efficiency with range.
In the vicinity of the LDAR II network center (X′ = -28 km, Y′ = 52 km), there was an
obvious rearward extension of the VHF source density maximum from the back of the
convective line in the mature-to-dissipating convection (X′ = 0 km), through the transition zone
(centered at X′ = -15 km), into the stratiform region (starting at X′ = 25 km), and ending near an
enhancement (> 40 dBZ) in the radar reflectivity within the middle of the stratiform region (X′ =
-55 km, Y′ = 35 km). Rearward (-70 km > X′ > -100 km) of this reflectivity maximum was a
separate cluster of VHF lightning sources toward the rear of the stratiform precipitation. The
VHF source densities in the stratiform region south of the network interior (e.g., Y′ < 0 km) were
18
significantly less, even though the range < 100 km. Since the stratiform region was not as well
developed at Y′ < 0 km (i.e., lower values of reflectivity and less rearward extent of stratiform
precipitation), it is possible that this drop off in the VHF lightning source density is associated
with a decrease in the intensity and size of the stratiform region. However, the decrease is also
likely associated with decreased detection efficiency with range, meaning that the best sample of
stratiform region VHF lightning source density occurred near the network center.
4.4 Composite Line-Normal Vertical Radar and Total Lightning Structure
The line-normal composite (X′-Z) of vertical radar and VHF lightning source density
structure during a thirty minute period centered on 0619 UTC is given in Figure 5. The
composite line-normal structure is remarkably similar to the individual vertical cross-sections at
0619 UTC (Figures 3a-d). This similarity across temporal and spatial scales strongly suggests
that, for our mature LLTS MCS, the line-normal vertical structure of radar and lightning was
quasi-steady and reasonably symmetric in the line-parallel direction.
In the line-normal vertical composite of radar reflectivity, the convective line was clearly
evident at -5 < X′ < 30 km. The convective line tilted forward slightly with height and gave way
to the forward anvil at about X′ > 30 km. Rearward of the convective line, the transition zone
was located between about X′ = -5 km and X′ = -20 km. In the transition zone, the reflectivity
contours began to slump noticeably downward toward the rear. As indicated by the bright band
structure in the reflectivity, the stratiform region began at about X′ = -20 km and extended to
about X′ = -125 km in the analysis domain.
Toward the rear portion of the convective line, there were two maxima of the VHF source
density in the vertical, forming a lightning bipole. The height of the low-level maximum was
19

located between about 3 and 6 km AGL and was centered on 4.5 km AGL. The height of the
upper level maximum was centered on 9.5 AGL (8-11 km AGL) and was shifted about 7 km
forward of the low-level maximum in the line-normal direction. The tilt of the vertical lightning
bipole in the line-normal plane was accompanied by a similar forward tilt in the radar reflectivity
contours, and was aligned with the 0-6 km vertical wind shear vector from the 00 UTC Dallas-
Fort Worth sounding, which was ~15 m s-1 from 330˚. Assuming a typical updraft speed of
about 10 m s-1, it would have taken roughly 500 s for an air parcel to travel from the low level
VHF maximum to the upper level one (i.e., 5000 m/10 m s-1). Using the shear vector above, the
updraft parcel would have been displaced horizontally roughly 7.5 km (i.e., 500 s • 15 m s-1)
downwind during this time, in good agreement with the observed tilt. The upper level
convective source density maximum extended forward of the convective line by about 15 km and
downward by several km into the forward anvil region. Notice that the low-to-mid levels (0 to 7
km AGL) of the forward portions of the convective line (i.e., the forward reflectivity gradient
region from X′ = 20 to X′ = 30 km), where the newer and often intense updrafts are typically
located, were nearly devoid of VHF sources. Significantly lower lightning source densities also
existed in the vertical space (6-8 km AGL) between the two lightning source maxima in the
convective line but the two centers were clearly connected by a bridge of enhanced VHF source
densities.
The low-level maximum in the lightning source density sloped downward toward the rear of
the convective line and ended in the transition zone, following the slumping radar reflectivity
contours associated with dissipating convection. The upper level VHF source density maximum
sloped downward by about 4 to 5 km and rearward of the convective line by about 40 to 50 km.
Note that the downward slope of the VHF source density was similar to the downward slope of
20
the reflectivity contours in the transition zone. The VHF source density maintains roughly the
same descending slope over the stratiform region while the reflectivity contours level off. This
downward and rearward sloping lightning pathway from the upper reaches of the convective line
is remarkably similar to the trajectories followed by snow particles that are detrained from the
convective line, are transported rearward by the storm relative FTR flow, descend downward
through the weak mesoscale updraft to the melting level because of their significantly larger fall
speeds, forming the radar bright band, and then fall to the ground as stratiform rainfall (e.g.,
Figure 1; Houze et al., 1989).
A separate, horizontally layered VHF lightning source density maximum was located at
upper levels (7-10 km AGL) further rearward in the stratiform region from about X′ = -65 km to
X′ = -110 km. This separate lightning zone at the back of the stratiform region was also noted in
Figure 4. The VHF source densities in this secondary maximum at the rear of the stratiform
region were significantly less than in the convective region VHF maxima or in the downward
and rearward sloping VHF maxima in the forward portions of the stratiform region.
Nonetheless, this horizontally oriented lightning zone was a fairly persistent feature of the MCS
stratiform region and was observed despite being located about 40 to 85 km from the center of
the LDAR II network.
5. Discussion
As inferred by Proctor [1971] and Mazur et al. [1997], the impulsive bursts detected by VHF
TOA lightning systems are produced during the breakdown process, the initial development of
leader channels through "virgin" air. Lightning discharges are initialized by a bidirectional
leader [Mazur and Ruhnke, 1993] in regions of cloud where the electric field is highest [Coleman
21
et al. 2003]. The negative end of the leader process is most easily detected by the LDAR II
network because it propagates in a stepwise manner and produces large amounts of VHF
radiation during its entire development. By contrast, the positive end of the leader structure is
relatively quiet at VHF and is only detected later when sporadic negative polarity breakdown
processes occur in a retrograde manner along previously formed channels [Shao and Krehbiel,
1996]. Both the positive and negative ends of the discharge propagate toward extrema in the
electric potential profile that correspond approximately to regions of concentrated charge of the
opposite polarity [Coleman et al., 2003]. Thus, the LDAR II network ends up providing a view
of regions of charge that are involved in lightning flashes, with a preference for positive charge
regions because of the higher power and greater number of impulses associated with the negative
polarity breakdown that occurs there [Rison et al., 1999; Thomas et al., 2001].
Although the LDAR inferred lightning pathways indicate the presence of net charge
participating in flashes, recent results have shown that the entire complexity of charge structure
in thunderstorms is not necessarily revealed by the lightning [Coleman et al., 2003]. Therefore,
inferences regarding detailed charge structure based solely on VHF-based lightning mapping,
particularly from temporal and spatial averages of VHF source density as used in this study,
should be made with some caution. Nonetheless, some general inferences regarding charge
regions that participated in lightning and comparisons with conceptual models of inferred charge
structure in LLTS MCSs from balloon soundings (Stolzenburg et al., 1994; 1998) can be made.
If we assume that VHF source density maxima were most likely associated with positive charge
regions, then the LDAR II observations on June 16th 2002 suggest that the gross charge structure
of the convective region of the MCS was characterized by net positive charge centered at 4.5 km
AGL (3°C) and 9.5 km AGL (-35°C). Based on our knowledge of the behavior of VHF radiation
22

emissions in negative charge regions during lightning breakdown, the basic electrostatic
requirements for large electric fields and breakdown, and past results regarding the gross tripole
structure of charge in convection (e.g., Williams, 1989), we could speculate that net negative
charge was centered roughly in the relative minimum of the VHF source density maximum at 7
km (-17°C) in the convective region. This inferred gross charge structure for the MCS
convective region is similar to the conceptual model put forward in Stolzenburg et al. (1998) for
the updraft region of the convective line, minus an upper level negative screening layer, and is
similar to the structure summarized by Williams (1989). However, the non-updraft charge
structure in the MCS convective line is significantly more complex in the conceptual model of
Stolzenburg et al. (1998), containing up to six charge layers of alternating polarity. Both the
VHF lightning observations in our study and the model of Stolzenburg et al. (1998) suggest that
the charge regions slant downward and rearward, following the slumping reflectivity contours
toward the rear of the convective line where dissipating cells are located.
A comparison between the VHF lightning pathways in this study and the conceptual model
of charge structure in the transition zone and stratiform region of MCSs [Stolzenburg et al.,
1994] revealed some expected correlations and raised several questions. Stolzenburg et al.
[1994] conclude that the electrical charge regions inside the stratiform region of observed MCSs
were horizontally extensive and layered. From three to five main charge layers of alternating
polarity have been detected [e.g., Marshall and Rust, 1993], depending on the MCS type [Schuur
and Rutledge, 2000b]. There was some evidence in this study of layered charge regions that
participated in the lightning process (e.g., Figures 3a, 5). The LDAR II observations revealed a
persistent, horizontally layered VHF source density maximum that was located about 65 km to
110 km rearward of the convective line and was centered at about 8.5 km AGL. The altitude of
23

this horizontal lightning layer approximately corresponds to a positive charge layer in the
conceptual model of Stolzenburg et al. [1994]. However, we were surprised to find in our study
that lightning in the stratiform region was not more extensively and horizontally layered as
would be anticipated from Stolzenburg et al. [1994]. As a matter of fact, the dominant lightning
feature observed by the LDAR II network on June 16th 2002 in the transition zone and forward
portions of the stratiform region was a slantwise oriented maximum in the VHF source density
that extended from the upper reaches of the mature portions of the convective line, down through
the transition zone, and terminated in the bright band roughly 50-60 km behind the convective
line.
It is difficult to reconcile these two sets of observations. Why was the dominant lightning
pattern in the transition zone and forward portions of the stratiform region on June 16th 2002
slantwise and not horizontally layered and extensive? Several possible explanations exist. 1)
The LDAR II observations in our study may have missed some lightning flashes at distant ranges
and thus underestimated the amount of layered lightning present toward the rear of the stratiform
region. 2) The charge structure may have been generally horizontally layered and extensive
across the stratiform region of our MCS but lightning was relatively infrequent in these layers
and therefore not the dominant feature in our vertical cross-sections and composites of VHF
sources. 3) The charge structure in the June 16th 2002 MCS from the back of the convective line
to the forward portions of the stratiform region (i.e., roughly 0-60 km rearward of the convective
line) was different than the charge structure inferred from electric field measurements within the
MCSs used to create the composite structure in the conceptual model of Stolzenburg et al. [1994;
1998]. 4) Uncertainties in the conceptual model of charge structure within MCSs still exist,
particularly in the region of question from the transition zone to the forward portions of the
24

stratiform region.
The first explanation was likely not an important factor; our VHF observations were well
within 100 km of the network center and observations at later times as the center of the
stratiform region passed over the center of the network (not shown) were generally similar to
those shown above. The second reason is plausible and points to a fundamental difficulty in
inferring the complete charge structure from VHF lightning mapping data. However, this still
does not explain the dominant downward and rearward slant of the VHF lightning sources from
the top of the convection to the bright band; it only explains the relative lack of horizontal layers
over the bright band. There is also some evidence to support the third suggestion. The
conceptual model of Stolzenburg et al. [1994; 1998] was based entirely on observations of “Type
B” stratiform region soundings [Marshall and Rust, 1993] that have been clearly associated with
asymmetric [e.g., Houze et al., 1989] MCS structure by Schuur and Rutledge [2000b]. The June
16th 2002 more closely resembled the archetypical structure of a symmetric [Houze et al., 1989]
LLTS MCS, which has been associated with “Type A” stratiform region soundings [Marshall
and Rust, 1993] by Schuur and Rutledge [2000b]. More recently, Stolzenburg et al. [2001]
presented serial electric field soundings of a single MCS that supported the integrated conceptual
model of charge structure in MCSs given by Stolzenburg et al. [1998], particularly from the
convective line to the transition zone. However, Stolzenburg et al. [2001] were still unable to
confirm some of the assumptions made by Stolzenburg et al. [1998] in connecting the charge
regions of the transition zone to those of the stratiform region. Hence, there is still some
uncertainty in the conceptual model of charge structure in the region where the slanted lightning
feature was observed in our study.
It is possible that more balloon observations, analysis and compositing of the electric fields
25

and inferred charge structure within symmetric MCSs (i.e., “Type A” soundings according to
Marshall and Rust, 1993; Schuur and Rutledge, 2000b) may one day reveal a slantwise structure
of the charge regions from the convective line to the forward portions of the stratiform region
(e.g., up to 60 km rearward of the line). The numerical modeling study by Schuur and Rutledge
[2000a] of the integrated kinematic, microphysical and electrical structure of a symmetric LLTS
MCS gives us some confidence in this speculation. Similar to the MCS conceptual model of
Houze et al. (1989), the trajectory of the snow ice category in their modeling study was identical
to our sloping lightning path. When they used the Type “A” (i.e., symmetric MCS) electrical
sounding from Marshall and Rust [1993] to initialize their charge advection profile, placed
positive charge on snow, and then allowed in-situ charge generation according to the non-
inductive charging laboratory experiments of Saunders et al. [1991], Schuur and Rutledge
[2000a] obtained a sloping trajectory of significant positive charge density that was noticeably
similar in size, location, shape, and slope to the line normal, slanting lightning pathway from the
inferred upper positive charge region above the convection to the region just above the bright
band.
Furthermore, the observations of Schuur and Rutledge [2000b] showed that water saturated
conditions were prevalent in the stratiform region mesoscale updraft of a symmetric MCS. As a
result, dendritic growth and aggregates of dendrites were common in the symmetric MCS,
allowing mean and maximum particle sizes to approach 0.5-4 mm and 1-14 mm, respectively,
from -20° C to 0°C. Particle trajectories in the asymmetric case in Schuur and Rutledge [2000b]
spent more time in the downward motion and sub-saturated conditions of the transition zone such
that dendritic growth and aggregation was not as common. As a result, ice particle sizes in the
transition zone and stratiform region were much smaller in the asymmetric case. Snow particle
26
fall speeds in a symmetric MCS may be sufficiently large (i.e., 1-2 m s-1; Locatelli and Hobbs
[1974]) such that, when combined with typical front-to-rear flows of 10-20 m s-1 [Houze, 1993],
they tend to follow the ice particle trajectories shown in Figure 1 and hence nearly match the
slanting lightning pathway shown in Figures 3a and 5 (i.e., 5 km downward and 50 km
rearward). If these snow particles play an important role in the transport or production of
significant charge rearward of the convective line in symmetric LLTS MCSs as suggested by
some studies [e.g., Rutledge and MacGorman, 1988; Schuur and Rutledge, 2000a,b], then this
correlation may also be causal in that the snow may be carrying the bulk of the positive charge
revealed by the VHF sources during lightning processes along the slantwise trajectory. Saunders
et al. [1991] determined that non-inductive charge separation strongly depends on particle size.
Furthermore, any precipitation based charging mechanism requires differences in terminal
fallspeeds between the colliding and rebounding particles for charge separation to occur. As
noted by Rutledge and MacGorman [1988] and Schuur and Rutledge [2000a,b], the above two
reasons may help explain the importance of snow in the electrification and lightning of the
transition zone and stratiform region of MCSs.
To explore the relationship between snow and lightning pathways a bit further, we calculated
simplified snow trajectories in the line-normal plane based on the limited information available
for this case (Figure 6). We assumed that snow particles were detrained from the tops of
dissipating convection (X′=0 km) at altitudes ranging from 8 to 11 km AGL. We further
assumed steady flow in both the vertical and line-normal directions. Based on KFWS single-
Doppler measurements (not shown), storm relative front-to-rear flow was varied from -10 to -12
m s-1. We made the simplifying assumption that weak mesoscale vertical motions rearward of
the convective line could be neglected relative to the terminal fall speeds of snow. This should
27
be a reasonable assumption in the mean since typical fall speeds for snow are 1-2 m s-1 and
typical vertical motions are about 0.1-0.2 m s-1 when averaged along a normal trajectory
rearward of the convective line to the forward portion of the stratiform region [e.g., Schuur and
Rutledge, 2000ab]. We assumed that for a symmetric MCS the snow particles were likely
comprised of aggregates of unrimed or lightly rimed dendrites [Schuur and Rutledge, 2000b].
According to Locatelli and Hobbs [1974], aggregates of unrimed to lightly rimed dendrites for
typical sizes reported in Schuur and Rutledge [2000b] would fall at about 1.0 to 1.2 m s-1. The
snow trajectories were terminated upon melting just below the bright band at about 4 km. Using
these various assumptions, there was excellent agreement between the resulting snow particle
trajectories and the slanted pathway of VHF lightning sources (Figure 6). Although grossly
simplified, the snow trajectories calculated herein were similar to the more complex snow
trajectories estimated by Rutledge and MacGorman [1988] with the benefit of dual-Doppler
synthesized vertical motions and those calculated by Schuur and Rutledge [2000a] with a 2-D
numerical model using complex ice microphysics and realistic kinematics.
The role of snow may be two-fold. The snow may carry charge generated while in the
convective region to the stratiform region, as suggested by Rutledge and MacGorman [1988] and
many others (i.e., the advective mechanism). Furthermore, the snow may participate in charging
locally via the non-inductive ice-ice charging mechanism [e.g., Rutledge et al., 1990; Engholm et
al., 1990 among many others] or via other in-situ mechanisms [e.g., Marshall and Rust, 1993;
Stolzenburg et al., 1994; Shepherd et al., 1996; Schuur and Rutledge, 2000a]. Recall that the
VHF source density and radar reflectivity sloped downward and rearward at roughly the same
angle from the back of the convective line through the transition zone. On the other hand, the
radar reflectivity leveled off or actually sloped upward over the stratiform bright band. The
28

similarities and differences in slope may provide important clues as to the relative role of
advective and in-situ charging mechanisms. Through the transition zone where non-inductive
charging was unlikely, snow and accompanying charge generated in the convective line may
have been primarily advected rearward in the front-to-rear flow and pulled downward by gravity.
In the stratiform region, where in-situ charging was more likely according to the studies
referenced above, the oldest, largest and fastest falling snow particles may have dominated ice-
ice collisional charging rates. So, even though generation and growth of new snow particles
likely occurred above the stratiform region bright band, in-situ charging may have been
dominated by the older and larger snow particles. This could explain the simultaneous leveling
off or upward slope of the radar reflectivity contours and continued downward slope of lightning
and inferred charge along the original snow trajectory.
It is important to note that Stolzenburg et al. [1998] assume that cloud ice particles and not
snow carry the bulk of the charge that is detrained from the top of the convection. This
assumption led them to connect the upper two charge layers from the convective region across
the transition zone to the stratiform region, thus maintaining a much more horizontally oriented
trajectory there (i.e., fall speeds would be very small such that the cloud ice particles and hence
charge layers would lose little altitude while moving rearward in the FTR flow). Although
possibly appropriate for an asymmetric MCS, this assumption may not apply as well to a
symmetric MCS like our case study on June 16th 2002. Or, it is possible that charge in our study
was partitioned between both snow and cloud ice, which could have caused the initially sloped
and, further rearward, layered lightning structure, respectively.
Clearly, coincident LDAR II and multiple electric field soundings in one or more symmetric
MCSs will be required to confirm or reject the above suggestions. Future field studies should
29

focus on obtaining integrated microphysical, kinematic, electrical and lightning data within both
symmetric and asymmetric MCSs in order to confirm the findings of this study and to carefully
document the differences in lightning structure between the two MCS types.
6. Summary
Few past studies have investigated the detailed three-dimensional structure of total lightning
within a LLTS MCS. In this study, we analyzed thirty minutes worth (0609-0639 UTC) of
Dallas Fort-Worth WSR-88D and LDAR II VHF lightning data as a portion of the convective
line, transition zone, and stratiform region of an MCS passed directly over the interior of the
LDAR II network on June 16th 2002. Because of the close proximity of the MCS to the KFWS
WSR-88D and DFW LDAR II network during this period, excellent coverage of the radar and
lightning structure was obtained.
The overwhelming majority of VHF lightning sources occurred within the leading convective
line in a bi-modal pattern in the vertical with upper and lower maxima centered at about 9.5 km
and 4.5 km AGL, respectively. A persistent, slantwise lightning zone extended rearward (by 40-
50 km) and downward (by 4-5 km) from the upper VHF source maximum in the convective line,
through the transition zone, into the stratiform region, and finally terminated within the radar
bright band. Another lightning zone occurred 65-110 km rearward of the convective line in a
spatially distinct horizontal layer (3 km deep) centered at a height of about 8.5 km AGL in the
stratiform region.
The slantwise lightning zone was clearly reminiscent of the trajectories that snow particles
take after they are detrained from the convective line and experience both front-to-rear storm
relative flow and net downward motion associated with fall speeds that easily exceed any upward
30

vertical motions. Since VHF lightning radiation sources are thought to reveal the presence of net
charge regions, the presence of this 50-60 km long slantwise lightning pathway rearward of the
convective line appeared to be at odds with currently accepted conceptual models of the
electrical structure of MCSs, which indicate that multiple (3-5) charge regions are layered, in
extensive horizontal slabs of alternating polarity within the transition zone and stratiform region.
Interestingly, the horizontally layered lightning zone that was found 65-110 km rearward of the
convective line in the upper portions of the stratiform region appeared to fit well within existing
conceptual models of the electrical structure of LLTS MCSs. Potential explanations were
offered for these apparent consistencies and discrepancies between the observed lightning
structure and existing conceptual models of MCSs.
This study emphasized composite or average structure on the mesoscale. Past MCS studies
have suggested that sub-mesoscale variations in stratiform region kinematics and microphysics
have an important role in stratiform region electrification and lightning production [e.g.,
Rutledge and Petersen, 1994; MacGorman and Rust, 1998]. As a result, future work on this data
set will investigate sub-mesoscale (i.e., not averaged) behavior of total lightning and radar
reflectivity in the stratiform region. Ongoing research topics include 1) a thorough analysis of
sub-second VHF source data associated with each individual flash rearward of the convective
line for the purpose of determining how individual flashes propagate to create the composite
lightning structure observed in this study, and 2) a detailed comparison of individual sub-second
LDAR II and NLDN detected stratiform-region ground flashes for the purpose of locating their
origins and modes of propagation.
31
Acknowledgements. WSR-88D Level II data was obtained from the National Climatic Data
Center (NCDC). The first author (L. D. Carey) would like to acknowledge fruitful discussions
regarding the kinematics, microphysics, electricity and lightning of mesoscale convective
systems with Drs. Rit Carbone, Timothy Lang, Donald MacGorman, Richard Orville, Walter
Petersen, David Rust, Steven Rutledge, and Terry Schuur. We especially thank Timothy Lang,
Walt Petersen and Terry Schuur for providing important and helpful comments on a draft of this
manuscript. We would like to thank Drs. Roscoe Braham, Gary Lackmann, and Al Riordan for
serving on the thesis committee of one of the authors (T. L. McCormick) at North Carolina State
University and providing helpful feedback and discussion during the early stages of this research.
This paper is an extension of that earlier thesis work. While conducting the research for her
thesis, Tracy McCormick was supported by North Carolina State University and a one-year
graduate fellowship from the AMS/NOAA Office of Global Programs.
References
Boccippio, D.J., S.J. Heckman, and S.J. Goodman, A diagnostic analysis of the Kennedy Space
Center LDAR network. 1. Data characteristics, J. Geophys. Res., 106, 4769-4786, 2001.
Coleman, L.M., T.C. Marshall, M. Stolzenburg, T. Hamlin, P.R. Krehbiel, W. Rison, and R.J.
Thomas, Effects of charge and electrostatic potential on lightning propagation, J. Geophys.
Res., 108(D9), 4298, doi:10.1029/2002JD002718, 2003.
Cressman, G., An operational analysis system, Mon. Wea. Rev., 87, 367-374, 1959.
Crum, T. D., R. L. Alberty, and D. W. Burgess, Recording, archiving, and using WSR-88D data,
Bull. Amer. Meteor. Soc., 74, 645-653, 1993.
32
Cummins, K. L., M. J. Murphy, E. A. Bardo, W. L. Hiscox, R. B. Pyle, and A. E. Pifer, A
combined TOA/MDF technology upgrade of the U.S. National Lightning Detection Network,
J. Geophys. Res., 103, 9035 – 9044, 1998.
Engholm, C. D., E. R. Williams, and R. M. Dole, Meteorological and electrical conditions
associated with positive cloud-to-ground lightning, Mon. Wea. Rev., 118, 470-487, 1990.
Fritsch, J. M., R. J. Kane, and C. R. Chelius, The contribution of mesoscale weather systems to
the warm-season precipitation in the United States, J. Climate Appl. Meteor., 25, 1333-1345,
1986.
Goodman, S. J., and D. R. MacGorman, Cloud-to-ground lightning activity in mesoscale
convective complexes, Mon. Wea. Rev., 114, 2320-2328, 1986.
Hobbs, P. V., S. Chang, and J. D. Locatelli, The dimensions and aggregation of ice crystals in
natural cloud. J. Geophys. Res., 79, 2199-2206.
Holle, R. L., A. I. Watson, R. E. Lopez, and D. R. MacGorman, The life cycle of lightning and
severe weather in a 3-4 June 1985 PRE-STORM mesoscale convective system, Mon. Wea.
Rev., 122, 1798-1808, 1994.
Houze, R. A. Jr., B. F. Smull, and P. Dodge, Mesoscale organization of springtime rainstorms in
Oklahoma, Mon. Wea. Rev., 117, 613-654, 1990.
Houze, R. A. Jr., Cloud dynamics, Academic Press, San Diego, 573 pp., 1993.
Houze, R. A. Jr., S. A. Rutledge, M. I. Biggerstaff, and B. F. Smull, Doppler radar depiction of
midlatitude mesoscale convective systems, Bull. Am. Meteorol. Soc., 70, 608-619, 1989.
Krehbiel, P. R., R. J. Thomas, W. Rison, T. Hamlin, J. Harlin, and M. Davis, GPS-based
mapping system reveals lightning inside storms, Eos Trans., 81, 21-25, 2000.
Lennon, C., and L. Maier, Lightning mapping system, Proceedings of the International
33
Aerospace and Ground Conference on Lightning and Static Electricity, Cocoa Beach, FL,
NASA Conference Publication 3106, Vol. II, 89.1-89.10, 1991.
Locatelli, J. D., and P. V. Hobbs, Fall speeds and masses of solid precipitation particles, J.
Geophys. Res., 79, 2185-2197, 1974.
MacGorman, D. R., and W. D. Rust, The Electrical Nature of Storms, Oxford Univ. Press, New
York, 422 pp., 1998.
MacGorman, D. R., and C. D. Morgenstern, Some characteristics of cloud-to-ground lightning in
mesoscale convective systems, J. Geophys. Res., 103, 14,011-14,023.
Maier, L., C. Lennon, T. Britt, and S. Schaefer, Lightning Detection and Ranging (LDAR)
system performance analysis, 1995 Int’l Conf. on Cloud Physics, Dallas, Texas, Amer.
Meteorol. Soc., 1995.
Marshall, T. C., and W. D. Rust, Two types of vertical electrical structures in stratiform
precipitation regions of mesoscale convective systems, Bull. Amer. Meteorol. Soc., 74, 2159-
2170, 1993.
Mazur, V., W. D. Rust, Lightning propagation and flash density in squall lines as determined
with radar, J. Geophys. Res., 88, 1495-1502, 1983.
Mazur, V., E. Williams, R. Boldi, L. Maier, and D.E. Proctor, Initial comparison of lightning
mapping with operational time-of-arrival and interferometric systems, J. Geophys. Res., 102,
11071-11085, 1997.
Mazur, V., and L.H. Ruhnke, Common physical processes in natural and artificially triggered
lightning, J. Geophys. Res., 98, 12913-12930, 1993.
Orville, R. E., R. W. Henderson, and L. F. Bosart, 1988: Bipole patterns revealed by lightning
locations in mesoscale storm systems, Geophys. Res. Lett., 15, 129-132, 1988.
34
Oye, D., and M. Case, REORDER: A program for gridding radar data. Installation and use
manual for the UNIX version, NCAR Atmospheric Technology Division, Boulder, CO, 1995.
Petersen, W. A., and S. A. Rutledge, Some characteristics of cloud-to-ground lightning in
tropical northern Australia, J. Geophys. Res., 97, 11,553-11,560, 1992.
Proctor, D.E., A hyperbolic system for obtaining VHF radio pictures of lightning, J. Geophys.
Res., 76, 1478-1489, 1971.
Rison, W., R.J. Thomas, P.R. Krehbiel, T. Hamlin, and J. Harlin, A GPS-based three-
dimensional lightning mapping system: Initial observations in central New Mexico, Geophys.
Res. Lett., 26, 3573-3576, 1999.
Rutledge, S. A., and D. R. MacGorman, Cloud-to-ground lightning activity in the 10-11 June
1985 mesoscale convective system observed during the Oklahoma-Kansas PRE-STORM
project, Mon. Wea. Rev., 116, 1393-1408, 1988.
Rutledge, S. A., C. Lu, and D. R. MacGorman, Positive cloud-to-ground lightning flashes in
mesoscale convective systems, J. Atmos. Sci., 47, 2085-2100, 1990.
Rutledge, S. A., and W. A. Petersen, Vertical radar reflectivity structure and cloud-to-ground
lightning in the stratiform region of MCSs: Further evidence for in situ charging in the
stratiform region, Mon. Wea. Rev., 122, 1760-1776, 1994.
Saunders, C. P. R., W. D. Keith, and R. P. Mitzeva, The effect of liquid water on thunderstorm
charging, J. Geophys. Res., 96, 11,007-11,017, 1991.
Schuur, T. J., B. F. Smull, W. D. Rust, and T. C. Marshall, Electrical and kinematic structure of
the stratiform precipitation region trailing an Oklahoma squall line, J. Atmos. Sci., 48, 825-
842, 1991.
Schuur, T. J., and S. A. Rutledge, Electrification of stratiform regions in mesoscale convective
35
systems, Part II: Two-dimensional numerical model simulations of a symmetric MCS, J.
Atmos. Sci., 57, 1983-2006, 2000a.
Schuur, T. J., and S. A. Rutledge, Electrification of stratiform regions in mesoscale convective
systems, Part I: An observational comparison of symmetric and asymmetric MCSs, J. Atmos.
Sci., 57, 1961-1982, 2000b
Shao, X. M. and P. R. Krehbiel, The spatial and temporal development of intracloud lightning, J.
Geophys. Res., 101, 26,641-26,668, 1996.
Stolzenburg, M., T. C. Marshall, W. D. Rust, B. F. Smull, Horizontal distribution of electrical
and meteorological conditions across the stratiform region of a mesoscale convective system,
Mon. Wea. Rev., 122, 1777-1797, 1994.
Stolzenburg, M., W. D. Rust, B. F. Smull, and T. C. Marshall, Electrical structure in
thunderstorm convective regions 1. Mesoscale convective systems, J. Geophys. Res., 103,
14,059-14,078, 1998.
Stolzenburg, M., T. C. Marshall, and W. D. Rust, Serial soundings of electric field through a
mesoscale convective system, J. Geophys. Res., 106, 12,371-12,380, 2001.
Stolzenburg, M., Characteristics of the bipolar pattern of lightning locations observed in 1988
thunderstorms. Bull Amer. Meteor. Soc., 71, 1331-1338, 1990.
Terman, F. E., R.A. Helliwell, J.M. Pettit, D.A. Watkins, W.R. Rambo, Electronic and Radio
Engineering, 4th Ed., McGraw-Hill, New York, 1078 pp., 1955.
Thomas, R., W. Winn, S. Hunyady, W. Rison, P. Krehbiel, T. Hamlin, J. Harlin, Accuracy of the
lightning mapping array, 17th Int’l. Lightning Detection Conf., Tucson, Ariz., Vaisala, Inc.,
2002.
Thomas, R.J., P.R. Krehbiel, W. Rison, T. Hamlin, J. Harlin, and D. Shown, Observations of
36

VHF source powers radiated by lightning, Geophys. Res. Lett., 28, 143-146, 2001.
Toracinta, E. R., K. I. Mohr, E. J. Zipser, and R. E. Orville, A comparison of WSR-88D
reflectivities, SSM/I brightness temperatures, and lightning for mesoscale convective systems
in Texas. Part I: Radar reflectivity and lightning, J. Appl. Meteor., 35, 902-918, 1996.
Wacker, R. S., and R. E. Orville, Changes in measured lightning flash count and return stroke
peak current after the 1994 U.S. National Lightning Detection Network upgrade. 1.
Observations, J. Geophys. Res., 104, 2151–2158, 1999a.
Wacker, R. S., and R. E. Orville, Changes in measured lightning flash count and return stroke
peak current after the 1994 U.S. National Lightning Detection Network upgrade. 2. Theory,
J. Geophys. Res., 104, 2159–2162, 1999b.
Williams, E. R., The tripole structure of thunderstorms, J. Geophys. Res., 90, 6013-25, 1989.
37
Figure Captions
Figure 1. Conceptual model of the kinematic and precipitation structure of a mature leading-
line, trailing-stratiform (LLTS) Mesoscale Convective System (MCS) that is viewed in a vertical
cross-section oriented perpendicular to the convective line (i.e., parallel to its motion). Key
regions of the line-normal structure are highlighted at the top, including the convective (CONV)
region and transition zone (TZ). The thin line depicts the visual or satellite detected cloud
boundary. The bold line depicts the radar observed outline of precipitation. The shaded areas
indicate regions of enhanced precipitation or larger radar reflectivity, including the radar bright
band (BB). The dashed arrows depict important storm-relative flow fields, including the
ascending front-to-rear (FTR) and descending rear-to-front (RTF) flows. The bold, repeating
arrows indicate the approximate trajectories of ice particles, which are represented by asterisks.
The direction of storm motion and height of the 0° C isotherm are indicated. See text for more
details. (After Houze et al., 1989, with permission.)
Figure 2. Low-level (2 km) horizontal cross-section of KFWS radar reflectivity (shaded as
shown, dBZ) that depicts a leading-line, trailing-stratiform MCS on June 16, 2002 at 0619 UTC.
Positive (negative) polarity CG flashes are indicated by plus (box) symbols for a five-minute
period centered on the radar time. The triangles indicate the seven sensor locations in the LDAR
II network. The solid lines depict the original south-north (Y) versus west-east (X) coordinate
system with an origin at the KFWS radar. The dashed lines depict the line-parallel (Y′) versus
line-normal (X′) coordinate system, which was obtained after rotating and shifting the data from
the X-Y system. The origin in the X′-Y′ coordinate system is indicated by a grey circle. The
dash-dot lines indicate the planes of the vertical cross-sections (X′-Z) depicted in Figure 3.
38

Figure 3. Line-normal (X′, km) vertical (Z, km above ground level, AGL) cross-sections of
radar reflectivity (dBZ, contoured every 5 dBZ starting at 10 dBZ) and VHF lightning source
density (km-3 min-1, shaded as shown) through a) Y′ = 61 km, b) Y′ = 51 km, c) Y′ = 41 km, and
d) Y′ = 31 km (see Figure 2) of a leading line, trailing stratiform MCS over the DFW region on
16 June 2002 at 0619 UTC. For each X′-Z grid box in each cross-section depicted, LDAR
source density was calculated in a 10 km long cuboid along the Y′-direction that was centered on
the cross-section for a five minute period centered on the radar volume time. The back of the
convective line (i.e., roughly the mean position of the low-level, 40 dBZ echo) was forced to be
located at X′ = 0 km as shown in Figure 2. The heights of significant temperatures (0°C, -10°C,
-20°C, and -40° C), according to the DFW 00 UTC, June 16th, 2002 sounding, are depicted in a).
Figure 4. A thirty minute horizontal composite of radar reflectivity (dBZ, contours every 5
dBZ) at 2 km altitude and VHF lightning source density (km-3 hr-1, shaded as shown) through the
entire vertical depth of a leading line, trailing stratiform MCS over the DFW region on 16 June
2002 from 0609 to 0639 UTC. The average center of the LDAR II network during this period is
indicated by the ‘Χ’ symbol. For reference, a 100 km range ring from the center of the lightning
detection network is provided (dashed circle). The coordinate system for the composite is line-
normal distance (X′, km) along the abscissa and line-parallel distance (Y′, km) along the
ordinate. The back of the convective line (i.e., roughly the mean position of the 40 dBZ echo
toward the rear) was forced to be located at X′ = 0 km as shown in Figure 2. See text for details
of the compositing process.
39

Figure 5. A thirty minute, line-normal vertical composite of radar reflectivity (dBZ, contours
every 5 dBZ) and VHF lightning source density (km-3 hr-1, shaded as shown) through a leading
line, trailing stratiform MCS over the DFW region on 16 June 2002 from 0609 to 0639 UTC.
The coordinate system for the composite is line-normal distance (x′, km) along the abscissa and
height above ground level (AGL, km) along the ordinate. The back of the convective line (i.e.,
roughly the mean position of the low-level, 40 dBZ echo) was forced to be located at x′ = 0 km.
To obtain the composite image, the radar reflectivity and VHF source density were averaged
over the thirty minute period along a 200 km long line-parallel portion of the MCS that was
centered on the KFWS radar, as seen in Figure 4. See text for more details of the compositing
process.
Figure 6. Same as Figure 5 with the addition of storm relative trajectories (dotted lines) of
hypothetical snow flakes detrained at the top of dissipating convection at X′ = 0 km. Note how
the estimated snow trajectories roughly match the slanted pathway of VHF lightning sources.
See the text for an explanation of how the hypothetical trajectories were calculated.
40
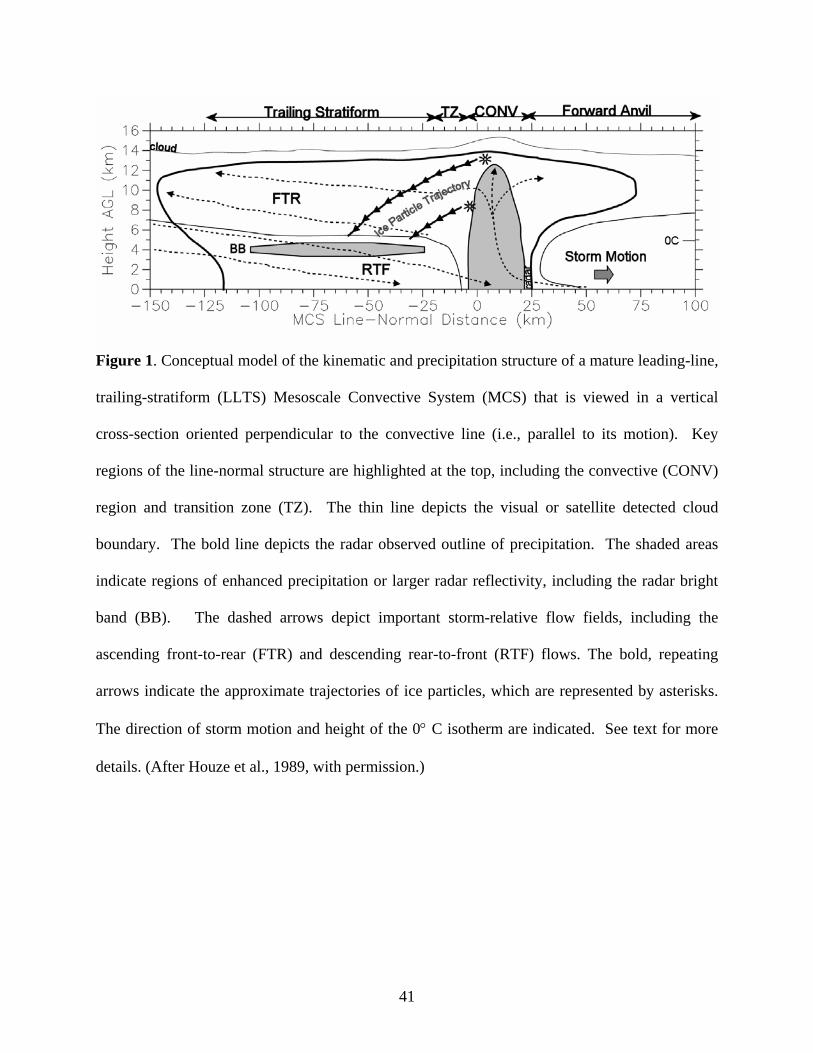
Figure 1. Conceptual model of the kinematic and precipitation structure of a mature leading-line,
trailing-stratiform (LLTS) Mesoscale Convective System (MCS) that is viewed in a vertical
cross-section oriented perpendicular to the convective line (i.e., parallel to its motion). Key
regions of the line-normal structure are highlighted at the top, including the convective (CONV)
region and transition zone (TZ). The thin line depicts the visual or satellite detected cloud
boundary. The bold line depicts the radar observed outline of precipitation. The shaded areas
indicate regions of enhanced precipitation or larger radar reflectivity, including the radar bright
band (BB). The dashed arrows depict important storm-relative flow fields, including the
ascending front-to-rear (FTR) and descending rear-to-front (RTF) flows. The bold, repeating
arrows indicate the approximate trajectories of ice particles, which are represented by asterisks.
The direction of storm motion and height of the 0° C isotherm are indicated. See text for more
details. (After Houze et al., 1989, with permission.)
41

Figure 2. Low-level (2 km) horizontal cross-section of KFWS radar reflectivity (shaded as
shown, dBZ) that depicts a leading-line, trailing-stratiform MCS on June 16, 2002 at 0619 UTC.
Positive (negative) polarity CG flashes are indicated by plus (box) symbols for a five-minute
period centered on the radar time. The triangles indicate the seven sensor locations in the LDAR
II network. The solid lines depict the original south-north (Y) versus west-east (X) coordinate
system with an origin at the KFWS radar. The dashed lines depict the line-parallel (Y′) versus
line-normal (X′) coordinate system, which was obtained after rotating and shifting the data from
the X-Y system. The origin in the X′-Y′ coordinate system is indicated by a grey circle. The
dash-dot lines indicate the planes of the vertical cross-sections (X′-Z) depicted in Figure 3.
42

Figure 3. Line-normal (X′, km) vertical (Z, km above ground level, AGL) cross-sections of
radar reflectivity (dBZ, contoured every 5 dBZ starting at 10 dBZ) and VHF lightning source
density (km-3 min-1, shaded as shown) through a) Y′ = 61 km, b) Y′ = 51 km, c) Y′ = 41 km, and
d) Y′ = 31 km (see Figure 2) of a leading line, trailing stratiform MCS over the DFW region on
16 June 2002 at 0619 UTC. For each X′-Z grid box in each cross-section depicted, LDAR
43

source density was calculated in a 10 km long cuboid along the Y′-direction that was centered on
the cross-section for a five minute period centered on the radar volume time. The back of the
convective line (i.e., roughly the mean position of the low-level, 40 dBZ echo) was forced to be
located at X′ = 0 km as shown in Figure 2. The heights of significant temperatures (0°C, -10°C,
-20°C, and -40° C), according to the DFW 00 UTC, June 16th, 2002 sounding, are depicted in a).
44
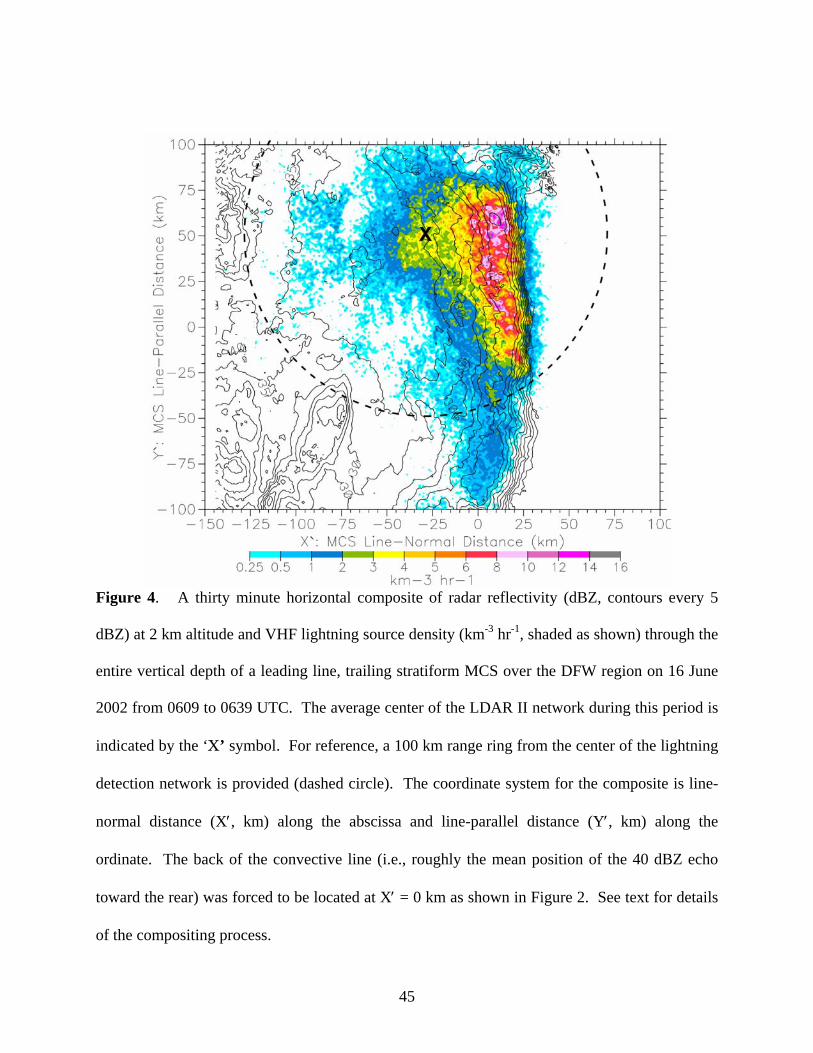
Figure 4. A thirty minute horizontal composite of radar reflectivity (dBZ, contours every 5
dBZ) at 2 km altitude and VHF lightning source density (km-3 hr-1, shaded as shown) through the
entire vertical depth of a leading line, trailing stratiform MCS over the DFW region on 16 June
2002 from 0609 to 0639 UTC. The average center of the LDAR II network during this period is
indicated by the ‘Χ’ symbol. For reference, a 100 km range ring from the center of the lightning
detection network is provided (dashed circle). The coordinate system for the composite is line-
normal distance (X′, km) along the abscissa and line-parallel distance (Y′, km) along the
ordinate. The back of the convective line (i.e., roughly the mean position of the 40 dBZ echo
toward the rear) was forced to be located at X′ = 0 km as shown in Figure 2. See text for details
of the compositing process.
45
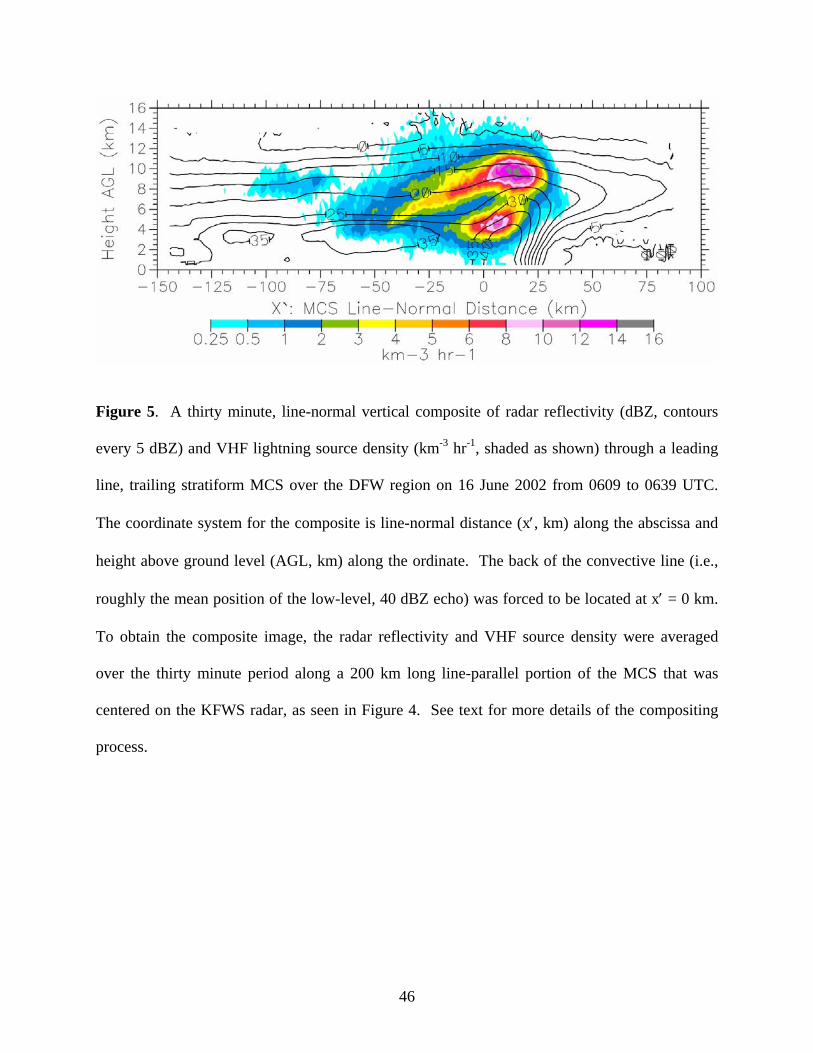
Figure 5. A thirty minute, line-normal vertical composite of radar reflectivity (dBZ, contours
every 5 dBZ) and VHF lightning source density (km-3 hr-1, shaded as shown) through a leading
line, trailing stratiform MCS over the DFW region on 16 June 2002 from 0609 to 0639 UTC.
The coordinate system for the composite is line-normal distance (x′, km) along the abscissa and
height above ground level (AGL, km) along the ordinate. The back of the convective line (i.e.,
roughly the mean position of the low-level, 40 dBZ echo) was forced to be located at x′ = 0 km.
To obtain the composite image, the radar reflectivity and VHF source density were averaged
over the thirty minute period along a 200 km long line-parallel portion of the MCS that was
centered on the KFWS radar, as seen in Figure 4. See text for more details of the compositing
process.
46

Figure 6. Same as Figure 5 with the addition of storm relative trajectories (dotted lines) of
hypothetical snow flakes detrained at the top of dissipating convection at X′ = 0 km. Note how
the estimated snow trajectories roughly match the slanted pathway of VHF lightning sources.
See the text for an explanation of how the hypothetical trajectories were calculated.
47