Lighting the touchpaper: Growing the Market for Social Investment in England
32
Lighting the touchpaper Growing the Market for Social Investment in England Adrian Brown and Will Norman November 2011
-
Upload
the-young-foundation -
Category
Documents
-
view
214 -
download
0
description
With the establishment of Big Society Capital and the development of new products such as social impact bonds the UK is leading the world in this area. A new social investment industry is promising to unlock innovation and growth in the social sector by providing social ventures with access to the funding that they have been unable to obtain from traditional lenders. This report, from the Young Foundation and the Boston Consulting Group, is based on research commissioned by Big Society Capital on the social investment market in England. Lighting the Touchpaper is intended to provide the sector with a common understanding of the situation today, and some signposts for the way ahead.
Transcript of Lighting the touchpaper: Growing the Market for Social Investment in England
Lighting the touchpaper Growing the Market for Social Investment in England
Adrian Brown and Will Norman
November 2011
Lighting the touchpaper 1
THE BOSTON CONSULTING GROUP ▪ THE YOUNG FOUNDATION November 2011
Foreword Since taking on the role of Chief Executive of Big Society Capital earlier this year I've spent a lot of time talking to people about the market for social investment in the UK.
Across the board there is a real sense of excitement about the innovation taking place in the sector and the possibilities for the next few years. From start-up capital for social entrepreneurs to social impact bonds for established ventures, new opportunities are capturing the imagination of investors and practitioners alike.
What's been lacking, until now, is a comprehensive survey of the social investment market that goes beyond case study and anecdote to provide real data on the different players, their finances and their business models. That is why I believe this report is so important. For the first time we can put numbers on many of the hunches, observations and beliefs that have been debated in the sector for some time.
For example, we now have a bottom-up assessment of the size of the social investment market in England. A total of £165m in social investments were made last year and the vast majority of those by just a handful of large players. Secured lending dominates with riskier equity and quasi-equity investments making up a minority of the activity.
This is incredibly useful information, not just for Big Society Capital as we shape our strategy and operating model, but for everyone in the market. The opportunities for growth are clear, such as the financing requirements resulting from payment by results in the public sector. So too are the barriers, such as developing a better understanding of how risk should be measured and priced for social investments.
I'll be making sure that Big Society Capital plays its part, working with the rest of the sector, to address these challenges. What this report provides is a line in the sand from which we can measure our progress over the months and years ahead.
Nick O'Donohoe
Chief Executive, Big Society Capital

Lighting the touchpaper 2
THE BOSTON CONSULTING GROUP ▪ THE YOUNG FOUNDATION November 2011
Contents Executive summary 3 1. Introduction 4 2. The social investment market today 7 3. Growing the market for social investment 17 4. Conclusion 27 Annex A: Survey methodology 28 Annex B: Organisations surveyed 29
Lighting the touchpaper 3
THE BOSTON CONSULTING GROUP ▪ THE YOUNG FOUNDATION November 2011
Executive summary hese are exciting times for the social investment market. With the establishment of Big Society Capital and the development of new products such as social impact bonds the UK is leading the world. This report is based on research commissioned
by Big Society Capital on the social investment market in England. The objective of the research was to provide the first comprehensive survey of the emerging social investment industry. We identify five different actors in the social investment market:
• Social investors who are seeking both social and financial returns; • Social investment and finance intermediaries (SIFIs) who attract money from social investors
and use it to make direct investments in front-line social ventures; • Front-line social ventures such as charities, co-operatives and social enterprises who use the
investment to directly finance their operations; • Commissioners who are willing to pay for socially valuable services; and • Service recipients who are the ultimate beneficiaries of the services provided.
Our survey paints a picture of a social investment market which remains highly immature and dominated by a few large players. Total social investment in 2010/11 was £165m which is tiny when compared with other sources of finance available. The market is currently dominated by four social banks that were collectively responsible for around 70% of social investment activity last year. Because the banks are interested in lower risk, longer-term investments, over four-fifths of investment activity is currently secured lending.
This is a long way from the vision of social investors taking risks to stimulate growth and innovation in social enterprises. In fact, only 5% of the investments made last year were categorised as equity or quasi-equity.
Growth expectations in the market are high. 75% of respondents said they would expand current activities over the next three years. The average growth expected in funds under management over this period was 35% p.a. which is equivalent to an additional £650m capital requirement.
Our survey identified six actions that together can unlock the full growth potential of the sector.
1. Create more 'investible' business models 2. Improve financial skills and experience in the social sector 3. Develop a better understanding of risk and how to price it 4. Improve commissioning capabilities 5. Improve metrics and independent audit 6. Address the distortive effects of grants and 'soft' finance
We are confident the sector will rise to the challenge. Throughout this research we were struck by the energy and optimism in the sector as a whole driven by a passion to create positive social change. It is this passion that will be the real fuel for the growth of the sector in the years ahead.
T
Lighting the touchpaper 4
THE BOSTON CONSULTING GROUP ▪ THE YOUNG FOUNDATION November 2011
1. Introduction The UK has a long history of developing innovative approaches to meeting social needs. From the explosion of philanthropy, charities, co-operatives and socially orientated businesses in the 19th century, through the birth of the welfare state in the 1940s, to the emergence of the social enterprise industry we have today, the UK has been a pioneer in creating new models and organisations to meet social goals.
With the establishment of Big Society Capital and the development of new products such as social impact bonds the UK is leading the world. A new social investment industry is promising to unlock innovation and growth in the social sector by providing social ventures with access to the funding that they have been unable to obtain from traditional lenders.
This report is based on research commissioned by Big Society Capital on the social investment market in England. The objective of the research was to provide the first independent, comprehensive survey of the emerging social investment industry. In particular, until now there has been a lack of quantitative data and analysis on the size of the market, how it operates, the types of investment being made and the returns that may be realised. This report goes some way to addressing these issues.
The report concludes by looking to the future and asking how growth in the social investment market can be encouraged.
This report is intended to provide the sector with a common understanding of the situation today, and some signposts for the way ahead. As this is an emerging marketplace there is still a high degree of fluidity of concepts and the language used to describe them. To avoid confusion we have been careful to define each of the concepts and terms we use and it is our hope that this clarification of terminology will also be helpful to the sector.
1.1 What is social investment?
There remains a good deal of confusion about what social investment is and how it works. We define social investment as the provision and use of finance to generate social and financial returns. It can take a variety of forms, from the provision of loans to direct equity investment.
Social returns are improved outcomes for society such as a reduction in re-offending or an improvement in public health. Because these outcomes are quite specific to the particular investment opportunity they are usually defined on a case-by-case basis.
Financial returns imply that there must be some expectation on the part of the social investor that they will be able to get their money back in the future with a return. This means that the provision of grants, donations or other funds which have no expectation of paying back are not social investments by this definition. Where there is an expectation of a partial loss of funds, for example an agreement in which only 50% of a
Lighting the touchpaper 5
THE BOSTON CONSULTING GROUP ▪ THE YOUNG FOUNDATION November 2011
loan needs to be re-paid, this represents a combination of both grant-giving and social investment.
Ventures looking to attract social investment must therefore develop business models that create both social and financial returns. This requires the involvement of someone (often a government commissioner) who is willing to pay for the social value created. When the price paid for the social value is more than the cost of creating that social value financial value is created as represented by the following equation.
Financial value = Price paid for social value – Cost of creating that social value > 0
This is a necessary condition for the existence of a social investment opportunity and is discussed in more detail in Section 3. The primary objective of social investors is to maximise the social value within this equation. The secondary objective is to maximise financial value.
1.2 The structure of the social investment market
The social investment market includes a number of different actors ranging from the sources of finance, through the creators of social and financial value, to the recipients of services. The main groups considered in this report are:
• Social investors who are seeking both social and financial returns. Government is currently the largest investor in the market but other investors include banks, trusts and individuals. Some social investors choose to invest directly in frontline social ventures but most prefer to make their investments via intermediaries.
• Social investment and finance intermediaries (SIFIs) attract money from social investors and use it to make direct investments in front-line social ventures. This category includes organisations whose primary activity is social investment as well as organisations for whom social investment forms part of a wider portfolio of activity.
• Front-line social ventures are the ultimate recipients of investment and use it to directly finance their operations rather than lending it on to anyone else. Social ventures are the organisations that actually create the social and financial value that drives the social investment market. Social ventures include charities, co-operatives and social enterprises.
• Commissioners who are willing to pay for socially valuable services. These are generally government commissioners but can also include philanthropic foundations or individuals.
• Service recipients who are the ultimate beneficiaries of the services provided and the social value created. Often services are provided free at the point of use but sometimes the service recipients may also make a contribution towards the cost of providing the service.
In addition, there are organisations who provide support and capacity-building services to front-line social ventures including providers of skills and training (School for Social Entrepreneurs); orchestrators of new networks (CAN and ClearlySo); providers of buildings and infrastructure (the Hub); and advocates for the new sector (Social Enterprise UK). In their recent report, Growing Social Ventures (Feb 2011), the Young Foundation identified hundreds of organisations in the UK which are dedicated to helping social ventures grow, improve and scale.

Lighting the touchpaper 6
THE BOSTON CONSULTING GROUP ▪ THE YOUNG FOUNDATION November 2011
1.3 Scope of this report
The primary evidence collected for this research was a survey of social investment and finance intermediaries conducted in July 2011. This survey was supplemented by desk research and qualitative interviews with industry experts. Details of the research methodology are provided in Annex A and a list of the organisations surveyed is provided in Annex B.
Lighting the touchpaper 7
THE BOSTON CONSULTING GROUP ▪ THE YOUNG FOUNDATION November 2011
2. The social investment market today Our survey paints a picture of a social investment market which remains highly immature and dominated by a few large players.
Total social investment in 2010/11 was £165m which is tiny when compared with other sources of finance available to social ventures. The market is currently dominated by four social banks that were collectively responsible for around 70% of social investment activity last year. Because the banks are interested in lower risk, longer-term investments, over four-fifths of investment activity is currently secured lending.
This is a long way from the vision of social investors taking risks to stimulate growth and innovation in front-line social ventures. In fact, only 5% of the investments made last year were categorised as equity or quasi-equity. The smaller players operating at this end of the market are invariably operating at a loss.
2.1 Size of the social investment market
Our survey found that total social investment stands at around £165m. Given the noise and excitement around the social investment market this is a surprisingly small number. For example, when fully capitalised, Big Society Capital alone could have an investment pot worth up to £600m or nearly four times the current total market size. As Big Society Capital is seeking to encourage diversified sources of capital in the market, it will need to work hard to avoid dominating the social investment space.
When compared with other sources of finance available to social ventures, £165m looks very small indeed. For example, voluntary organisations alone had an income of £35.5 billion in 2007/08 on assets of nearly £100 billion1
Many social ventures access mainstream lending such as taking loans from high street banks. This is not considered social investment because the lenders are not primarily seeking to maximise social value.
.
2.2 Sources of finance
We asked social investment and finance intermediaries where they were getting their funds from. Some preferred not to tell us so these figures should be treated as indicative. Nevertheless, two sources accounted for the vast majority of finance. Central government was identified as providing 50-60% of available funds while deposits at the social banks accounted for a further 25-30%. Trusts and foundations were the next biggest source of funds but, at less than 5% of the total, their contribution was far less significant.
Government has such a dominant role due to funds such as Futurebuilders and the Social Enterprise Investment Fund (SEIF). Government-backed funds like these make millions of pounds of investment every year. This dominance makes government the leading
1 The UK Civil Society Almanac 2010, National Council of Voluntary Organisations
Lighting the touchpaper 8
THE BOSTON CONSULTING GROUP ▪ THE YOUNG FOUNDATION November 2011
social investor: able to set expectations; direct the development of the sector; and stimulate or depress demand.
Social banks are particularly important as they act as both a source of finance, through the deposits they attract, and a direct investor in the market as discussed below.
It is somewhat surprising that trusts and foundations are not a more significant source of funds given the significant pools of capital controlled by organisations such as the Esmée Fairbairn Foundation (which has a total endowment fund of nearly £900 million). In part, this is because the funds they disperse are generally in the form of grants rather than investments although several of the major foundations, including Esmée are now experimenting with investment funds. More importantly, the endowment funds themselves are not currently invested in the social investment market due to concerns about poor returns and illiquidity of investments.
2.3 Social investment and finance intermediaries
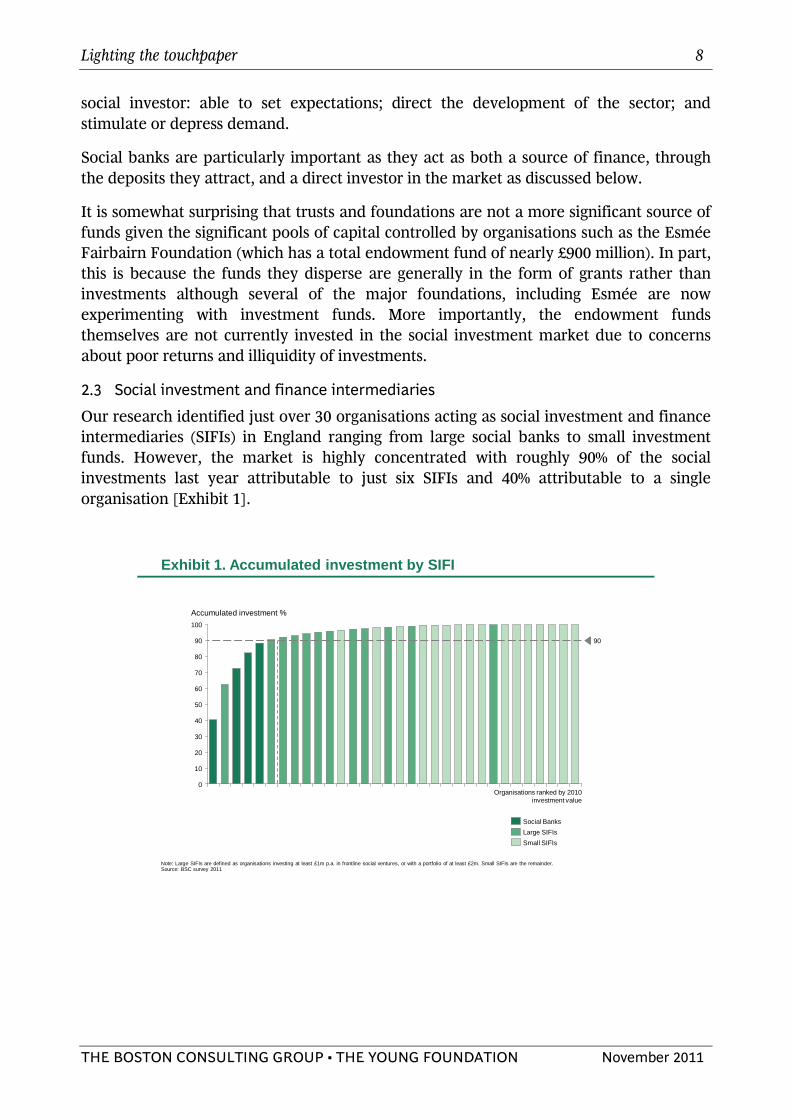
Our research identified just over 30 organisations acting as social investment and finance intermediaries (SIFIs) in England ranging from large social banks to small investment funds. However, the market is highly concentrated with roughly 90% of the social investments last year attributable to just six SIFIs and 40% attributable to a single organisation [Exhibit 1].
BSC Landscape document 3Aug2011.pptx 1
Draft – For discussion only
Exhibit 1. Accumulated investment by SIFI
Note: Large SIFIs are defined as organisations investing at least £1m p.a. in frontline social ventures, or with a portfolio of at least £2m. Small SIFIs are the remainder.Source: BSC survey 2011
Accumulated investment % 100
90
80
70
60
50
40
30
20
10
0Organisations ranked by 2010
investment value
90
Large SIFIsSmall SIFIs
Social Banks
Lighting the touchpaper 9
THE BOSTON CONSULTING GROUP ▪ THE YOUNG FOUNDATION November 2011
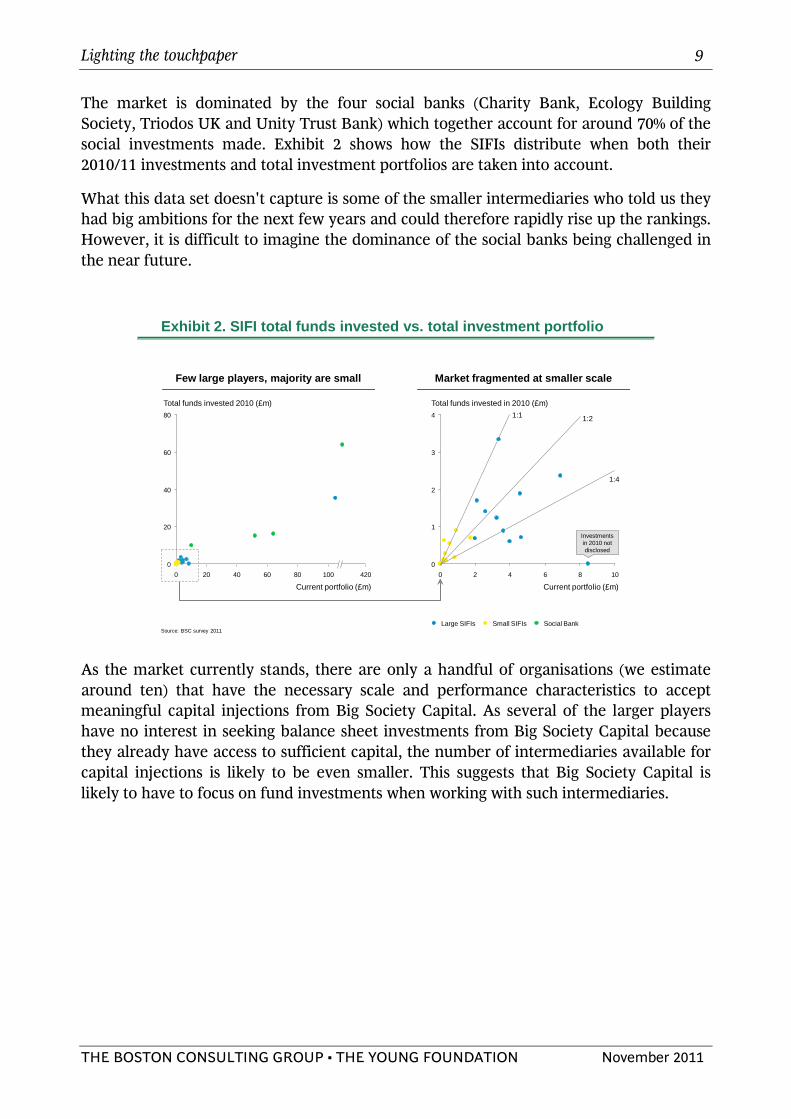
The market is dominated by the four social banks (Charity Bank, Ecology Building Society, Triodos UK and Unity Trust Bank) which together account for around 70% of the social investments made. Exhibit 2 shows how the SIFIs distribute when both their 2010/11 investments and total investment portfolios are taken into account.
What this data set doesn't capture is some of the smaller intermediaries who told us they had big ambitions for the next few years and could therefore rapidly rise up the rankings. However, it is difficult to imagine the dominance of the social banks being challenged in the near future.
BSC Landscape document 3Aug2011.pptx 2
Draft – For discussion only
Exhibit 2. SIFI total funds invested vs. total investment portfolio
Total funds invested 2010 (£m)80
60
40
20
0
Current portfolio (£m)420100806040200
Source: BSC survey 2011
Few large players, majority are small Market fragmented at smaller scale
Total funds invested in 2010 (£m)4
3
2
1
0
Current portfolio (£m)1086420
Social BankSmall SIFIsLarge SIFIs
Investments in 2010 not disclosed
1:1 1:2
1:4
As the market currently stands, there are only a handful of organisations (we estimate around ten) that have the necessary scale and performance characteristics to accept meaningful capital injections from Big Society Capital. As several of the larger players have no interest in seeking balance sheet investments from Big Society Capital because they already have access to sufficient capital, the number of intermediaries available for capital injections is likely to be even smaller. This suggests that Big Society Capital is likely to have to focus on fund investments when working with such intermediaries.
Lighting the touchpaper 10
THE BOSTON CONSULTING GROUP ▪ THE YOUNG FOUNDATION November 2011
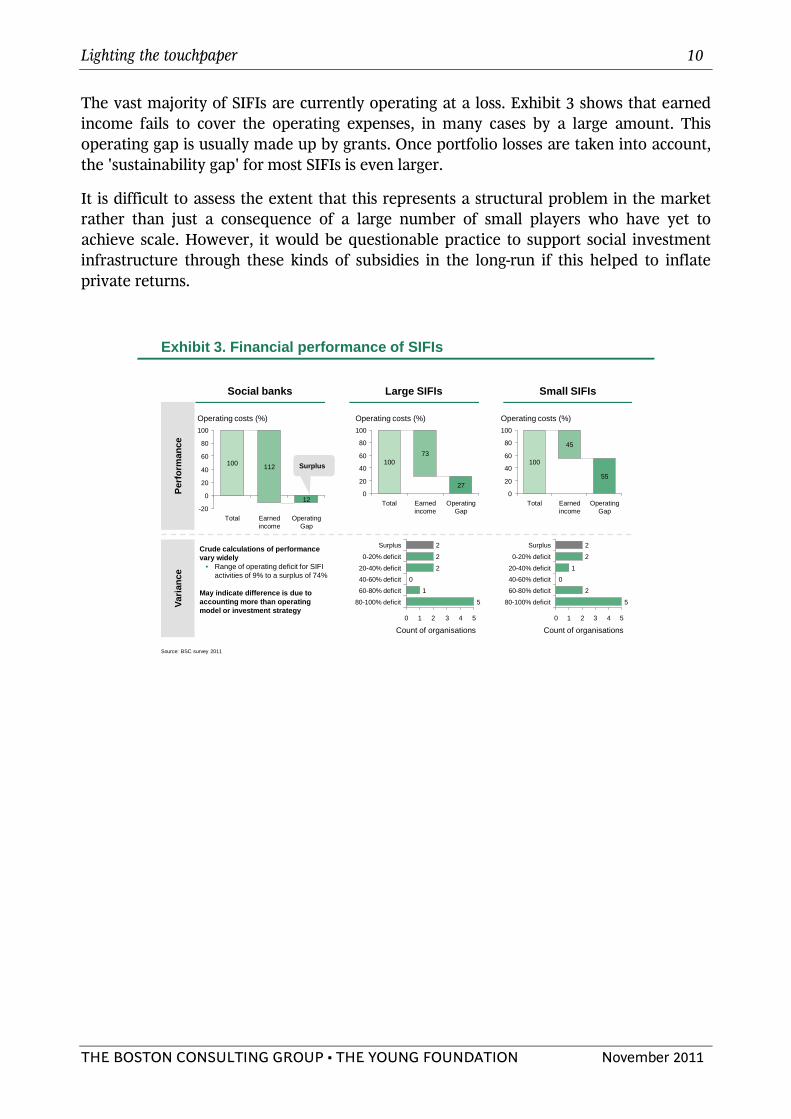
The vast majority of SIFIs are currently operating at a loss. Exhibit 3 shows that earned income fails to cover the operating expenses, in many cases by a large amount. This operating gap is usually made up by grants. Once portfolio losses are taken into account, the 'sustainability gap' for most SIFIs is even larger.
It is difficult to assess the extent that this represents a structural problem in the market rather than just a consequence of a large number of small players who have yet to achieve scale. However, it would be questionable practice to support social investment infrastructure through these kinds of subsidies in the long-run if this helped to inflate private returns.
BSC Landscape document 3Aug2011.pptx 3
Draft – For discussion only
Exhibit 3. Financial performance of SIFIs
Operating costs (%)100
80
60
40
20
0
-20Operating
Gap
12
Earned income
112
Total
100
Source: BSC survey 2011
Social banks Large SIFIs Small SIFIs
Operating costs (%)100
80
60
40
20
0Operating
Gap
27
Earned income
73
Total
100
Operating costs (%)100
80
60
40
20
0Operating
Gap
55
Earned income
45
Total
100
Crude calculations of performance vary widely
• Range of operating deficit for SIFIactivities of 9% to a surplus of 74%
May indicate difference is due to accounting more than operating model or investment strategy
Count of organisations543210
80-100% deficit 5
60-80% deficit 1
40-60% deficit 0
20-40% deficit 2
0-20% deficit 2
Surplus 2
Count of organisations543210
80-100% deficit 5
60-80% deficit 2
40-60% deficit 0
20-40% deficit 1
0-20% deficit 2
Surplus 2
Perf
orm
ance
Varia
nce
Surplus
Lighting the touchpaper 11
THE BOSTON CONSULTING GROUP ▪ THE YOUNG FOUNDATION November 2011
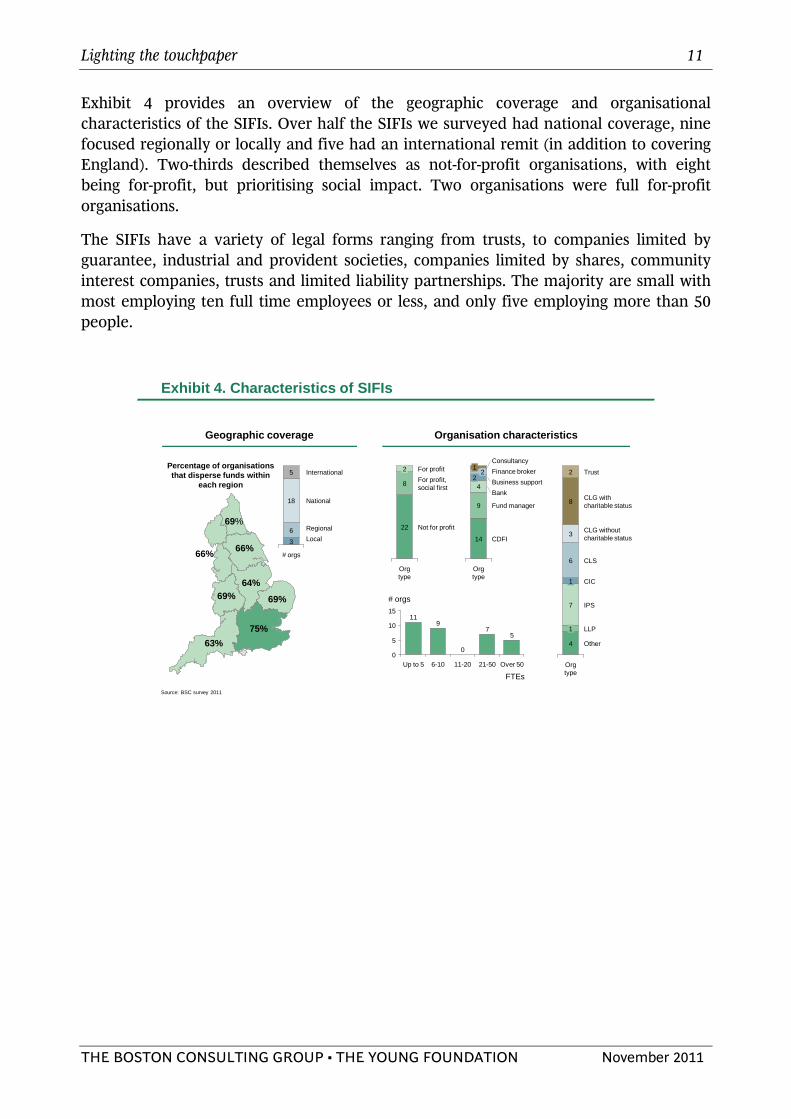
Exhibit 4 provides an overview of the geographic coverage and organisational characteristics of the SIFIs. Over half the SIFIs we surveyed had national coverage, nine focused regionally or locally and five had an international remit (in addition to covering England). Two-thirds described themselves as not-for-profit organisations, with eight being for-profit, but prioritising social impact. Two organisations were full for-profit organisations.
The SIFIs have a variety of legal forms ranging from trusts, to companies limited by guarantee, industrial and provident societies, companies limited by shares, community interest companies, trusts and limited liability partnerships. The majority are small with most employing ten full time employees or less, and only five employing more than 50 people.
BSC Landscape document 3Aug2011.pptx 4
Draft – For discussion only
Exhibit 4. Characteristics of SIFIs
Geographic coverage Organisation characteristics
Percentage of organisations that disperse funds within
each region
LocalRegional
National
International
# orgs
3
6
18
5
CDFI
Fund manager
BankBusiness supportFinance brokerConsultancy
Org type
14
9
42
21
Other
LLP
IPS
CIC
CLS
CLG without charitable status
CLG with charitable status
Trust
Org type
4
1
7
1
6
3
8
2
# orgs15
10
5
0
FTEsOver 50
5
21-50
7
11-20
0
6-10
9
Up to 5
11
Not for profit
For profit, social first
For profit
Org type
22
8
2
63%75%
69%
69%
64%69%
66%66%
Source: BSC survey 2011
Lighting the touchpaper 12
THE BOSTON CONSULTING GROUP ▪ THE YOUNG FOUNDATION November 2011
2.4 Investment characteristics
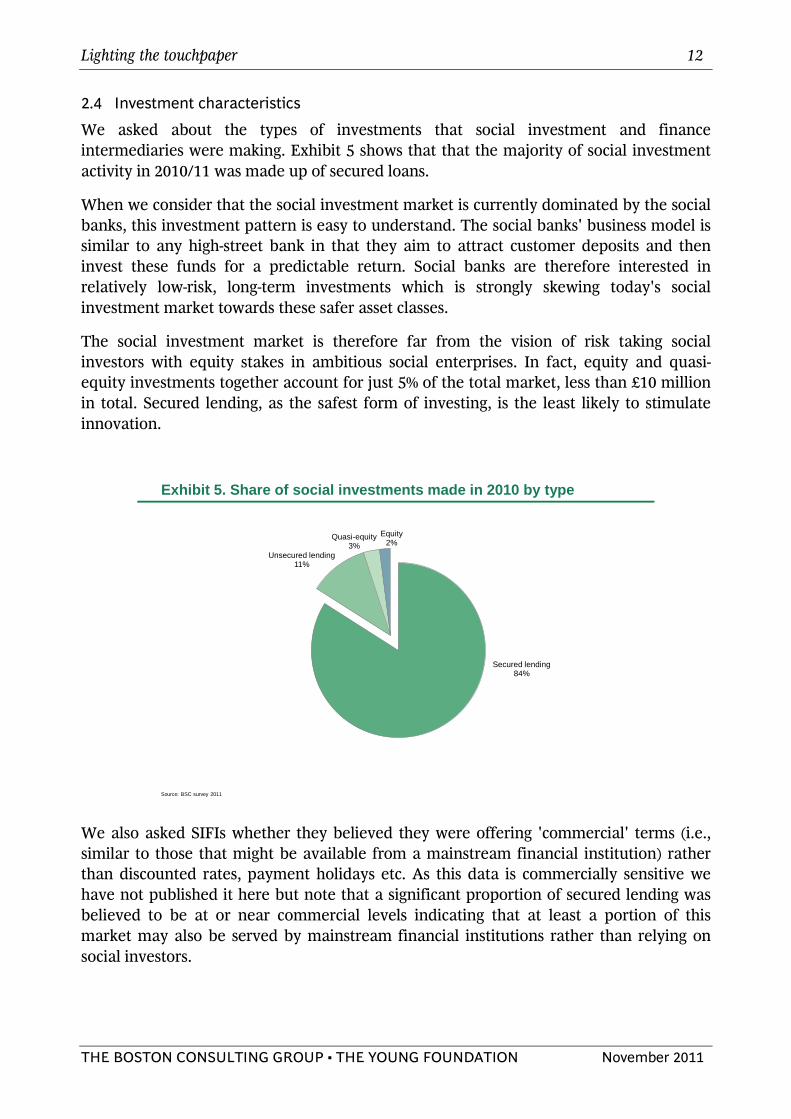
We asked about the types of investments that social investment and finance intermediaries were making. Exhibit 5 shows that that the majority of social investment activity in 2010/11 was made up of secured loans.
When we consider that the social investment market is currently dominated by the social banks, this investment pattern is easy to understand. The social banks' business model is similar to any high-street bank in that they aim to attract customer deposits and then invest these funds for a predictable return. Social banks are therefore interested in relatively low-risk, long-term investments which is strongly skewing today's social investment market towards these safer asset classes.
The social investment market is therefore far from the vision of risk taking social investors with equity stakes in ambitious social enterprises. In fact, equity and quasi-equity investments together account for just 5% of the total market, less than £10 million in total. Secured lending, as the safest form of investing, is the least likely to stimulate innovation.
BSC Landscape document 3Aug2011.pptx 5
Draft – For discussion only
Exhibit 5. Share of social investments made in 2010 by type
Secured lending84%
Unsecured lending11%
Quasi-equity3%
Equity2%
Source: BSC survey 2011
We also asked SIFIs whether they believed they were offering 'commercial' terms (i.e., similar to those that might be available from a mainstream financial institution) rather than discounted rates, payment holidays etc. As this data is commercially sensitive we have not published it here but note that a significant proportion of secured lending was believed to be at or near commercial levels indicating that at least a portion of this market may also be served by mainstream financial institutions rather than relying on social investors.
Lighting the touchpaper 13
THE BOSTON CONSULTING GROUP ▪ THE YOUNG FOUNDATION November 2011
2.5 Frontline social ventures
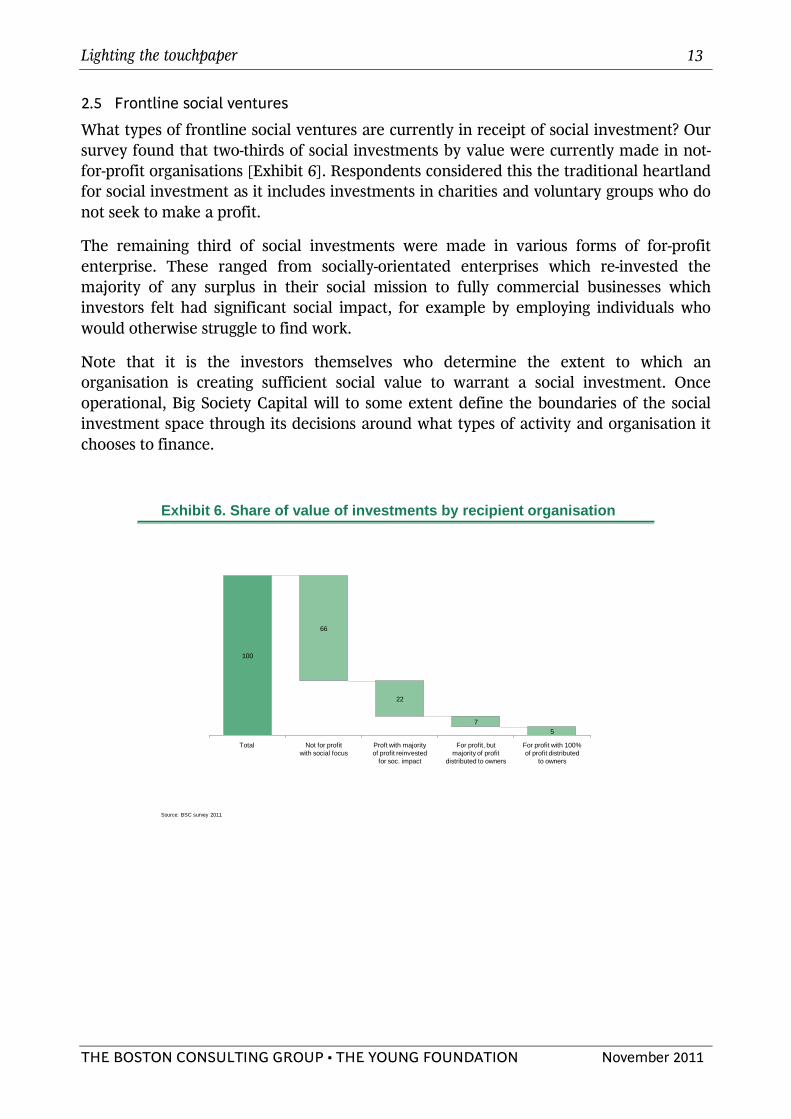
What types of frontline social ventures are currently in receipt of social investment? Our survey found that two-thirds of social investments by value were currently made in not-for-profit organisations [Exhibit 6]. Respondents considered this the traditional heartland for social investment as it includes investments in charities and voluntary groups who do not seek to make a profit.
The remaining third of social investments were made in various forms of for-profit enterprise. These ranged from socially-orientated enterprises which re-invested the majority of any surplus in their social mission to fully commercial businesses which investors felt had significant social impact, for example by employing individuals who would otherwise struggle to find work.
Note that it is the investors themselves who determine the extent to which an organisation is creating sufficient social value to warrant a social investment. Once operational, Big Society Capital will to some extent define the boundaries of the social investment space through its decisions around what types of activity and organisation it chooses to finance.
BSC Landscape document 3Aug2011.pptx 6
Draft – For discussion only
Exhibit 6. Share of value of investments by recipient organisation
For profit with 100% of profit distributed
to owners
5
For profit, but majority of profit
distributed to owners
7
Proft with majority of profit reinvested
for soc. impact
22
Not for profit with social focus
66
Total
100
Source: BSC survey 2011

Lighting the touchpaper 14
THE BOSTON CONSULTING GROUP ▪ THE YOUNG FOUNDATION November 2011
A diverse range of areas of social impact were represented [Exhibit 7] with housing, social care and support services for the social sector being the largest three. It is clear that different investors define social impact in different ways. For example, some do not include primarily religious organisations in their portfolios.
Community Development Finance Institutions (CDFIs) represent a notable category of frontline social ventures. CDFIs lend money to businesses, social enterprises and individuals who struggle to get finance from high street banks and loan companies. They help deprived communities by offering loans and support at an affordable rate to people who cannot access credit elsewhere.
For the purposes of our survey, those CDFIs that primarily lend to businesses or individuals were considered frontline social ventures while (the minority) that primarily lend to social enterprises were considered SIFIs.
BSC Landscape document 3Aug2011.pptx 7
Draft – For discussion only
Exhibit 7. Share of total value of investments by sector
80
100
Money deployed by intermediaries to social ventures (%)
60
40
20
0Other
(please specify)
30
Human rights / conflict
resolution
0
Financial inclusion
2
Criminal justice
2
Arts, culture
and heritage
3
Sport & leisure
3
Employ. support, training & advice
4
Religious
6
Educ & training
6
Health and
wellbeing
7
Commun.
7
Business, social
enterprise and vol. sector
support servi
8
Social care inc. elderly care
10
Housing / accom.
12
Total
100
Source: BSC survey 2011
Approximately 65% of this amount relates to one Social Bank and is attributed to:
• "Energy & Environment"• "Food & Farming"• "Retail"
Lighting the touchpaper 15
THE BOSTON CONSULTING GROUP ▪ THE YOUNG FOUNDATION November 2011
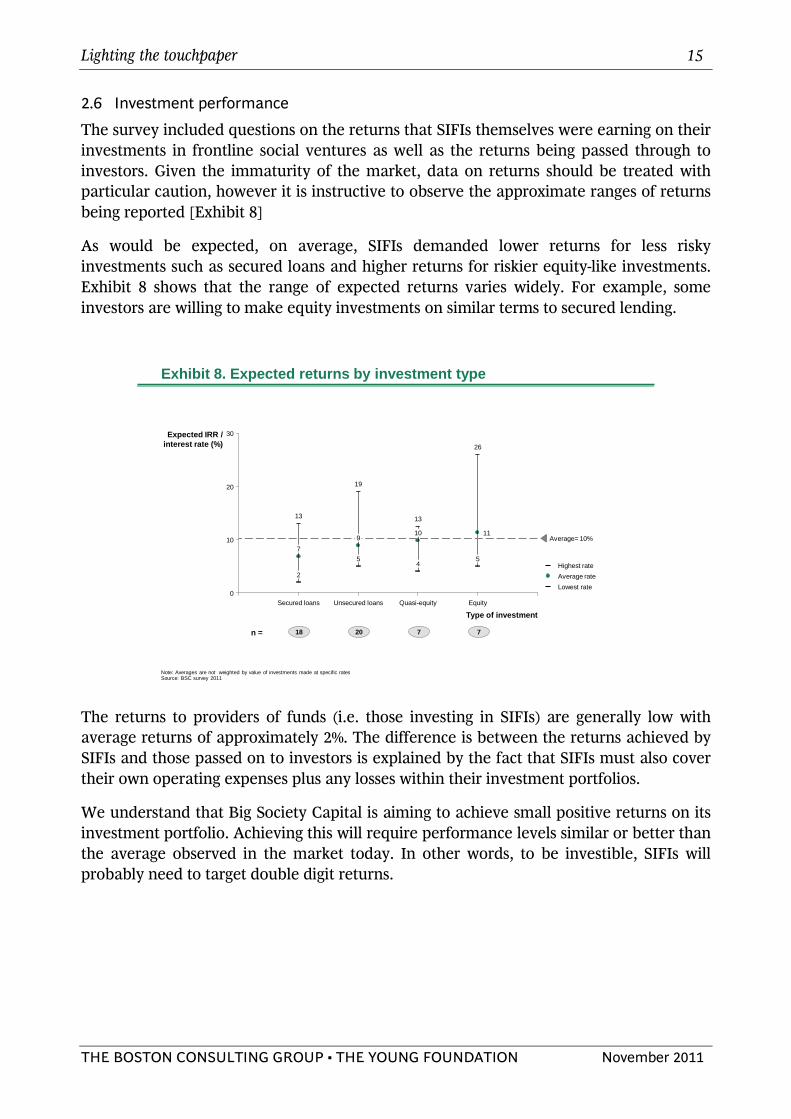
2.6 Investment performance
The survey included questions on the returns that SIFIs themselves were earning on their investments in frontline social ventures as well as the returns being passed through to investors. Given the immaturity of the market, data on returns should be treated with particular caution, however it is instructive to observe the approximate ranges of returns being reported [Exhibit 8]
As would be expected, on average, SIFIs demanded lower returns for less risky investments such as secured loans and higher returns for riskier equity-like investments. Exhibit 8 shows that the range of expected returns varies widely. For example, some investors are willing to make equity investments on similar terms to secured lending.
BSC Landscape document 3Aug2011.pptx 8
Draft – For discussion only
Exhibit 8. Expected returns by investment type
7
19
2
Secured loans
910 Average= 10%
Type of investment
0
Expected IRR /interest rate (%)
30
20
5
Equity
1110
Quasi-equity
4
26
13
Unsecured loans
5
13
Lowest rateAverage rateHighest rate
18n = 20 7 7
Note: Averages are not weighted by value of investments made at specific ratesSource: BSC survey 2011
The returns to providers of funds (i.e. those investing in SIFIs) are generally low with average returns of approximately 2%. The difference is between the returns achieved by SIFIs and those passed on to investors is explained by the fact that SIFIs must also cover their own operating expenses plus any losses within their investment portfolios.
We understand that Big Society Capital is aiming to achieve small positive returns on its investment portfolio. Achieving this will require performance levels similar or better than the average observed in the market today. In other words, to be investible, SIFIs will probably need to target double digit returns.

Lighting the touchpaper 16
THE BOSTON CONSULTING GROUP ▪ THE YOUNG FOUNDATION November 2011
2.7 Conclusion
The social investment market today is dominated by the social banks and government backed funds. Their focus on lower-risk, secured lending represents a more traditional form of social investing that has been a familiar feature of the sector over a number of years.
The dominance of these players is likely to continue in the future but the best growth prospects are likely to be found at the riskier end of the market. This is a far more dynamic environment with multiple small players creating innovative new products but struggling to achieve financial sustainability. This is also the section of the market which is closest to the vision for social investment as a catalyst for innovation and growth in the sector.
When we asked SIFIs where they would be seeking sources of finance in the future the social banks were fourth on the list after Big Society Capital, trusts and foundations, and individuals and angels [Exhibit 9]. This potentially indicates a shift in market towards more risk-seeking sources of capital.
BSC Landscape document 3Aug2011.pptx 9
Draft – For discussion only
Exhibit 9. Sources of finance for SIFIs in the future
Note: CDFI here refers to those CDFIs that are not social banksSource: BSC survey 2011
Other social investors
9Other public sector institutions
8
Rely on own reserves 8
Local Government 4
CDFI 5
Commercial institutions 7
Non-departmental Public Bodies
9
Central Government 11
Big Lottery Fund 11
Banks 14
Individuals and Angels 15
Trusts and foundations 15
Big Society Capital 23
Social sectorCommercial sectorPublic sectorOwn reserves
Number of responses
Our survey identified a number of important barriers that are currently holding the social investment market back. These will need to be addressed if the full growth potential of the market is to be achieved and are discussed in the next section.

Lighting the touchpaper 17
THE BOSTON CONSULTING GROUP ▪ THE YOUNG FOUNDATION November 2011
3. Growing the market for social investment Growth expectations in the market are high. 75% of respondents said they would expand current activities over the next three years and 44% said they would develop new activities. The average growth anticipated in funds under management was 35% p.a. with range 5%- 160% p.a. This represents a £650m capital requirement over the period.
If this vision is to be realised social investment will need move beyond a niche activity by creating new, high-quality investment opportunities; attracting more diverse sources of capital; and addressing some of the structural challenges in the market.
We asked respondents what they saw as the most significant constraints to the growth of the social investment market [Exhibit 10]. The two most significant factors related to the quality and size of investment opportunities available.
BSC Landscape document 3Aug2011.pptx 10
Draft – For discussion only
Exhibit 10. Constraints on social investment
Source: BSC survey 2011
16%
12%12%76%
Inability to provide an acceptable risk adjusted return 40% 32% 28%
60%
Inability to reach commercial scale for managed products
Low Medium High
Other 12% 28%
Don’t know how / who to approach 80% 12% 8%
Lack of long term balance sheet funding
44% 28% 28%
Lack of understanding of the sector by investors 40% 44%
Based on this data, and the qualitative findings from our expert interviews, we have identified six actions that together can unlock the full growth potential of social investment in England.
1. Create more 'investible' business models 2. Improve financial skills and experience in the social sector 3. Develop a better understanding of risk and how to price it 4. Improve commissioning capabilities 5. Improve metrics and independent audit 6. Address the distortive effects of grants and 'soft' finance
Lighting the touchpaper 18
THE BOSTON CONSULTING GROUP ▪ THE YOUNG FOUNDATION November 2011
3.1 Create more 'investible' business models
In our survey, we asked social investors about the constraints that were preventing them from making more investments. 'Lack of attractive ventures to invest in' was identified by nearly half of respondents as one of the biggest barriers to growing the size of the social investment market.
A business model explains how an organisation creates, delivers, and captures value. This value can be financial or social, but social investors demand both. As described earlier, a social investment opportunity exists when someone is willing to pay a premium for creation of social value.
Financial value = Price paid for social value – Cost of creating that social value
To be investible, a social venture needs to explain why this opportunity exists, why their business model is particularly well positioned to capture it, and why external finance is required to enable this to happen.
The individual who is willing to pay for the creation of social value is often called the 'commissioner' of the service. This is because they are usually public sector commissioners but they could be anyone who is willing to pay for the creation of social value such as a philanthropist or even the recipients of the social value themselves.
There are two basic contract types.
• Payment by results or outcomes-based commissioning in which the commissioner offers to pay for a particular social outcome. As these payments are not guaranteed this creates a financing opportunity for any social investor wishing to accept the downside risk in exchange for the upside reward.
• Fee for service contracts in which a social venture is paid to provide a particular service. When the fees paid are greater than the cost of providing that service, this creates the opportunity for investors to help meet any capital requirements (e.g. fixed assets or working capital). The 'fees' here could be made up of user charges as well as commissioner payments. Note that when the fees are set to equal the cost of the service, no financial value is created and no investment opportunity exists.
The financing of fundraising activities (e.g. financing the costs of a direct mail campaign) represents a unique form of social investment as no direct social value is created in the process. Nevertheless, such 'bridging loans' are considered legitimate forms of social investment by many social investors.
If the social investment market is to grow in the years ahead there will need to be far more opportunities to invest which means creating more investible business models. Respondents to our survey were concerned that understanding of what 'investible' means is currently very low in the sector. Providing advice and assistance to social ventures to help them strengthen their business models will undoubtedly do much to improve the situation.
Lighting the touchpaper 19
THE BOSTON CONSULTING GROUP ▪ THE YOUNG FOUNDATION November 2011
It is also important to note that many, if not most, social ventures are currently unsuitable for social investment. This is because the social value they are creating is not currently priced at a level that exceeds the costs of creating it. It may be possible to address this by improving commissioning capabilities (discussed in 3.4 below). Where this is not possible, or commissioners remain unwilling to pay, grant funding remains the best alternative.
3.2 Improve financial skills and experience in the social sector
Social investors told us that finding an 'investible' business model was at best only half the story when considering whether an investment opportunity was attractive. As important was the team of people in charge of the organisation. Are they credible? Do they have a track record of success in this area?
One particular aspect was highlighted by many of the investors we spoke to – does this team have the necessary financial skills and experience to receive investment? It was felt that many social enterprises only had a weak understanding of the implications of taking on external finance.
This is perhaps not surprising given that many front-line social organisations have not had to take on external finance in the past, however, as the demand for finance grows, and the complexity of financial products available to the social sector expands, it will be increasingly important that investors have confidence in the financial literacy of their investees.
It is also likely that entrepreneurial skills will be increasingly valued in the sector. Recognising and pursuing new opportunities, and attracting and convincing investors, will require leaders who are comfortable with uncertainty, willing to take risks to achieve their objectives, and able to pitch their ideas to outsiders.
In July this year, the government announced that it was making £10 million of grant money available through the Investment and Contract Readiness Fund to help develop skills and infrastructure development in the sector.

Lighting the touchpaper 20
THE BOSTON CONSULTING GROUP ▪ THE YOUNG FOUNDATION November 2011
3.3 Develop a better understanding of risk and how to
price it
Social investors are sometimes described as being willing to accept "below market returns". This is because they are happy to trade-off social returns with financial returns. But how do we know what the appropriate "market return" is for a particular social investment when the market is so immature? This problem was identified by many respondents who pointed out that the difficulties in understanding and pricing risk were one of the main reasons that many investors were reluctant to enter the market.
The risk-return tradeoff is a fundamental financial concept. It describes the principle that expected return must rise with an increase in risk. Low levels of risk (uncertainty) only demand low expected returns, whereas high levels of risk (high uncertainty) demand high expected returns.
In simple terms, investment opportunities ask investors to put their money at risk in exchange for the possibility of making a return in the future. This is no different for social investments, other than the fact that the returns can be both financial and social.
Different types of social investment opportunity carry different levels of risk. For example, a payment-by-results contract, in which it is possible to receive no payments at all if performance falls below a certain threshold, represents a relatively high level of risk for the investor. This is because it is possible to lose all the capital invested. In contrast, secured lending against a property represents a relatively low level of risk because as a last resort the lender will always be able to sell the property and in doing so recoup a proportion of the initial investment.
Given this analysis we would expect secured lending, on average, to require lower returns than investments based on payment-by-results contracts. This fact is confirmed by our survey data which showed secured loans required lower expected returns than unsecured loans, which in turn required lower returns than quasi-equity and equity investments.
Risk-weighted returns
Imagine a social venture is seeking £100k to fund the operating costs of a new programme which, if successful, will earn an income of up to £120k for the organisation over the next two years through a payment-by-results contract.
Working with an intermediary they manage to negotiate a financing deal in which the full £100k will be provided today with any profits to be paid back to the investors. As this is a payment-by-results contract the income will depend on performance, but the team are confident that the minimum payment will be £90k and the maximum £120k with an equal probability of all values in between.
In this example, the absolute returns could reach as high as 20% if investors received £120k back on their original investment of £100k. But the risk-weighted return is only £5k or 5% as there is an equal probability of achieving any outcome between -10% and +20% return. It is the risk-weighted return that investors should use to assess whether a particular investment is attractive or not from a financial perspective.
Lighting the touchpaper 21
THE BOSTON CONSULTING GROUP ▪ THE YOUNG FOUNDATION November 2011
Making this argument in general terms is however not sufficient for most investors who would like to understand more precisely the risks they are taking on and the returns they might therefore expect. Similarly, commissioners need a solid understanding of the risks and expected returns when they are establishing payment-by-results contracts otherwise they may overpay or underpay for the risks being transferred.
For investors, the payout received for achieving the target outcome is less interesting than the risk-weighted return – that is the return you can expect to receive when all possible outcomes, and the likelihood of those outcomes, are taken into account. This is therefore an important calculation to make when assessing any investment opportunity.
The example in the text box to the right demonstrates how risk-weighted returns can be calculated for a simple payment-by-results contract. Here, the calculation is relatively trivial because the probability distribution of outcomes is given (and flat). In the real world it is much more difficult for investors to assess the likelihood of any particular outcome being achieved.
Difficult - but not impossible. Take, for example, the Social Impact Bond at Peterborough Prison. Investors will receive a return if re-offending among the prison leavers falls by 7.5% or more compared to a control group of short-sentence prisoners in the UK. If the Social Impact Bond delivers a drop in re-offending beyond 7.5%, investors will receive an increasing return capped at a maximum of 13% per year over an eight year period. If re-offending is reduced by less than 7.5% then the investors will lose all their capital – an absolute return of -100%!
Calculating the risk-weighted returns requires an estimate of the probability distribution of outcomes, in this case, different reductions in re-offending as a result of the particular interventions planned. In this example, historical re-offending rates can give us a good indication, as well as information about how well similar interventions have worked in the past.
Big Society Capital is expected to demand a positive return on the investments it makes and so should generally only be interested in investments with positive risk-weighted returns.
With a better understanding of risk-weighted returns, social investments can be designed to make them attractive for a target investor group. Characteristics such as floor payments and payment ceilings can be adjusted to strike the appropriate balance between incentivising performance improvement, delivering investor returns, and limiting contract liability for the commissioner.
Of course, the price of such contracts is also determined by the commissioners' willingness to pay for a particular social outcome - an issue that will be discussed now.
Lighting the touchpaper 22
THE BOSTON CONSULTING GROUP ▪ THE YOUNG FOUNDATION November 2011
3.4 Improve commissioning capabilities
Our survey highlighted that many of the new opportunities for social investment will be based on outcomes-based contracts. As such, commissioners will need to become skilled at structuring and negotiating such deals. Respondents expressed concern that commissioners do not yet have the skills and capabilities that these contracts require.
Firstly, commissioners need to understand the circumstances under which outcomes-based contracts are most appropriate. This includes practical considerations such as the extent to which social outcomes are measurable and attributable. From a financial perspective, the commissioner also needs to believe that the benefits of setting up an outcomes-based contract outweigh the costs.
The benefits of outcome-based contracts are driven by provider innovation. When a service provider is rewarded by outcomes they are incentivised to innovate to achieve better outcomes at lower costs. For this reason, tightly defined service areas where there is little room for innovation are less attractive than those which are more open to new ideas and risk-taking.
The costs of outcome-based contracts include the legal, audit and other fees required to establish and maintain the contracts plus the additional costs of capital associated with finance being borrowed by the providers rather than being borrowed by the government itself.
Given record low yields on government bonds the difference in cost of capital alone is likely to be at least 5%, and probably considerably more, so commissioners should be targeting this as a minimum expected improvement (in comparison to more traditional contracting arrangements) when establishing outcomes-based contracts.
Secondly, commissioners need to establish a clearer logic for how outcomes-based contracts are priced. Until now, commissioners have tended to focus on 'cashable savings' when pricing outcomes. This approach is flawed and risks limiting the growth of the social investment market by unnecessarily capping returns. Instead, commissioners should adopt a value for money approach as is expected of all other public expenditure.
The cashable savings approach to valuing outcomes. In theory, commissioners should be willing to pay up to the value of the social value created by a particular outcome. In practice, however, commissioners have been more comfortable to focus on what they call the 'cashable savings' of an outcomes-based contract. These are the savings which are directly cashable within that commissioner's budget.
For example, when determining the price it is willing to pay for a reduction in reoffending, the Ministry of Justice (MoJ) considers the savings to its budget, such as those achieved by closing a prison, but not the savings to other government budgets such as reduced policing levels or more broadly, the benefits to society of a reduction in crime.
This approach naturally limits the price that MoJ is willing to pay and risks making it impossible to design outcomes-based contracts that are both attractive to investors and
Lighting the touchpaper 23
THE BOSTON CONSULTING GROUP ▪ THE YOUNG FOUNDATION November 2011
acceptable to commissioners. As such, investors told us that this could be a significant limiting factor to the growth of the social investment market.
A value for money approach to valuing outcomes. From a purely financial perspective, not paying out more than the value captured is sensible, but for government, the value captured is the wrong metric to consider. The Treasury stipulates that the public procurement of goods and services must be based on value for money, defined as the optimum combination of costs and outcomes. For example, when government spends money building a hospital, it does not consider the value the Department for Health can capture, or even those that the government as a whole can capture, but rather the benefits of that hospital to society as a whole.
Commissioners should apply exactly the same logic when designing outcomes-based contracts. When the Ministry of Justice establishes an outcomes-based contract for recidivism it is offering to 'buy' a particular social outcome that is valuable to society as a whole. The fact that some of the costs of paying for this social outcome can be defrayed through savings in its own budget is welcome but in terms of pricing the outcome, irrelevant.
Some further argue that 'cashability' is a relatively meaningless concept in most circumstances. For example, it is extremely difficult to make the direct connection between a reduction in reoffending and any cashable savings whatsoever as prisons are not a variable cost in that sense. Commissioners should therefore focus on developing a more coherent approach to pricing outcomes based on the same value for money argument that is used for all other public expenditure. HM Treasury will need to support this effort and produce updated guidance as necessary.
3.5 Improve metrics and independent audit
Social investors demand both social and financial returns, they therefore require ways of measuring and verifying those returns. Measuring social impact is challenging, especially when comparing across different types of impact (e.g. comparing children’s welfare to drug rehabilitation). Survey respondents told us that suitable metrics are currently under-developed and improving the quality of performance information will be an important factor supporting future growth in the social investment market.
The majority of investors we surveyed said they were not currently satisfied with the metrics they are using for assessing social impact. Some used standardised approaches such as Social Return on Investment (SRoI) but others preferred a more bespoke approach to each investment. Several were in the process of reviewing their approach to social impact measurement.
The debate on social impact measurement pre-dates the social investment movement, but social investment makes the challenge of developing simple, comparable metrics for social impact all the more acute. While it may be feasible to make bespoke assessments on an investment-by-investment basis for an investment fund, arms-length investors will require a more aggregated understanding of performance, especially when comparing a wide variety of opportunities.

Lighting the touchpaper 24
THE BOSTON CONSULTING GROUP ▪ THE YOUNG FOUNDATION November 2011
The discipline of social investment provides a neat solution to this problem as it demands that social value should be priced in order for an investment opportunity to be created. To the extent that investors are confident that social value is being priced correctly, they can simply use this to guide their investment decisions.
When a payment by results mechanism is used to create the investment opportunity it is also important to have confidence in the outcome metric selected. As discussed in the previous section, when assessing a social investment from a financial perspective it is important to calculate the risk-weighted returns. For PbR this requires a solid understanding of the probability distributions of outcomes. Such calculations are much easier when high quality historical performance data is available so, when establishing new investment vehicles it is preferable to choose metrics where such data are known.
As payments will be determined by the achievement (or otherwise) of these outcomes both investors and commissioners will require them to be independently audited. The costs of this audit will need to be considered as part of the costs of establishing PbR based investments.
3.6 Address the distortive effects of grants and 'soft' finance
Grant money and charitable donations are vital for the sector, and much of this is revenue funding rather than capital investment, but if the social investment market is to grow, the potential distortive effects that so-called 'soft' finance has on the market will need to be addressed.
Survey respondents identified two main ways in which soft money can distort the social investment market: firstly, by crowding out investment opportunities and secondly by distorting returns and therefore investor expectations.
Crowding out investment
Consider the characteristics of a social venture which is likely to be an attractive investment target for a social investor. As discussed above, the social venture will be well managed, with a strong team in place; there will be a clear sense of how the organisation creates value (both social and financial); metrics will be in place to track progress and report on outcomes; and there will be a good track record of success.
Now consider the characteristics of a social venture that will be attractive to a grant giving organisation. They will be exactly the same. Those social ventures which are most likely to be successful in attracting social investment will also be most likely to make successful grant applications or be well placed to access other sources of softer finance.
Lighting the touchpaper 25
THE BOSTON CONSULTING GROUP ▪ THE YOUNG FOUNDATION November 2011
How should this particular social venture's management team weigh up these different sources of finance? On the one hand, grant money does not need to be repaid (or has extremely generous terms); there is likely to be a familiar application procedure in place; and if awarded the legal and administrative costs of receiving such funding are generally well understood and manageable.
By contrast, attracting social investment is much more difficult and time-consuming. There are legal, audit and governance issues to be considered which are likely to be far more onerous than those required for the receipt of grant money. The money itself will need to be repaid in the near future, probably with interest or an additional return.
From this perspective it is easy to understand why the most successful, most attractive social ventures from an investor's point of view are perhaps the least incentivised to seek investment finance. Soft finance is, in effect, 'crowding out' the best investment opportunities.
Survey respondents also explained how this effect can work from the investor's perspective. Several organisations who currently provide grant finance have been experimenting with small investment funds alongside their grant-giving activity. When the costs and additional complexity of making social investments is taken into account, it often appears simpler just to give the money away rather than construct a social investment vehicle.
To some extent, this crowding out effect is a consequence of the immaturity of the social investment market. As investors and investees become more familiar with the requirements and processes of investment and investment vehicles become more established the transaction costs of social investment activity are likely to fall. However, a loan will almost always look unattractive compared to a donation and while significant pools of grant money are chasing the same, high-performing social ventures, it will always be difficult for social investors to get a foothold.
Distorting returns
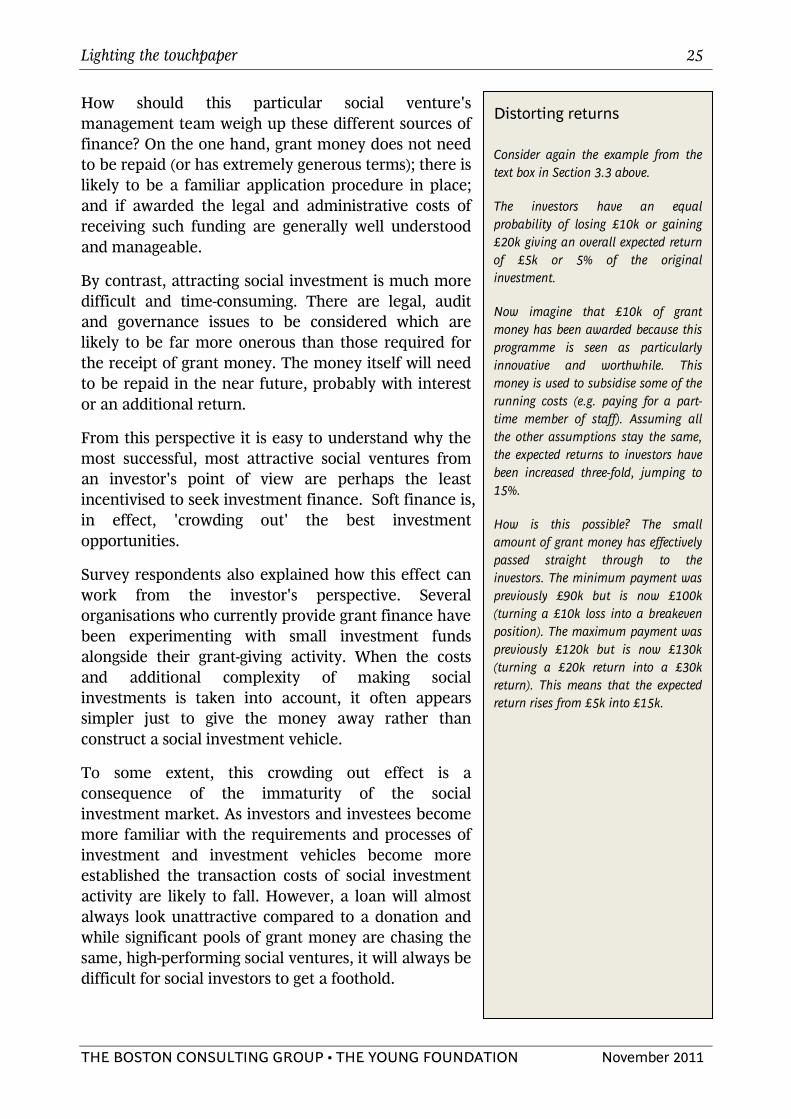
Consider again the example from the text box in Section 3.3 above.
The investors have an equal probability of losing £10k or gaining £20k giving an overall expected return of £5k or 5% of the original investment.
Now imagine that £10k of grant money has been awarded because this programme is seen as particularly innovative and worthwhile. This money is used to subsidise some of the running costs (e.g. paying for a part-time member of staff). Assuming all the other assumptions stay the same, the expected returns to investors have been increased three-fold, jumping to 15%.
How is this possible? The small amount of grant money has effectively passed straight through to the investors. The minimum payment was previously £90k but is now £100k (turning a £10k loss into a breakeven position). The maximum payment was previously £120k but is now £130k (turning a £20k return into a £30k return). This means that the expected return rises from £5k into £15k.
Lighting the touchpaper 26
THE BOSTON CONSULTING GROUP ▪ THE YOUNG FOUNDATION November 2011
Addressing this challenge is not straightforward but survey respondents highlighted the importance of co-ordination between large investors such as Big Society Capital and Triodos Bank and major grant givers such as the Big Lottery Fund and the Esmée Fairbairn Foundation. The construction of co-investment vehicles that blend grant and investment finance is likely to be one avenue worth exploring although as discussed below this type of arrangement presents its own challenges.
Distorting returns
Given its characteristics, soft finance can have a highly distortive effect on individual social investments. In particular, returns can be artificially inflated which, especially during the early years of social investment, could artificially raise investor and commissioner expectations to unrealistic levels thus making it more difficult to construct deals in the future.
The example in the text box on the right shows how this can happen in practice. In this example, the distortion is particularly blatant, but there are more subtle ways in which the same effect can work. For example, any time the full costs of establishing and providing a service are not included in the economics of a deal, such as when services are offered in kind, or overhead costs are excluded, returns are inflated. In many cases it will be extremely difficult for those outside the organisations involved to fully understand the implications or even be aware that this is happening.
Does this matter? Some are sanguine about this effect. In fact, it can be argued that such deals should be encouraged as the grant money is effectively being "leveraged", increasing the chances of attracting private finance. This is unfortunately muddled thinking. In the example above there is no leverage occurring at all, simply a pass through of value from donors to investors. No additional social or financial value is being created in the process. That is not to say it is impossible to construct deals that use both grant finance and social investment – you just need to be extremely careful not to distort returns.
Nevertheless, many current social investments have made use of 'soft money' to inflate investor returns. One common rationale is that without this kind of funding these early deals would not be possible and so the use of supplementary grant finance at this stage was actually a form of pump-priming for the social investment market as a whole.
This logic is also questionable as the most likely effect of this pump-priming will be to raise investor expectations about future returns, and reduce commissioner expectations about price making future deals all the harder once the grant funding is removed.
Transparency is likely to be the most effective antidote to such distortions. All parties should be absolutely clear how the money flows through a deal, and the effects on risk and return. Deals in which such effects are obscured are likely to be damaging to the sector in the long run.

Lighting the touchpaper 27
THE BOSTON CONSULTING GROUP ▪ THE YOUNG FOUNDATION November 2011
4. Conclusion These are exciting times for the social investment industry in England. The combination of political momentum, financial innovation, infrastructure development and new sources of finance are combining to create a once in a generation opportunity to revolutionise the sector.
Our survey shows that while the foundations for this revolution are solid, based on many years of nurturing from government funds and social banks, the more entrepreneurial spirit of social investment as a driver of radical innovation and social impact remains the exception rather than the rule within the market.
This is partially a matter of timing. Big Society Capital is not yet fully operational and innovations such as social impact bonds remain in their infancy. We spoke to many social investors and social entrepreneurs who had bold ambitions for growth and were excited about the possibilities on the horizon. They recognised the need for change and are ready and able to play their part in making that change happen.
But our survey also revealed some important actions to be taken if the sector is to achieve its full potential. For example, building a better understanding of the necessary conditions for social investment and the characteristics of investible business models will be vital. So too, upgrading the financial skills and tools available in the social sector.
Investors, social entrepreneurs and government all have a role to play and many will look to Big Society Capital to provide leadership to the sector. However, change of this scale and complexity cannot be led by one actor alone. It will require a concerted effort from everyone involved in the social investment market over the months and years ahead.
We are confident the sector will rise to the challenge. Throughout this research we were struck by the energy and optimism in the sector as a whole driven by a passion to create positive social change. It is this passion that will be the real fuel for the growth of the sector in the years ahead.

Lighting the touchpaper 28
THE BOSTON CONSULTING GROUP ▪ THE YOUNG FOUNDATION November 2011
Annex A: Survey methodology The Young Foundation and the Boston Consulting Group conducted a survey of social investment and finance intermediaries (SIFIs) in July 2011. As no single directory of SIFIs existed at the outset, the team developed a long-list of 87 organisations that were potentially playing an intermediary role using a variety of sources.
The list was divided into five segments.
1. Social banks (4 organisations) 2. SIFIs with annual investments over £1m (12 organisations) 3. SIFIs with annual investments under £1m (17 organisations) 4. Finance providers to financially excluded individuals or organisations (37 organisations) 5. Providers of support services (17 organisations)
Where an organisation had a range of activities that covered two or more segments it was included in the segment with the lowest number.
A detailed questionnaire was developed asking about the organisations themselves; their sources of finance; their investment activities; and their future expectations. The survey was designed to be deployed as both an interview or through a web-survey. Segments 1,2 and 3 were prioritised for interviews.
A total of 35 interviews were conducted either face-to-face or over the phone. These were supplemented by an additional 24 web surveys. In addition the team were given access to the CDFA dataset which allowed a further 19 organisations to be included.
This left nine organisations for which data was not available: eight of which were in segment 5 and one of which was in segment 3. No attempt was made to correct the data for these missing results as it was believed the organisations concerned represented little or no investment activity.
Results from the interviews and web-surveys were entered into an Excel database and checked for accuracy and consistency. When necessary interviewees were re-contacted to address points of clarification.
The data published in this report relates exclusively to segments 1,2 and 3. The full anonymised data set was made available to the Cabinet Office and Big Society Capital.
Lighting the touchpaper 29
THE BOSTON CONSULTING GROUP ▪ THE YOUNG FOUNDATION November 2011
Annex B: Organisations surveyed Allia
ART(Aston Reinvestment Trust)
Big Issue Invest
Black Country Reinvestment Society
Bridges Ventures - Bridges Social Entrepreneurs Fund
Bristol Enterprise Development Fund Ltd
Business Enterprise Fund
CAF Venturesome
CAN (Community Action Network)
Charity bank
Clearly So
Co-operative & Community Finance
Coventry and Warwickshire Reinvestment Trust
Cumbria Community Asset & Reinvestment Trust
Eastside
Ecology Building Society
Entrust
Esmée Fairbairn Foundation
First Enterprise Business Agency
Foundation East
Frederick's Foundation
FSY
GLE One London
Impetus Trust
Key Fund Yorkshire
Local Partnerships
MCF loans
Merism Capital
Moneyline Yorkshire
Lighting the touchpaper 30
THE BOSTON CONSULTING GROUP ▪ THE YOUNG FOUNDATION November 2011
MSIF
NESTA
New Philanthropy Capital
North London Community Finance
NWES
Parity Trust
Project North East
Red Ochre
Resonance
Rootstock Ltd & Radical Routes Ltd
School for Social Entrepreneurs
SEL
Sirius
Social Finance Ltd
Social Stock Exchange
Spirit of Enterprise
The Enterprise Fund trading as Business Finance Solutions
The Hub
The London Rebuilding Society
The Social Business Trust
The Social Enterprise Loan Fund
The Social Investment Business
The Young Foundation
Triangle Consulting
Triodos Bank UK
Unity Trust Bank
UnLtd - Foundation for Social Entreprenuers
Volans
WEETU
West Yorkshire Enterprise Agency
Lighting the touchpaper 31
THE BOSTON CONSULTING GROUP ▪ THE YOUNG FOUNDATION November 2011
About the Authors
Adrian Brown is a Principal in the London office of The Boston Consulting Group. You
can contact him via email at [email protected]
Will Norman is the Director of Research at The Young Foundation. You can contact him
via email at [email protected]
The authors are very grateful to David Rhodes, Craig Baker, Alex Fortescue-Webb,
Madeleine Phipps-Taylor, Lauren Daum, Simon Tucker, Cynthia Shanmugalingam, Nick
O'Donohoe, Caroline Mason, Emma Davies, Tamsyn Roberts, Oliver Phillips, Jonathan
Flory, Ben Jupp and Joe Ludlow for their contributions to this report. They would also
like to thank all the organisations and individuals who took part in the survey and the
CDFA for kindly sharing their own survey data.
The Boston Consulting Group (BCG) is a global management consulting firm and the
world's leading advisor on business strategy. We partner with clients from the private,
public, and not-for-profit sectors in all regions to identify their highest-value opportunities,
address their most critical challenges, and transform their enterprises. For more
information please visit www.bcg.com.
The Young Foundation brings together insights, innovation and entrepreneurship to meet
social needs. We have a track record of over 50 years success with ventures such as the
Open University, Which?, the School for Social Entrepreneurs and Healthline (the
precursor of NHS Direct). For more information please visit www.youngfoundation.org.