Light-driven reversible surface functionalization with ... · 1 Supporting Information for...
23
1 Supporting Information for Light-driven reversible surface functionalization with anthracenes: visible light writing and mild UV erasing Tanja K. Claus, ab Siham Telitel, a Alexander Welle, ab Martin Bastmeyer, de Andrew P. Vogt, ab Guillaume Delaittre, ac * Christopher Barner-Kowollik abf * a Preparative Macromolecular Chemistry, Institut für Technische Chemie und Polymerchemie, Karlsruhe Institute of Technology (KIT), Engesserstr. 18, 76131 Karlsruhe b Institut für Biologische Grenzflächen (IBG), Karlsruhe Institute of Technology (KIT) Hermann- von-Helmholtz-Platz 1, 76344 Eggenstein-Leopoldshafen, Germany c Institute for Toxicology and Genetics (ITG), Karlsruhe Institute of Technology (KIT), Hermann- von-Helmholtz-Platz 1, 76344 Eggenstein-Leopoldshafen, Germany d Zoological Institute, Cell and Neurobiology, Karlsruhe Institute of Technology (KIT), Fritz- Haber-Weg 4, 76131 Karlsruhe, Germany e Institut für funktionelle Grenzflächen (IFG), Karlsruhe Institute of Technology (KIT), Hermann- von-Helmholtz-Platz 1, 76344 Eggenstein-Leopoldshafen, Germany f School of Chemistry, Physics and Mechanical Engineering, Queensland University of Technology (QUT), 2 George Street, QLD 4000, Brisbane, Australia E-mail: [email protected], [email protected], [email protected] Electronic Supplementary Material (ESI) for ChemComm. This journal is © The Royal Society of Chemistry 2017
Transcript of Light-driven reversible surface functionalization with ... · 1 Supporting Information for...

1
Supporting Information for
Light-driven reversible surface functionalization with
anthracenes: visible light writing and mild UV erasing
Tanja K. Claus,ab Siham Telitel,a Alexander Welle,ab Martin Bastmeyer,de Andrew P. Vogt,ab
Guillaume Delaittre,ac* Christopher Barner-Kowollikabf*
aPreparative Macromolecular Chemistry, Institut für Technische Chemie und Polymerchemie,
Karlsruhe Institute of Technology (KIT), Engesserstr. 18, 76131 Karlsruhe
bInstitut für Biologische Grenzflächen (IBG), Karlsruhe Institute of Technology (KIT) Hermann-
von-Helmholtz-Platz 1, 76344 Eggenstein-Leopoldshafen, Germany
cInstitute for Toxicology and Genetics (ITG), Karlsruhe Institute of Technology (KIT), Hermann-
von-Helmholtz-Platz 1, 76344 Eggenstein-Leopoldshafen, Germany
dZoological Institute, Cell and Neurobiology, Karlsruhe Institute of Technology (KIT), Fritz-
Haber-Weg 4, 76131 Karlsruhe, Germany
e Institut für funktionelle Grenzflächen (IFG), Karlsruhe Institute of Technology (KIT), Hermann-
von-Helmholtz-Platz 1, 76344 Eggenstein-Leopoldshafen, Germany
fSchool of Chemistry, Physics and Mechanical Engineering, Queensland University of
Technology (QUT), 2 George Street, QLD 4000, Brisbane, Australia
E-mail: [email protected], [email protected],
Electronic Supplementary Material (ESI) for ChemComm.This journal is © The Royal Society of Chemistry 2017
2
Contents
1 Materials ............................................................................................................................................ 2
2 Methods and Characterization ..................................................................................................... 3
3 Experimental Procedures ............................................................................................................. 5
3.1 Synthetic Protocols .................................................................................................................... 5
3.2 Surface Encodings ................................................................................................................... 16
4 XPS Measurement ......................................................................................................................... 19
5 ToF-SIMS Measurements ............................................................................................................ 20
1 Materials
9-Bromoanthracene (9-BA; Sigma–Aldrich, 94 %), 9-anthracenemethanol (Sigma–Aldrich, 97%), 1,1'-
carbonyldiimidazole (CDI; TCI, ≤ 97 %), azobisisobutyronitrile (AIBN; Sigma–Aldrich, ≥ 98 %), benzoic
acid (Sigma–Aldrich, 99.5 %), bis(triphenylphosphine)palladium(II) dichloride (Pd(PPh3)2Cl2; Sigma–
Aldrich, ≥99 %), copper (I) iodide (CuI; Sigma‒Aldrich, ≥ 99.5 %), N,N'-dicyclohexylcarbodiimide (DCC;
Acros, 99 %), dimethylaminopyridine (DMAP; Sigma-Aldrich, 99 %), ethynyltrimethylsilane (Sigma–
Aldich, 98 %), N,N,N′,N′′,N′′-pentamethyldiethylenetriamine (PMDETA; Sigmal–Aldrich 99 %), piperidine
(Acros Organics, 99 %), di-phosphorus pentasulfide (P4S10; Merck Millipore), ammonium chloride
(NH4Cl; Roth, 98 %), potassium bicarbonate (K2CO3; Roth, 99 %) sodium sulfate (Na2SO4; Roth, 99 %),
d-chloroform (CDCl3; Sigma–Aldrich, 99.8 %), dimethylsulfoxide-d6 (DMSO-d6; Euriso-Top, 99.8 %), dry
N,N-dimethylformamide (DMF; Acros Organics, extra dry, 99,7 %), dry tetrahydrofurane (THF; Acros
Organics, AcrosSeal®, 99.95 %), dry toluene (Acros Organics, extra dry 99.8 %), diethylether (Et2O;
VWR, p.a.), DMF (VWR, p.a.), methanol (MeOH; VWR, p.a.), triethylamine (Roth, p.a.), toluene (VWR,
p.a. or Roth), dichloromethane (DCM; VWR, p.a.), cyclohexane (VWR, p.a.), ethyl acetate (VWR, p.a.),
acetonitrile (VWR, p.a.), THF (VWR, p.a.), sulfuric acid (H2SO4; Roth, 96 %) and hydrogen peroxide
(H2O2; Roth, 35 %) were used as received.
For the surface reactions, acetone (Fischer, electronis (MOS) grade), MiliQ water, extra dry toluene
(Acros), toluene (Alfa Aesar, HPLC grade), dichloromethane (Fischer, synthesis grade), and ethanol
(Fischer, laboratory reagent grade) were used as received. The argon stream was filtered through an
activated charcoal filter (Supelco 24518).
Copper (II) bromide was treated with glacial acetic acid for reduction to copper (I) bromide, which was
stored under inert gas.

3
2 Methods and Characterization
1H and 13C NMR spectroscopy was performed on a Bruker Ascend 400 at 400 MHz for
hydrogen nuclei and at 101 MHz for carbon nuclei. All samples were dissolved in CDCl3 or
DMSO-d6. The δ-scale is referenced to the respective residual solvent peak.
Electrospray ionization mass spectrometry (ESI-MS) spectra were recorded on a Q Exactive
(Orbitrap) mass spectrometer (ThermoFisher Scientific, San Jose, CA, USA) equipped with an
HESI II probe. The instrument was calibrated in the m/z range of 74-1822 using a premixed
standard comprising caffeine, Met-Arg-Phe-Ala acetate (MRFA), and a mixture of fluorinated
phosphazenes (Ultramark 1621). A constant spray voltage of 4.6 kV and a dimensionless
sweep gas flow rate of 5 were applied. The capillary temperature and the S-lens RF level were
set to 320 °C an 62.0, respectively. The samples were dissolved with a concentration of
0.05 mg·mL-1 in a mixture of THF and MeOH (3:2) containing 100 µmol sodium trifluoracetate
(NaTFA). The samples were infused with a flow of 5 µL·min-1. Spectra were recorded in the
negative mode.
UV-Vis spectra were recorded on an OceanOptics USB4000 spectrometer coupled to an
USB-ISS-UV-Vis detecting unit. All spectra were recorded in acetonitrile with a concentration
of 0.01 mol/L.
Gel permeation chromatography (GPC) measurements were performed on a Polymer
Laboratories (Varian) PL-GPC 50 Plus Integrated System, comprising an autosampler, a PLgel
5 mm bead-size guard column (50 × 7.5 mm), one PLgel 5 mm Mixed E column
(300 × 7.5 mm), three PLgel 5 mm Mixed C columns (300 × 7.5 mm) and a differential
refractive index detector using THF as the eluent at 35 °C with a flow rate of 1 mL min-1. The
employed GPC system was calibrated using linear poly(styrene) standards ranging from 476
to 2.5·106 g mol-1and linear poly(methyl methacrylate) standards ranging from 700 to
2·106 g mol-1. The resulting molar mass distributions were determined by universal calibration
using Mark-Houwink parameters for polystyrene (K = 14.1·10-5 dL g-1, α = 0.7).
X-Ray Photo electron spectroscopy (XPS) measurements were performed using a K-Alpha+
XPS spectrometer (ThermoFisher Scientific, East Grinstead, UK). Data acquisition and
processing using the Thermo Avantage software is described elsewhere.1 All samples were
analyzed using a microfocused, monochromated Al Kα X ray source (400 μm spot size). The
K-Alpha+ charge compensation system was employed during analysis, using electrons of 8
eV energy, and low-energy argon ions to prevent any localized charge build-up. The spectra
were fitted with one or more Voigt profiles (BE uncertainty: ±0.2eV) and Scofield sensitivity
factors were applied for quantification.2 All spectra were referenced to the C 1s peak attributed
to C-C, C-H at 285.0 eV binding energy controlledby means of the well-known photoelectron
peaks of metallic Cu, Ag, and Au, respective
Time-of-flight secondary ion mass spectrometry (ToF-SIMS) measurements were performed
on a TOF.SIMS5 instrument (ION-TOF GmbH, Münster, Germany). This spectrometer is
equipped with a bismuth cluster primary ion source and a reflectron type time-of-flight analyzer.
UHV base pressure was < 5×10⁻⁹ mbar. For high mass resolution the Bi source was operated
in the “high current bunched” mode providing short Bi3+ primary ion pulses at 25 keV energy
and a lateral resolution of approx. 4 μm. The short pulse length of < 1.3 ns allowed for high
mass resolution. Due to the required large fields of view, the stage scan mode was used and

4
individual patches of 500×500 µm2 were stitched by moving the sample. Each patch consists
of 30 scans, rastered in random mode, with 100 pixels/mm2. Pulsed primary gun target currents
were recorded (approx. 0.5 pA @ 10 kHz) and all data were normalized on constant primary
ion dose density. Spectra were calibrated on the omnipresent C-, CH-, CH2-, C2-, C3-; or on the
C+, CH+, CH2+, and CH3+ peaks. Based on these datasets the chemical assignments for
characteristic fragments were determined.
All light sensitive reactions were carried out in a yellow light environment. This was achieved
by adding wavelength filters to normal neon lamps (Asmetec, T8-ASR-G10, gold, 520 nm).
Irradiations were carried out employing either a custom built LED setup consisting of three 3 W
LEDs (Avonec Online Handel, λmax = 410 nm) at a distance of 30 mm or a custom built photo
reactor equipped with a compact low pressure fluorescent lamp (Cleo PL-L, Philips
Deutschland GmbH, λmax = 355 nm) at a distance of 50 mm.
The emission spectra of the irradiation setups were recorded with a UV sensor (Opsytec Dr.
Gröbel GmbH; Ettlingen, Germany).
5
3 Experimental Procedures
3.1 Synthetic Protocols
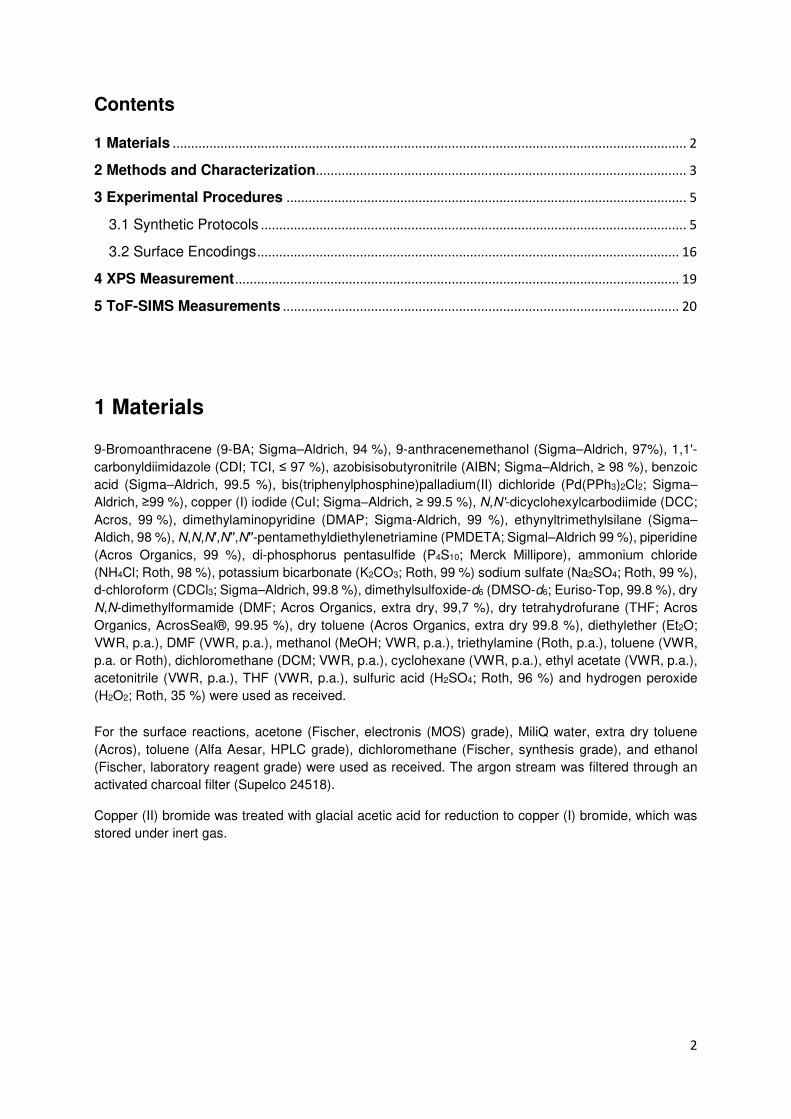
Synthesis of (anthracen-9-ylethynyl)trimethylsilane (1)
In a 50 mL flame-dried Schlenk tube equipped with a stirring bar, 9-bromoanthracene (9-BA,
500 mg, 1.95 mmol, 1 eq), CuI (43.4 mg, 0.23 mmol, 0.11 eq), Pd(PPh3)2Cl2 (140 mg, 0.2
mmol, 0.1 eq), and ethynyltrimethylsilane (750 µL, 517 mg, 5.27 mmol, 2.7 eq) were dissolved
in piperidine (1.5 mL) and dry TEA (15 mL). The reaction mixture was stirred at 110 °C
overnight and subsequently extracted with 50 mL sat. NH4Cl solution. The aqueous phase was
extracted with 30 mL cyclohexane three times. The combined organic phases were dried over
Na2SO4 and concentrated under vacuum. The raw product was purified by column
chromatography (silica gel, cyclohexane + 0.5 vol% toluene, Rf = 0.5) to yield (anthracen-9-
ylethynyl)trimethylsilane (1) (531 mg, 1.93 mmol, 99 %).
1H NMR (400 MHz, CDCl3) δ / ppm = 8.56 (dq, J = 8.8, 1.1 Hz, 2H), 8.42 (s, 1H), 8.04–7.96
(m, 2H), 7.59 (ddd, J = 8.8, 6.6, 1.3 Hz, 2H), 7.50 (ddd, J = 8.0, 6.6, 1.2 Hz, 2H), 0.43 (s,
9H).
10 8 6 4 2 0
CDCl3f e d c b
a
δ / ppm
a
fd
bc e
Si
Figure S1. 1H NMR spectrum of 2-anthracen-9-ylethynyl(trimethyl)silane.
6
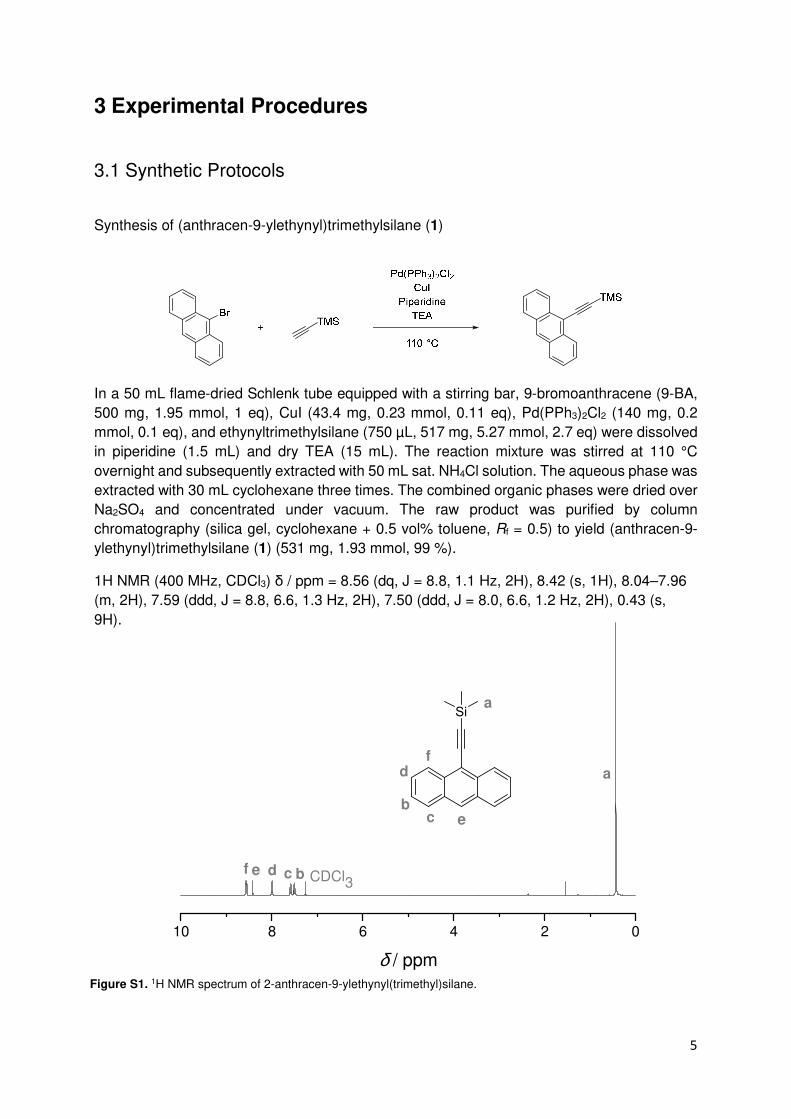
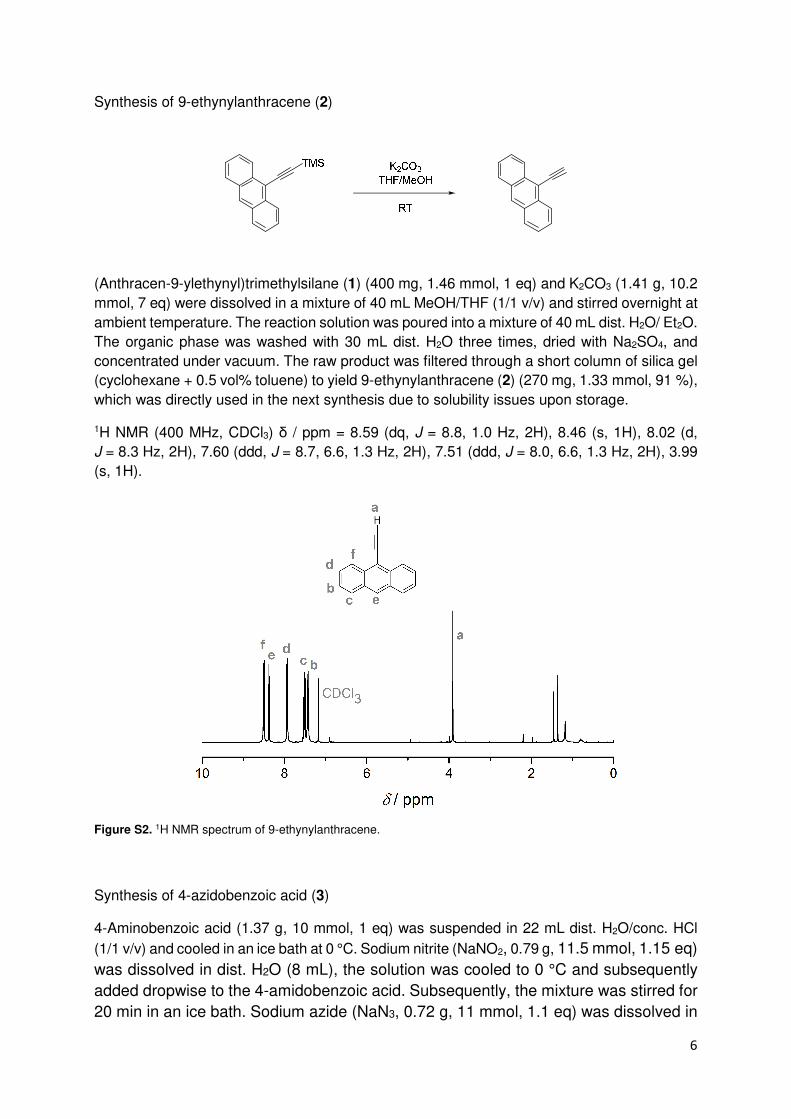
Figure S2. 1H NMR spectrum of 9-ethynylanthracene.
Synthesis of 9-ethynylanthracene (2)
(Anthracen-9-ylethynyl)trimethylsilane (1) (400 mg, 1.46 mmol, 1 eq) and K2CO3 (1.41 g, 10.2
mmol, 7 eq) were dissolved in a mixture of 40 mL MeOH/THF (1/1 v/v) and stirred overnight at
ambient temperature. The reaction solution was poured into a mixture of 40 mL dist. H2O/ Et2O.
The organic phase was washed with 30 mL dist. H2O three times, dried with Na2SO4, and
concentrated under vacuum. The raw product was filtered through a short column of silica gel
(cyclohexane + 0.5 vol% toluene) to yield 9-ethynylanthracene (2) (270 mg, 1.33 mmol, 91 %),
which was directly used in the next synthesis due to solubility issues upon storage.
1H NMR (400 MHz, CDCl3) δ / ppm = 8.59 (dq, J = 8.8, 1.0 Hz, 2H), 8.46 (s, 1H), 8.02 (d,
J = 8.3 Hz, 2H), 7.60 (ddd, J = 8.7, 6.6, 1.3 Hz, 2H), 7.51 (ddd, J = 8.0, 6.6, 1.3 Hz, 2H), 3.99
(s, 1H).
Synthesis of 4-azidobenzoic acid (3)
4-Aminobenzoic acid (1.37 g, 10 mmol, 1 eq) was suspended in 22 mL dist. H2O/conc. HCl
(1/1 v/v) and cooled in an ice bath at 0 °C. Sodium nitrite (NaNO2, 0.79 g, 11.5 mmol, 1.15 eq)
was dissolved in dist. H2O (8 mL), the solution was cooled to 0 °C and subsequently
added dropwise to the 4-amidobenzoic acid. Subsequently, the mixture was stirred for
20 min in an ice bath. Sodium azide (NaN3, 0.72 g, 11 mmol, 1.1 eq) was dissolved in
7
dist. H2O (8 mL) and also cooled to 0 °C. The solution was added dropwise to the
cooled reaction mixture, which was then stirred for another hour. The white precipitate
was filtered off, subsequently washed with ice cooled dist. H2O, and dried under
vacuum to yield 4-azidobenzoic acid (3) (1.40 g, 8.6 mmol, 86 %)
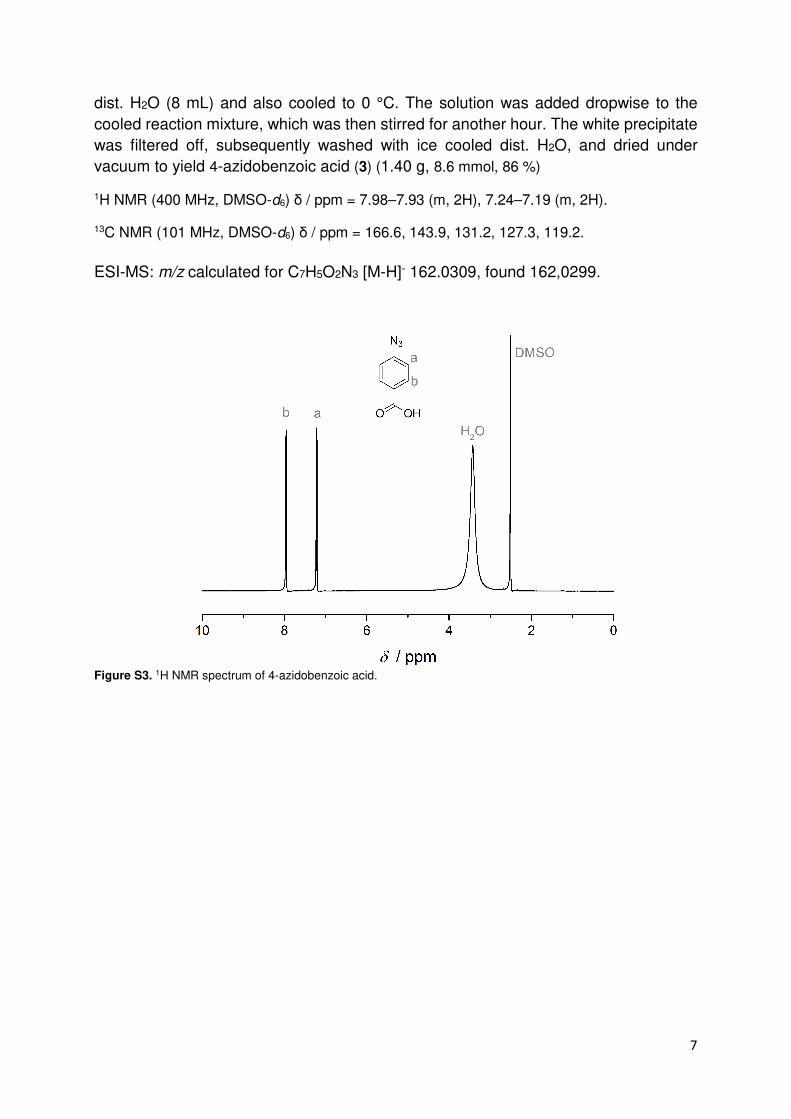
1H NMR (400 MHz, DMSO-d6) δ / ppm = 7.98–7.93 (m, 2H), 7.24–7.19 (m, 2H).
13C NMR (101 MHz, DMSO-d6) δ / ppm = 166.6, 143.9, 131.2, 127.3, 119.2.
ESI-MS: m/z calculated for C7H5O2N3 [M-H]- 162.0309, found 162,0299.
Figure S3. 1H NMR spectrum of 4-azidobenzoic acid.
8
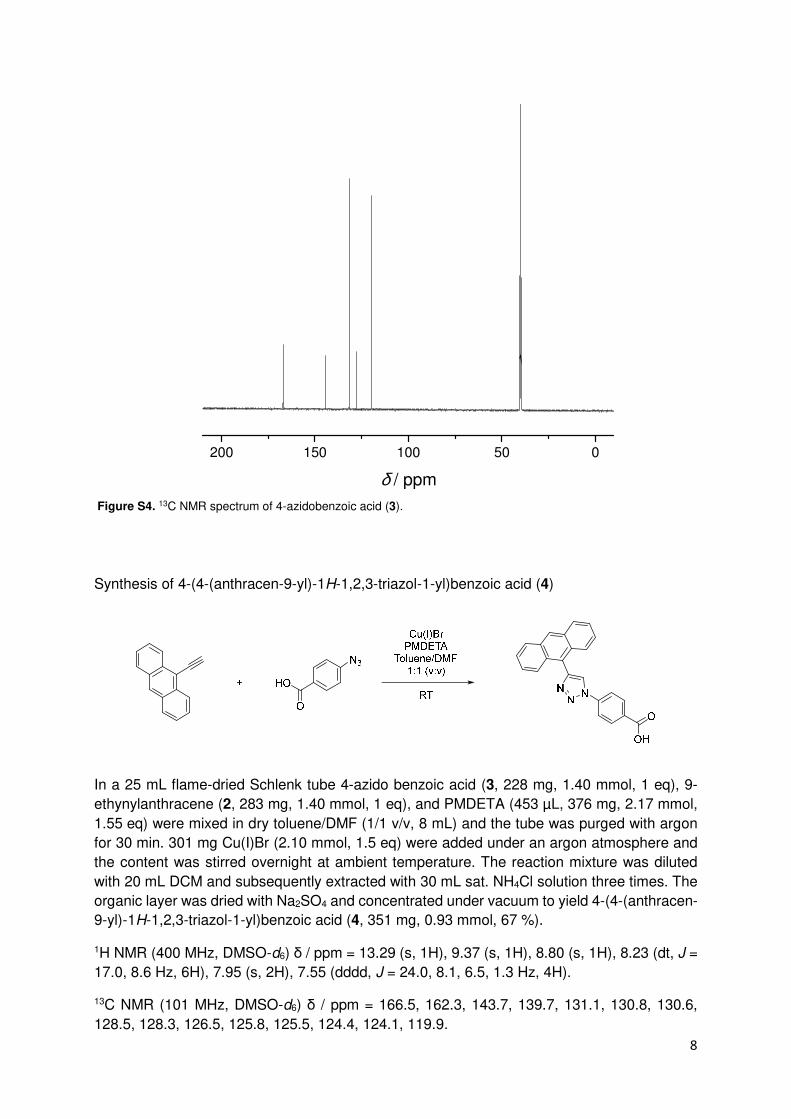
Synthesis of 4-(4-(anthracen-9-yl)-1H-1,2,3-triazol-1-yl)benzoic acid (4)
In a 25 mL flame-dried Schlenk tube 4-azido benzoic acid (3, 228 mg, 1.40 mmol, 1 eq), 9-
ethynylanthracene (2, 283 mg, 1.40 mmol, 1 eq), and PMDETA (453 µL, 376 mg, 2.17 mmol,
1.55 eq) were mixed in dry toluene/DMF (1/1 v/v, 8 mL) and the tube was purged with argon
for 30 min. 301 mg Cu(I)Br (2.10 mmol, 1.5 eq) were added under an argon atmosphere and
the content was stirred overnight at ambient temperature. The reaction mixture was diluted
with 20 mL DCM and subsequently extracted with 30 mL sat. NH4Cl solution three times. The
organic layer was dried with Na2SO4 and concentrated under vacuum to yield 4-(4-(anthracen-
9-yl)-1H-1,2,3-triazol-1-yl)benzoic acid (4, 351 mg, 0.93 mmol, 67 %).
1H NMR (400 MHz, DMSO-d6) δ / ppm = 13.29 (s, 1H), 9.37 (s, 1H), 8.80 (s, 1H), 8.23 (dt, J =
17.0, 8.6 Hz, 6H), 7.95 (s, 2H), 7.55 (dddd, J = 24.0, 8.1, 6.5, 1.3 Hz, 4H).
13C NMR (101 MHz, DMSO-d6) δ / ppm = 166.5, 162.3, 143.7, 139.7, 131.1, 130.8, 130.6,
128.5, 128.3, 126.5, 125.8, 125.5, 124.4, 124.1, 119.9.
200 150 100 50 0
δ / ppm
Figure S4. 13C NMR spectrum of 4-azidobenzoic acid (3).

9
ESI-MS: m/z calculated for C23H15O2N3 [M-H]– 364.1092, found 364.1097.
Figure S5. 1H NMR spectrum of 4-(4-(anthracen-9-yl)-1H-1,2,3-triazol-1-yl)benzoic acid (4).
200 150 100 50 0
δ / ppm
FigureS6. 13C NMR spectrum of 4-(4-(anthracen-9-yl)-1H-1,2,3-triazol-1-yl)benzoic acid (4).

10
Synthesis of 4-(4-(anthracen-9-yl)-1H-1,2,3-triazol-1-yl)-N-(3-(triethoxysilyl)propyl)benzamide
(5)
In a flame-dried 25 mL Schlenk tube 4-(4-(anthracen-9-yl)-1H-1,2,3-triazol-1-yl)benzoic acid
(4) (180 mg, 0.47 mmol, 1 eq) and CDI (76.9 mg, 0.47 mmol, 1 eq) were dissolved in dry THF
(5 mL) and stirred at ambient temperature for 3 h. Subsequently, APTES (110 µL, 105 mg,
0.47 mmol, 1 eq) was added and the reaction mixture was stirred overnight at ambient
temperature. The crude reaction mixture was concentrated under vacuum and purified by
column chromatography (silica gel, cyclohexane/ ethyl acetate 3:4, Rf = 0.58) to yield 4-(4-
(anthracen-9-yl)-1H-1,2,3-triazol-1-yl)-N-(3-(triethoxysilyl)propyl)benzamide (202 mg, 0.36
mmol, 76 %).
1H NMR (400 MHz, DMSO-d6) δ / ppm = 9.34 (s, 1H), 8.80 (s, 1H), 8.67 (t, J = 5.6 Hz, 1H),
8.24–8.18 (m, 4H), 8.16–8.11 (m, 2H), 7.87 (dq, J = 8.7, 1.0 Hz, 2H), 7.61–7.49 (m, 4H), 3.77
(q, J = 7.0 Hz, 6H), 3.31–3.26 (m, 2H), 1.68–1.58 (m, 2H), 1.16 (t, J = 7.0 Hz, 9H), 0.67–0.60
(m, 2H).
13C NMR (101 MHz, DMSO-d6) δ / ppm = 164.9, 143.6, 138.4, 134.5, 130.83, 130.6, 128.9,
128.5, 128.3, 126.5, 125.8, 125.5, 124.3, 124.2, 119.7, 57.7, 42.2, 22.7, 18.2, 7.5.
ESI-MS m/z calculated for C32H36O4N4Si [M+Cl]– 603.2200, found 603.2204.

11
Figure S7. 1H NMR spectrum of 4-(4-(anthracen-9-yl)-1H-1,2,3-triazol-1-yl)-N-(3-(triethoxysilyl)propyl)benzamide.
Figure S8. 13C NMR spectrum of 4-(4-(anthracen-9-yl)-1H-1,2,3-triazol-1-yl)-N-(3-(triethoxysilyl)propyl)benzamide (5).
200 150 100 50 0
δ / ppm

12
Synthesis of anthracen-9-ylmethyl benzodithioate (6)3
Benzoic acid (1.22 g, 10 mmol, 1 eq), 9-anthracene methanol (2.08 g, 10 mmol, 1 eq), P4S10
(2.22 g, 5 mmol, 0.5 eq) were dissolved in toluene (40 mL) in a 100 mL three neck round flask.
The solution was stirred at ambient temperature under an argon atmosphere for 1 h and
subsequently heated to 110 °C for 24 h. The reaction solution was filtered after cooling and
the filtrate was washed with dist. H2O. The organic layer was dried with Na2SO4. The solvent
was then removed by evaporation and the crude product was purified by column
chromatography (silica gel, petroleum ether/benzene 10:1, Rf = 0.39) to yield anthracen-9-
ylmethyl benzodithioate (6) (2.86 g, 8.3 mmol, 83 %) as red crystals.
1H NMR (400 MHz, CDCl3) δ / ppm = 7.2–8.4 (m, 14H), 4.47 (s, 2H).
Synthesis of anthracene functionalized polystyrene (P1)
In a Schlenk tube, anthracen-9-ylmethyl benzodithioate (6) (40 mg, 0.116 mmol) and AIBN
(3.8 mg, 0.023 mmol) were dissolved in styrene (5.3 mL, 4.82 g, 46.3 mmol). The solution was
deoxygenated by percolating with nitrogen for 10 min. The polymerization reaction was
performed at 60 °C under nitrogen atmosphere. After 24 h, the reaction was quenched by
cooling in an ice bath and the solution was precipitated in methanol. The polymer was obtained
by filtration and dried under vacuum. Conversion of styrene was determined gravimetrically
and the molar mass was determined by GPC (PS calibration).
Mn,GPC = 8400 g mol-1, Ɖ = 1.03
Conversion 12%
10 9 8 7 6 5 4 3 2 1 0
CDCl3
S
Sc
c
ba
a+b
δ / ppm
Figure S9. 1H NMR spectrum of anthracen-9-ylmethyl benzodithioate.

13
10 9 8 7 6 5 4 3 2 1 0
δ / ppm
Figure S10. GPC chromatogram of anthracene functionalized polystyrene (P1).
Synthesis of 9-anthrylmethyl 2-bromo-2-methyl propanoate (7)4
9-Anthracene methanol (1 g, 4.8 mmol, 1 eq) and triethylamine (0.98 mL, 0.72 g, 7 mmol,
1.45 eq) were dissolved in 20 mL dry THF. The solution was cooled in an ice bath and a
solution of 0.87 mL 2-bromoisobutyryl bromide (1.62 g, 7 mmol, 1.45 eq) in 10 mL of dry THF
was added dropwise under nitrogen atmosphere. The ice bath was removed and the reaction
Figure S11. 1H NMR spectrum of anthracene functionalized polystyrene (P1).
14
was stirred at room temperature overnight. The precipitate was filtered off and the solvent was
evaporated. The raw product was dissolved in dichloromethane, subsequently washed with
NaHCO3 solution, and dried over Na2SO4. The solvent was removed under reduced pressure
and the yellow oil was recrystallized from hexane to yield 9-anthrylmethyl 2-bromo-2-methyl
propanoate (1.49 g, 4.18 mmol, 87%) as light yellow crystals.
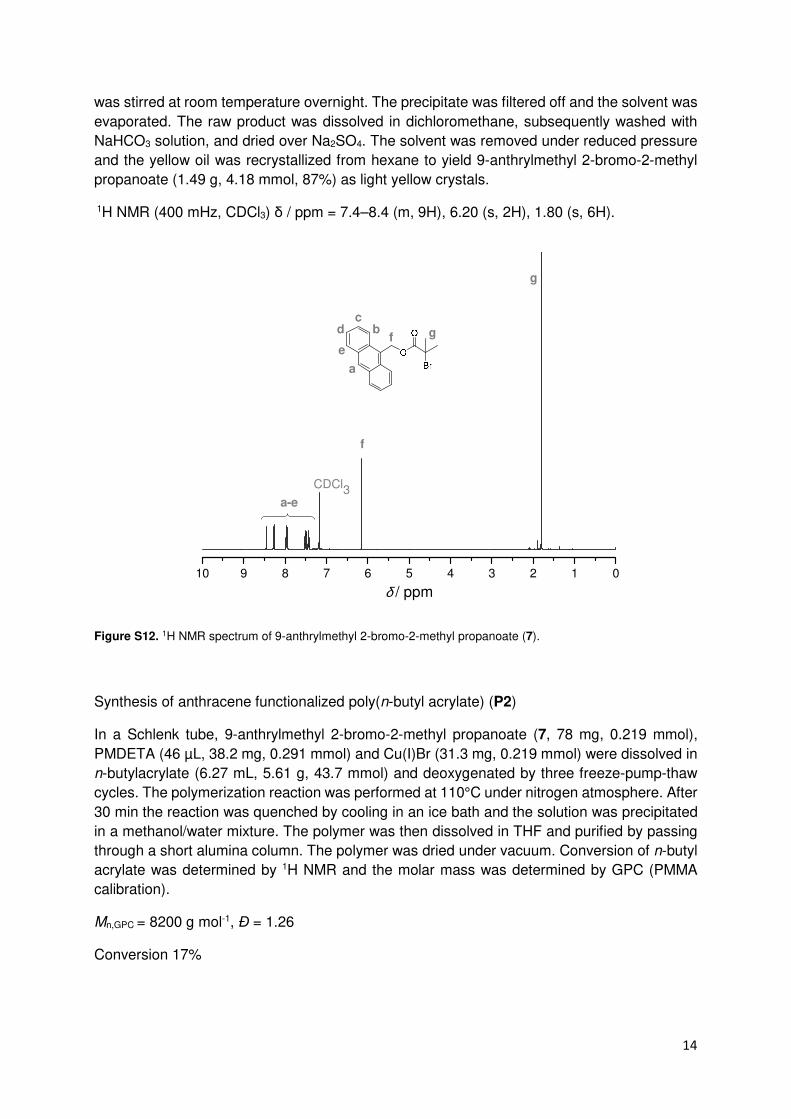
1H NMR (400 mHz, CDCl3) δ / ppm = 7.4–8.4 (m, 9H), 6.20 (s, 2H), 1.80 (s, 6H).
Synthesis of anthracene functionalized poly(n-butyl acrylate) (P2)
In a Schlenk tube, 9-anthrylmethyl 2-bromo-2-methyl propanoate (7, 78 mg, 0.219 mmol),
PMDETA (46 µL, 38.2 mg, 0.291 mmol) and Cu(I)Br (31.3 mg, 0.219 mmol) were dissolved in
n-butylacrylate (6.27 mL, 5.61 g, 43.7 mmol) and deoxygenated by three freeze-pump-thaw
cycles. The polymerization reaction was performed at 110°C under nitrogen atmosphere. After
30 min the reaction was quenched by cooling in an ice bath and the solution was precipitated
in a methanol/water mixture. The polymer was then dissolved in THF and purified by passing
through a short alumina column. The polymer was dried under vacuum. Conversion of n-butyl
acrylate was determined by 1H NMR and the molar mass was determined by GPC (PMMA
calibration).
Mn,GPC = 8200 g mol-1, Ɖ = 1.26
Conversion 17%
10 9 8 7 6 5 4 3 2 1 0
CDCl3
g
gf
f
e
dc
b
a
a-e
δ / ppm
Figure S12. 1H NMR spectrum of 9-anthrylmethyl 2-bromo-2-methyl propanoate (7).

15
24 26 28 30 32 34 36
Retention time / min
P2: Mn = 8200 g mol
-1 Ð = 1.26
10 9 8 7 6 5 4 3 2 1 0
δ / ppm
Figure S13. GPC chromatogram of anthracene functionalized poly(n-butyl acrylate) (P2).
Figure S14. 1H NMR spectrum of anthracene functionalized poly(n-butylacrylate) (P2).

16
3.2 Surface Encodings
Silanization Protocol
Silicon wafers were separately placed in 5 mL vials, 3 mL Piranha solution (H2O2/H2SO4 1/2,
v/v) were added and the solution was heated at 80 °C for approx. 60 min. The wafers were
rinsed with an excess of water, acetone and DCM and dried under a stream of argon. The
activated/cleaned wafers were placed into headspace vials (Pyrex, diameter 20 mm), which
were crimped airtight using styrene/butadiene rubber seals with PTFE inner liner. Anthracene
silane (5) was dissolved in extra-dry toluene (2 mg mL-1) and percolated with argon for 5 min.
To each substrate, 2 mL of the silane solution were added. The samples were heated in an
oven at 50 °C overnight and were subsequently rinsed with an excess of toluene, DCM,
acetone, MilliQ water, acetone and DCM and dried under an argon stream.
Surface patterning (Writing step)
For light induced surface patterning, the silanized silicon wafers were placed in a custom made
surface holder and covered with a dotted shadow mask (Figure S1a). The sample holder was
placed in a headspace vial (Pyrex, diameter 20 mm) and a solution of the respective
anthracene functionalized molecule or polymer in dry MeCN or DCM (1 mg per mL for small
molecules, 2 mg per mL for polymers) was added. The vial was crimped airtight using
styrene/butadiene rubber seals with PTFE inner liner. The solution war percolated with argon
for 5 min and subsequently irradiated at 410 nm with a custom made LED setup (Figure S1b,
refer to Scheme S12 for the emission spectrum) for 4 h. Subsequently, the silicon wafer was
removed from the sample holder and successively rinsed with MeCN, acetone, toluene and
DCM and dried under an argon stream.
Figure S15. a) Picture of the employed sample holder and dotted shadow mask; b) Picture of the employed custom built LED setup.

17
Surface erasing (removal of the pattern)
For light-induced erasing, the patterned silicon wafer was placed in a headspace vial (Pyrex,
diameter 20 mm) and 5 mL of pure, dry MeCN or DCM was added. The vial was crimped
airtight using styrene/butadiene rubber seals with PTFE inner liner and the solvent was
percolated with argon for 5 min. Subsequently, the sample was irradiated in a custom built
photoreactor (Figure S2) employing a Philips PL-L lamp (emission spectrum see Scheme S13)
for 24 h. After 24 h irradiation time, the MeCN was exchanged for fresh solvent and the sample
was irradiated for another 24 h to complete the erasing process.
Scheme S16. Emission spectrum and intensity of the employed LED setup.

18
Figure S17. Picture of the employed custom built photoreactor equipped with the Philips PL-L lamp.
Figure S18. Emission spectrum and intensity of the employed Philipps PL-L lamp.
19
4 XPS Measurement
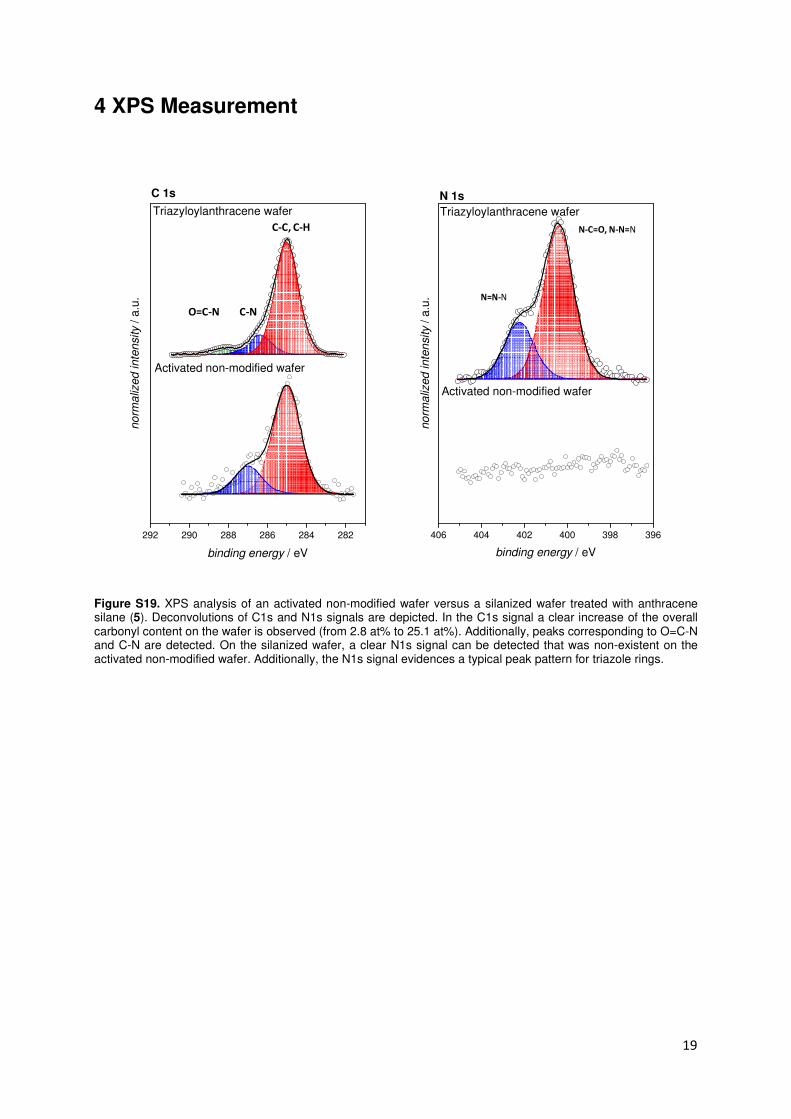
Figure S19. XPS analysis of an activated non-modified wafer versus a silanized wafer treated with anthracene silane (5). Deconvolutions of C1s and N1s signals are depicted. In the C1s signal a clear increase of the overall carbonyl content on the wafer is observed (from 2.8 at% to 25.1 at%). Additionally, peaks corresponding to O=C-N and C-N are detected. On the silanized wafer, a clear N1s signal can be detected that was non-existent on the activated non-modified wafer. Additionally, the N1s signal evidences a typical peak pattern for triazole rings.
292 290 288 286 284 282
binding energy / eV
no
rma
lized
inte
nsity / a
.u.
C-C, C-H
C-NO=C-N
Triazyloylanthracene wafer
C 1s
Activated non-modified wafer
406 404 402 400 398 396
N-C=O, N-N=N
N=N-N
no
rma
lized
inte
nsity / a
.u.
binding energy / eV
N 1s
Triazyloylanthracene wafer
Activated non-modified wafer

20
Figure S20. Single fragment ToF-SIMS ion maps of bromine ions for the writing and erasing of 9-BA patterns obtained after irradiation of a silicon wafer: a) + b) visible light (410 nm) for 4 h in the presence of 9-BA (1 mg/mL in DCM); c) + d) mild UV light (360 nm, 48 h, DCM); e) + f) same as a) + b); g) + h) same as c) + d).
5 ToF-SIMS Measurements

21
The cross reactivity of the electron rich anthracene was tested with triazyloylanthracene end
capped poly(ethylene glycol) (PEG) and irradiating the triazyloylanthracene surface in the
presence of the PEG derivative at 410 nm for 4 h through a doted shadow mask (2 mg/mL in
DCM, see Figure S21). The ToF-SIMS analysis revealed only a very weak, barely visible dot
pattern consisting of PEG characteristic fragments. It is therefore assumed that a self-
dimerization of the triazyloylanthracenes on the surface is negligible due to the unfavorable
electronic structures of the reaction partners.
Figure S21. Reaction sequence and ToF-SIMS analysis of the photoreaction between a triazyloylanthracene surface and a triazyloylanthracene end capped PEG chain at 410 nm.

22
Figure S22. Detailed ToF-SIMS ion maps for the writing and erasing of two polymer patterns obtained after irradiation of a silicon wafer: a) + b) visible light (410 nm) for 4 h in the presence of P1 (2 mg/mL in DCM); c) + d)mild UV light (360 nm, 48 h, MeCN); e) + f) visible light (410 nm) for 4 h in the presence of anthracene P2 (2 mg/mL in MeCN); g) + h) mild UV light (360 nm, 48 h, MeCN).

23
References
1. K. L. Parry, A. G. Shard, R. D. Short, R. G. White, J. D. Whittle and A. Wright, Surf.Interface
Anal., 2006, 38, 1497–1504.
2. J. H. Scofield, J. Electron Spectros. Relat. Phenomena, 1976, 8, 129 – 137.
3. N. Zhou, L. Lu, X. Zhu, X. Yang, X. Wang, J. Zhu and D. Zhou, Polymer Bulletin, 2006, 57, 491-
498.
4. H. Zhang, B.Klumperman and R. v. d. Linde, Macromolecules, 2002, 35, 2261-2267.
Figure S23. Single fragment ToF-SIMS ion maps obtained after dual functionalization of a silicon wafer with 9-BA(no mask, 410 nm, 4 h), a) + b) erasing a dot pattern (360 nm, 48 h) and c) + d) back-filling the dots with P1 (410 nm, 4 h).