High grade glioma + brainstem glioma Highly agressive tumours

OPEN
Light-controlled inhibition of malignant gliomaby opsin gene transfer
F Yang1,4, J Tu1,4, J-Q Pan1,4, H-L Luo1, Y-H Liu1, J Wan1, J Zhang1, P-F Wei1, T Jiang2, Y-H Chen3 and L-P Wang*,1
Glioblastomas are aggressive cancers with low survival rates and poor prognosis because of their highly proliferative andinvasive capacity. In the current study, we describe a new optogenetic strategy that selectively inhibits glioma cells throughlight-controlled membrane depolarization and cell death. Transfer of the engineered opsin ChETA (engineeredChannelrhodopsin-2 variant) gene into primary human glioma cells or cell lines, but not normal astrocytes, unexpectedlydecreased cell proliferation and increased mitochondria-dependent apoptosis, upon light stimulation. These optogenetic effectswere mediated by membrane depolarization-induced reductions in cyclin expression and mitochondrial transmembranepotential. Importantly, the ChETA gene transfer and light illumination in mice significantly inhibited subcutaneous andintracranial glioma growth and increased the survival of the animals bearing the glioma. These results uncover an unexpectedeffect of opsin ion channels on glioma cells and offer the opportunity for the first time to treat glioma using a light-controllableoptogenetic approach.Cell Death and Disease (2013) 4, e893; doi:10.1038/cddis.2013.425; published online 31 October 2013Subject Category: Cancer
Primary central nervous system tumors account for B2.4% ofall cancer deaths in the United States,1 among which humanmalignant glioma (MG) is one of the most common cancertypes in adults.2 The high morbidity and mortality of MG arepartially because of its high proliferative and invasivecapacity.3 Understanding the regulation of the pathologicalactivities of MG is important for eradicating it.4
Regulating polarization status of cell membrane and ionchannels could exert effects on the activities of MG, includingproliferation, migration, and metabolism.5–7 Blockage of theClC3 channel, an anion channel for chloride, could inhibit DNAcondensation and glioma cell division;8 Pharmacologicalinhibition of the Sodium-Potassium-Chloride Co-transportercould inhibit glioma cell division and decrease the gliomainvasive capacity.8,9 Some evidence also suggests that Kþ
channels and membrane depolarization have an importantrole in regulating the death, growth, and migration of MGcells.10–13 However, how MG cell ion transport and membranedepolarization influence signaling pathways controlling MGcell growth, proliferation, and death is unclear.
Optogenetic techniques can be used to achieve gain- orloss-of-function in a cell- or tissue-specific manner.14 Byexpressing channelrhodopsins15 or other opsin genes in
individual cell types, the transport of ions and the depolariza-tion of the cell membrane could be precisely controlled on amillisecond timescale by pulses of light illumination.16
Optogenetics has been widely used to interrogate neuralcircuits,17–25 regulate physiological activities including bloodpressure and breathing,26–28 control intracellular signaling,29
and regulate the physiological function of astrocytes toactivate neurons and trigger robust respiratory responses.30
On the basis of the important roles of ion transport anddepolarization in regulating MG properties, we hypothesizedthat optogenetics could be used to modulate membranedepolarization and affect the activities of human MG. Toachieve precise and versatile control of the membranedepolarization of glioma, we expressed the engineered opsingene ChETA (engineered Channelrhodopsin-2 variant)31 inhuman glioma cells. We found that light stimulation couldregulate their membrane depolarization and decrease theirviability, and the inhibition of glioma cell proliferation andinduction of apoptosis could be precisely controlled by visiblelight in a tissue-specific manner. Our study not onlydemonstrates for the first time how light-controlled mem-brane depolarization influences human MG propertiesincluding proliferation and death but also provides a new
1Shenzhen Key Lab of Neuropsychiatric Modulation, Research Centre for Neural Engineering, Shenzhen Institutes of Advanced Technology, Chinese Academy ofSciences, Xili Nanshan, Shenzhen, China; 2Department of Neurosurgery, Beijing Tiantan Hospital, Capital Medical University, Beijing, China and 3Department ofPathology and Laboratory Medicine, School of Medicine, University of Pennsylvania, Philadelphia, PA, USA*Corresponding author: L-P Wang, Research Centre for Neural Engineering, Key Laboratory for Health Informatics at Shenzhen Institutes of Advanced Technology,Chinese Academy of Sciences, Xili Nanshan, 1068 Xueyuan Boulevard University Town of Shenzhen, Shenzhen 518055, China. Tel: +86 755 86392218;Fax: +86 755 86392233; E-mail: [email protected] authors contributed equally to this work.
Received 13.7.13; revised 19.9.13; accepted 20.9.13; Edited by A Stephanou
Keywords: gene therapy; cancer; channelrhodopsin; optogenetic; gliomaAbbreviations: BSA, bovine serum albumin; ChETA, engineered Channelrhodopsin-2 variant; DMEM, Dulbecco’s Modified Eagle Medium; eYFP, enhanced yellowfluorescence protein; EdU, 5-Ethynyl-2-deoxyuridine; GFAP, glial fibrillary acidic protein; HE, hematoxylin and eosin; HEPES, 4-(2-hydroxyethyl)-1-piperazineethanesulfonic acid; Iba1, ionized calcium-binding adaptor molecule 1; LED, light-emitting diode; MG, malignant glioma; MTT, 3-(4,5-dimethylthiazol-2-yl)-2,5-diphenyltetrazolium bromide; PBS, phosphate buffered saline; PI, propidium iodide; PFA, paraformaldehyde; TRPC, transient receptor potential canonical channel;TUNEL, deoxynucleotidyl transferase (TdT)-mediated dUTP nick end labeling
Citation: Cell Death and Disease (2013) 4, e893; doi:10.1038/cddis.2013.425& 2013 Macmillan Publishers Limited All rights reserved 2041-4889/13
www.nature.com/cddis

approach to inhibit the growth of human glioma throughcontrollable visible light.
Results
The opsin ChETA expression and light stimulationselectively reduced the viability of human glioma cells.To determine whether the viability of cultured neurons,astrocytes, and human glioma cells could be influenced byoptogenetic manipulation (Figures 1a–e), we used a lenti-virus carrying the CMV-ChETA-eYFP construct (Figure 1a)to transfect the rat brain-derived normal neurons, astrocytes,and human U87 and H4 glioma cell lines. Forty-eight hoursafter the transfection, most of the neurons, astrocytes, andU87/H4 cells were successfully labeled, expressing thegreen fluorescence (Figure 1b). We constructed a bluelight-emitting diode (LED) (Figure 1c) and illuminated thetransfected cells with it for 1 h (Figure 1d). Twenty-four hoursafter the light stimulation, cell viability was evaluated usingthe 3-(4,5-dimethylthiazol-2-yl)-2,5-diphenyltetrazolium bro-mide (MTT) assay. As expected, ChETAþ light treatment didnot affect the viability of normal neurons and astrocytes(Figure 1e), as well as endothelial cells and microglia(Supplementary Figures S2A and B). By contrast, the viabilityof U87 and H4 glioma cells treated with ChETAþ light wasreduced to 56.3±5.9% and 50.4±4.6%, respectively –significantly lower than that of the control groups (Po0.01)(Figure 1e). The light-induced decrease in cell viability wasalso observed in U251 and Ai72 glioma cells (SupplementaryFigure S2C), but not in other cancer cell lines (MDA231,Hela, HepaG2) (Supplementary Figure S2D), suggesting thatlight stimulation selectively decreased the viability of ChETA-expressing glioma cells.
To selectively target glioma cells, we constructed alentivirus carrying the c-fos-ChETA-eYFP construct(Figure 1a), based on the finding that tumor, but not normalcells, expresses high levels of the c-fos.31,32 Forty-eight hoursafter the transfection, 498% of the U87 and H4 cells showedthe green fluorescence, which concentrated on the plasmamembrane (Figure 1f, Supplementary Figure S2E), whereasno such fluorescence was observed in the astrocytes(Figure 1f). We then used patch-clamp techniques toinvestigate the function of ChETA in U87 glioma cells(Figures 1g–l, Supplementary Figure S1). StimulatingChETA-expressing glioma cells with blue light (450–490 nm)for 500 ms induced depolarizing currents (Figure 1h) with apeak amplitude at 420.2±103.7 pA and a steady-stateamplitude at 394.3±98.8 pA (mean±S.E.M., Figure 1i;n¼ 12). We used single light pulse durations of 1, 21, 51,101, and 201 ms to stimulate the glioma cells (Figure 1j);51 ms of light illumination was sufficient to induce adepolarizing peak and a steady state (Figure 1j). Paired lightstimuli (50 ms of illumination) with intervals of 25, 50, 75, 100,and 200 ms were also used to stimulate the glioma cells(Figure 1k); paired stimuli with a time interval of 50 ms orabove could allow the full recovery from the first light-inducedspike (Figure 1k). We then continuously illuminated theChETA-expressing glioma cells for 1 h (50 ms of 10-Hzillumination), after which, ChETA spike trains could besuccessfully induced (Figure 1l). Taken together, the
electrophysiological recordings showed that the light stimula-tion protocol we used (10 Hz and 50-ms stimulus intervals)was sufficient and stable to induce the membrane depolariza-tion of the ChETA-expressing human glioma cells.
To exclude nonspecific effects of ChETA expression orlight stimulation, we added control, light only, eYFPþ light(using cfos-eYFP lentiviral vector), and ChETA groups(Figures 2a–c). Twenty-four hours after the light stimulationof the glioma cells, we observed a significantly reducedcrystal violet staining of U87 cells in the ChETAþ light groupcompared with the control, light, eYFPþ light, and ChETAgroups (Figure 2a, Supplementary Figure S2F). MTT assayshowed that U87 cell viability in the ChETAþ light group was46.8±5.8%, significantly lower than that in both the controlgroup (Po0.001) and the ChETA group (Po0.01)(Figure 2b). H4 cell viability in the ChETAþ light group was29.7±3.7%, significantly lower than that in both the controlgroup (Po0.001) and the ChETA group (Po0.05)(Figure 2c).
We next investigated the effect of our optogeneticprocedure on primary glioma cells of patients. The gliomacells were isolated from four patients with different patholo-gical grading (Figure 2d). A high proportion of the glioma cellsisolated from patients 1, 2, and 3 expressed GFAP and nestin,confirming the astroglial origin of the primary cultured cells(Figure 2e). Five days after transfection, 470% percent of theglioma cells (isolated from patients 1, 2, and 3) showed thegreen fluorescence (Figure 2f), whereas no green fluores-cence was observed in cells isolated from patient 5 who hadno glioma (Figure 2f). Electrophysiological recordings showedthat stimulating ChETA-expressing primary glioma cells withblue light for 500 ms induced depolarizing currents (Figures 2gand h); spike trains were also successfully induced by lightstimulations with 10 Hz at 50-ms stimulus intervals (Figure 2i).Twenty-four hours after the light stimulation, MTT assayshowed that the viability of cells from patients 1 to 4of the ChETAþ light group was 46.6±4.9%,57.9±3.2%,52.7±3.2%, and 54.6±3.0%, respectively, significantly lowerthan those of the control group (Po0.001), light group(Po0.05), and the ChETA group (Po0.05) (Figure 2j).
ChETA optogenetic treatment inhibited cell cycleprogression and proliferation of human glioma cells.We then investigated the mechanism of decreased viability ofChETA-expressing glioma cells after light stimulation. Cellcycle analysis using flow cytometry showed that the cell cycleprogression in the ChETAþ light group became disrupted:the fraction of cells in the G2/M (4n) phase decreasedcompared with control, light, and eYFPþ light groups, andthe fraction in the pre-G0 (o2n) phase increased comparedwith the other four groups (Figure 3a), suggesting decreasedglioma cell proliferation and increased cell death after thelight stimulation.
Next, we investigated whether light illumination could inhibitthe proliferation of glioma cells at 24 h after the lightstimulation using the 5-ethynyl-2-deoxyuridine (EdU) incor-poration assay (Figures 3b and c). There were less EdU-positive cells (green) in the ChETAþ light group comparedwith other groups (Figure 3b), and quantification showed thatthe percentage of EdU-positive cells in the ChETAþ light
Light-controlled inhibition of malignant gliomaF Yang et al
2
Cell Death and Disease
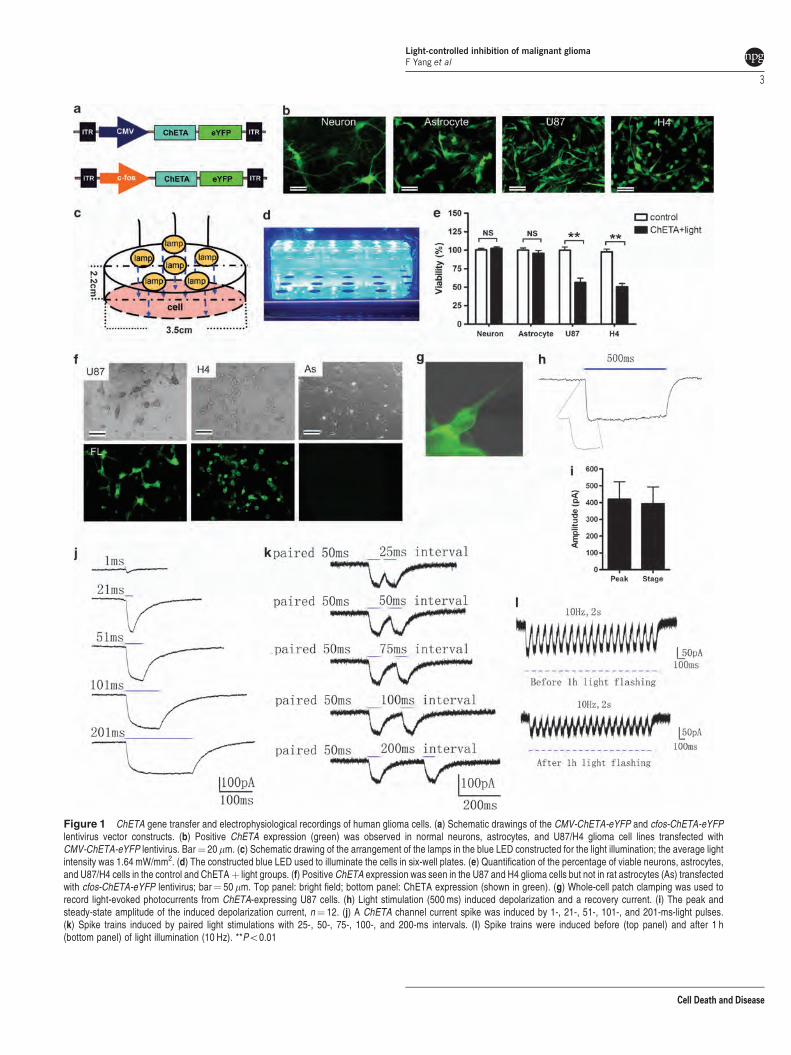
Figure 1 ChETA gene transfer and electrophysiological recordings of human glioma cells. (a) Schematic drawings of the CMV-ChETA-eYFP and cfos-ChETA-eYFPlentivirus vector constructs. (b) Positive ChETA expression (green) was observed in normal neurons, astrocytes, and U87/H4 glioma cell lines transfected withCMV-ChETA-eYFP lentivirus. Bar¼ 20 mm. (c) Schematic drawing of the arrangement of the lamps in the blue LED constructed for the light illumination; the average lightintensity was 1.64 mW/mm2. (d) The constructed blue LED used to illuminate the cells in six-well plates. (e) Quantification of the percentage of viable neurons, astrocytes,and U87/H4 cells in the control and ChETAþ light groups. (f) Positive ChETA expression was seen in the U87 and H4 glioma cells but not in rat astrocytes (As) transfectedwith cfos-ChETA-eYFP lentivirus; bar¼ 50 mm. Top panel: bright field; bottom panel: ChETA expression (shown in green). (g) Whole-cell patch clamping was used torecord light-evoked photocurrents from ChETA-expressing U87 cells. (h) Light stimulation (500 ms) induced depolarization and a recovery current. (i) The peak andsteady-state amplitude of the induced depolarization current, n¼ 12. (j) A ChETA channel current spike was induced by 1-, 21-, 51-, 101-, and 201-ms-light pulses.(k) Spike trains induced by paired light stimulations with 25-, 50-, 75-, 100-, and 200-ms intervals. (l) Spike trains were induced before (top panel) and after 1 h(bottom panel) of light illumination (10 Hz). **Po0.01
Light-controlled inhibition of malignant gliomaF Yang et al
3
Cell Death and Disease
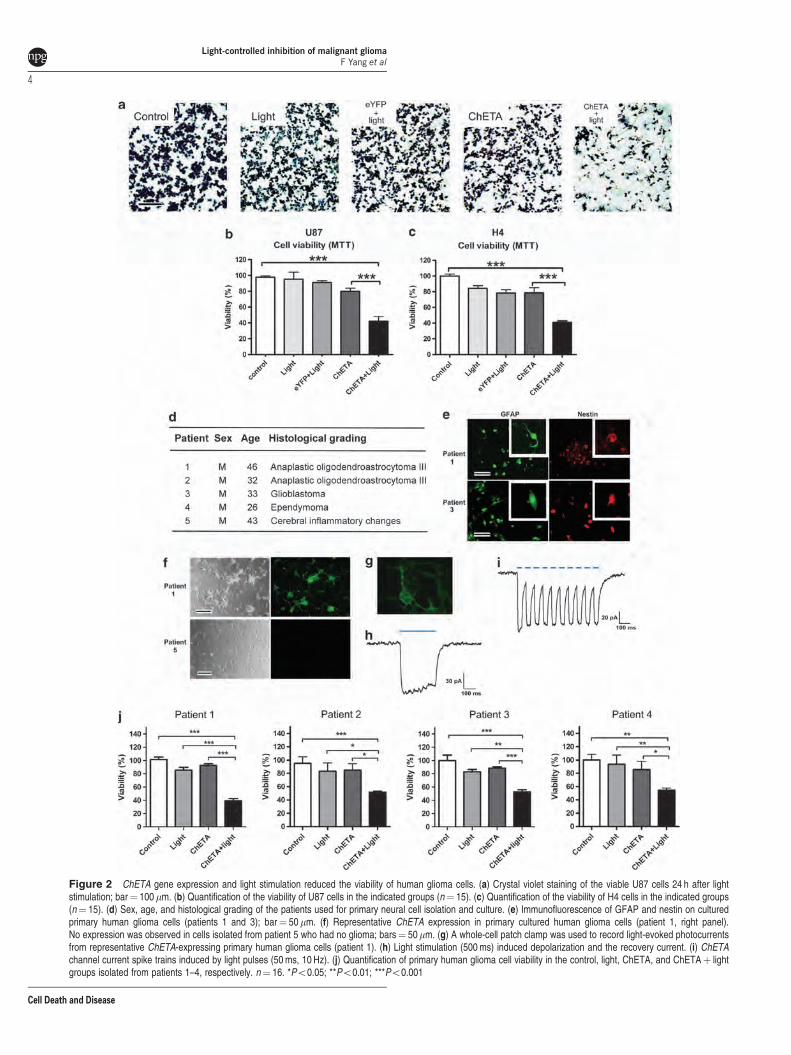
Figure 2 ChETA gene expression and light stimulation reduced the viability of human glioma cells. (a) Crystal violet staining of the viable U87 cells 24 h after lightstimulation; bar¼ 100 mm. (b) Quantification of the viability of U87 cells in the indicated groups (n¼ 15). (c) Quantification of the viability of H4 cells in the indicated groups(n¼ 15). (d) Sex, age, and histological grading of the patients used for primary neural cell isolation and culture. (e) Immunofluorescence of GFAP and nestin on culturedprimary human glioma cells (patients 1 and 3); bar¼ 50mm. (f) Representative ChETA expression in primary cultured human glioma cells (patient 1, right panel).No expression was observed in cells isolated from patient 5 who had no glioma; bars¼ 50mm. (g) A whole-cell patch clamp was used to record light-evoked photocurrentsfrom representative ChETA-expressing primary human glioma cells (patient 1). (h) Light stimulation (500 ms) induced depolarization and the recovery current. (i) ChETAchannel current spike trains induced by light pulses (50 ms, 10 Hz). (j) Quantification of primary human glioma cell viability in the control, light, ChETA, and ChETAþ lightgroups isolated from patients 1–4, respectively. n¼ 16. *Po0.05; **Po0.01; ***Po0.001
Light-controlled inhibition of malignant gliomaF Yang et al
4
Cell Death and Disease

group (8.76±1.25%) was significantly lower than that of thecontrol group (38.15±4.41%) (Figure 3c).
Western blotting was used to investigate the expression ofcyclin D1 and cyclin E in stimulated glioma cells at 24 h after thelight stimulation (Figure 3d). The expression levels of cyclin D1and cyclin E were downregulated in the ChETAþ light group,and quantification showed that the difference in expressionbetween the ChETAþ light and control groups was significantfor both cyclin D1 (Po0.01) and cyclin E (Po0.001) (Figure 3e).
Light stimulation induced mitochondria-dependentapoptosis of human glioma cells. Propidium iodide (PI)staining of glioma cells was used to confirm the glioma celldeath induced by light. There were more PI-positive cells(red) in the ChETAþ light group (Figure 4a), and quanti-fication showed that the percentage of PI-positive cellsin the ChETAþ light group was significantly higher than thatin the control (Po0.001) and ChETA (Po0.01) groups(Figure 4b).
Figure 3 Light stimulation inhibited the proliferation of human glioma cells. (a) Cell cycle analysis of U87 cells in the control, light, eYFPþ light, ChETA, and ChETAþ lightgroups 24 h after light stimulation. (b) Green-fluorescent EDU-incorporated cells were observed in the control, light, eYFPþ light, ChETA, and ChETAþ light groups at 24 hafter the light stimulation. Hoechst 33342-stained nuclei are shown in blue; bar¼ 100mm. (c) Quantification of the percentage of EdU-positive cells in the control, light,eYFPþ light, ChETA, and ChETAþ light groups, n¼ 8. (d) Western blot analysis of b-actin, cyclin D, and cyclin E protein expression in the control, light, eYFPþ light,ChETA, and ChETAþ light groups at 24 h after the light stimulation. (e) Quantification of cyclin D and cyclin E protein expression in the control, light, eYFPþ light, ChETA,and ChETAþ light groups. n¼ 3. **Po0.01; ***Po0.001
Light-controlled inhibition of malignant gliomaF Yang et al
5
Cell Death and Disease

Then, we asked whether ChETA expression and lightstimulation could promote mitochondria-dependent apoptoticsignaling in glioma cells. Firstly, terminal deoxynucleotidyl
transferase (TdT)-mediated dUTP nick end labeling (TUNEL)staining showed that there were more positive cells (red) in theChETAþ light group than those in the other groups
Figure 4 Light stimulation induced the mitochondria-dependent apoptosis of human glioma cells. (a) PI-stained U87 cells in the control, light, eYFPþ light, ChETA, andChETAþ light groups are shown in red, and Hoechst 33342-stained nuclei are shown in blue. Bar¼ 100mm. (b) Quantification of the PI-positive cells in the control, light,eYFPþ light, ChETA, and ChETAþ light groups, n¼ 5. (c) TUNEL staining of apoptotic U87 cells in the control, light, eYFPþ light, ChETA, and ChETAþ light groups(shown in red). Hoechst 33342-stained nuclei are shown in blue; bar¼ 50mm. (d) Quantification of human active Caspase 3 in the control, light, eYFPþ light, ChETA, andChETAþ light groups. n¼ 3. (e) Flow cytometric analysis of mitochondrial membrane potential in the control, light, eYFPþ light, ChETA, and ChETAþ light groups.(f) Quantification of the percentage of glioma cells with normal membrane potential in the control, light, eYFPþ light, ChETA, and ChETAþ light groups. n¼ 3.(g) Quantification of cytosolic cytochrome c in the control, light, eYFPþ light, ChETA, and ChETAþ light groups. n¼ 6. (h) Quantification of the percentage of viable U87 atdifferent extracellular calcium concentrations. *Po0.05; **Po0.01; ***Po0.001. n¼ 10
Light-controlled inhibition of malignant gliomaF Yang et al
6
Cell Death and Disease
(Figure 4c), and there were few positive signals on neurons,astrocytes, microglia, and endothelial cells (SupplementaryFigure S3A); the level of human active Caspase-3 in gliomacells also significantly increased in the ChETAþ light groupcompared with other groups (Po0.001, Figure 4d). Thechanges of mitochondrial membrane potential were thenanalyzed using flow cytometry, and we observed significantlydecreased percentage of glioma cells with normal mitochon-drial membrane potential in ChETAþ light group (Figure 4e).Quantification showed that the percentage of glioma cells withnormal membrane potential in the ChETAþ light group(51.35±8.89%) was significantly lower than those of thecontrol, light, eYFPþ light, and ChETA groups (Po0.01)(Figure 4f).
Mitochondrial membrane potential regulates the release ofcytochrome c during apoptosis.33 We quantified cytosoliccytochrome c and found a significant increase in the ChETAþlight group compared with other groups (Po0.01) (Figure 4g).We also found that increasing the extracellular Ca2þ
concentration significantly enhanced the inhibitory effects oflight stimulation on the viability of glioma cells (Figure 4h).Taken together, these data suggested that light-controlledmembrane depolarization could induce the mitochondria-mediated apoptosis of human glioma cells.
Growth of subcutaneous glioma in mice was markedlyinhibited by ChETA expression and light stimulation. Inorder to determine the therapeutic effect of our optogeneticstrategy in vivo, the subcutaneous glioma model wasestablished through implantation of U87 cells in mice(Figure 5a). Hematoxylin and eosin (HE) staining and GFAPimmunostaining were used to mark the tumor tissue(Figure 5b). Positive eYFP expression was observed 1 weekafter the injection of the cfos-ChETA-eYFP lentivirus into theChETA group (Figure 5c), and 470% of the glioma cellsshowed green fluorescence in the ChETA group (Figure 5c).A blue light illumination device was used (Figure 5d) toilluminate the subcutaneous glioma for 30 min (Figure 5e). At2 weeks after the blue light illumination, the tumor sizes in thecontrol, light, eYFPþ light, ChETA, and ChETAþ lightgroups became 241.1±20.3, 225.9±21.8, 207.5±12,229.2±17.5, and 84.2±17.8 mm3, respectively (mean±-
S.E.M.; n¼ 5) (Figure 5f). The tumor sizes in the ChETAþlight group decreased significantly compared with those inthe other four groups both 2 and 4 weeks after the lightstimulation (Po0.01). Upon excision, tumors of theChETAþ light group were notably smaller than those in thecontrol, light, eYFPþ light, and ChETA groups (Figure 5g;n¼ 3 in each group) at 2 weeks after the light stimulation.
HE staining of tumors in the control, light, eYFPþ light, andChETA groups showed typical histological features of glioma,including high cellular density and an infiltrative growth pattern(Figure 5h); however, in the ChETAþ light group, necrotic fociwere observed, the tissue alignment became irregular, andglioma cellular density decreased significantly compared withthe other four groups (Figure 5h). Cyclin D1 immunostainingshowed that strong signals (brown) were observed aroundglioma cells in the control, light, eYFPþ light, and ChETAgroups; however, the signals of Cyclin D1 significantlydecreased in the ChETAþ light group (Figure 5i).
Intracranial glioma growth in mice was significantlyinhibited by ChETA expression and light stimulation. Inorder to further investigate the effect of our optogenetictherapy on in situ glioma growth, we next transplanted CMV-ChETA-transfected U87 glioma cells or normal astrocytesinto the striatum region of nude mice (Figure 6a). A blue light-emitting optical fiber was used to illuminate the intracranialregion (Figure 6b) for 30 min. At 1 week after the lightstimulation, we observed no significant changes in green-fluorescence distribution of normal astrocytes (Figure 6d);however, for U87 glioma cells, the area of green-fluorescence distribution in the ChETAþ light group significantlydecreased compared with that in the control group(Figure 6d).
We then systemically investigated the optogenetic effectson the intracranial glioma (Figures 6e and f). At 1 week afterinjecting the cfos-ChETA-eYFP lentivirus into the gliomaregion, strong eYFP signals were observed in the ChETAgroup (Figure 6g). Quantification showed that 480% of theintracranial glioma cells were labeled with green fluorescence,whereas no green-fluorescent cells were observed in thecontrol group (Figure 6h). The colocalization of ChETA-eYFPand GFAP showed that ChETA expression (green) wasmainly restricted to the tumor region, whereas very few green-fluorescent cells were observed outside the tumor region,suggesting the specific expression of ChETA in the intracra-nial glioma (Figure 6i).
To further assess the therapeutic effect of the optogenetictreatment, we monitored the survival of nude mice bearingintracranial glioma. We found that mice in the ChETAþ lightgroup had significantly longer survival times (mean¼ 62 days;Po0.05) compared with glioma-bearing mice in the control(mean¼ 45 days), light (mean¼ 49 days), eYFPþ light(mean¼ 46 days), or ChETA (mean¼ 47 days) groups(n¼ 6 in each group) (Figure 6j). HE staining performed 2weeks after the light stimulation showed that the tumor sizehad decreased significantly in the ChETAþ light groupcompared with the other four groups (Figure 6k). The tumorstructure in the ChETAþ light group became disorganized,the cellular density decreased, and necrotic foci becameapparent (Figure 6k, HE � 40).
Furthermore, immunofluorescence showed that thenumber of nestin-positive cells in the ChETAþ light groupdecreased significantly compared with those in the othergroups (Figure 7a, Supplementary Figure S3C). The EdUincorporation assay suggested that the number of in vivodividing glioma cells were significantly decreased in theChETAþ light group compared with the other four groups(Figure 7b, Supplementary Figure S3D). The expression ofcyclin D1 was also significantly inhibited in ChETAþ lightgroup by light stimulation (Figure 7c). To test the apoptosis ofintracranial glioma cells, we performed TUNEL staining andfound that there were more apoptotic cells in the ChETAþlight group than in the other groups (Figure 7d); quantificationshowed that the percentage of TUNEL-positive cells in theChETAþ light group was 21.57±2.3% (mean±S.E.M.;Figure 7e; n¼ 10), significantly higher than those in theother four groups (Po0.001). Taken together, the down-regulated expression of cyclin D and nestin, decreasednumber of dividing glioma cells, and increased number of
Light-controlled inhibition of malignant gliomaF Yang et al
7
Cell Death and Disease

Figure 5 Light stimulation inhibited growth of subcutaneous glioma in mice. (a) Schematic flowchart of the subcutaneous glioma experiment. (b) HE staining (top panel)and immunofluorescence staining of GFAP (bottom panel) of the subcutaneous glioma sections. (c) In vivo expression of ChETA is shown in green fluorescence; nofluorescence is observed in the control group (top panels). Bar¼ 50mm. The percentages of the ChETA-positive glioma cells in the ChETA and control groups are shown inthe bottom panel, n¼ 3. (d) Schematic drawing of the arrangement of the light-illuminating device and the tumor. Inlet: the blue LED. (e) The subcutaneous glioma wasilluminated by light after the mouse was anesthetized. (f) The changes of tumor volume from 1 to 6 weeks post implantation of glioma cells in the control, light, eYFPþ light,ChETA, and ChETAþ light groups. (g) Excised tumors of the control, light, eYFPþ light, ChETA, and ChETAþ light groups (n¼ 3 in each group) 2 weeks after the lightillumination. (h) HE staining of the subcutaneous glioma in the control, light, eYFPþ light, ChETA, and ChETAþ light groups; necrotic foci were observed in theChETAþ light group (arrow). Bar¼ 50mm. (i) Immunostaining of cyclin D1 in the control, light, eYFPþ light, ChETA, and ChETAþ light group. Bars¼ 50mm. **Po0.01;***Po0.001. The experiments were repeated for three times with similar results
Light-controlled inhibition of malignant gliomaF Yang et al
8
Cell Death and Disease

Figure 6 Light stimulation inhibited intracranial glioma growth in mice. (a) Schematic flowchart of the experiment of transplanting ChETA-transfected astrocytes or U87 gliomacells. (b) The intracranial transplantation region was illuminated by blue light after the mice were anesthetized. (c) Schematic drawing of illumination of intracranial glioma usingblue light-emitting optical fiber. (d) The green-fluorescence distribution of transplanted astrocytes or U87 glioma cells in control group and ChETAþ light group (arrow) at 1 weekafter the light stimulation. Bar¼ 50mm. (e) Schematic flowchart of the experiment of intracranial virus injection and light stimulation. (f) HE staining of the intracranial glioma 7 dayspost-U87 cell implantation. Bar¼ 100mm. (g) In situ expression of ChETA (green fluorescence) 7 days after injection of the virus into intracranial glioma. No fluorescence wasobserved in the control group. Bar¼ 50mm. (h) The percentage of the ChETA-positive glioma cells in ChETA and control groups, n¼ 3. (i) GFAP immunofluorescence, ChETAexpression, and HE staining of intracranial glioma sections 7 days post-virus injection. ChETA expression (green) was restricted to the tumor region; no green fluorescence wasobserved in the region outside the tumor. Bar¼ 100mm. (j) Mouse survival curves were plotted for the control, light, eYFPþ light, ChETA, and ChETAþ light groups. n¼ 6 ineach group. (k) HE staining of the intracranial glioma (arrow) in the control, light, eYFPþ light, ChETA, and ChETAþ light groups 2 weeks after the blue light illumination. Highmagnification (HE � 40) showed the disorganized histological appearance, decreased glioma cell density, and necrotic foci (arrow) in the ChETAþ light group. Bars¼ 1 mm(K, HE � 2); 50mm (K, HE � 40). **Po0.01; ***Po0.001.The experiments were repeated for three times with similar results
Light-controlled inhibition of malignant gliomaF Yang et al
9
Cell Death and Disease

apoptotic cells in the ChETAþ light group consistentlyargue that intracranial light stimulation effectively inhibitsthe proliferation and induces apoptosis of human gliomacells.
DiscussionTo our knowledge, our study is the first use of optogenetics toinhibit MG growth both in vitro and in vivo. We havedemonstrated, for the first time, that the proliferation,
Figure 7 Light stimulation inhibited the proliferation and induced the apoptosis of human glioma cells in vivo. (a) Immunostaining of nestin in the control, light,eYFPþ light, ChETA, and ChETAþ light groups. (b) EdU-positive cells (green) were observed in the control, light, eYFPþ light, ChETA, and ChETAþ light groups. Hoechst33342-stained nuclei are shown in blue. (c) Immunostaining of cyclin D in the control, light, eYFPþ light, ChETA, and ChETAþ light groups. (d) TUNEL staining of apoptoticU87 cells in the control, light, eYFPþ light, ChETA, and ChETAþ light groups; Hoechst 33342-stained nuclei are shown in blue. (e) Quantification of the TUNEL-positive cellsin the control, light, eYFPþ light, ChETA, and ChETAþ light groups. (f) Schematic drawing for the mechanism of the light-induced regulation of glioma cell proliferation andapoptosis. Bar¼ 50mm (a–d). ***Po0.001. The experiments were repeated for three times with similar results
Light-controlled inhibition of malignant gliomaF Yang et al
10
Cell Death and Disease

apoptosis, and in vivo growth of human MG could be preciselycontrolled in a light-dependent- and tissue-specific manner.Our data demonstrated that light-induced membrane depolar-ization and ion channel activity changes could reduce humanMG cell viability, disturb cell cycle progression, induce themitochondria-mediated apoptosis, and effectively inhibitin vivo tumor growth in the established subcutaneous/intracranial glioma models.
Activities of ion channels and membrane polarizationchanges have been demonstrated to be important for control-ling glioma growth, proliferation, and migration.5,34 Blockage ofthe ClC3 channel, an anion channel for chloride, could inhibitDNA condensation and glioma cell division.8 Inhibition oftransient receptor potential canonical (TRPC6) channel activitysuppressed cell growth and enhanced the antiproliferativeeffect of ionizing radiation.6 Compared with the ion channelantagonists, optogenetics offers a new tool to precisely controlthe membrane depolarization in a light-controllable and tissue-specific manner.35 In our study, ChETA expression could beselectively targeted to the glioma cells using specific promo-ters; light stimulation could also be precisely manipulated todecrease the viability of glioma cells. Our study thus provides anew approach to target and regulate the function of glioma cellsboth in vitro and in vivo, using the combination of specificChETA expression and controlled light illumination.
The significantly decreased viability of human glioma cellscompared with astrocytes or neurons (Figure 1) after the lightillumination suggests that the light-induced ion influx andmembrane depolarization selectively influence the physio-logical activities of glioma cells. Previous studies have shownthat glioma cells and primary astrocytes responded differen-tially to dexamethasones;36 specific cation channel conduc-tance was needed to regulate the glioma cell cycleprogression,37 suggesting that the physiological function ofnormal astrocytes or glioma was differentially regulated by theion channels and downstream cell signaling pathways.38 Ourstudy supported these findings and further showed that theapoptosis of astrocytes or glioma cells was differentiallyinfluenced by the light-induced membrane depolarization.Optogenetics thus provided a selective approach to regulatethe glioma cell membrane properties and induced theapoptosis of human glioma cells, although not simultaneouslyinfluencing the apoptosis of normal brain cells.
The mitochondria-mediated apoptosis pathway has beenshown to mediate glioma cell death,39 and the knockdown ofcyclin D1 could inhibit the proliferation and induce apoptosis ofhuman glioblastoma cells.40 Here in our study, we demon-strated that the decreased glioma viability was caused by bothincreased glioma cell death and decreased glioma cellproliferation (Figure 7f). After the light stimulation inducedmembrane depolarization and cation influx of the glioma cells,the decreased percentage of Edu-labeled dividing cells anddownregulated expression of cyclins confirmed the inhibitedproliferation of glioma cells (Figure 3). The decreasedmitochondrial membrane potential, increased cytosolic cyto-chrome c release, and increased human active Caspase-3supported that the mitochondrial-mediated pathway wasactivated during glioma cell death (Figure 4). Taken together,our data demonstrated that the continuous depolarization bylight illumination could decrease in vitro glioma cell viability,
mainly through inhibiting the glioma cell proliferation andinducing the mitochondria-mediated apoptosis (Figure 7f).
Intracranial light stimulation efficiently decreased thenumber of the transplanted ChETA-transfected glioma cells(but not transplanted astrocytes), suggesting that we coulduse optogenetics to selectively target in situ glioma growth.The decreased subcutaneous/intracranial tumor size and theprolonged survival time demonstrated that the light illumina-tion had effectively inhibited the in vivo growth of the glioma.Further analysis showed that light stimulation significantlyinhibited the expression of cyclins, decreased the number ofdividing cells, and increased the number of apoptotic gliomacells, which contributed to the inhibition of the intracranialglioma growth after the light stimulation. The selective ChETAexpression in the glioma tissue, along with the light-controllable apoptosis of glioma cells, suggested that wecould selectively induce glioma death in a light-controllable-and tissue-specific manner. Our study thus provided asystemic in vivo approach to decide ‘where’ and ‘when’ toinduce the glioma cell death, which will be potentially helpful tostudy the mechanism of glioma cell death in vivo at differentstages of neoplastic progression.
The detailed functional changes of ion channels andintracellular pathways influenced by optogenetics may needfurther study, which will be helpful to the in-depth under-standing of the molecular mechanism of light-induced gliomadeath. By precisely controlling the light illumination para-meters (light intensity and frequency), the influence ofprecisely regulating membrane properties on glioma physiol-ogy and downstream signaling pathways could be explored inmore details in the future.
In conclusion, the current study demonstrates for the firsttime that optogenetics, an important technology used todissect neural circuits,41 could also be used as a novelapproach for inhibiting MG cell proliferation and inducingglioma cell apoptosis. Therefore, manipulating the glioma cellmembrane depolarization using optogenetics could help tounderstand the biological function of glioma cell membranedepolarization, regulate the physiological activities of humanMG, and provide new insights into the glioma biology.42
Materials and MethodsIn vitro culture of glioma cell line and primary human gliomacells. U87 and H4 human glioma cell lines were used in the current study, andthe experiments were approved by the Research Committee of the ShenzhenInstitutes of Advanced Technology, Chinese Academy of Sciences. Culture of theU87 and H4 cell lines was conducted as described previously.6 The isolation andculture of rat-derived astrocytes, microglia, and endothelial cells were conductedas described previously.43–45 For the culturing of primary isolated human glioma ornon-glioma cells, human brain tissues located within the temporal or frontal lobewere surgically removed at the Beijing Sanbo Brain Hospital. Each glioma washistologically graded by the hospital pathology department based on the WorldHealth Organization grading system. The specimens were collected with theconsent of each patient and the hospital’s ethics committee. In brief, the tissuepieces were minced and digested with 0.25% trypsin (Gibco, Carlsbad, CA, USA)for 30 min. The supernatant was filtered and plated in 75-cm2 flasks and culturedwith DMEM supplemented with 10% fetal bovine serum and 1% antibiotics(10 000 U of penicillin and streptomycin) for 7 days. Once the cells reachedconfluence, they were passaged and used in the experiments.
Cell viability assay. Cell viability was analyzed using the MTT-basedcytotoxicity assay (Sigma-Aldrich, St. Louis, MO, USA). Neurons, astrocytes, andhuman glioma cells were seeded into 96-well plates, and light-stimulation-induced
Light-controlled inhibition of malignant gliomaF Yang et al
11
Cell Death and Disease

cytotoxicity was measured. In brief, 20ml of 5 mg/ml MTT solution was added toeach well of the different groups; the culture plates were incubated at 37 1C for3.5 h and the media were carefully removed. Images of the different groups weretaken at this stage using a microscope (ECLIPSE 50i, Nikon, Melville, NY, USA) toreflect viable cell density. For quantification, MTT solvent (dimethylsulfoxide) wasadded to each well and the culture plates were shaken for 15 min. Absorbance at590 nm was determined using a microplate reader (Synergy 4, BioTek, Winooski,VT, USA) as a measure of cell viability. Cell viability was normalized to the controlgroup and compared among the groups.
Cell cycle analysis and mitochondrial transmembrane potentialdetection using flow cytometry. The cell cycle of the glioma cells wasdetermined using a flow cytometer (Cell Lab Quanta SC, Beckman Coulter, Brea,CA, USA). In brief, U87 glioma cells from the different groups were trypsinized,washed with PBS, and fixed with 70% ice-cold ethanol. Cell pellets were obtainedafter centrifugation and washed again with PBS. Cells were incubated with PIstaining buffer (10 mg/ml PI, 100mg/ml RNaseA, and 0.1% TritonX-100) at 37 1Cfor 30 min. The cell cycle was then analyzed, and the data were acquired usingCell Lab Quanta SC software (Beckman Coulter).
Mitochondrial Transmembrane Potential Apoptosis Detection Kit (Abcam,Cambridge, MA, USA) was used to detect the changes in the mitochondrialtransmembrane potential of healthy and apoptotic cells. Briefly, the cationic dye wasdiluted and incubated with glioma cells from different groups for 20 min, and then thecells were analyzed using flow cytometry. Cationic dyes aggregated in healthy cellsare detectable in PI channel showing red fluorescence. We used the percentage ofred-fluorescent cells in the total cells to represent the percentage of healthy cellswith normal transmembrane potential (Dcm).
EdU incorporation analysis for cell proliferation. The EdUincorporation analysis was performed using a Click-iT Alexa Fluor 488 EdUImaging Kit (Invitrogen, Carlsbad, CA, USA). In brief, after 24-h incubation with10mM EdU, the cells were fixed with 4% paraformaldehyde (PFA) for 15 min and0.5% Triton X-100 was used to permeabilize the cells. The cells were washedtwice with 3% BSA in PBS and then incubated with the Click-iT reaction cocktail(Click-iT reaction buffer, CuSO4, Alexa Fluor 488 Azide, and reaction bufferadditive) for 30 min while being protected from light. The cells were then incubatedwith Hoechst 33342 to stain the nuclei, and images were acquired. Eight imagesfrom each group were selected; the EdU-positive and Hoechst-labeled cells werecounted using Image-Pro Plus software (Media Cybernetics Inc, Rockville, MD,USA). The number of EdU-positive cells was normalized to the Hoechst-labeledcells to determine the ratio of EdU-positive cells in the five groups. For the in vivoexperiments, EdU (0.3 mg per 10 g) was intraperitoneally injected into the tumor-bearing nude mice 3 h before killing. The experiments were repeated three timesfor accuracy and the differences among the groups were compared.
Western blotting. Human glioma cells were lysed and the protein wasextracted using lysis buffer (NE-PER Nuclear and Cytoplasmic ExtractionReagents, Pierce/Thermo Fisher Scientific, Waltham, MA, USA). Total proteinswere determined using a Bicinchoninic Acid Protein Assay Kit (Pierce/ThermoFisher Scientific) and denatured using the standard method. The samples wereloaded onto 10% sodium dodecyl sulfate-polyacrylamide gel electrophoresisseparating gel and run at a constant voltage of 120 V for 2.5 h. Transblotting wasperformed at a constant voltage of 30 V overnight at 4 1C. The total cyclin D1 andcyclin E contents were quantitated using mouse anti-human cyclin D1 and mouseanti-human cyclin E antibodies, respectively (Cell Signaling Technology, Beverly,MA, USA), followed by horseradish peroxidase-conjugated goat anti-mouse IgG(Sigma). Color development was achieved by using the ECL Western BlottingDetection Kit (Pierce/Thermo Fisher Scientific). The band density was assessedfor the different groups and normalized to b-actin using Image J software (version1.43; National Institutes of Health). The expression level difference of cyclin D1and cyclin E was compared among the groups.
Quantitative determination of human active caspase-3 andcytochrome c. The concentrations of human active Caspase-3 in cell extractswere determined using Human active Caspase-3 Immunoassay Kit (R&DSystems, Minneapolis, MN, USA). The concentrations of human cytosoliccytochrome c were determined using Human Cytochrome c Kit (R&D Systems). Allthe experiments were carried out according to the manufacturers’ instructions. Theoptical density was determined at 450 nm using the microplate reader (Synergy 4,
BioTek). The concentrations of active Caspase-3 and cytosolic cytochrome c weredetermined, normalized to the control group, and compared among the differentgroups.
Immunostaining and in situ cell apoptosis detection. Humanglioma cells were fixed with 4% PFA and incubated with rabbit antibody to glialfibrillary acidic protein (GFAP) (Abcam) and mouse antibody to nestin (Abcam) tocharacterize the cultured glioma cell phenotype. After being washed three times,the slides were incubated with fluorescein isothiocyanate or phycoerythrin-conjugated goat anti-rabbit or anti-mouse secondary antibodies (Invitrogen),respectively. The slides were counterstained with Hoechst 33342 to stain thenuclei and were then mounted.
Tissue sections were deparaffinized, rehydrated, and blocked by goat serum.The sections were then incubated with primary rabbit anti-GFAP antibody, mouseantibody to nestin (Abcam), and mouse anti-cyclin D1 antibody (10 mg/ml). Thesections were washed and labeled with fluorescent secondary antibody, or thedetection was accomplished by using a rabbit or mouse Vectastain Elite ABC Kit(Vector, Burlingame, CA, USA) with diaminobenzidine as the chromogen. Thesections were counterstained with hematoxylin or Hoechst 33342 and then mountedfor image acquisition. The percentage Nestin/Edu-positive cells in the differentgroups was calculated and compared.
In Situ Cell Death Detection Kit (Roche, Basel, Switzerland) was used to detectand quantify apoptotic cell death in glioma cells and tissues, based on the TUNELtechnology. All the experiments were carried out according to the manufacturers’instructions. The percentage of TUNEL-positive cells in the different groups wascalculated and compared.
Tissue processing and histological staining. For the subcutaneousglioma model, the tumor samples were fixed in 4% PFA at 4 1C and dehydratedusing gradient ethanol. After xylene treatment, the samples were embedded inparaffin and sectioned at 5-mm thickness. For the intracranial glioma model, thebrains were fixed in 4% PFA at 4 1C overnight and cryosectioned at 20 mm perslice. HE staining was performed on the tissue sections, and images were takenunder the microscope (ECLIPSE 50i; Nikon).
ChETA expression in human glioma cells using lentiviralvectors. Lentiviral vectors carrying the ChETA-eYFP or eYFP gene(Figure 1a) were constructed. Briefly, the CMV or c-fos promoter was clonedinto the pLenti-CaMK-a-ChETA-eYFP or pLenti-CaMK-a-eYFP plasmid (providedby Dr. Karl Deisseroth in Stanford University);31 a high titer lentivirus wasproduced via calcium phosphate co-transfection of 293FT cells with the lentiviralvector pCMVDR8.74 and pMD2G. Twenty-four hours after the transfection, 293FTcells were transferred to a serum-free medium containing 5 mM sodium butyrate;the supernatant was collected 16 h later and concentrated using ultracentrifugationat 50 000� g with a 20% sucrose cushion. PBS was used to re-suspend the viralpellets before use.
Lentivirus was used to express the ChETA fusion protein in cultured cells. Theneurons, astrocytes, glioma cell line, and primary human glioma cells wereincubated with the lentivirus (109 TU/ml) in a serum-free medium for 48 and 120 h,respectively. ChETA expression was confirmed by observation of greenfluorescence under the microscope. For quantification of the ChETA-positive cellsin the subcutaneous/intracranial glioma tissue, three mice in control and ChETAgroup were used and the ChETA-positive cells were counted and summed up from10 tissue sections separately. The number of ChETA-positive cells was expressedas a percentage of the total Hoechst-positive cells.
In vitro stimulation of ChETA-expressing glioma cells usingblue light with a wavelength of 460–485 nm. We constructed ahomemade LED to stimulate the ChETA-expressing glioma cells for 1 h (10 Hz and50-ms stimulus intervals). The arrangement of the lamps and plate well isschematically illustrated (Figure 1c), and the average output power of the LED was1.64 mW/mm2. The glioma cells were plated in 96- or 6-well plates and weredivided into five groups: control group without ChETA expression and lightstimulation; light group, which was stimulated by light but had no ChETA or eYFPexpression; eYFPþ light group, which expressed eYFP and was stimulated bylight; ChETA group, which expressed ChETA but without light stimulation; andChETAþ light group, which expressed ChETA and was stimulated with blue light.At 24 h after the light stimulation, the cells from different groups were harvestedand examined using cell viability and other analyses.
Light-controlled inhibition of malignant gliomaF Yang et al
12
Cell Death and Disease

Subcutaneous glioma animal model and in vivo light stimulation.All animal experimental protocols were approved by the Research Committeeof the Shenzhen Institutes of Advanced Technology. Fifty female athymicnude mice (4–6 weeks of age) were used in the subcutaneous glioma model.The mice were divided into five groups: control, light, eYFPþ light, ChETA,and ChETAþ light. The mice were injected subcutaneously with 1� 107 U87 cellsin 100ml Dulbecco’s Modified Eagle Medium (DMEM) on the flank region toestablish the tumor model. Tumor lengths and widths were measured every weekafter tumor implantation, and tumor volume was calculated using the followingformula: volume¼ (length�width2)/2.
At 1 week after the implantation, 10ml ChETA or eYFP lentivirus vectors (109 TU/ml)were injected intratumorally into the ChETA, ChETAþ light, and eYFPþ lightgroups. One week after virus injection, we constructed a blue LED (Figure 5d) toilluminate for 30 min the subcutaneous tumors of the light, eYFPþ light, andChETAþ light groups (Figure 5e). The distance between the lamp and the skin wasB1.5 mm, whereas the average power was 1.7 mW/mm2. Two weeks afterillumination, the mice were killed by cervical dislocation and the tumors werebiopsied for tissue processing.
Intracranial glioma model and in vivo light stimulation. All animalexperimental protocols were approved by the Research Committee of theShenzhen Institutes of Advanced Technology. Eighty female athymic nude mice(4–6 weeks old) were used in the intracranial glioma model. The mice were dividedinto the following five groups: control, light, eYFPþ light, ChETA, and ChETAþlight groups. The mice were anesthetized with an intraperitoneal injection ofphenobarbitol sodium (100 mg/kg). The head skin was cleaned with a 70%isopropanol solution and an incision was made along the midline. For cellimplantation, a burr hole with a diameter of 1 mm was drilled 1.0 mm anterior tothe bregma and 2.0 mm right to the midline. U87 cells or rat brain-derivedastrocytes (2� 105) were suspended in 5 ml DMEM medium and were injectedusing a 10-ml Hamilton syringe (31 gauge needle) to a depth of 3 mm at a speedof 1 ml/min.
One week after intracranial implantation of the glioma cells, 3 ml lentivirus solution(109 TU/ml) containing ChETA or eYFP vectors was injected into the glioma tissue inthe ChETA, ChETAþ light, and eYFPþ light groups, respectively. No virus wasinjected into the control or light groups. One week after virus injection, we used ablue light-emitting optical fiber with a diameter of 200mm to illuminate theintracranial tumor for 30 min in the light, eYFPþ light, and ChETAþ light groups(Figure 6b). The distance between the optical fiber tip and the cell implantationposition was B100mm, and the average output power was B10 mW/mm2. Twoweeks after the light stimulation, the mice were perfused with 4% PFA and the braintissue was removed for histological analysis and immunostaining.
Electrophysiology. Using standard whole-cell patch-clamp techniques, weacquired whole-cell recordings of glioma cell line U87 and primary human gliomacells. Using a puller (P-2000; Sutter Instruments, Novato, CA, USA), patchpipettes were pulled from thin-walled borosilicate glass (Sutter Instruments) to aresistance of 3–5 MO. We used a Multiclamp 700B amplifier (Molecular Devices,Sunnyvale, CA, USA) to acquire cell recordings, and the currents were low-pass-filtered at 1 KHz and digitalized at 10 KHz using a Digidata 1440A (MolecularDevices). The standard KCl pipette solution used contained the following salts:140 mM KCl, 4.3 mM MgCl2, 11 mM EGTA, 4.4 mM Na2ATP, and 10 mM 4-(2-hydroxyethyl)-1-piperazineethanesulfonic acid (HEPES) sodium salt; the pH wasadjusted to 7.2 using Tris base. Osmolarity was adjusted to 302 mOsm/kg. Normalextracellular NaCl bath solution contained the following salts: 150 mM NaCl, 5 mMKCl, 3.31 mM CaCl2, 10 mM glucose, and 10 HEPES acid. The pH was adjustedto 7.4 and the osmolarity was 306–312 mOsm/kg. Data were acquired and storedwith the use of pClamp 10 (Molecular Devices). Current subtractions and current–voltage relationships from electrophysiological recordings were determined usingClampfit (Molecular Devices).
A DG-4 high-speed optical switch with a 300 W xenon lamp (Sutter Instruments)was used to deliver the light pulses for the ChETA activation. The output power was3–5 mW. We used 10-Hz light stimulation (1–500 ms). The interval for the pairedstimulation was 25–500 ms. The whole-cell recording of the light-evokedphotocurrents was also acquired for a 2-s period before and after 1 h of lightstimulation.
Statistical analyses. Data are expressed as the mean±S.E.M. of thenumber of tests stated. The significance of cell viability differences among the
different groups was tested using analysis of variance (ANOVA). Bonferroni’smultiple comparison test was used as a post hoc test. The ratio of EdU-positivecells, ChETA-positive cells, Nestin/TUNEL-positive cells, the cyclin D1 and cyclin Eexpression levels, caspase 3 and cytochrome c levels among the different groupswere tested using one-way ANOVA. Bonferroni’s multiple comparison test wasused as a post hoc test. Tumor volume differences among the different groupswere tested by one-way ANOVA. Bonferroni’s multiple comparison test was usedas a post hoc test. The log-rank test was performed to test the significance of thesurvival time differences among different groups. All of the statistical tests wereperformed using the Statview (Version 10.0; SPSS, Chicago, IL, USA) programpackage or GraphPad Prism software (Version 5.0; La Jolla, CA, USA). A P-valueo0.05 was considered statistically significant.
Conflict of InterestThe authors declare no conflict of interest
Acknowledgements. We thank Dr. Karl Deisseroth (Stanford University) forproviding the ChETA plasmid. This research project was partially sponsored by theNational Basic Research Program of China under grant numbers 2012CB966902and 2010CB529605; the National Natural Science Foundation of China under grantnumbers NSFC 81000551, 81000595, and 91132306; the Instrument DevelopingProject of the Chinese Academy of Sciences (2010019); Strategic Priority ResearchProgram (B) of the Chinese Academy of Sciences (XDB02050003); ‘HundredTalents Program’ of the Chinese Academy of Science, the National Key TechnologyResearch and Development Program of the Ministry of Science and Technology ofChina (2012BAI01B08); Guangdong Innovation Research Team Fund for Low-costHealthcare Technologies, Shenzhen Governmental Basic Research GrantJC201006040897A, JC201005270296A, and JC201005270291A.
1. Gladson CL, Prayson RA, Liu WM. The pathobiology of glioma tumors. Annu Rev Pathol2010; 5: 33–50.
2. Scott JN, Rewcastle NB, Brasher PM, Fulton D, MacKinnon JA, Hamilton M et al. Whichglioblastoma multiforme patient will become a long-term survivor? A population-basedstudy. Ann Neurol 1999; 46: 183–188.
3. Van Meir EG, Hadjipanayis CG, Norden AD, Shu HK, Wen PY, Olson JJ. Exciting newadvances in neuro-oncology: the avenue to a cure for malignant glioma. CA Cancer J Clin2010; 60: 166–193.
4. Huse JT, Holland EC. Targeting brain cancer: advances in the molecular pathology ofmalignant glioma and medulloblastoma. Nat Rev Cancer 2010; 10: 319–331.
5. Sontheimer H. An unexpected role for ion channels in brain tumor metastasis. Exp BiolMed (Maywood) 2008; 233: 779–791.
6. Ding X, He Z, Zhou K, Cheng J, Yao H, Lu D et al. Essential role of TRPC6 channels inG2/M phase transition and development of human glioma. J Natl Cancer Inst 2010; 102:1052–1068.
7. Lee YI, Seo M, Kim Y, Kim SY, Kang UG, Kim YS et al. Membrane depolarization inducesthe undulating phosphorylation/dephosphorylation of glycogen synthase kinase 3beta, andthis dephosphorylation involves protein phosphatases 2A and 2B in SH-SY5Y humanneuroblastoma cells. J Biol Chem 2005; 280: 22044–22052.
8. Habela CW, Olsen ML, Sontheimer H. ClC3 is a critical regulator of the cell cycle in normaland malignant glial cells. J Neurosci 2008; 28: 9205–9217.
9. Haas BR, Sontheimer H. Inhibition of the sodium-potassium-chloride cotransporterisoform-1 reduces glioma invasion. Cancer Res 2010; 70: 5597–5606.
10. Ghiani CA, Yuan X, Eisen AM, Knutson PL, DePinho RA, McBain CJ et al. Voltage-activated Kþ channels and membrane depolarization regulate accumulation of the cyclin-dependent kinase inhibitors p27(Kip1) and p21(CIP1) in glial progenitor cells. J Neurosci1999; 19: 5380–5392.
11. Kraft R, Krause P, Jung S, Basrai D, Liebmann L, Bolz J et al. BK channel openers inhibitmigration of human glioma cells. Pflugers Arch 2003; 446: 248–255.
12. Weaver AK, Liu X, Sontheimer H. Role for calcium-activated potassium channels(BK) in growth control of human malignant glioma cells. J Neurosci Res 2004; 78:224–234.
13. Debska-Vielhaber G, Godlewski MM, Kicinska A, Skalska J, Kulawiak B, Piwonska M et al.Large-conductance Kþ channel openers induce death of human glioma cells. J PhysiolPharmacol 2009; 60: 27–36.
14. Deisseroth K. Optogenetics. Nat Methods 2011; 8: 26–29.15. Nagel G, Szellas T, Huhn W, Kateriya S, Adeishvili N, Berthold P et al. Channelrhodopsin-
2, a directly light-gated cation-selective membrane channel. Proc Natl Acad Sci USA 2003;100: 13940–13945.
16. Boyden ES, Zhang F, Bamberg E, Nagel G, Millisecond-timescale Deisseroth K.genetically targeted optical control of neural activity. Nat Neurosci 2005; 8:1263–1268.
Light-controlled inhibition of malignant gliomaF Yang et al
13
Cell Death and Disease

17. Arenkiel BR, Peca J, Davison IG, Feliciano C, Deisseroth K, Augustine GJ et al. In vivolight-induced activation of neural circuitry in transgenic mice expressing channel-rhodopsin-2. Neuron 2007; 54: 205–218.
18. Zhang F, Wang LP, Brauner M, Liewald JF, Kay K, Watzke N et al. Multimodal fast opticalinterrogation of neural circuitry. Nature 2007; 446: 633–639.
19. Alilain WJ, Li X, Horn KP, Dhingra R, Dick TE, Herlitze S et al. Light-induced rescue ofbreathing after spinal cord injury. J Neurosci 2008; 28: 11862–11870.
20. Cardin JA, Carlen M, Meletis K, Knoblich U, Zhang F, Deisseroth K et al. Drivingfast-spiking cells induces gamma rhythm and controls sensory responses. Nature 2009;459: 663–667.
21. Gradinaru V, Mogri M, Thompson KR, Henderson JM, Deisseroth K. Optical deconstructionof parkinsonian neural circuitry. Science 2009; 324: 354–359.
22. Wyart C, Del Bene F, Warp E, Scott EK, Trauner D, Baier H et al. Optogenetic dissection ofa behavioural module in the vertebrate spinal cord. Nature 2009; 461: 407–410.
23. Dhawale AK, Hagiwara A, Bhalla US, Murthy VN, Albeanu DF. Non-redundant odor codingby sister mitral cells revealed by light addressable glomeruli in the mouse. Nat Neurosci2010; 13: 1404–1412.
24. Haubensak W, Kunwar PS, Cai H, Ciocchi S, Wall NR, Ponnusamy R et al. Geneticdissection of an amygdala microcircuit that gates conditioned fear. Nature 2010; 468:270–276.
25. Lobo MK, Covington HE 3rd, Chaudhury D, Friedman AK, Sun H, Damez-Werno D et al.Cell type-specific loss of BDNF signaling mimics optogenetic control of cocaine reward.Science 2010; 330: 385–390.
26. Abbott SB, Stornetta RL, Fortuna MG, Depuy SD, West GH, Harris TE et al.Photostimulation of retrotrapezoid nucleus phox2b-expressing neurons in vivo produceslong-lasting activation of breathing in rats. J Neurosci 2009; 29: 5806–5819.
27. Abbott SB, Stornetta RL, Socolovsky CS, West GH, Guyenet PG. Photostimulation ofchannelrhodopsin-2 expressing ventrolateral medullary neurons increases sympatheticnerve activity and blood pressure in rats. J Physiol 2009; 587(Pt 23): 5613–5631.
28. Kanbar R, Depuy SD, West GH, Stornetta RL, Guyenet PG. Regulation of visceralsympathetic tone by A5 noradrenergic neurons in rodents. J Physiol 2010; 589(Pt 4):903–917.
29. Airan RD, Thompson KR, Fenno LE, Bernstein H, Deisseroth K. Temporally precise in vivocontrol of intracellular signalling. Nature 2009; 458: 1025–1029.
30. Gourine AV, Kasymov V, Marina N, Tang F, Figueiredo MF, Lane S et al. Astrocytes controlbreathing through pH-dependent release of ATP. Science 2010; 329: 571–575.
31. Gunaydin LA, Yizhar O, Berndt A, Sohal VS, Deisseroth K, Hegemann P. Ultrafastoptogenetic control. Nat Neurosci 2010; 13: 387–392.
32. Milde-Langosch K. The Fos family of transcription factors and their role in tumourigenesis.Eur J Cancer 2005; 41: 2449–2461.
33. Gottlieb E, Armour SM, Harris MH, Thompson CB. Mitochondrial membrane potentialregulates matrix configuration and cytochrome c release during apoptosis. Cell Death Differ2003; 10: 709–717.
34. Watkins S, Sontheimer H. Hydrodynamic cellular volume changes enable glioma cellinvasion. J Neurosci 2011; 31: 17250–17259.
35. Scanziani M, Hausser M. Electrophysiology in the age of light. Nature 2009; 461:930–939.
36. Hinkerohe D, Wolfkuhler D, Haghikia A, Meier C, Faustmann PM, Schlegel U.Dexamethasone differentially regulates functional membrane properties inglioma cell lines and primary astrocytes in vitro. J Neurooncol 2011; 103:479–489.
37. Rooj AK, McNicholas CM, Bartoszewski R, Bebok Z, Benos DJ, Fuller CM. Glioma-specificcation conductance regulates migration and cell cycle progression. J Biol Chem 2012; 287:4053–4065.
38. Yang C, Iyer RR, Yu AC, Yong RL, Park DM, Weil RJ et al. Beta-Catenin signaling initiatesthe activation of astrocytes and its dysregulation contributes to the pathogenesis ofastrocytomas. Proc Natl Acad Sci USA 2012; 109: 6963–6968.
39. Ordys BB, Launay S, Deighton RF, McCulloch J, Whittle IR. The role of mitochondria inglioma pathophysiology. Mol Neurobiol 2010; 42: 64–75.
40. Wang J, Wang Q, Cui Y, Liu ZY, Zhao W, Wang CL et al. Knockdown of cyclin D1 inhibitsproliferation, induces apoptosis, and attenuates the invasive capacity of humanglioblastoma cells. J Neurooncol 2012; 106: 473–484.
41. Buchen L. Neuroscience: Illuminating the brain. Nature 2010; 465: 26–28.42. Hanahan D, Weinberg RA. Hallmarks of cancer: the next generation. Cell 2011; 144:
646–674.43. Cecchelli R, Dehouck B, Descamps L, Fenart L, Buee-Scherrer VV, Duhem C et al. In vitro
model for evaluating drug transport across the blood-brain barrier. Adv Drug Deliv Rev1999; 36: 165–178.
44. Saura J, Tusell JM, Serratosa J. High-yield isolation of murine microglia by mildtrypsinization. Glia 2003; 44: 183–189.
45. Higashimori H, Sontheimer H. Role of Kir4.1 channels in growth control of glia. Glia 2007;55: 1668–1679.
Cell Death and Disease is an open-access journalpublished by Nature Publishing Group. This work is
licensed under a Creative Commons Attribution-NonCommercial-NoDerivs 3.0 Unported License. To view a copy of this license, visithttp://creativecommons.org/licenses/by-nc-nd/3.0/
Supplementary Information accompanies this paper on Cell Death and Disease website (http://www.nature.com/cddis)
Light-controlled inhibition of malignant gliomaF Yang et al
14
Cell Death and Disease


![cells inhibits angiogenesis in glioblastoma · cells * glioma Downregulation INTRODUCTION Angiogenesis is a key event in the progression of malignant gliomas [1,2]. It is a highly](https://static.fdocuments.us/doc/165x107/5ecd7b084c46b638be2fbb49/cells-inhibits-angiogenesis-in-glioblastoma-cells-glioma-downregulation-introduction.jpg)


![Case Report Malignant Trigeminal Nerve Sheath Tumor and ...(including glioblastoma) Suh et al. [ ] Suprasellar chordoid glioma and Rathke scle cyst Johnson et al. [ ] Oligodendroglioma](https://static.fdocuments.us/doc/165x107/60f6a026ed06d422737c4388/case-report-malignant-trigeminal-nerve-sheath-tumor-and-including-glioblastoma.jpg)


