Lifestyles and spending habits results presentation 2013
31
Research into the Financial Attitudes, Lifestyles and Spending Habits of UK Consumers in 2013 Prepared by Scott Owens 18 th February 2013 Robust Insight: Online Consumer Panel Robust Insight | Website: www.robust-insight.co.uk | Telephone: 078252 69235 | Email: [email protected]
-
Upload
scott-owens -
Category
Data & Analytics
-
view
302 -
download
4
Transcript of Lifestyles and spending habits results presentation 2013
Research into the Financial Attitudes, Lifestyles and Spending Habits of UK Consumers in 2013
Prepared by Scott Owens 18th February 2013
Robust Insight: Online Consumer Panel
Robust Insight | Website: www.robust-insight.co.uk | Telephone: 078252 69235 | Email: [email protected]
Background to this Study
2
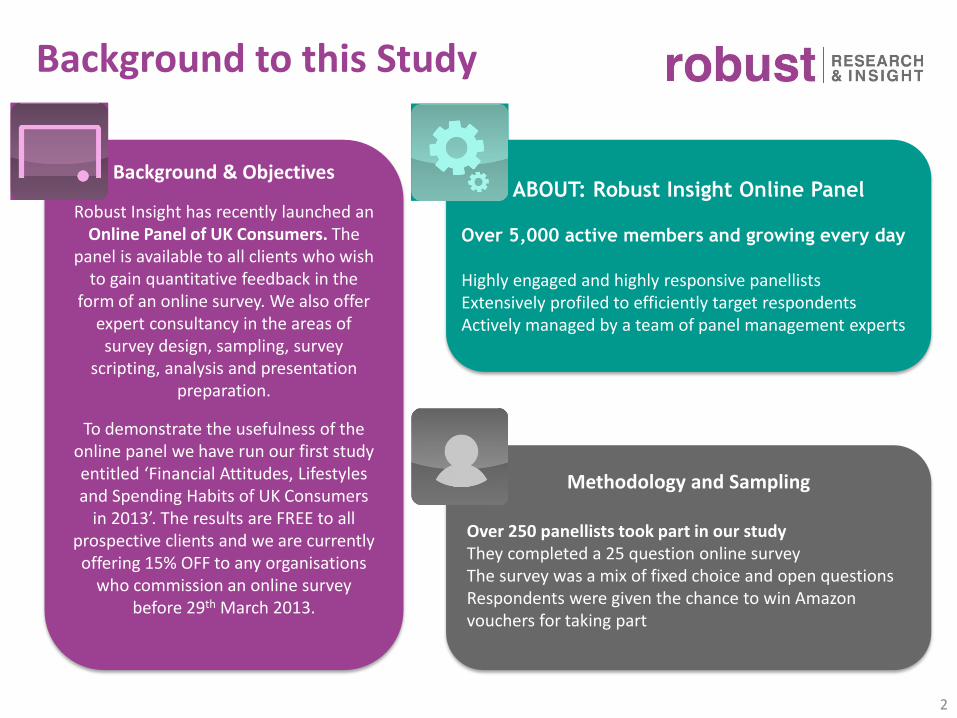
ABOUT: Robust Insight Online Panel
Over 5,000 active members and growing every day
Highly engaged and highly responsive panellists Extensively profiled to efficiently target respondentsActively managed by a team of panel management experts
Methodology and Sampling
Over 250 panellists took part in our studyThey completed a 25 question online surveyThe survey was a mix of fixed choice and open questionsRespondents were given the chance to win Amazon vouchers for taking part
Background & Objectives
Robust Insight has recently launched an Online Panel of UK Consumers. The
panel is available to all clients who wish to gain quantitative feedback in the
form of an online survey. We also offer expert consultancy in the areas of
survey design, sampling, survey scripting, analysis and presentation
preparation.
To demonstrate the usefulness of the online panel we have run our first study entitled ‘Financial Attitudes, Lifestyles and Spending Habits of UK Consumers
in 2013’. The results are FREE to all prospective clients and we are currently offering 15% OFF to any organisations
who commission an online survey before 29th March 2013.
3
• UK consumers continued to feel the pinch of the prolonged economic downturn
• The rising cost of living and bleak employment situation led to increased dissatisfaction with life and reduced optimism about the future
• Consumers were using a number of innovate ways to save money and boost their income to help make ends meet
− For example, trading in retailer loyalty points, selling existing possessions or taking on extra work or another job
• The Internet played a major role in allowing consumers to access cheaper deals
− For example, using online discount codes & coupons, shopping through cash back websites and switching energy providers
• Despite widespread dissatisfaction with the current economic climate family remained the most important aspect of their lives
Key Highlights
4
Executive Summary
Executive Summary #1:Life Satisfaction
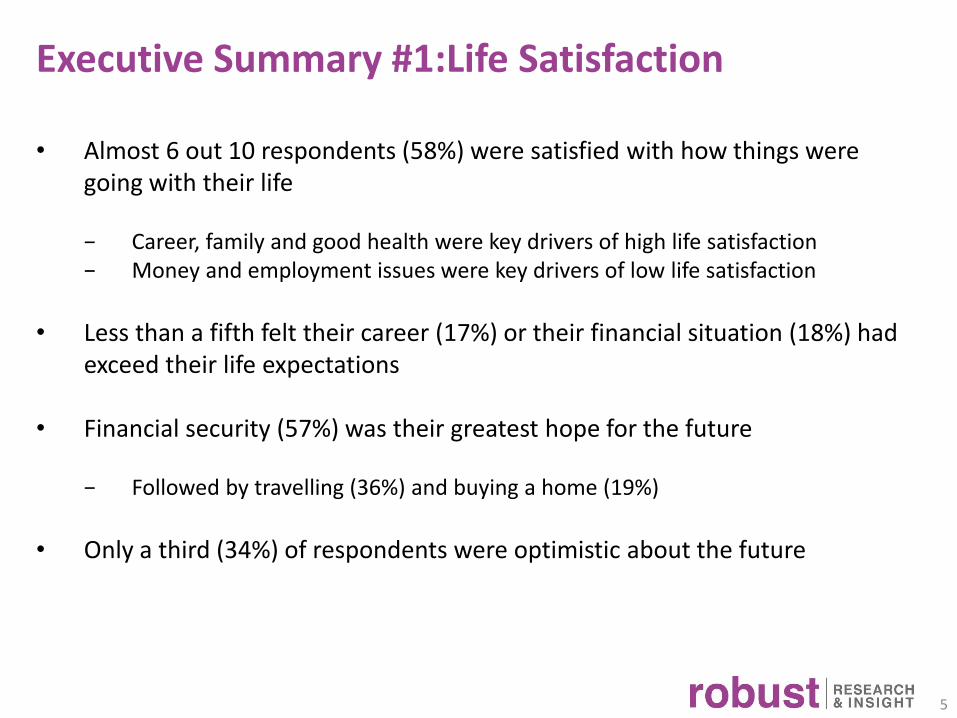
• Almost 6 out 10 respondents (58%) were satisfied with how things were going with their life
− Career, family and good health were key drivers of high life satisfaction− Money and employment issues were key drivers of low life satisfaction
• Less than a fifth felt their career (17%) or their financial situation (18%) had exceed their life expectations
• Financial security (57%) was their greatest hope for the future
− Followed by travelling (36%) and buying a home (19%)
• Only a third (34%) of respondents were optimistic about the future
5
Executive Summary #2 Lifestyles
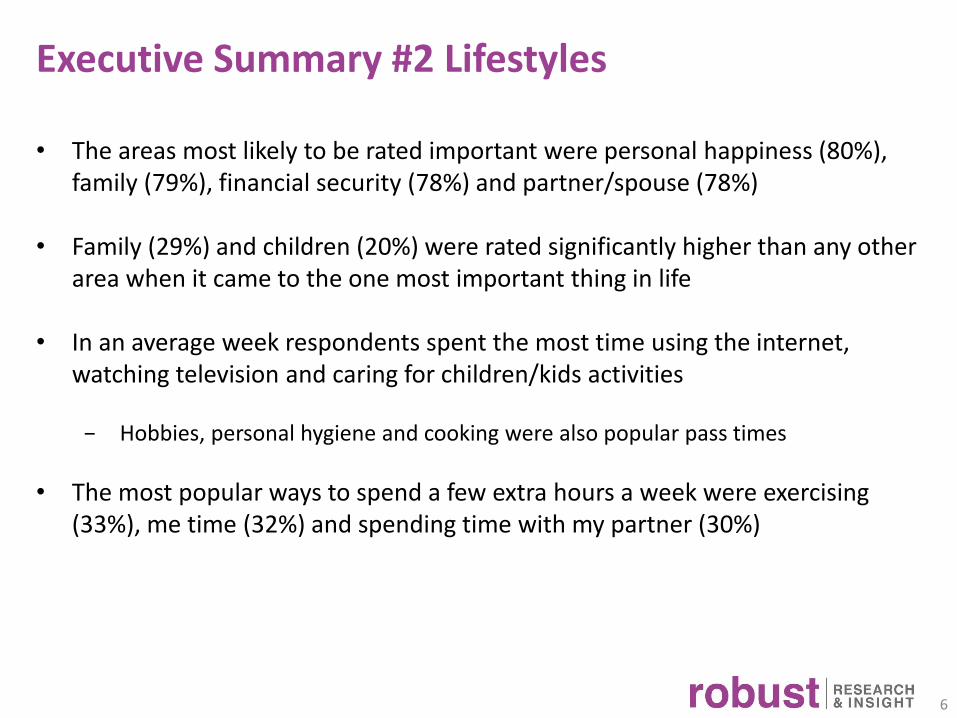
• The areas most likely to be rated important were personal happiness (80%), family (79%), financial security (78%) and partner/spouse (78%)
• Family (29%) and children (20%) were rated significantly higher than any other area when it came to the one most important thing in life
• In an average week respondents spent the most time using the internet, watching television and caring for children/kids activities
− Hobbies, personal hygiene and cooking were also popular pass times
• The most popular ways to spend a few extra hours a week were exercising (33%), me time (32%) and spending time with my partner (30%)
6
Executive Summary #3 Spending Habits
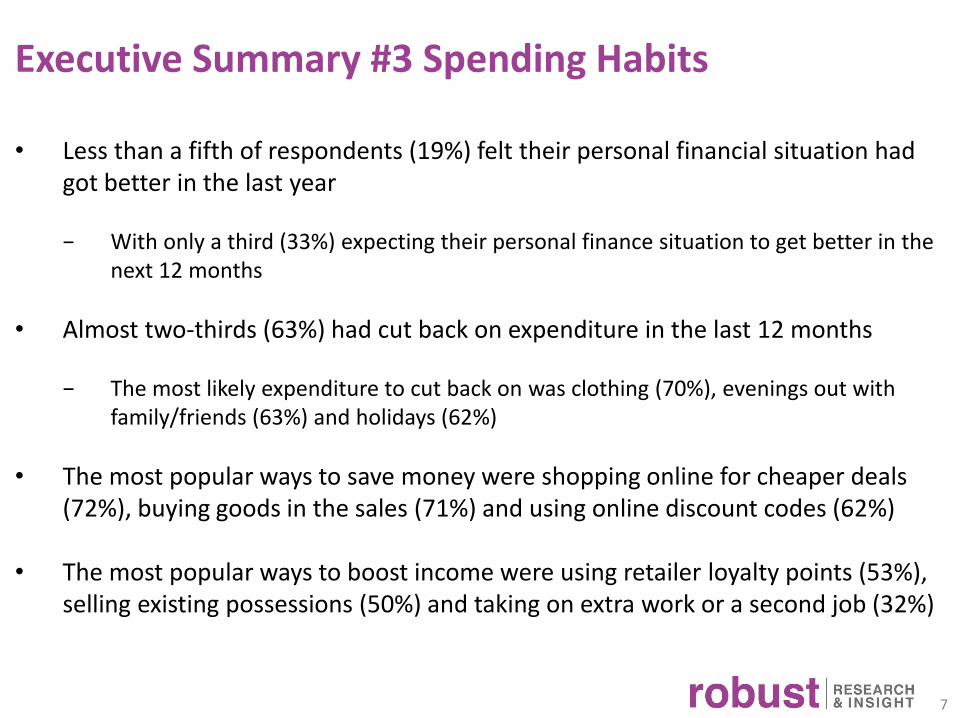
• Less than a fifth of respondents (19%) felt their personal financial situation had got better in the last year
− With only a third (33%) expecting their personal finance situation to get better in the next 12 months
• Almost two-thirds (63%) had cut back on expenditure in the last 12 months
− The most likely expenditure to cut back on was clothing (70%), evenings out with family/friends (63%) and holidays (62%)
• The most popular ways to save money were shopping online for cheaper deals (72%), buying goods in the sales (71%) and using online discount codes (62%)
• The most popular ways to boost income were using retailer loyalty points (53%), selling existing possessions (50%) and taking on extra work or a second job (32%)
7
8
Demographic Profile
9
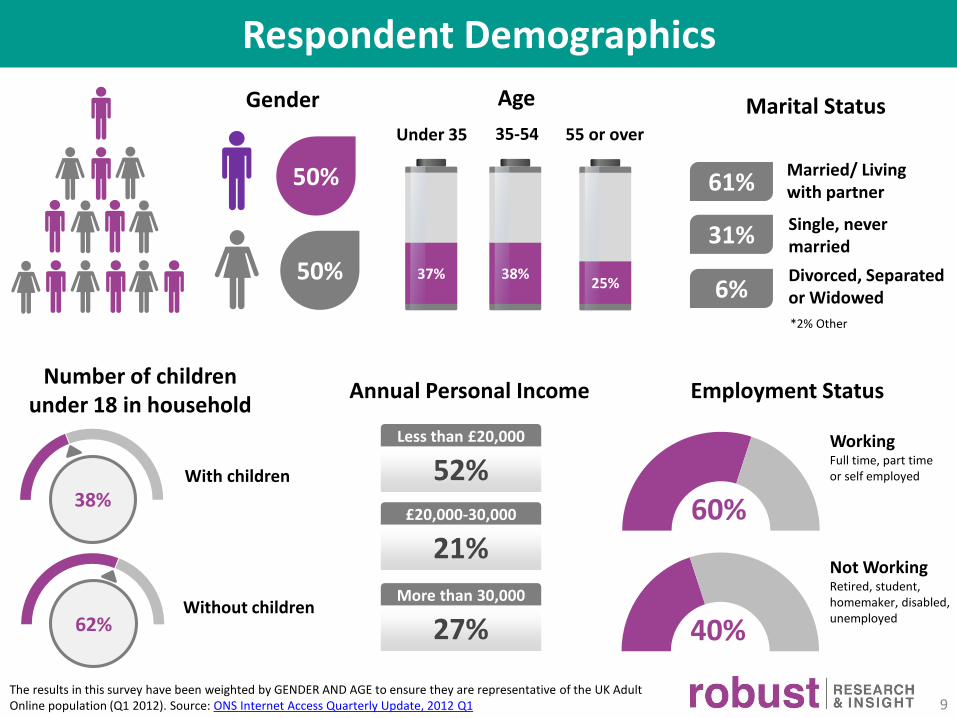
Respondent Demographics
Gender Age Marital Status
Annual Personal Income Employment Status
The results in this survey have been weighted by GENDER AND AGE to ensure they are representative of the UK Adult Online population (Q1 2012). Source: ONS Internet Access Quarterly Update, 2012 Q1
Number of children under 18 in household
50%
50%25%
37% 38%
Under 35 35-54 55 or over
61%
31%
6%
Married/ Living with partner
Single, never married
Divorced, Separated or Widowed
38%
62%
With children
Without children
60%
40%
WorkingFull time, part time or self employed
Not WorkingRetired, student, homemaker, disabled, unemployed
Less than £20,000
52%£20,000-30,000
21%
More than 30,000
27%
*2% Other
10
SECTION #1: Life Satisfaction
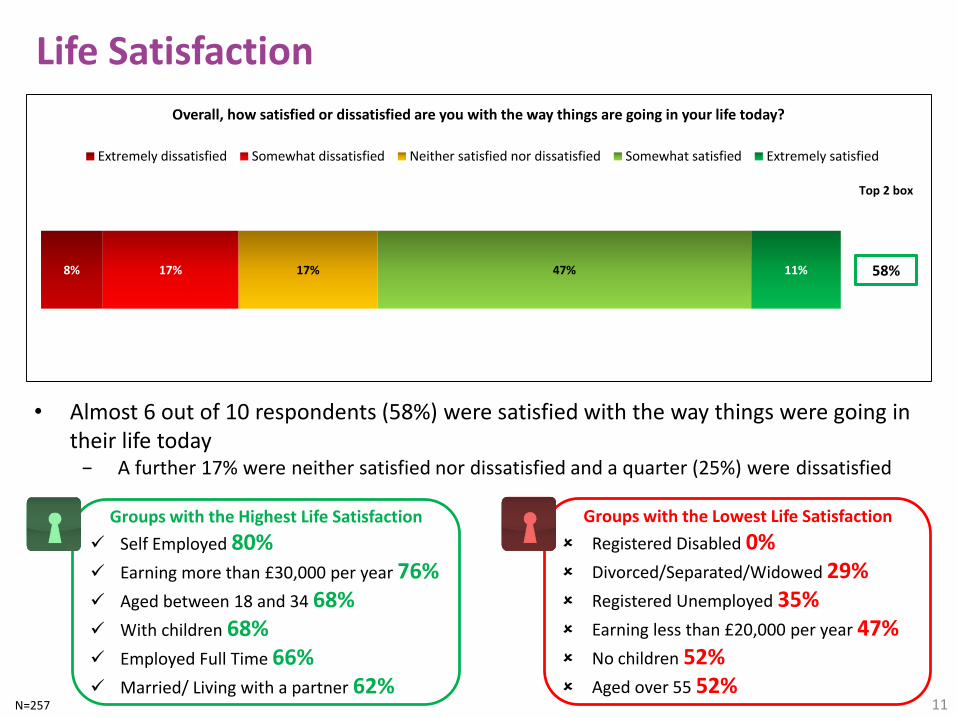
Life Satisfaction
8% 17% 17% 47% 11%
Overall, how satisfied or dissatisfied are you with the way things are going in your life today?
Extremely dissatisfied Somewhat dissatisfied Neither satisfied nor dissatisfied Somewhat satisfied Extremely satisfied
58%
Top 2 box
• Almost 6 out of 10 respondents (58%) were satisfied with the way things were going in their life today
− A further 17% were neither satisfied nor dissatisfied and a quarter (25%) were dissatisfied
Groups with the Lowest Life Satisfaction
Registered Disabled 0% Divorced/Separated/Widowed 29% Registered Unemployed 35% Earning less than £20,000 per year 47% No children 52% Aged over 55 52%
Groups with the Highest Life Satisfaction
Self Employed 80% Earning more than £30,000 per year 76% Aged between 18 and 34 68% With children 68% Employed Full Time 66% Married/ Living with a partner 62%
N=257 11
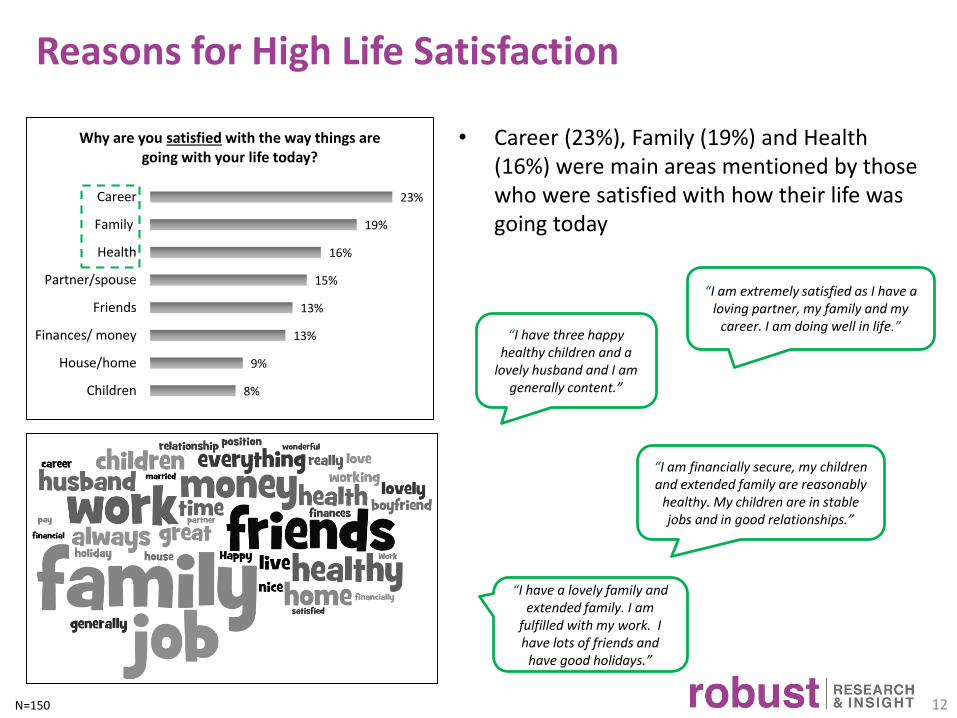
Reasons for High Life Satisfaction
12
8%
9%
13%
13%
15%
16%
19%
23%
Children
House/home
Finances/ money
Friends
Partner/spouse
Health
Family
Career
Why are you satisfied with the way things are going with your life today?
• Career (23%), Family (19%) and Health (16%) were main areas mentioned by those who were satisfied with how their life was going today
“I am extremely satisfied as I have a loving partner, my family and my
career. I am doing well in life.”
“I am financially secure, my children and extended family are reasonably
healthy. My children are in stable jobs and in good relationships.”
“I have three happy healthy children and a
lovely husband and I am generally content.”
“I have a lovely family and extended family. I am
fulfilled with my work. I have lots of friends and
have good holidays.”
N=150
13
Reasons for Low Life Satisfaction
N=164
3%
5%
6%
8%
15%
27%
29%
Old age
Single
Recession
Poor health
Dislike job
Can't find work
Lack of money
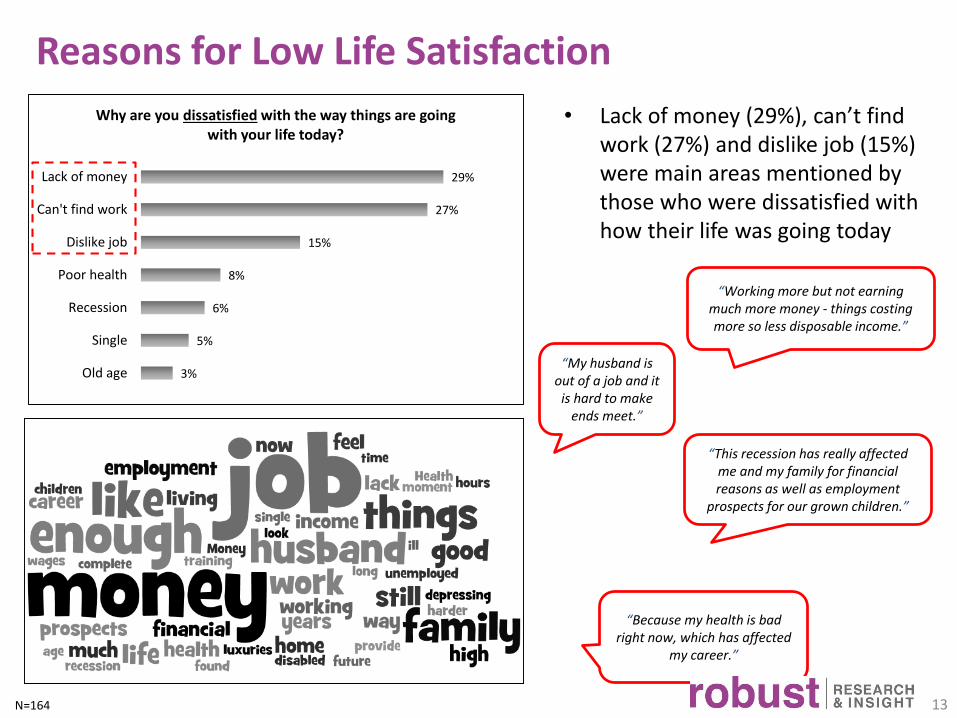
Why are you dissatisfied with the way things are going with your life today?
• Lack of money (29%), can’t find work (27%) and dislike job (15%) were main areas mentioned by those who were dissatisfied with how their life was going today
“Working more but not earning much more money - things costing more so less disposable income.”
“This recession has really affected me and my family for financial reasons as well as employment
prospects for our grown children.”
“My husband is out of a job and it
is hard to make ends meet.”
“Because my health is bad right now, which has affected
my career.”
Evaluating Aspects of Life Today
12%
13%
6%
9%
6%
7%
4%
7%
3%
2%
3%
3%
4%
33%
35%
17%
22%
27%
22%
14%
18%
16%
15%
12%
12%
10%
37%
35%
56%
47%
43%
44%
49%
35%
38%
33%
35%
31%
29%
13%
13%
16%
16%
17%
24%
25%
27%
21%
31%
29%
23%
24%
4%
5%
5%
6%
7%
4%
8%
13%
22%
19%
21%
31%
34%
Career
Financial situation
Place in society
Control over my destiny
Social life
Work/life balance
Education
Happiness
Relationship with my friends
Family
Relationship with my parents
Relationship with my partner
Relationship with my children
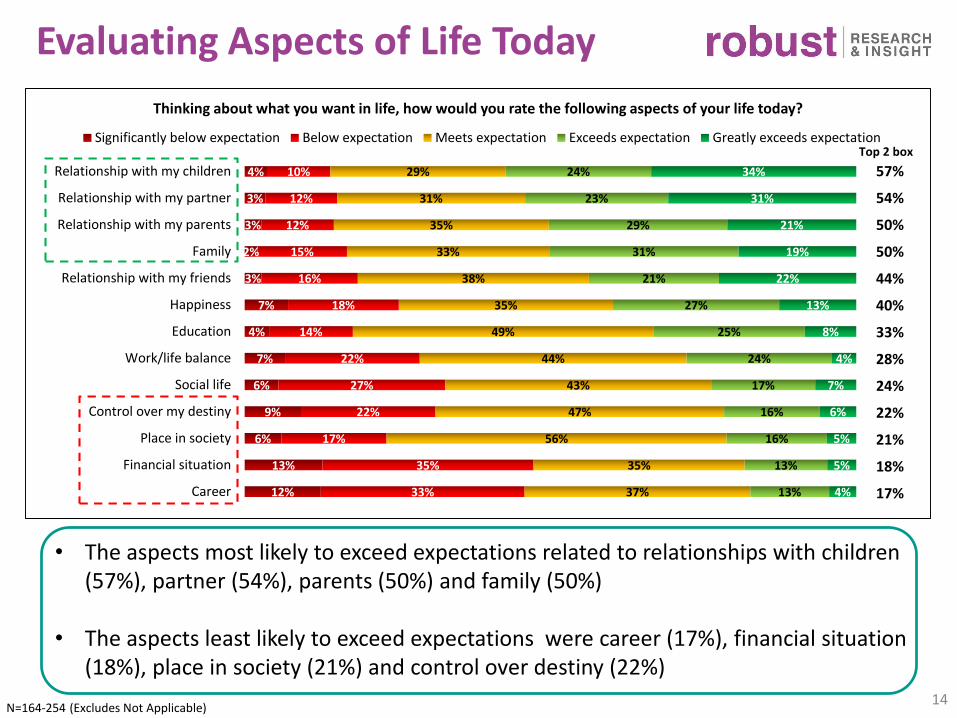
Thinking about what you want in life, how would you rate the following aspects of your life today?
Significantly below expectation Below expectation Meets expectation Exceeds expectation Greatly exceeds expectation
57%
54%
50%
50%
44%
40%
33%
28%
24%
22%
21%
18%
17%
Top 2 box
N=164-254 (Excludes Not Applicable)
• The aspects most likely to exceed expectations related to relationships with children (57%), partner (54%), parents (50%) and family (50%)
• The aspects least likely to exceed expectations were career (17%), financial situation (18%), place in society (21%) and control over destiny (22%)
14
Hopes for the Future
1%
2%
3%
4%
5%
5%
6%
7%
8%
11%
12%
15%
15%
16%
16%
16%
18%
19%
36%
57%
Move to the city
Send my children to a private school
Simplify my family life
Reduce work hours
Buy an investment property
Move to the country
Return to work
Promotion at work
Pursue more education
Get married
Volunteer/give back
Find the right partner
Change careers or start a business
Pursue a hobby
Pay off my home
Make more time for my family
Have children/ more children
Buy a home
Travel
Financial security
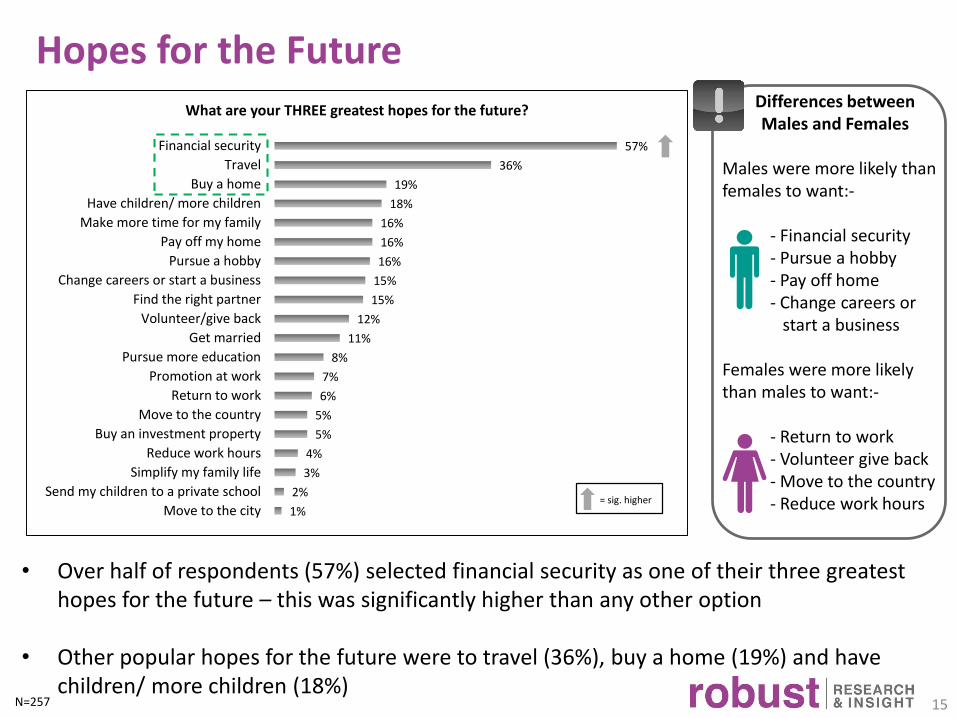
What are your THREE greatest hopes for the future?
• Over half of respondents (57%) selected financial security as one of their three greatest hopes for the future – this was significantly higher than any other option
• Other popular hopes for the future were to travel (36%), buy a home (19%) and have children/ more children (18%)
N=257
Differences between Males and Females
Males were more likely than females to want:-
- Financial security - Pursue a hobby - Pay off home - Change careers or
start a business
Females were more likely than males to want:-
- Return to work - Volunteer give back - Move to the country - Reduce work hours = sig. higher
15
Feelings About the Future
18% 48% 34%
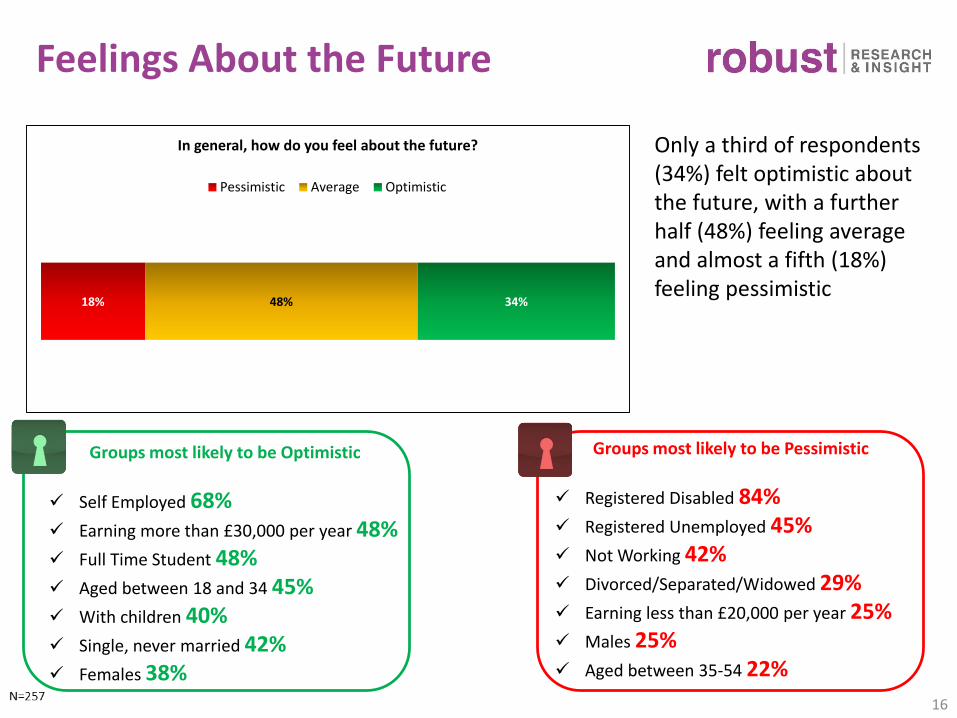
In general, how do you feel about the future?
Pessimistic Average Optimistic
Only a third of respondents (34%) felt optimistic about the future, with a further half (48%) feeling average and almost a fifth (18%) feeling pessimistic
Groups most likely to be Optimistic
Self Employed 68% Earning more than £30,000 per year 48% Full Time Student 48% Aged between 18 and 34 45% With children 40% Single, never married 42% Females 38%
Groups most likely to be Pessimistic
Registered Disabled 84% Registered Unemployed 45% Not Working 42% Divorced/Separated/Widowed 29% Earning less than £20,000 per year 25% Males 25% Aged between 35-54 22%
16
17
Lifestyles
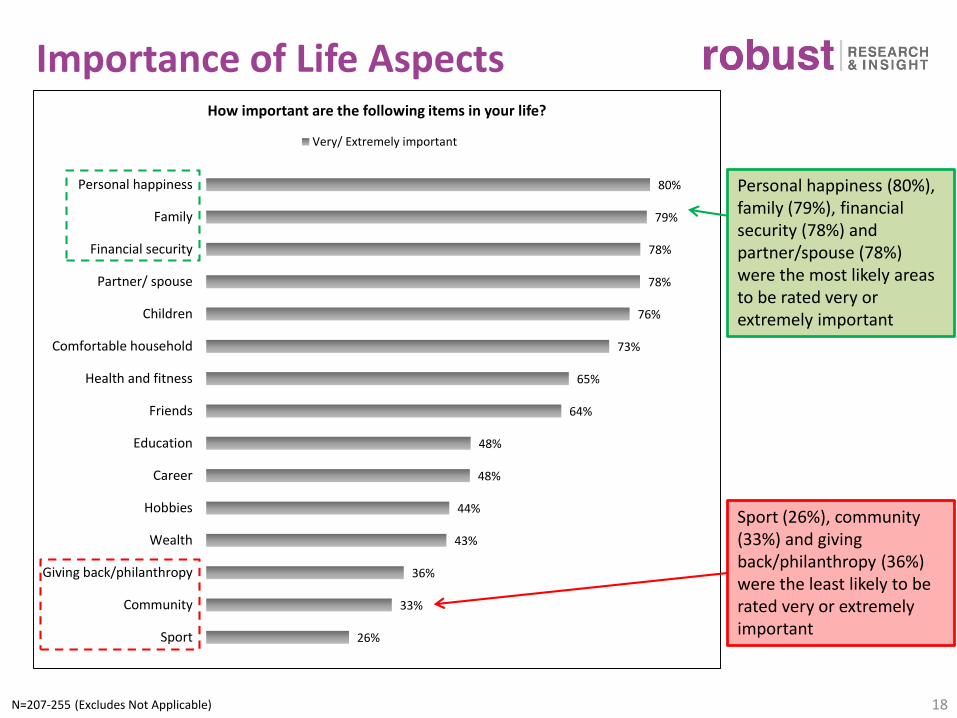
Importance of Life Aspects
Personal happiness (80%), family (79%), financial security (78%) and partner/spouse (78%) were the most likely areas to be rated very or extremely important
N=207-255 (Excludes Not Applicable) 18
26%
33%
36%
43%
44%
48%
48%
64%
65%
73%
76%
78%
78%
79%
80%
Sport
Community
Giving back/philanthropy
Wealth
Hobbies
Career
Education
Friends
Health and fitness
Comfortable household
Children
Partner/ spouse
Financial security
Family
Personal happiness
How important are the following items in your life?
Very/ Extremely important
Sport (26%), community (33%) and giving back/philanthropy (36%) were the least likely to be rated very or extremely important
Most Important Life Aspect
10%
11%
11%
20%
29%
Health and fitness
Partner/ spouse
Personal happiness
Children
Family
And what is the single most important thing in your life? (Top 5)
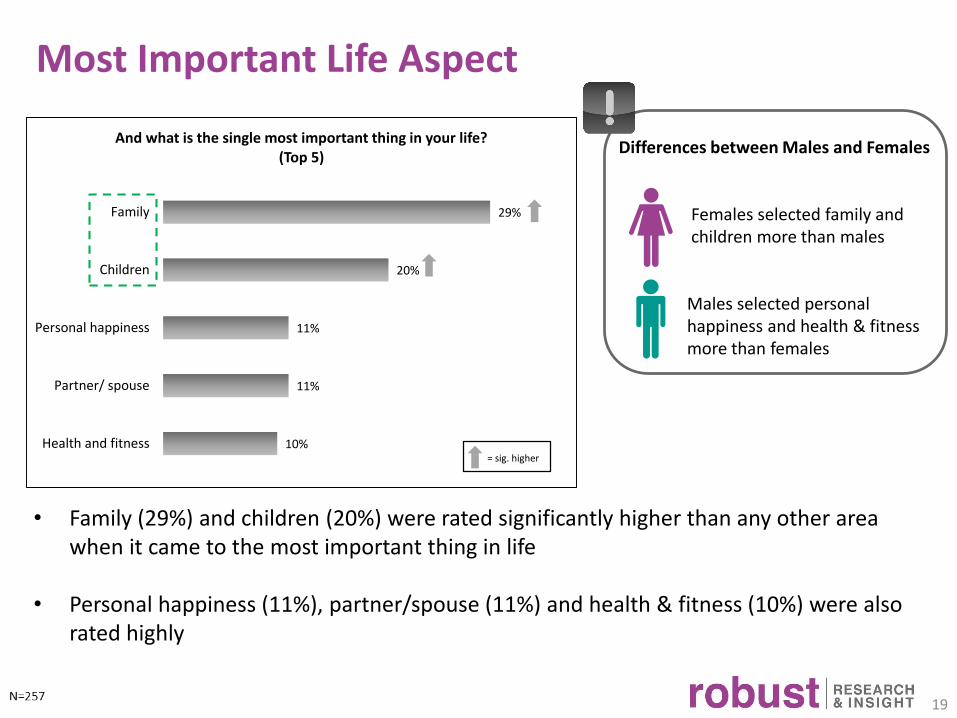
• Family (29%) and children (20%) were rated significantly higher than any other area when it came to the most important thing in life
• Personal happiness (11%), partner/spouse (11%) and health & fitness (10%) were also rated highly
19
= sig. higher
Differences between Males and Females
Females selected family and children more than males
Males selected personal happiness and health & fitness more than females
Allocation of Time
1.2
2.4
2.4
2.5
2.9
3.2
4.2
4.2
4.2
5.6
5.7
6.2
7.3
9.6
13.2
13.6
Volunteer activities
Shopping (for myself, family, home, gifts)
Household maintenance
Laundry
Grocery shopping
Exercising or playing sports
Reading
Cleaning
Family Activities
Socialising
Cooking
Personal hygiene / Grooming
Hobbies/Personal activities
Caring for children/kids activities
Watching television
Using the Internet (non-work related)
On average, how many hours per week do you spend on the following activities?
Number of hours per week
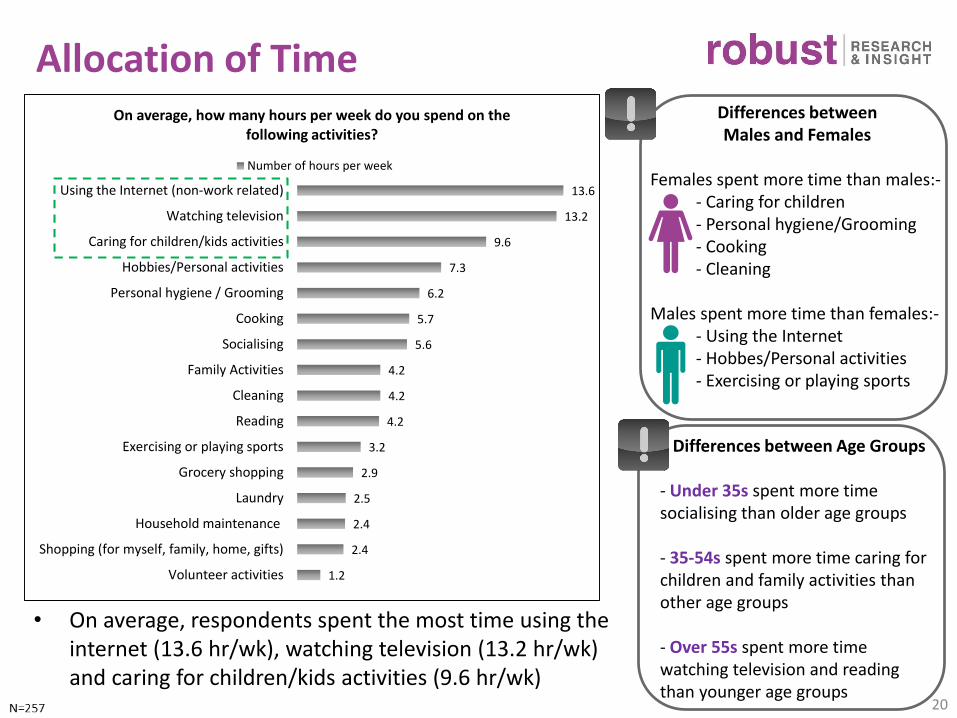
Differences between Males and Females
Females spent more time than males:-- Caring for children- Personal hygiene/Grooming- Cooking- Cleaning
Males spent more time than females:-- Using the Internet - Hobbes/Personal activities- Exercising or playing sports
20
Differences between Age Groups
- Under 35s spent more time socialising than older age groups
- 35-54s spent more time caring for children and family activities than other age groups
- Over 55s spent more time watching television and reading than younger age groups
• On average, respondents spent the most time using the internet (13.6 hr/wk), watching television (13.2 hr/wk) and caring for children/kids activities (9.6 hr/wk)
Allocation of an Extra Few Hours Per Week
4%
5%
9%
11%
14%
14%
18%
18%
18%
18%
28%
30%
32%
33%
Watching television
Working
Reading magazines, books, journals
Catching up with extended family
Surfing the internet
Playing with my children
Completing everyday tasks & chores
Giving back/volunteering
Studying/learning
Pursuing my hobby
Catching up with friends
Spending time with my partner
Me time – doing things that I enjoy
Exercising/personal fitness
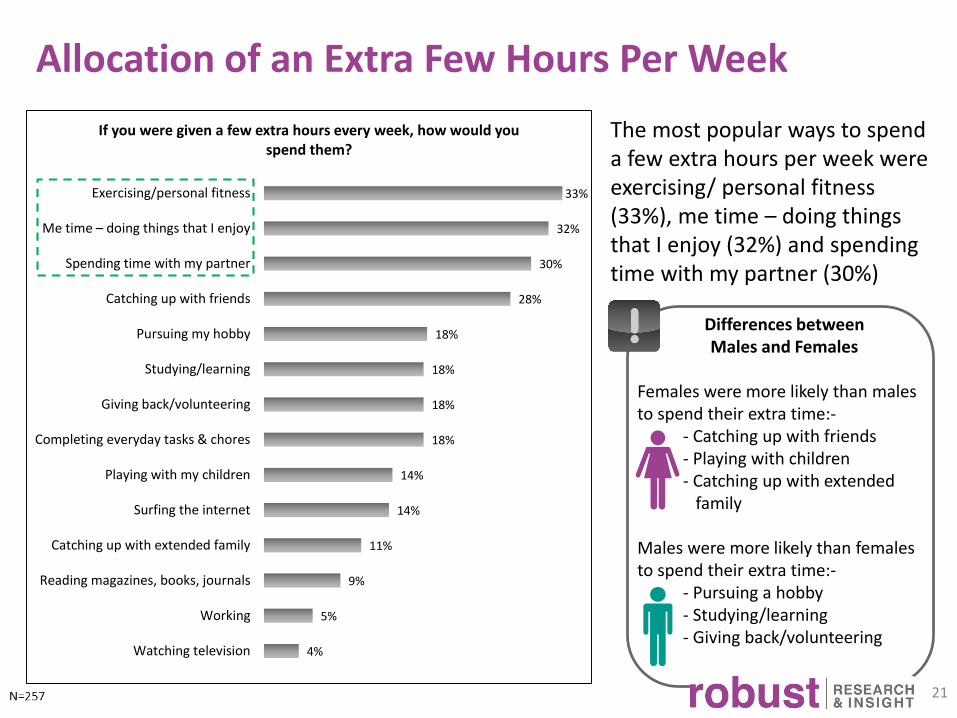
If you were given a few extra hours every week, how would you spend them?
The most popular ways to spend a few extra hours per week were exercising/ personal fitness (33%), me time – doing things that I enjoy (32%) and spending time with my partner (30%)
21
Differences between Males and Females
Females were more likely than males to spend their extra time:-
- Catching up with friends- Playing with children- Catching up with extended
family
Males were more likely than females to spend their extra time:-
- Pursuing a hobby- Studying/learning- Giving back/volunteering
22
Spending Habits
Personal Finance Situation
7%
30%
47%
17%
Don't even have enough to meet basicexpenses
Just meet your basic living expenses
Meet your basic expenses with a littleleft over for extras
Live comfortably with little financialworries
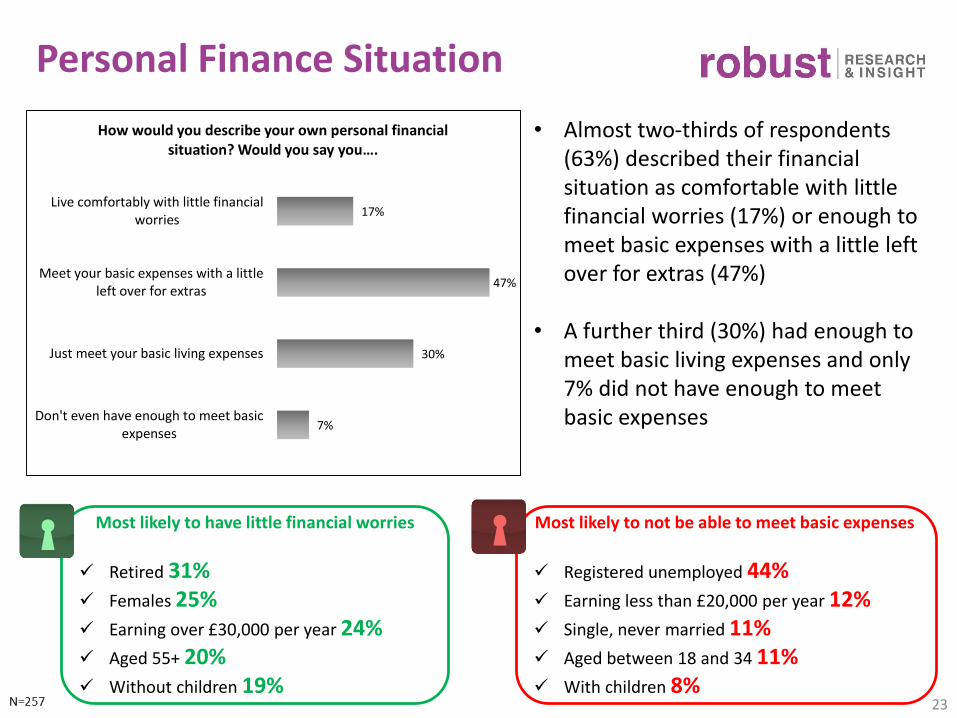
How would you describe your own personal financial situation? Would you say you….
23
• Almost two-thirds of respondents (63%) described their financial situation as comfortable with little financial worries (17%) or enough to meet basic expenses with a little left over for extras (47%)
• A further third (30%) had enough to meet basic living expenses and only 7% did not have enough to meet basic expenses
Most likely to have little financial worries
Retired 31% Females 25% Earning over £30,000 per year 24% Aged 55+ 20% Without children 19%
Most likely to not be able to meet basic expenses
Registered unemployed 44% Earning less than £20,000 per year 12% Single, never married 11% Aged between 18 and 34 11% With children 8%
24
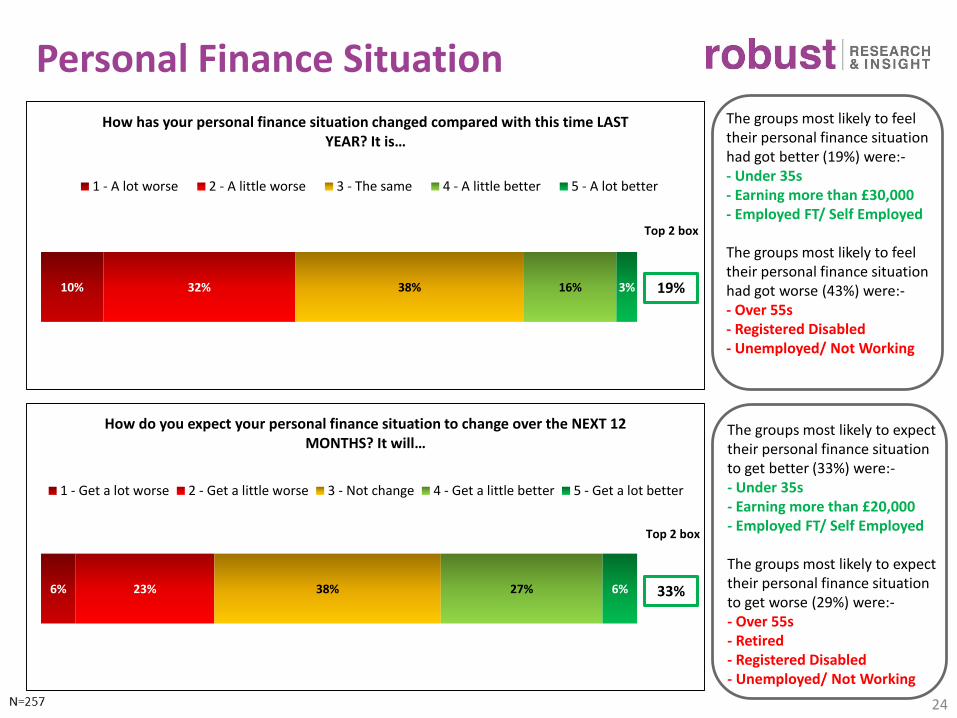
10% 32% 38% 16% 3%
How has your personal finance situation changed compared with this time LAST YEAR? It is…
1 - A lot worse 2 - A little worse 3 - The same 4 - A little better 5 - A lot better
Personal Finance Situation
6% 23% 38% 27% 6%
How do you expect your personal finance situation to change over the NEXT 12 MONTHS? It will…
1 - Get a lot worse 2 - Get a little worse 3 - Not change 4 - Get a little better 5 - Get a lot better
The groups most likely to feel their personal finance situation had got better (19%) were:-- Under 35s- Earning more than £30,000- Employed FT/ Self Employed
The groups most likely to feel their personal finance situation had got worse (43%) were:-- Over 55s- Registered Disabled- Unemployed/ Not Working
The groups most likely to expect their personal finance situation to get better (33%) were:-- Under 35s- Earning more than £20,000- Employed FT/ Self Employed
The groups most likely to expect their personal finance situation to get worse (29%) were:-- Over 55s- Retired- Registered Disabled- Unemployed/ Not Working
Top 2 box
19%
Top 2 box
33%
25
17%
11%
2%
4%
17%
15%
11%
10%
27%
28%
28%
17%
23%
22%
38%
35%
15%
24%
22%
33%
In a year from now I am sure that I will be financially better off
In the last 12 months I have felt financially a lot worse off thanbefore
I plan ahead more than I used to when it comes to money
I have made a conscious effort to spend less money recently
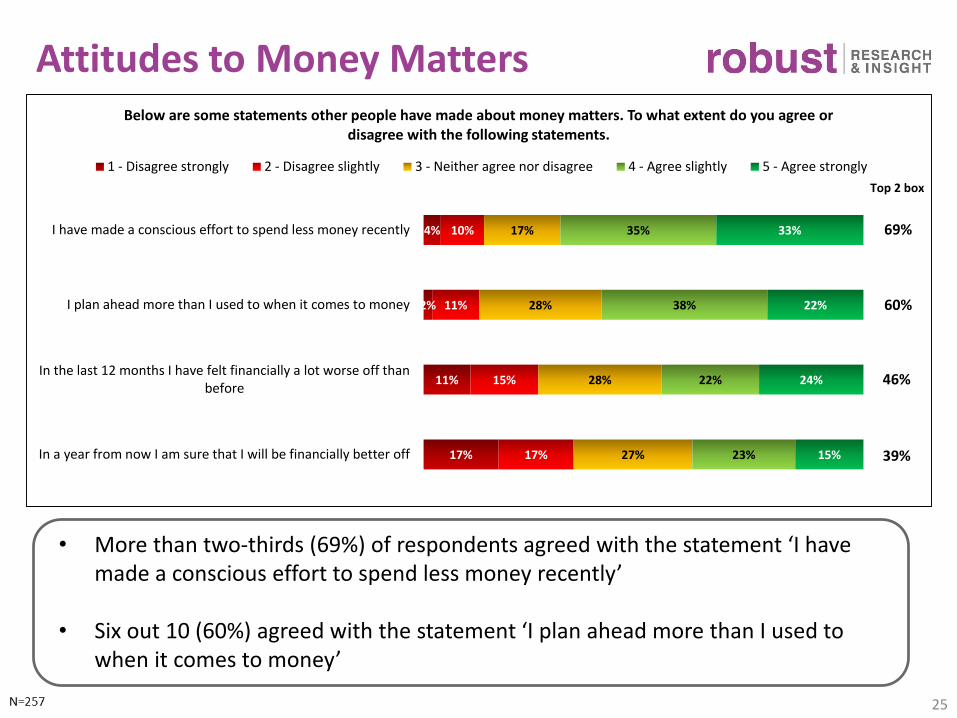
Below are some statements other people have made about money matters. To what extent do you agree or disagree with the following statements.
1 - Disagree strongly 2 - Disagree slightly 3 - Neither agree nor disagree 4 - Agree slightly 5 - Agree strongly
Attitudes to Money Matters
Top 2 box
69%
60%
46%
39%
• More than two-thirds (69%) of respondents agreed with the statement ‘I have made a conscious effort to spend less money recently’
• Six out 10 (60%) agreed with the statement ‘I plan ahead more than I used to when it comes to money’
26
6%
7%
9%
9%
10%
10%
11%
15%
17%
17%
18%
24%
25%
31%
43%
Childcare costs
Cuts in government benefits
Mortgage costs
Pay freeze
Saving for a pension
Insurance costs
Fear of losing my job or having my working hours cut
Rent costs
Debt repayments
Public transport costs
Difficulties finding a job
Food costs
Motoring costs
Lack of savings
Utility costs (gas, electricity and water bills)
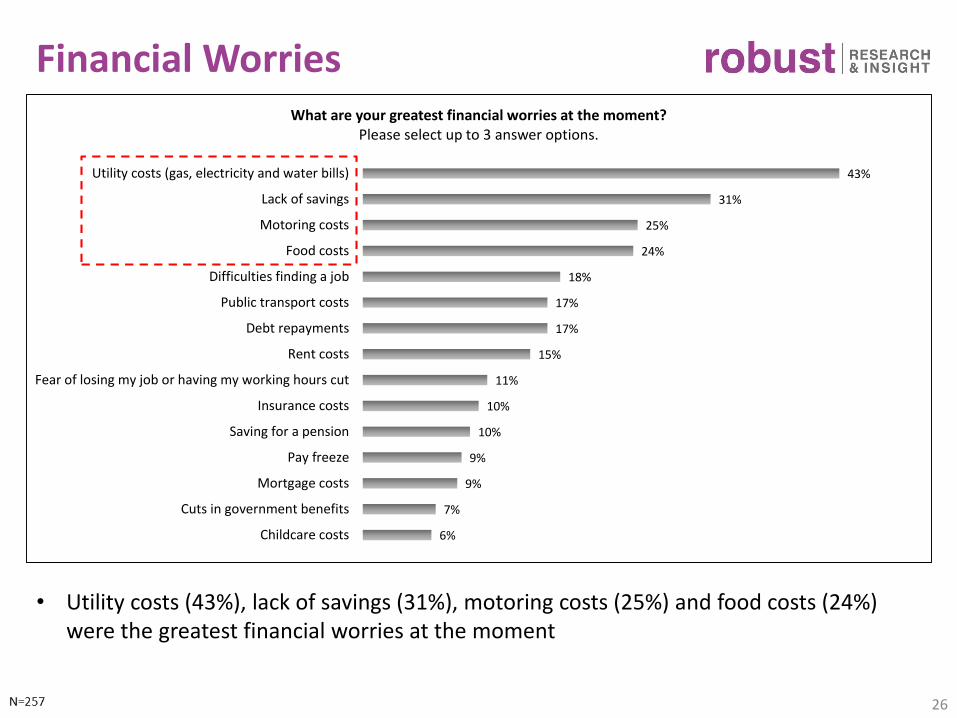
What are your greatest financial worries at the moment? Please select up to 3 answer options.
Financial Worries
• Utility costs (43%), lack of savings (31%), motoring costs (25%) and food costs (24%) were the greatest financial worries at the moment
27
37%
20%
19%
14%
5%
21%
21%
16%
13%
6%
9%
6%
3%
16%
19%
16%
19%
22%
14%
17%
12%
13%
23%
26%
31%
29%
26%
36%
32%
13%
17%
23%
23%
41%
46%
38%
53%
I sometimes have to use credit to pay my bills
I sometimes have trouble keeping on top of my bills
I often run short of cash before my next payday
My family would help me out if I was ever struggling to make ends meet
I am spending more on everyday essentials and less on treating myselfthan 12 months ago
I am spending more on petrol / transport than I did 12 months ago
I am spending more on supermarket shopping than I did 12 months ago
I am paying more on my household bills including gas and electricitythan I did 12 months ago
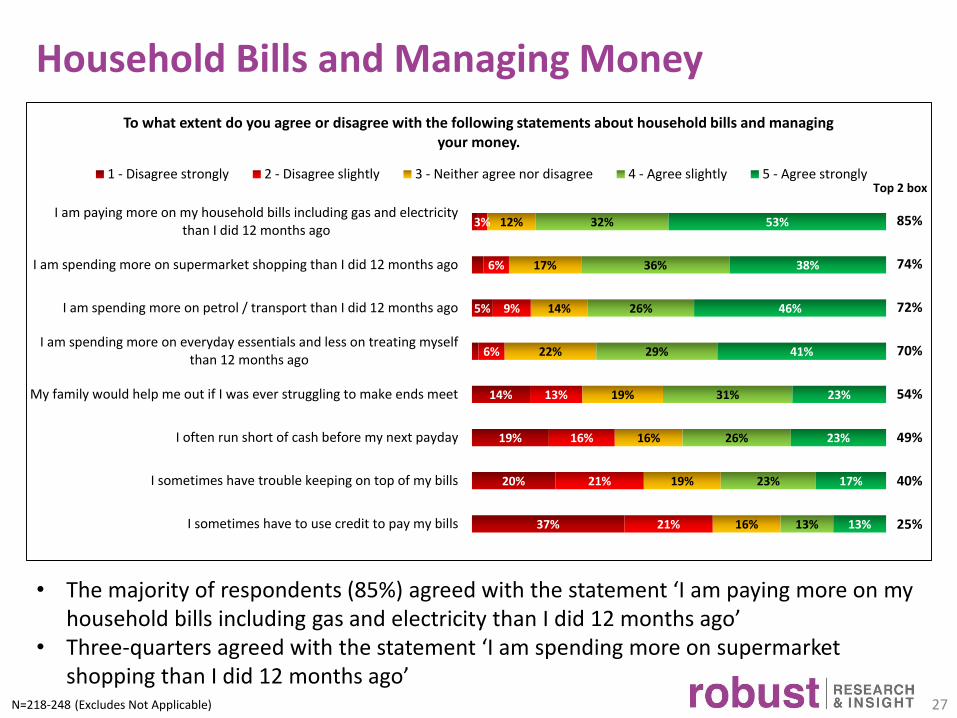
To what extent do you agree or disagree with the following statements about household bills and managing your money.
1 - Disagree strongly 2 - Disagree slightly 3 - Neither agree nor disagree 4 - Agree slightly 5 - Agree strongly
Household Bills and Managing Money
85%
74%
72%
70%
54%
49%
40%
25%
Top 2 box
• The majority of respondents (85%) agreed with the statement ‘I am paying more on my household bills including gas and electricity than I did 12 months ago’
• Three-quarters agreed with the statement ‘I am spending more on supermarket shopping than I did 12 months ago’
N=218-248 (Excludes Not Applicable)
28
37%
63%
No
Yes
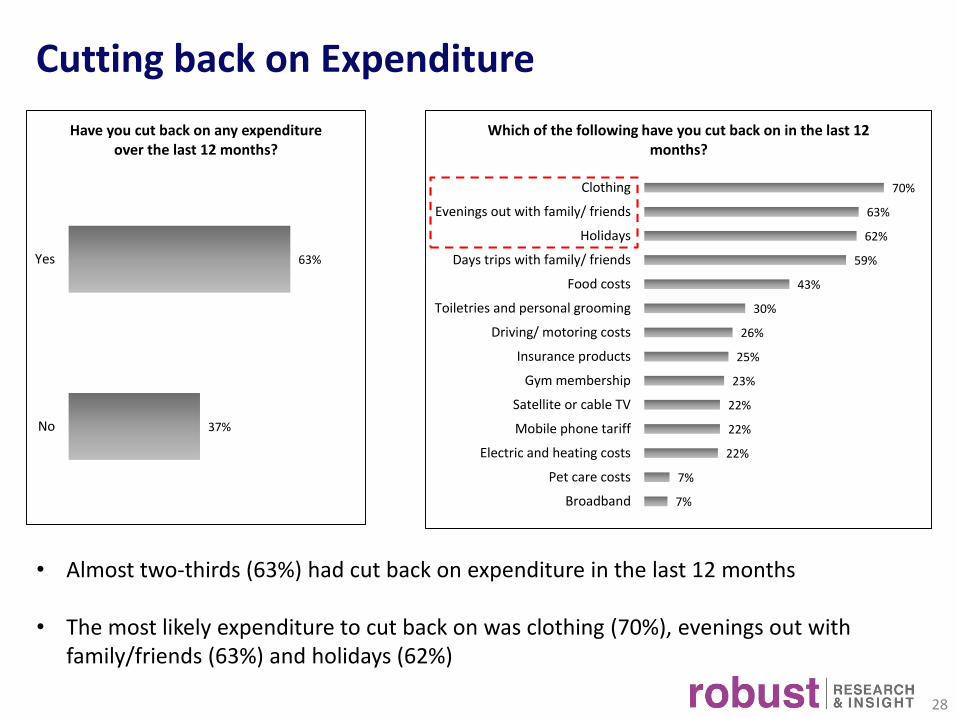
Have you cut back on any expenditure over the last 12 months?
Cutting back on Expenditure
7%
7%
22%
22%
22%
23%
25%
26%
30%
43%
59%
62%
63%
70%
Broadband
Pet care costs
Electric and heating costs
Mobile phone tariff
Satellite or cable TV
Gym membership
Insurance products
Driving/ motoring costs
Toiletries and personal grooming
Food costs
Days trips with family/ friends
Holidays
Evenings out with family/ friends
Clothing
Which of the following have you cut back on in the last 12 months?
• Almost two-thirds (63%) had cut back on expenditure in the last 12 months
• The most likely expenditure to cut back on was clothing (70%), evenings out with family/friends (63%) and holidays (62%)
29
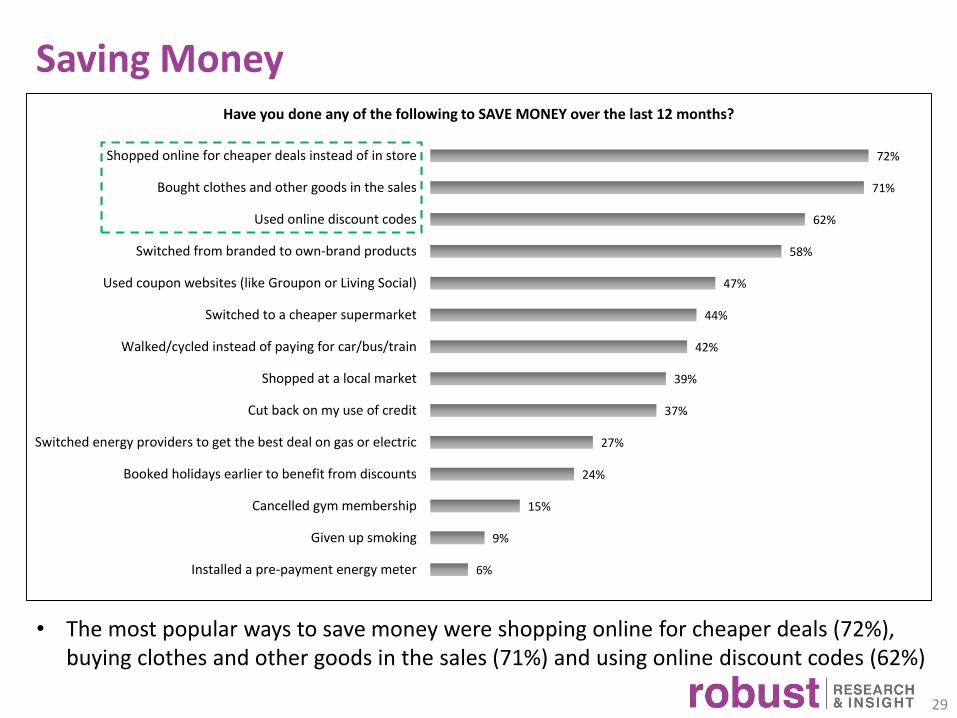
6%
9%
15%
24%
27%
37%
39%
42%
44%
47%
58%
62%
71%
72%
Installed a pre-payment energy meter
Given up smoking
Cancelled gym membership
Booked holidays earlier to benefit from discounts
Switched energy providers to get the best deal on gas or electric
Cut back on my use of credit
Shopped at a local market
Walked/cycled instead of paying for car/bus/train
Switched to a cheaper supermarket
Used coupon websites (like Groupon or Living Social)
Switched from branded to own-brand products
Used online discount codes
Bought clothes and other goods in the sales
Shopped online for cheaper deals instead of in store
Have you done any of the following to SAVE MONEY over the last 12 months?
Saving Money
• The most popular ways to save money were shopping online for cheaper deals (72%), buying clothes and other goods in the sales (71%) and using online discount codes (62%)
30
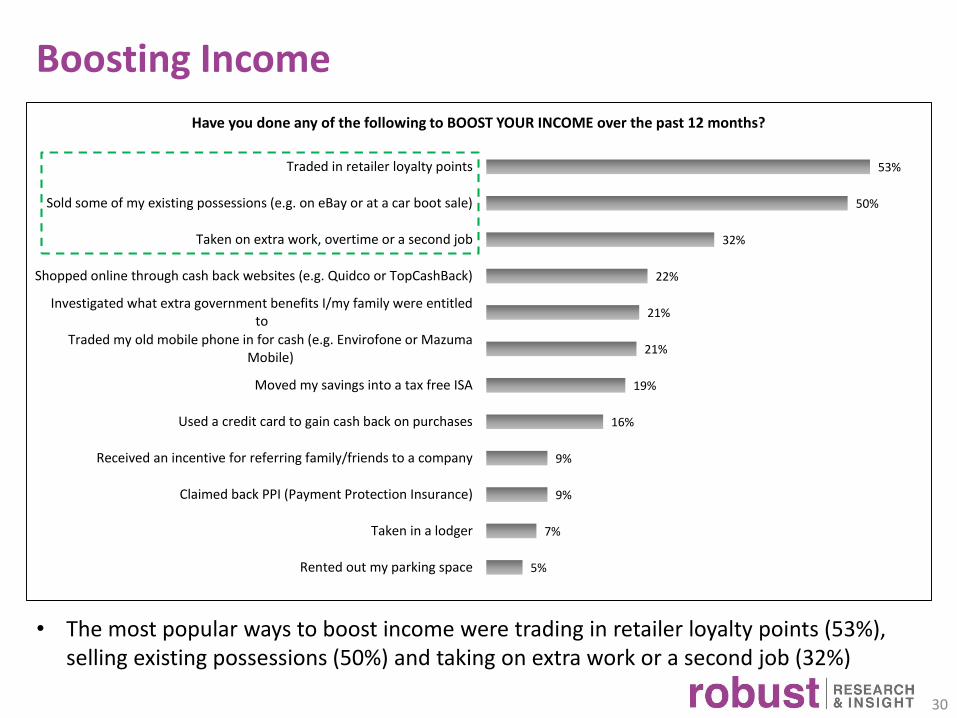
5%
7%
9%
9%
16%
19%
21%
21%
22%
32%
50%
53%
Rented out my parking space
Taken in a lodger
Claimed back PPI (Payment Protection Insurance)
Received an incentive for referring family/friends to a company
Used a credit card to gain cash back on purchases
Moved my savings into a tax free ISA
Traded my old mobile phone in for cash (e.g. Envirofone or MazumaMobile)
Investigated what extra government benefits I/my family were entitledto
Shopped online through cash back websites (e.g. Quidco or TopCashBack)
Taken on extra work, overtime or a second job
Sold some of my existing possessions (e.g. on eBay or at a car boot sale)
Traded in retailer loyalty points
Have you done any of the following to BOOST YOUR INCOME over the past 12 months?
Boosting Income
• The most popular ways to boost income were trading in retailer loyalty points (53%), selling existing possessions (50%) and taking on extra work or a second job (32%)
31
Thank you – we hope you found the results of this survey interesting and useful.
For more information about this survey or to discuss the Robust Insight Consumer Panel in
more detail please contact Scott Owens on 078252 69235 or email us info@robust-
insight.co.uk
Robust Insight | Website: www.robust-insight.co.uk | Telephone: 078252 69235 | Email: [email protected]