Lifestyles and Energy Consumption in Households · Lifestyles and Energy Consumption in Households...
49
Lifestyles and Energy Consumption in Households Toru Matsumoto The University of Kitakyushu East-west Center, Honolulu, HI, USA Feb. 4-5, 2003
Transcript of Lifestyles and Energy Consumption in Households · Lifestyles and Energy Consumption in Households...

Lifestyles and Energy Consumption in Households
Toru MatsumotoThe University of Kitakyushu
East-west Center, Honolulu, HI, USAFeb. 4-5, 2003

CONTENTS
1. Introduction
2. Lifestyles and energy consumption
3. Modeling for energy demand of res/com sectors
4. Projection of energy consumption and CO2 emission
5. Future directions

1. Introduction

Introduction
?Further expansion of Asian mega-cities?Urbanization?Increase in per capita income
synergistic effect
Energy consumption by residential and commercial sectors will drastically increase.
Not even considering air population issues in urban areas, urban activities hold an important key for future global warming issues also.

Comparison of 4 Cities on Population, Area and Population Density
Tokyo Seoul Beijing ShanghaiPopulation (103) 12,059 10,373 12,780 13,216Area ( sq.km) 2,102 606 16,808 6,341Population density (persons/sq.km) 5,737 17,132 760 2,084Data Source: Tokyo Statistical Yearbook 2001, Statistical Yearbook Seoul 2001, Statistical Yearbook of Beijing 2001, Statistical Yearbook of Shanghai 2001.
2. Lifestyles and Energy Consumption

Trends in GRP per Capita
010,00020,00030,00040,00050,00060,00070,00080,00090,000
1980 1985 1990 1995 2000
TokyoSeoulBeijingShanghai
(USD at 1995 price)

0
20
40
60
80
100
120
140
160
1975 1980 1985 1990 1995 2000
(m2/ hds.)
Beijing (Rural)
Tokyo
Shanghai (Rural)
Beijing (Urban)
Shanghai(Urban) 0
1
2
3
4
5
6
1975 1980 1985 1990 1995 2000
Shanghai
Tokyo
Beijing (Urban) Beijing (Rural)
Seoul
(persons/hds.)
Trends in Flour Space and Size of Household
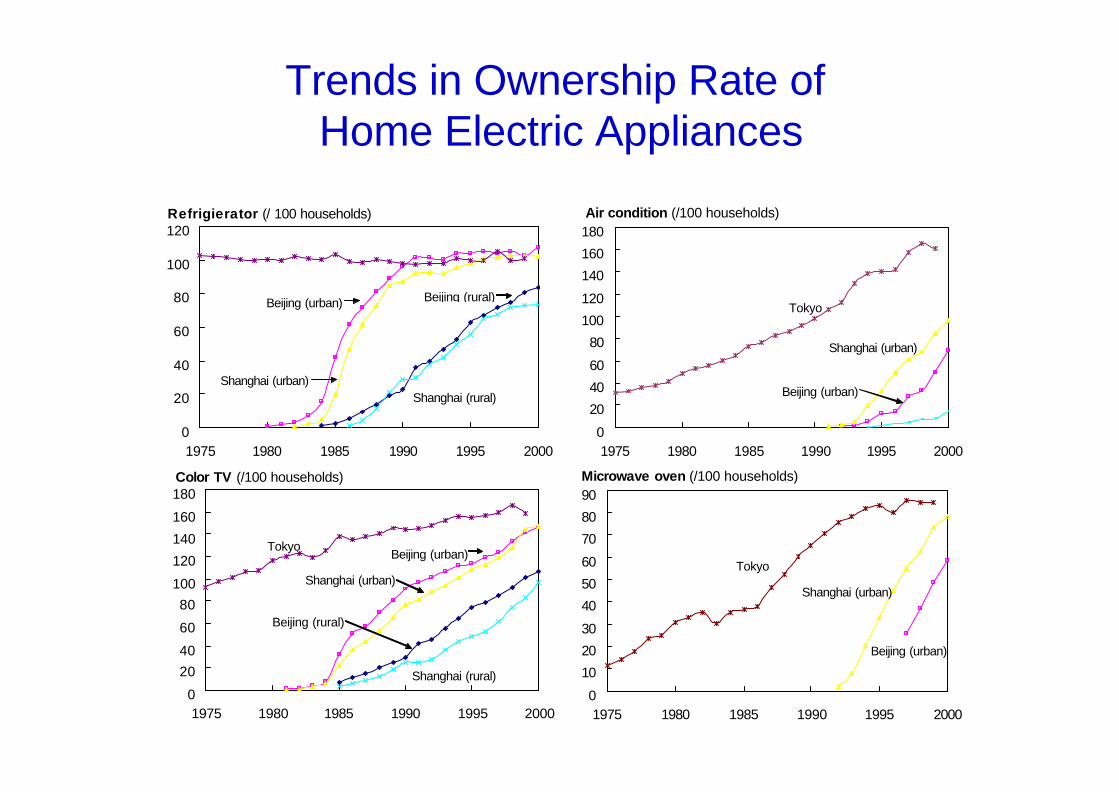
Trends in Ownership Rate ofHome Electric Appliances
0102030405060708090
1975 1980 1985 1990 1995 2000
Microwave oven (/100 households)
Tokyo
Shanghai (urban)
Beijing (urban)
020406080
100120140160180
1975 1980 1985 1990 1995 2000
Tokyo Beijing (urban)
Shanghai (urban)
Shanghai (rural)
Beijing (rural)
Color TV (/100 households)
020406080
100120140160180
1975 1980 1985 1990 1995 2000
Air condition (/100 households)
Beijing (urban)
Shanghai (urban)
Tokyo
0
20
40
60
80
100
120
1975 1980 1985 1990 1995 2000
Beijing (urban)
Shanghai (urban)Shanghai (rural)
Beijing (rural)
Refrigierator (/ 100 households)

Trends in Share of HouseholdUsing Town Gas and LPG
0
20
40
60
80
100
1975 1980 1985 1990 1995 2000Tokyo (town gas) Tokyo (LPG) Beijing (coke gas)Beijing (LPG) Beijing (natural gas) Shanghai (coke gas)Shanghai (LPG)

Trends of Energy Efficiency COP (Coefficient of Performance)
0
0.5
1
1.5
2
2.5
3
3.5
1975 1978 1981 1984 1987 1990 1993 1996
HeatingCooling
Electric energy consumption of Refrigerator stock
0
20
40
60
80
100
120
140
160
1975 1978 1981 1984 1987 1990 1993 1996
(kW
h/?
)
(case of Tokyo)

Trends of Housing Property
Share of insulating housing
0
10
20
30
40
50
60
70
80
90
1975 1978 1981 1984 1987 1990 1993 1996
(%
)
Detached houseApartment
(case of Tokyo)

Energy Consumption in Residential Sector
0
1
2
3
4
5
6
7
1975 1980 1985 1990 1995 2000
TokyoSeoulBeijingShanghai
(106 TOE)
per Household
0.00.20.40.60.81.01.21.41.61.8
1980 1985 1990 1995 2000
TokyoSeoulBeijingShanghai
(TOE/ y

Compositional Changes of Residential Energy Consumption
0%
20%
40%
60%
80%
100%
1990
2000
1990
2000
1990
2000
1990
2000
ElectricityHeatDieselHeavy oil KeroseneNatural gasLPGCoke gasTown gasCoal
Beijing ShanghaiTokyo Seoul
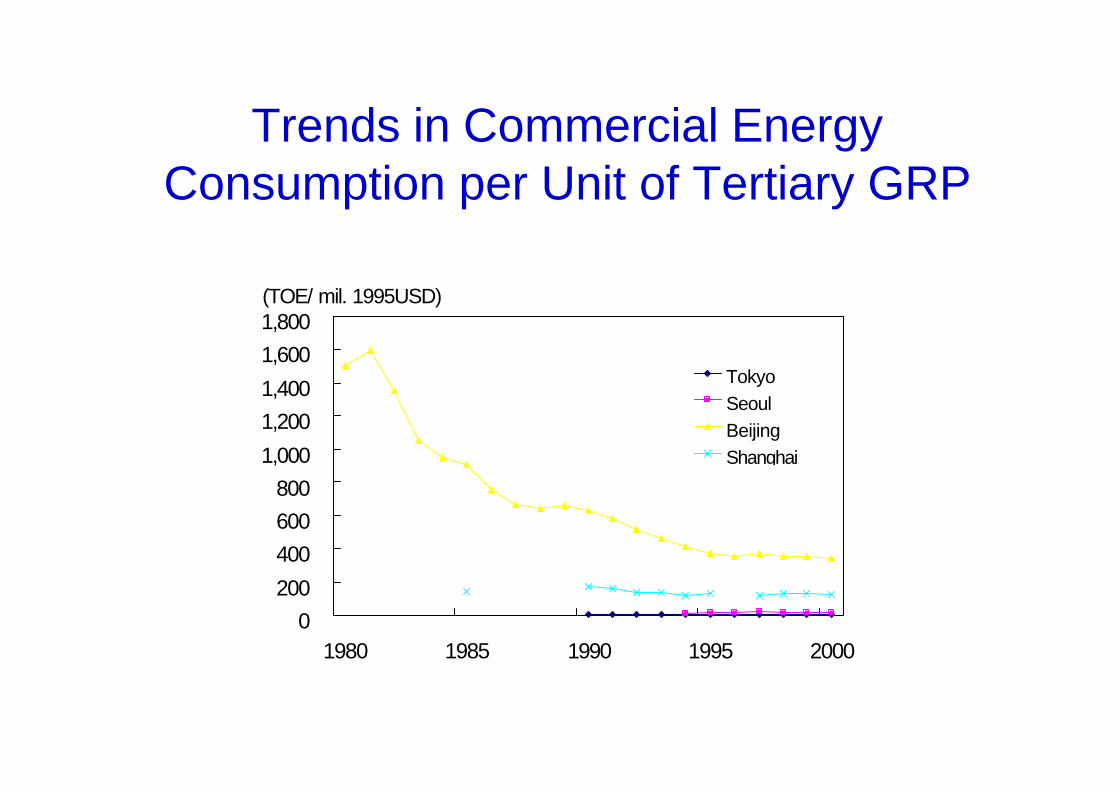
0200400600800
1,0001,2001,4001,6001,800
1980 1985 1990 1995 2000
TokyoSeoulBeijingShanghai
(TOE/ mil. 1995USD)
Trends in Commercial Energy Consumption per Unit of Tertiary GRP
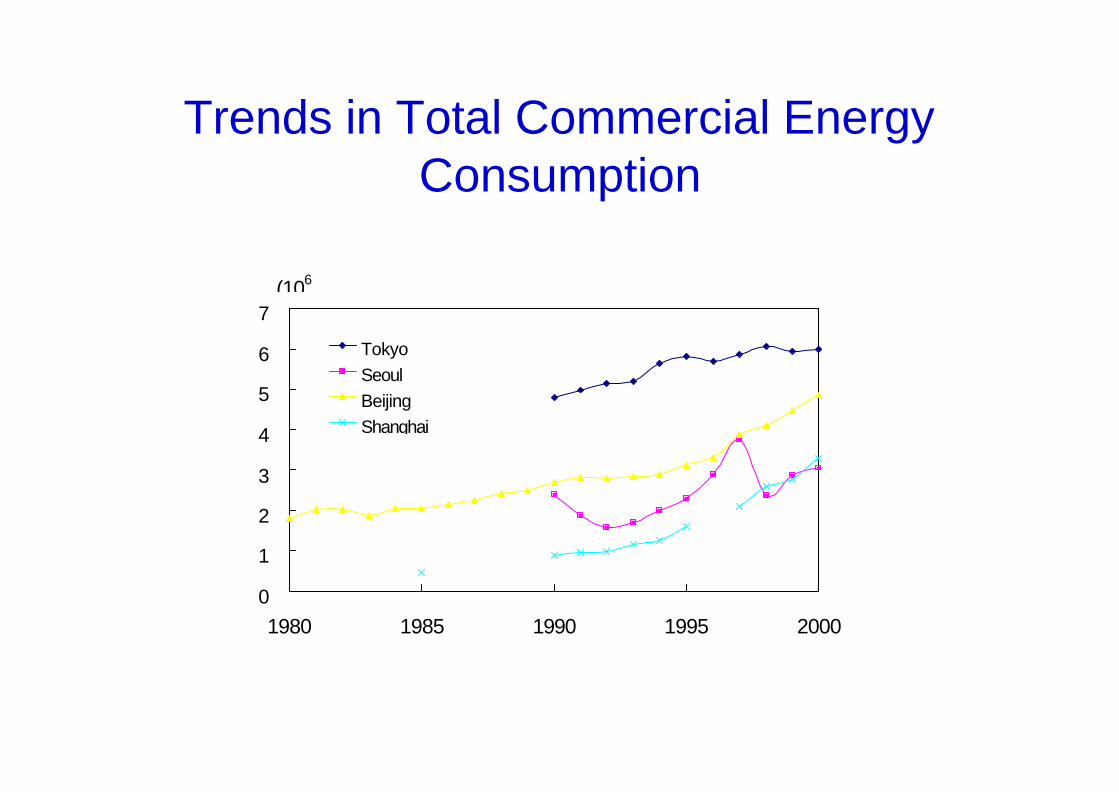
Trends in Total Commercial Energy Consumption
0
1
2
3
4
5
6
7
1980 1985 1990 1995 2000
TokyoSeoulBeijingShanghai
(106
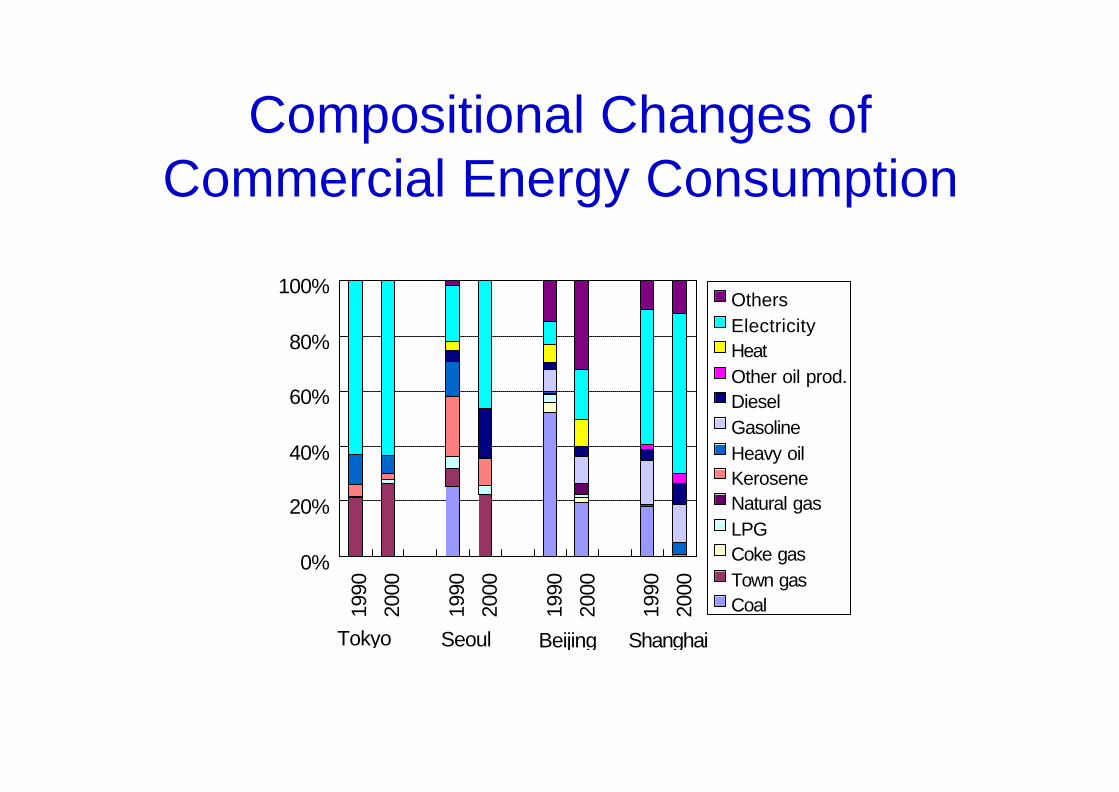
0%
20%
40%
60%
80%
100%
1990
2000
1990
2000
1990
2000
1990
2000
OthersElectricityHeatOther oil prod.DieselGasolineHeavy oilKeroseneNatural gasLPGCoke gasTown gasCoal
Tokyo Seoul Beijing Shanghai
Compositional Changes of Commercial Energy Consumption
3. Modeling for Energy Demand of Residential &
Commercial Sectors

Tokyo Seoul Beijing Shanghai
? × × ×? ? ? ?? × × ×? ? ? ?
Detached ? ?Note
?Note
?Note
Apartment ? ?Note
?Note
?Note
? × ? ?? × × ×? ? ? ?? ? ? ?? × × ×? ? ? ?? ? ? ?
Climate factor Cooling degree dayHeating degree day
Water consumption for residential use per household
Energy priceBy energy typesBy usages
Residential buildingproperty
Floor space
Insulated rate
Energy consumptionappliance
Possession rateEnergy efficiency factor
Energy consumptionBy usage types and energy typesBy energy typesBy usage types and energy types
Data Availability for Residential Sector
Note: intrusive rate of heat
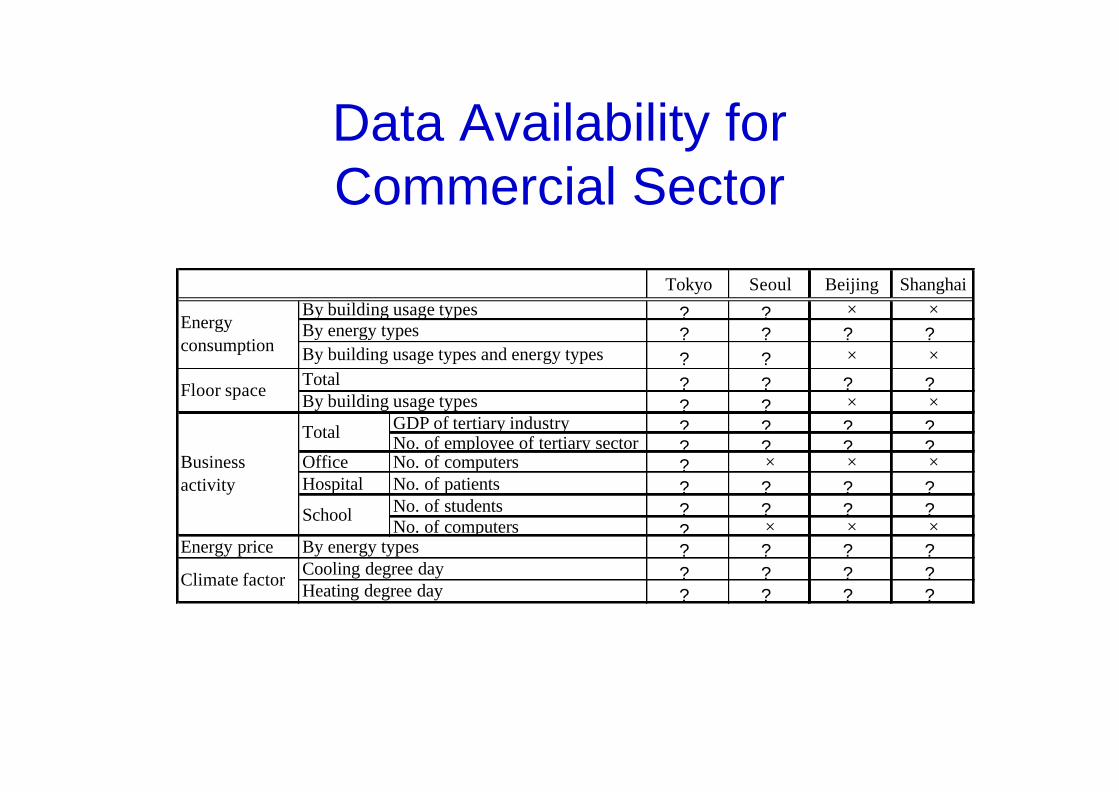
Data Availability for Commercial Sector
Tokyo Seoul Beijing Shanghai
? ? × ×? ? ? ?? ? × ×
? ? ? ?? ? × ×
GDP of tertiary industry ? ? ? ?No. of employee of tertiary sector ? ? ? ?
Office No. of computers ? × × ×Hospital No. of patients ? ? ? ?
No. of students ? ? ? ?No. of computers ? × × ×
Energy price ? ? ? ?? ? ? ?? ? ? ?
By energy types
Climate factor Cooling degree dayHeating degree day
Floor space TotalBy building usage types
Businessactivity
Total
School
Energyconsumption
By building usage typesBy energy typesBy building usage types and energy types
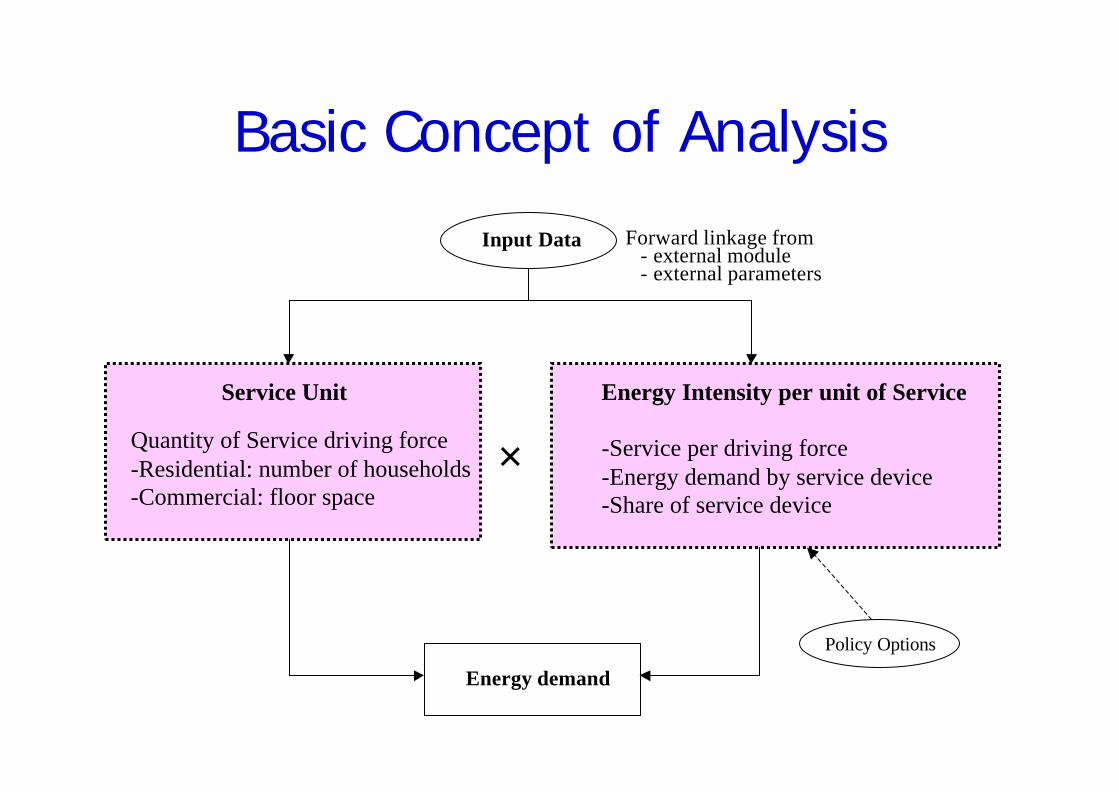
Basic Concept of Analysis
Quantity of Service driving force-Residential: number of households-Commercial: floor space
-Service per driving force-Energy demand by service device-Share of service device
Service Unit
Policy Options
Energy Intensity per unit of Service
Energy demand
Input Data Forward linkage from- external module- external parameters
×
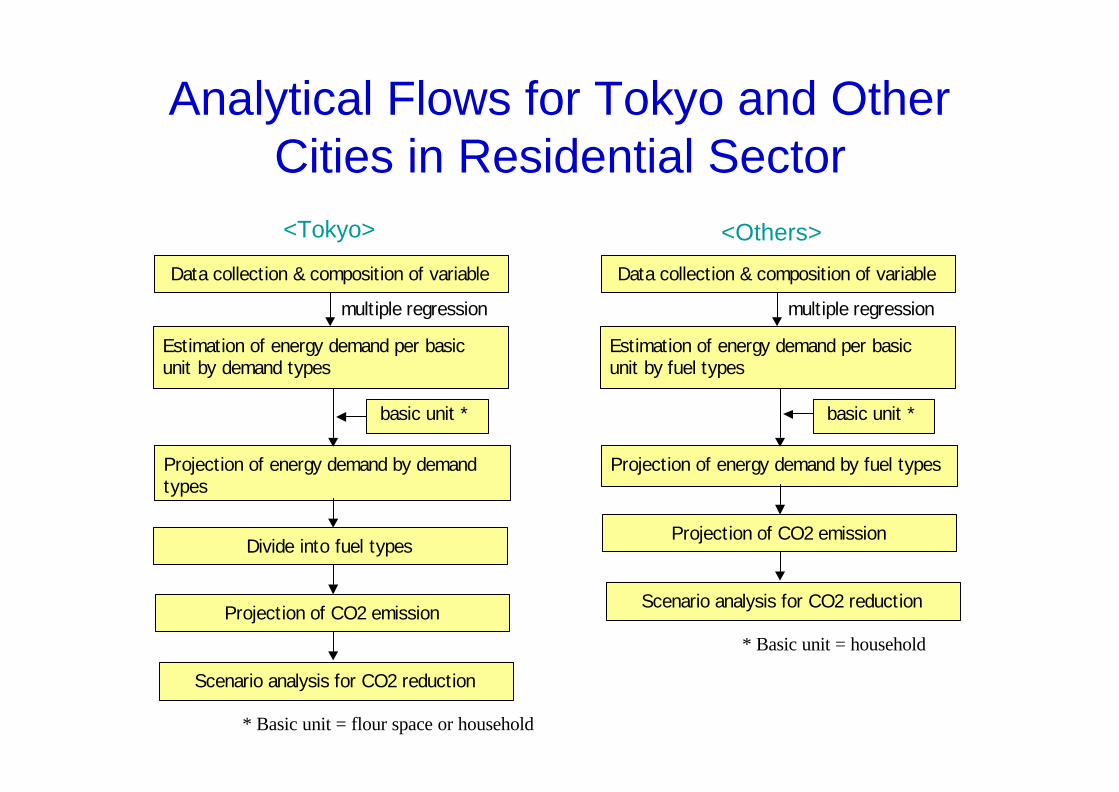
Analytical Flows for Tokyo and Other Cities in Residential Sector
Projection of energy demand by demand types
multiple regression
Data collection & composition of variable
Estimation of energy demand per basic unit by demand types
Divide into fuel types
Projection of CO2 emission
Scenario analysis for CO2 reduction
basic unit *
* Basic unit = flour space or household
Projection of energy demand by fuel types
multiple regression
Data collection & composition of variable
Estimation of energy demand per basic unit by fuel types
Projection of CO2 emission
Scenario analysis for CO2 reduction
basic unit *
* Basic unit = household
<Tokyo> <Others>

Lighting/Power
Cooking/Hot water
Cooling
LNG
Coking gas
LPG
Final Energy Primary Energy
Individual
DHSUrbanUrban
Heating
Electricity
Coal
Heat
Gas
Coal
Oil
LNG
Lighting/Power
Cooking/Hot water
CoolingElectricity
Coal
Coal
Individual Heating
RuralRural
Oil
LNG
Matching Demand Type to Energy Type (case of Beijing)

Lighting/Power
Cooking/Hot water
Cooling
LNG
Coking gas
LPG
Final Energy Primary Energy
Urban and RuralUrban and Rural
Electricity
Coal
Gas
Coal
Oil
LNG
Matching Demand Type to Energy Type (case of Shanghai)
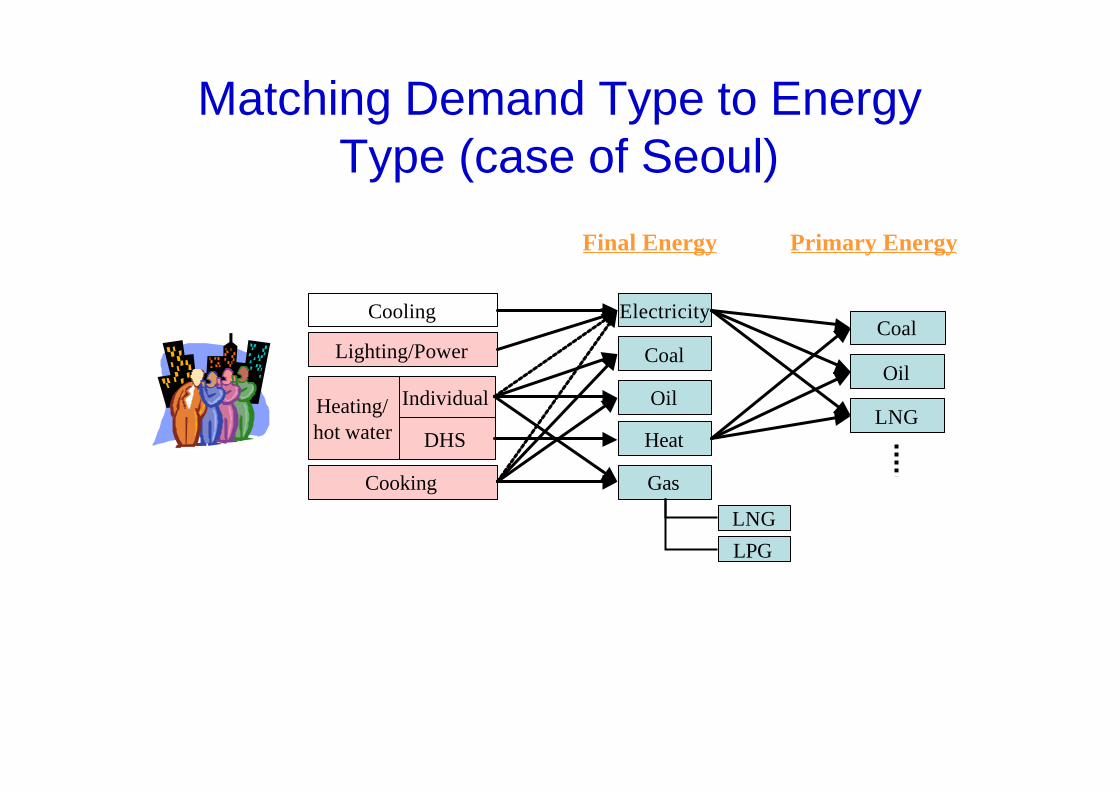
Matching Demand Type to Energy Type (case of Seoul)
Lighting/Power
Cooking
Cooling
LNG
LPG
Final Energy Primary Energy
Individual
DHS
Heating/hot water
Electricity
Oil
Heat
Gas
Coal
Oil
LNG
Coal

Flow Chart of the Estimation of Energy Consumption for heating
Energy consumptionper floor space
Number ofhousehold
Floor space per household
insulatedhousing energy price
size of household
employees’ income per household
climatepossession of device
Energy consumption for heating
Future forecasting
electricity town gas LPG kerosene
energy demand matrix
diffusion of town gas
××
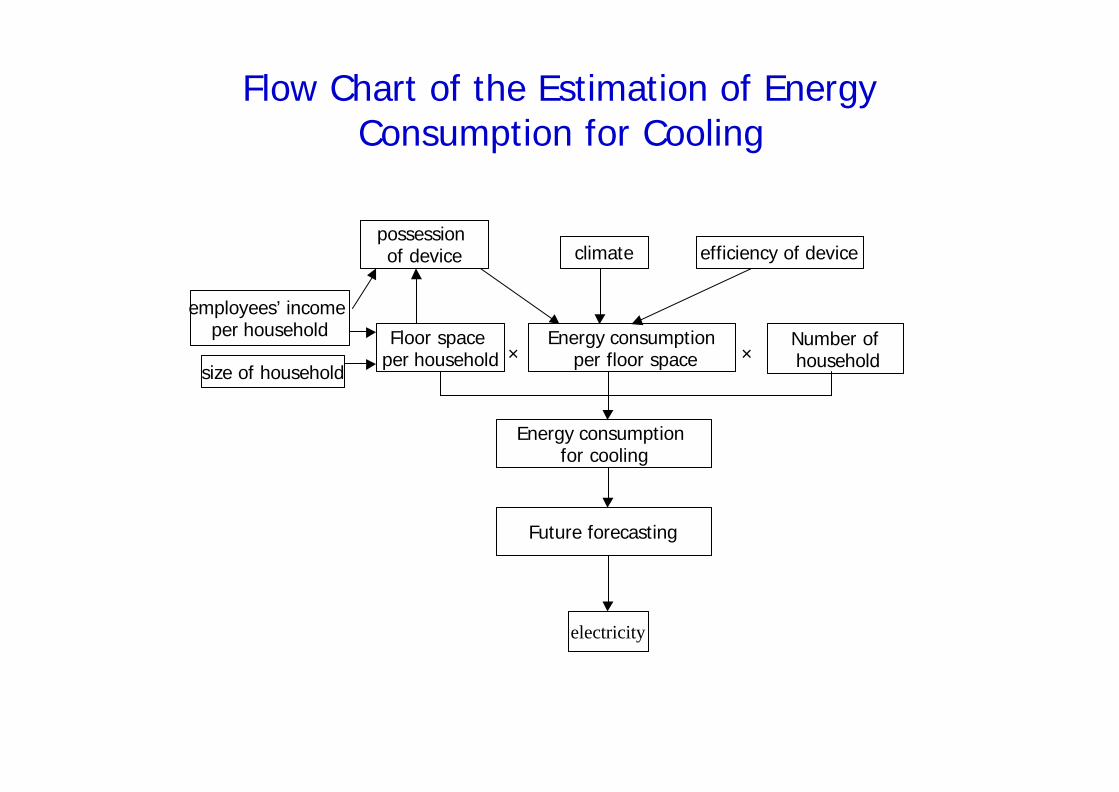
Flow Chart of the Estimation of Energy Consumption for Cooling
Energy consumptionper floor space
Number ofhousehold
Floor space per household
efficiency of device
size of household
employees’ income per household
climatepossession of device
Energy consumption for cooling
Future forecasting
electricity
× ×
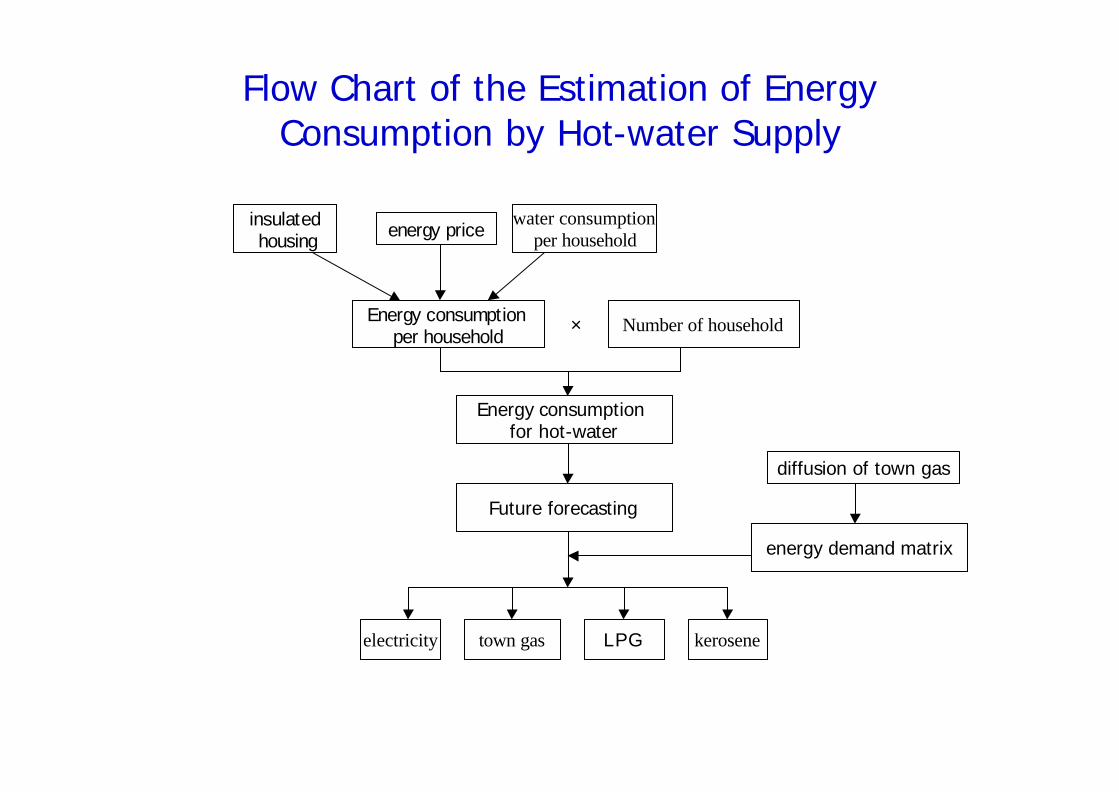
Flow Chart of the Estimation of Energy Consumption by Hot-water Supply
Number of householdEnergy consumption per household
insulatedhousing
energy pricewater consumption
per household
Energy consumption for hot-water
Future forecasting
electricity town gas LPG kerosene
energy demand matrix
diffusion of town gas
×

Flow Chart of the Estimation of Energy Consumption for Lighting, driving, etc.
Energy consumptionper floor space
Number ofhousehold
Floor space per household
efficiency of device
size of household
employees’ income per household
possession of device
Energy consumption for lighting, etc.
Future forecasting
electricity town gas LPG kerosene
energy demand matrix
diffusion of town gas
××
energy price

Data Collection
Energy Consumption per Unit of Tertiary Industry GDP Total GDP
Share of Tertiary Industry GDP to Total GDP××
Total Commercial Energy Consumption
Commercial Energy Consumption by Fuel Types
Prediction of CO2 Emission
Matrix of Energy Consumption ×
Prediction
Prediction
Analytical Flow of Commercial Sector

4. Projection of Energy Consumption and
CO2 emissions

Setting up the Exogenous Variable(case of Tokyo)
? Degree: average (1975-99)? Energy price: average (1991-99)? Water consumption: Straight line approximation of
water consumption per capita (1975-99)? Number of household: estimated by National
Institute of Population, Japan? Size of household : estimated by National Institute of
Population, Japan? Employees’ income: average of increasing rate
(1989-99)

Projection of GRP per Capita
010,00020,00030,00040,00050,00060,00070,00080,00090,000
1980 1985 1990 1995 2000 2005 2010 2015 2020
TokyoSeoulBeijingShanghai
( USD, 1995price)

Projection of Residential Energy Consumption per Household
0.00.20.40.60.81.01.21.41.61.82.0
1980 1985 1990 1995 2000 2005 2010 2015 2020
TokyoSeoulBeijingShanghai
(TOE/ hds.)
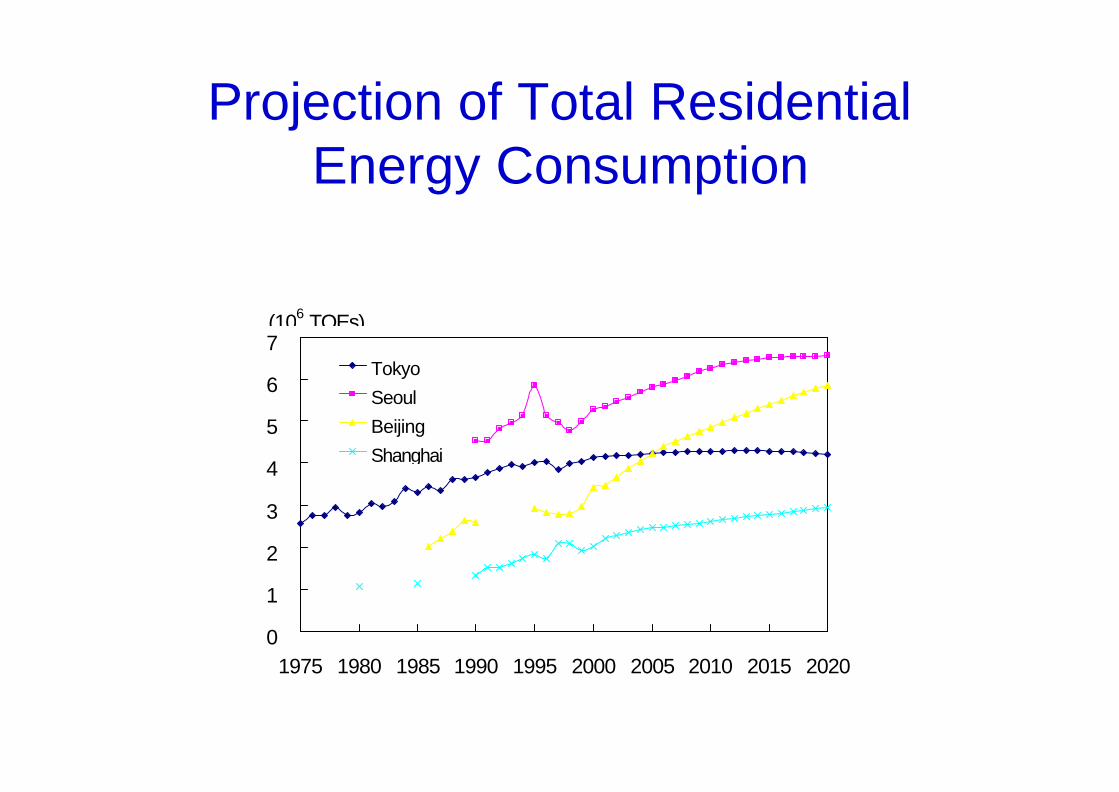
Projection of Total Residential Energy Consumption
0
1
2
3
4
5
6
7
1975 1980 1985 1990 1995 2000 2005 2010 2015 2020
TokyoSeoulBeijingShanghai
(106 TOEs)
Projection of Residential Energy Consumption
0
1
2
3
4
5
6
7
1975198019851990199520002005201020152020
KeroseneLPGTown gasElectricity
(106 TOEs)Tokyo
Tokyo
0
1
2
3
4
5
6
7
1985 1990 1995 2000 2005 2010 2015 2020
ElectricityHeatNautural gasLPGTown gasCoal
(106 TOEs)Tokyo
Beijing
0
1
2
3
4
5
6
7
1990 1996 2001 2006 2011 2016
ElectricityDieselHeavy oilKeroseneLPGTown gasCoal
(106 TOEs)Tokyo
Seoul
0
1
2
3
4
5
6
7
1990 1995 2000 2005 2010 2015 2020
ElectricityNatrual GasTown gasLPGKeroseneCoal
(106 TOEs)Tokyo
Shanghai
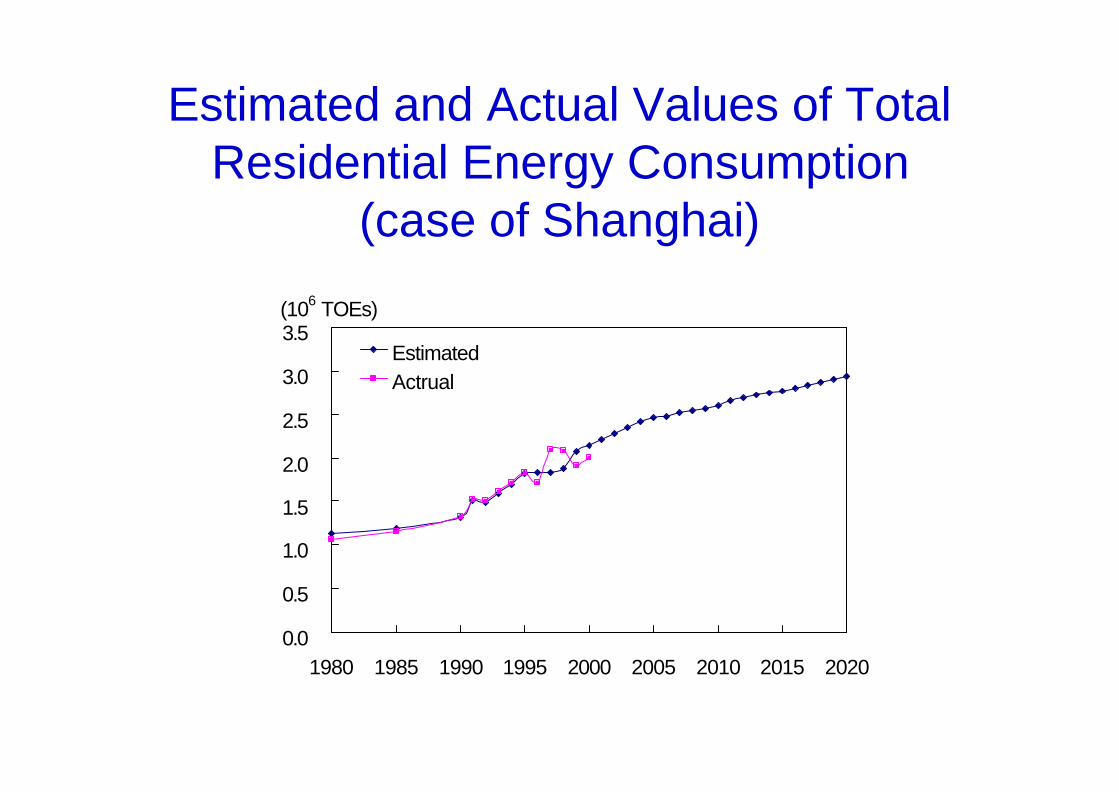
Estimated and Actual Values of Total Residential Energy Consumption
(case of Shanghai)
0.0
0.5
1.0
1.5
2.0
2.5
3.0
3.5
1980 1985 1990 1995 2000 2005 2010 2015 2020
EstimatedActrual
(106 TOEs)
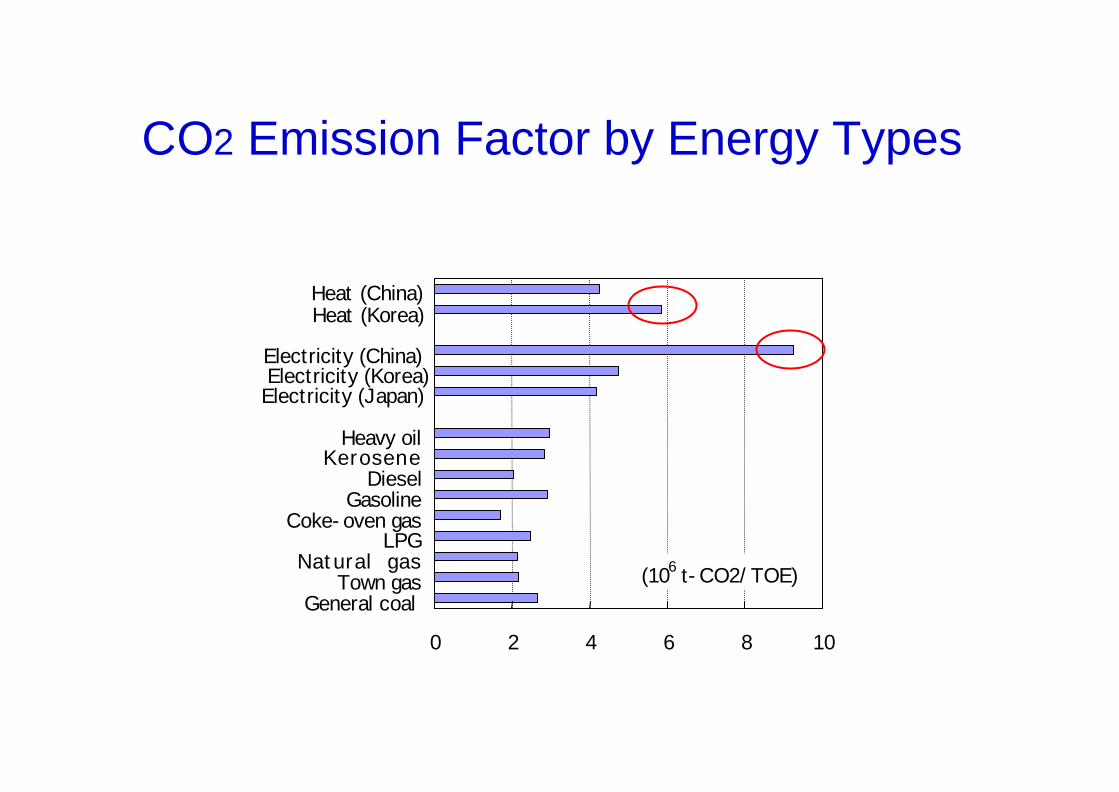
CO2 Emission Factor by Energy Types
0 2 4 6 8 10
General coal Town gas
Natural gasLPG
Coke-oven gasGasoline
DieselKerosene
Heavy oil
Electricity (Japan)Electricity (Korea)Electricity (China)
Heat (Korea)Heat (China)
(106 t-CO2/TOE)

Projection of Total CO2 Emission of Residential Energy Consumption
0
5
10
15
20
25
1975 1980 1985 1990 1995 2000 2005 2010 2015 2020
TokyoSeoulBeijingShanghai

0102030405060708090
100
1975 1980 1985 1990 1995 2000 2005 2010 2015 2020
TokyoSeoulBeijing Shanghai
(%)
Trends and Projection of Share of Tertiary GRP to Total GRP
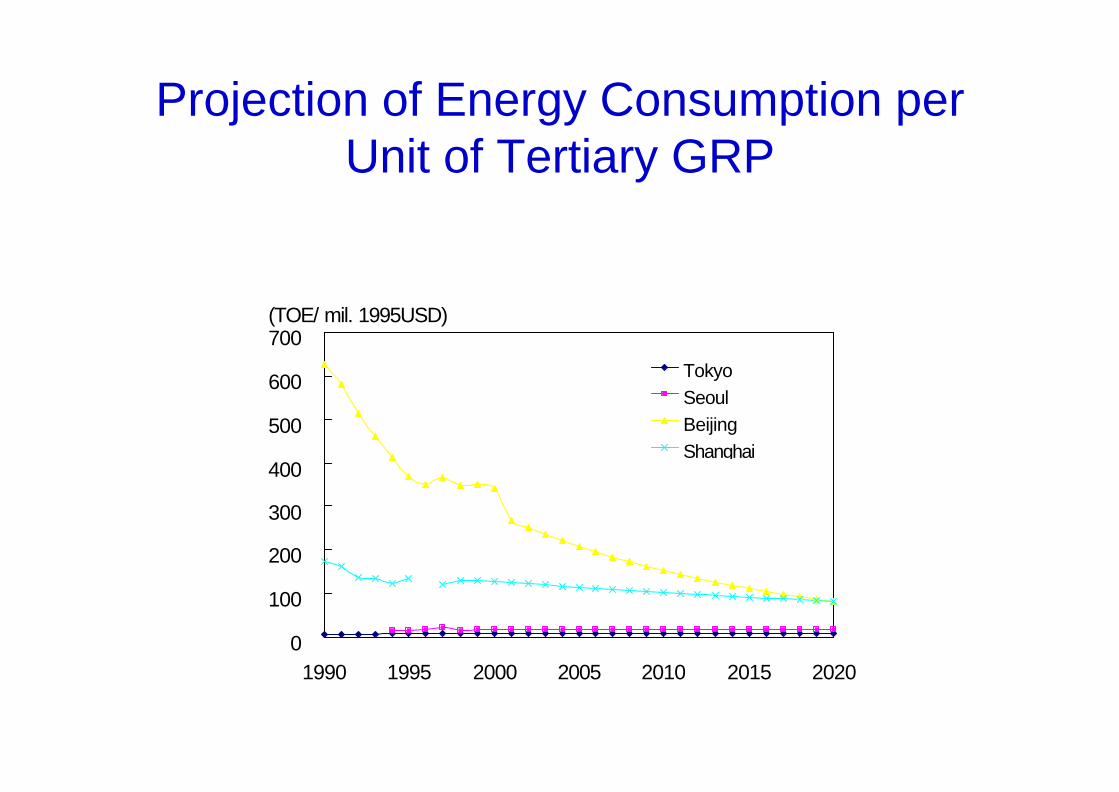
Projection of Energy Consumption per Unit of Tertiary GRP
0
100
200
300
400
500
600
700
1990 1995 2000 2005 2010 2015 2020
TokyoSeoulBeijingShanghai
(TOE/ mil. 1995USD)

Projection of Total Commercial Energy Consumption
0
2
4
6
8
10
12
14
1980 1985 1990 1995 2000 2005 2010 2015 2020
TokyoSeoulBeijingShanghai
(106 TOEs)

Projection of Commercial Energy Consumption
0
1
2
3
4
5
6
7
1990 1995 2000 2005 2010 2015 2020
ElectricityTown GasLPGHeavy OilKerosene
(106 TOEs)
0
1
2
3
4
5
6
7
1985 1990 1995 2000 2005 2010 2015 2020
OthersElectricityHeatCoke gasNGLPGDisel kerosenegasolineFuel oil Coal
(106 TOEs)
Tokyo
Beijing
0
2
4
6
8
10
12
14
1990 1995 2000 2005 2010 2015 2020
OthersElectricityCokeOther OilsDisel KeroseneGasolineFuel oil Coal
(106 TOEs)
Shanghai
0
1
2
3
4
5
6
7
1990 1995 2000 2005 2010 2015 2020
OthersHeatElectricityTown GasLPGOther OilHeavy OilKeroseneDieselGasolineCoal
(106 TOEs)
Seoul

Projection of Total CO2 Emission due to Commercial Energy Consumption
0102030405060708090
1985 1990 1995 2000 2005 2010 2015 2020
TokyoSeoulBeijingShanghai
(106 t-CO2).

5. Future Directions

Future Directions? Improvements in data and model structuresTwo directions can be considered
1. to aim at more simplified model to deal with same structure as other mega-cities
2. to aim at a complete, bottom-up model which model variables can be closely based on policy options.
? Scenario analysisScenarios can be described in the area of
1. household attributes and lifestyle factors2. architectural characteristics3. characteristics of energy devices4. carbon intensity in energy consumption

Thank you!

Concept of Scenario AnalysisBaU
Scenario generator
Reflection of scenario
energy consumption by demand types
0
5000
10000
15000
20000
25000
30000
35000
40000
45000
1975 1980 1985 1990 1995 2000 2005 2010 2015 2020
(Tca
l/yea
r) lighting
hot-water
cooling
heating
Energy consumption per floor space (heating)
0
5
10
15
20
25
30
35
40
1975 1980 1985 1990 1995 2000 2005 2010 2015 2020
(×1
03 kcal
/m2 /y
ear
actual estimated
energy consumption by demand types
0
5000
10000
15000
20000
25000
30000
35000
40000
45000
1975 1980 1985 1990 1995 2000 2005 2010 2015 2020
(Tca
l/yea
r) lighting
hot-water
cooling
heating

Example of scenarios?Improvements in energy efficiency of
appliances & equipments?Improvements in Insulated performance
of buildings?Improvements in carbon intensity of
energy?etc.

![Energy Saving Potential From Indian Households From Appliance Efficiency 108A01[1]](https://static.fdocuments.us/doc/165x107/54e6c3b74a795981528b4706/energy-saving-potential-from-indian-households-from-appliance-efficiency-108a011.jpg)