Lifestyle Based Segments in the South Australian Wine ... · 1.5 Objectives of the Study ......
179
Lifestyle Based Segments in the South Australian Wine Market and Their Impact on Wine Retailing. Trent Edward Johnson Department of Horticulture, Viticulture and Oenology Faculty of Sciences, Adelaide University, Australia Submitted as partial requirement for the Master of Wine Business degree Supervisor: Dr. Johan De W. Bruwer February 2002
Transcript of Lifestyle Based Segments in the South Australian Wine ... · 1.5 Objectives of the Study ......

Lifestyle Based Segments in the South Australian Wine Market and Their
Impact on Wine Retailing.
Trent Edward Johnson
Department of Horticulture, Viticulture and Oenology Faculty of Sciences, Adelaide University, Australia
Submitted as partial requirement for the
Master of Wine Business degree
Supervisor: Dr. Johan De W. Bruwer
February 2002

Table of Contents
List of Figures.......................................................................................................................iv
List of Tables .........................................................................................................................v
Executive Summary.............................................................................................................vii
Statement .............................................................................................................................x
Acknowledgements...............................................................................................................xi
Chapter 1 Introduction ...........................................................................................................1 1.1 Introduction and Background .................................................................................. 1 1.2 Main Research Problem........................................................................................... 3 1.3 Research Sub Problems ........................................................................................... 3 1.4 Research Hypotheses ............................................................................................... 3
1.4.1 Hypothesis 1 ..............................................................................................3 1.4.2 Hypothesis 2 ..............................................................................................4 1.4.3 Hypothesis 3 ..............................................................................................4 1.4.4 Hypothesis 4 ..............................................................................................4
1.5 Objectives of the Study............................................................................................ 4 1.6 Research Assumption .............................................................................................. 4 1.7 Delimitations of the Study....................................................................................... 5 1.8 Clarification of Basic Terms and Concepts ............................................................. 5
1.8.1 Risk............................................................................................................5 1.8.2 The Australian Domestic Wine Market.....................................................5 1.8.3 Concept Brand ...........................................................................................6 1.8.4 Safe Brand .................................................................................................6
1.9 Significance of the Study......................................................................................... 6 1.10 Outcomes and Contributions of the Research ......................................................... 7 1.11 Contextualisation of Disciplines or Fields............................................................... 7 1.12 Research Methodology ............................................................................................ 7
1.12.1 Sampling Population .................................................................................7 1.12.2 Sampling Frame.........................................................................................7 1.12.3 Sampling Method ......................................................................................8 1.12.4 Data Collection Instrument........................................................................8 1.12.5 Data Collection Technique ........................................................................8 1.12.6 Questionnaire Construction .....................................................................10 1.12.7 Data Processing, Analysis and Interpretation..........................................12 1.12.8 Sample Frame and Other Controls ..........................................................12
1.13 Organisation of the Dissertation ............................................................................ 14
Chapter 2 Literature Review................................................................................................15 2.1 Introduction ........................................................................................................... 15 2.1 Development of a Marketing Orientation.............................................................. 17 2.3 Market Segmentation as a Construct ..................................................................... 18 2.4 Bases for Market Segmentation............................................................................. 19
2.4.1 Classical Segmentation Approaches and Their Shortcomings................19 2.4.2 An Attempt to Overcome the Shortcomings of Classical
Segmentation Approaches .......................................................................21
i

2.5 Wine Market Segmentation Approaches/Studies .................................................. 24 2.6 Basis for Segmentation in this Research Study ..................................................... 37 2.7 Risk Reduction Strategies and the Purchase of Wine............................................ 37
2.7.1 Retail Factors and Risk Reduction Strategies .........................................38 2.8 Identified Research Literature Knowledge Gap .................................................... 45 2.9 Summary................................................................................................................ 45
Chapter 3 Identifying Lifestyle Based Segments in the Australian Domestic Wine Market ...............................................................................................................47
3.1 Introduction .......................................................................................................... 47 3.2 Identifying the Elements Constituting the Clusters (Segments)........................... 48 3.3 Identifying the Clusters (Segments) ...................................................................... 52 3.4 Data Interpretation................................................................................................. 54 3.5 Segment Descriptions ............................................................................................ 62
3.5.1 Segment 1 – Conservative, Wine Knowledgeable Wine Drinkers (20.9%) ....................................................................................................63
3.5.2 Segment 2 – Image Oriented, Knowledge Seeking, Wine Drinker (22.3%) ....................................................................................................63
3.5.3 Segment 3 – Basic Wine Drinker (16.8%) ..............................................64 3.5.4 Segment 4 – Experimentation Oriented, Highly Knowledgeable
Wine Drinkers (19%) ..............................................................................65 3.5.5 Segment 5 – Enjoyment Oriented, Social Wine Drinkers (20.9%).........65
3.6 Lifestyle Based Wine Market Segments – Discussion.......................................... 66 3.6.1 Hypothesis 4 – Confirmation of the Australian Domestic Wine
Market Wine-related Lifestyle Based Segmentation Structure Identified by Bruwer et al. (2001). ..........................................................66
3.7 Implications for the Australian Wine Industry ...................................................... 71 3.8 Conclusions ........................................................................................................... 73
Chapter 4 Identification and Examination of Each Segment’s Preferred Risk Reduction Strategies When Purchasing Wine .................................................75
4.1 Introduction ........................................................................................................... 75 4.2 Identification of the Preferred Risk Reduction Strategies by Segment ................. 77 4.3 Discussion of These Results .................................................................................. 79
4.3.1 Overall Result..........................................................................................79 4.3.2 Segment 1 – Conservative, Knowledgeable Wine Drinkers. ..................80 4.3.3 Segment 2 – Image Oriented, Knowledge Seeking Wine Drinkers. .......81 4.3.4 Segment 3 – Basic Wine Drinkers...........................................................82 4.3.5 Segment 4 – Experimenter, Highly Knowledgeable Wine Drinkers. .....85 4.3.6 Segment 5 – Enjoyment Oriented, Social Wine Drinkers.......................86
4.4 Conclusions ........................................................................................................... 86
Chapter 5 Translating the Preferred Risk Reduction Strategies Into Practical Implications for the Wine Retail Trade ............................................................88
5.1 Introduction ........................................................................................................... 88 5.2 Practical Strategies Identified ................................................................................ 90 5.3 Discussion of These Results .................................................................................. 91
5.3.1 Segment 1 – Conservative, Wine Knowledgeable Wine Drinkers..........92 5.3.2 Segment 2 – Image Oriented, Knowledge Seeking Wine Drinkers. .......93 5.3.3 Segment 3 – Basic Wine Drinkers...........................................................96 5.3.4 Segment 4 – Experimenter, Highly Knowledgeable Wine Drinkers ......98 5.3.5 Segment 5 – Enjoyment Oriented, Social Wine Drinkers.....................100 5.3.7 Retail Implications Summarised............................................................101
5.4 Assortment of Wines – A Final Word ................................................................. 102
ii

5.5 Potential Communication Strategies ................................................................... 103 5.6 The Role of Wine Retail Assistants..................................................................... 106 5.7 Conclusion ........................................................................................................... 108
Chapter 6 Other Australian Domestic Wine Market Characteristics.................................109 6.1 Introduction ......................................................................................................... 109 6.2 Hypothesis 2 – Consuming Higher Quality Wine Increases Consumers’
Knowledge and Experience of Wine and That, in Turn, Leads to the Consumption of Higher Quality Wine................................................................. 110
6.3 Hypothesis 3 – A Consumer’s Knowledge and Experience of Wine Are Antecedents to Their Wine Market Segment. ..................................................... 112
6.4 Quality of Wine Consumed – A Further Discussion........................................... 115 6.5 Demographic and Consumption Data.................................................................. 118
6.5.1 Age of Respondents...............................................................................118 6.5.2 Gender of Respondents..........................................................................119 6.5.2 Highest Education Level of Respondents..............................................120 6.5.4 Total Household Income of Respondents..............................................121 6.5.5 Alcohol Consumption Preference of Respondents................................122 6.5.6 How Often is Wine Consumed? ............................................................123 6.5.7 Cellaring of Wine ..................................................................................124
6.6 Wine Consumption Occasions............................................................................. 125 6.7 Conclusion ........................................................................................................... 126
Chapter 7 Conclusions and Recommendations .................................................................128 7.1 Introduction ......................................................................................................... 128 7.2 The Research Study Summarised ........................................................................ 129
7.2.1 First Research Sub Problem ..................................................................130 7.2.2 Second Research Sub Problem..............................................................132 7.2.3 Third Research Sub Problem.................................................................133 7.2.4 The Two Remaining Hypotheses ..........................................................134
7.3 Research Limitations ........................................................................................... 134 7.4 Recommendations for Further Research ............................................................. 135 7.5 Did the Study Achieve its Aim? .......................................................................... 137
7.5.1 Identify the Segments in the Australian Domestic Wine Market..........137 7.5.2 Examine Their Preferred Risk Reduction Strategies When
Purchasing Wine....................................................................................138 7.5.3 Relate Those Preferred Strategies to the Wine Retail Environment .....138 7.5.4 Develop an Understanding of Each of the Identified Segments’
Antecedents ...........................................................................................139 7.6 Conclusions ......................................................................................................... 139
Appendix 1 Survey Questionnaire .................................................................................141
Appendix 2 Interviewer Instructions .............................................................................155
Appendix 3 Principal Component Analysis – Total Variance Explained......................159
Appendix 4 One-way Between Groups ANOVA – Selected Demographic and Consumption Data......................................................................................161
Bibliography ......................................................................................................................165
iii

List of Figures
Figure 2.1 Conceptual Risk Reduction Model for the Purchase of Wine ..................... 16
Figure 2.2 A Cognitive Structure Model for Food – Related Lifestyle........................ 23
Figure 2.3 Means-end Chain Analysis ......................................................................... 33
Figure 2.4 Bruwer et al.’s Conceptual Wine Related Lifestyle Model ........................ 35
Figure 5.1 Advice Sought from Retail Staff................................................................ 106
Figure 5.2 Store Advice Sought by Segment .............................................................. 107
Figure 6.1 Age of Respondents ................................................................................... 118
Figure 6.2 Gender of Respondents ............................................................................. 119
Figure 6.3 Highest Education Level of Respondents .................................................. 120
Figure 6.4 Highest Education Level – A Comparison................................................. 121
Figure 6.5 Total Annual Household Income ............................................................... 121
Figure 6.6 Frequency of Wine Consumption .............................................................. 123
Figure 7.1 Validated Conceptual Risk Reduction Model for the Purchase of Wine... 140
iv

List of Tables
Table 1.1 Participating Retail Stores Response Rates.................................................. 12
Table 2.1 Comparison of Wine Market Segments Identified....................................... 31
Table 2.2 Comparison of Australian Wine Market Segmentation Studies .................. 35
Table 2.3 Wine Consumer Risk Types – A Comparison of Previous Research Study Findings ............................................................................................. 40
Table 2.4 Wine Purchase Risk Reduction Strategies– A Comparison of Two Previous Research Study Findings............................................................... 40
Table 2.5 Risk Reduction Strategies and Retailer Variables ....................................... 41
Table 3.1 Bruwer et al.’s Wine-related Lifestyle Components and Elements ............. 48
Table 3.2 KMO Measure of Sampling Adequacy and Bartlett's Test of Sphericity ..................................................................................................... 50
Table 3.3 Components and Elements – Current Study ................................................ 51
Table 3.4a Classification Results – 5 Cluster Solution.................................................. 53
Table 3.4b Classification Results – 4 Cluster Solution.................................................. 53
Table 3.5 Final Cluster Centres – 5 Cluster Solution................................................... 54
Table 3.6 Mean Knowledge Score by Cluster.............................................................. 56
Table 3.7 Clusters 1, 2 and 4 – Statistical Significance on Selected Variables and Elements ................................................................................................ 57
Table 3.8 Identified Cluster Characteristics ................................................................. 59
Table 3.9 Key Demographic, Consumption and Usage Data ...................................... 61
Table 3.10 One-way Between Groups ANOVA – Summary of Selected Demographic and Other Data....................................................................... 62
Table 3.15 Market Segment Comparison....................................................................... 67
Table 3.16 Amended Australian Domestic Wine Market Segments ............................. 72
Table 4.1 Weighted Mean Score Calculation............................................................... 77
Table 4.2 Preferred Generic Strategies by Segment and Price Range (Weighted Mean Scores in Brackets)............................................................................. 78
Table 4.3 Top 10 Brands, Red and White Wines Purchased by Segment 3 ................ 83
Table 5.1 Generic Risk Reduction Strategies and Wine Retailer Variables ................ 89
Table 5.2 Comparison of Preferred Risk Reduction Strategies (Specific & Generic) – Overall Result............................................................................. 90
Table 5.3 Most Preferred Generic and Specific Risk Reduction Strategies – Segment 1..................................................................................................... 92
Table 5.4 Most Preferred Generic and Specific Risk Reduction Strategies – Segment 2..................................................................................................... 94
v
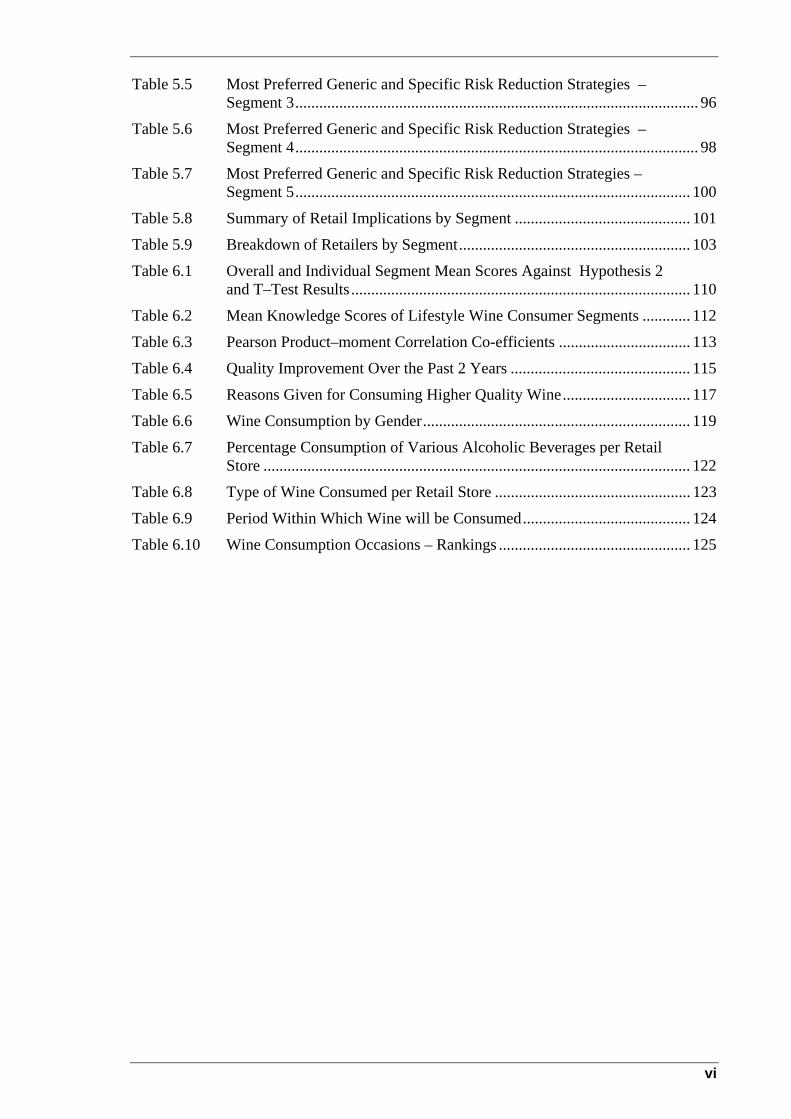
Table 5.5 Most Preferred Generic and Specific Risk Reduction Strategies – Segment 3..................................................................................................... 96
Table 5.6 Most Preferred Generic and Specific Risk Reduction Strategies – Segment 4..................................................................................................... 98
Table 5.7 Most Preferred Generic and Specific Risk Reduction Strategies – Segment 5................................................................................................... 100
Table 5.8 Summary of Retail Implications by Segment ............................................ 101
Table 5.9 Breakdown of Retailers by Segment.......................................................... 103
Table 6.1 Overall and Individual Segment Mean Scores Against Hypothesis 2 and T–Test Results ..................................................................................... 110
Table 6.2 Mean Knowledge Scores of Lifestyle Wine Consumer Segments ............ 112
Table 6.3 Pearson Product–moment Correlation Co-efficients ................................. 113
Table 6.4 Quality Improvement Over the Past 2 Years ............................................. 115
Table 6.5 Reasons Given for Consuming Higher Quality Wine................................ 117
Table 6.6 Wine Consumption by Gender................................................................... 119
Table 6.7 Percentage Consumption of Various Alcoholic Beverages per Retail Store ........................................................................................................... 122
Table 6.8 Type of Wine Consumed per Retail Store ................................................. 123
Table 6.9 Period Within Which Wine will be Consumed.......................................... 124
Table 6.10 Wine Consumption Occasions – Rankings ................................................ 125
vi

Executive Summary
During August and September 2001, 363 wine consumers shopping for wine at eight wine
retail stores in metropolitan Adelaide, South Australia, were extensively surveyed about
their activities, interests and opinions about wine and their wine purchasing behaviour. The
study consisted of two major parts. The first was to identify the segments that form the
South Australian wine market and the second was to identify the preferred risk reduction
strategies of each of those segments and link those to the wine retail environment. The
underlying assumption was that retailers could manipulate their retail mix to encompass
the preferred strategies of their target market, thus providing the basis for a potential
competitive advantage. This data was analysed and the major results are summarised
below.
The study identified five distinct segments, each with their own characteristics and
behaviours. These were:
• Segment 1 – Conservative, Wine Knowledgeable Wine Drinkers (20.9% of the
total market)
These consumers are generally well educated, knowledgeable and predominantly
male, whose buying habits are reasonably predictable from year to year. They are the
consumers who may previously have been stereotyped as “connoisseurs”.
• Segment 2 – Image Oriented, Knowledge Seeking Wine Consumers (22.3%)
These are likely to be tertiary educated, professional consumers whose purchases are
dictated by opinion leaders. They have some wine knowledge and are actively seeking
to increase that knowledge. They are concerned with the image associated with
drinking wine.
• Segment 3 – Basic Wine Drinker (16.8%)
This consumer is not concerned with any of the “airs and graces” associated with
drinking wine. They drink wine because they enjoy it and they are likely to make their
wine purchases from a number of safe brands that have previously met their needs.
vii
• Segment 4 – Experimenter, Highly Knowledgeable Wine Drinker (19.0%)
These consumers have become somewhat “bored” with what they perceive as the run
of the mill wines on offer and are seeking new and different wines to excite their
palates. They are very wine knowledgeable and seek out other people with knowledge
to assist in their quest for different wines and as a result, they tend to experiment when
purchasing wine.
• Segment 5 – Enjoyment Oriented, Social Wine Drinkers (20.9%)
These consumers are predominantly female and enjoy a glass of wine with their
friends on a weekend. Their purchasing behaviour can be spontaneous and the
packaging and labelling of the wine plays a part in their decisions, indicating that they
might be attracted to the so-called “concept” brand category on the market.
From a wine industry perspective, this construct of the market is important, as segments 1,
2 and 4 all have an average spend per bottle of wine in excess of $20. This indicates that
they purchase wine in the super premium category and above, the categories in which
many of the boutique and smaller producers have positioned their products. The
knowledge that about 60% of the market are potential customers may prove comforting to
these producers.
The second part of the study revealed that the two most preferred strategies were that
consumers seek information about their purchases prior to buying and that they sought
reassurance through tasting prior to buying. The incidence of the use of these strategies
increased as the price of the wine increased.
When the practical implications for wine retailers were examined, the data revealed that
each segment relied on the assortment of wines on offer as their risk reduction strategy of
choice. This had different implications for individual wine retailers, depending on their
positioning and target markets. The implications for each of the segments are summarised
as:
• Segment 1 – Conservative, Wine Knowledgeable Wine Drinkers
A range of super premium wines from the larger producers.
viii

• Segment 2 – Image Oriented, Knowledge Seeking Wine Consumers
An assortment of medal and trophy winning wines and wines that have received
favourable press coverage.
• Segment 3 – Basic Wine Drinkers
An assortment of commercial wines.
• Segment 4 – Experimenter, Highly Knowledgeable Wine Drinkers
A range of wines perceived as new, innovative, different or exciting.
• Segment 5 – Enjoyment Oriented, Social Wine Drinkers
A range of more commercial wines that should include some concept brands that
appeal to mainly female consumers.
The research study also examined the relationship between a consumer’s level of wine
knowledge and the quality of the wine they consumed. It concluded that a consumer with a
greater level of wine knowledge is likely to spend (on average) more per bottle of wine
than a consumer with less wine knowledge.
This research study was made possible through the auspices of the Liquorland/Vintage
Cellars Retail Management Scholarship, 2001.
As this research study was one of the largest of its kind ever undertaken on the Australian
wine market, the full details are contained within the body of this dissertation.
ix

Statement
“The thesis contains no material which has been accepted for the award of any other degree or diploma in any university and that, to the best of the student’s knowledge and belief, the thesis contains no material previously published or written by another person, except where due reference is made in the text of the thesis.” “The author consents to the thesis being made available for photocopying and loan if accepted for the award of the degree.” Trent Edward Johnson 20 February 2002
x

Acknowledgements
When I started studying in March 1999, the last thing on my mind was the thought of getting a Master’s Degree — in fact, I didn’t even know that one was on offer. However, with the support, enthusiasm and cajoling of a number of people, that has now become a reality. I would like to thank a number of people who have helped me along the way. Firstly, I have made a lot of new friends over the last three years who have provided a lot of inspiration, ideas and hangovers! Although too many to mention individually, your friendship is treasured and thanks for everything. Secondly, I would like to thank Karel and Barb for generously giving up their time to help with the data collection and for being the springboard for many an idea. I must make special mention of Karel for keeping me fit through regular running. Dr Elton Li was generous with his time, especially when I was coming to grips with the more advanced statistical processes and I thank him for that. The Liquorland/Vintage Cellars Scholarship provided the wherewithal to continue at University and the staff of their respective stores gave their time in helping with the data collection and I am grateful for all their assistance. My Mum and Dad were always there with their support — you know what you have done and how much it was appreciated. Lastly, there are a couple of people without whom none of this would have been possible. Dr Johan Bruwer was the first to suggest that I consider the Masters. He pushed, prodded and generally did not let up until I relented! Since then, he has become a friend as well as a supervisor, a person who has been unbelievably generous with his time and ideas. I have lost count of the number of hours we spent discussing all aspects of the research and I hope that he shared some of the excitement as it all came together. I have left the best ’til last, as without the support of Brenda, I would not be where I am today. She never wavered in the belief that I would succeed, even when I had moments of doubt. She sacrificed her time, not only in spending many an hour in bottle shops collecting data, but also in being the family bread winner at a time when she might have harboured thoughts of semi retirement. I owe her in more ways than I can express and this is for her. Trent Johnson February 2002
xi
Chapter 1 Introduction
1.1 Introduction and Background
The Australian wine industry has entered a period of great challenge. Although the success
of “Brand Australia” in overseas markets over the past 15 years has been well documented,
this feat does not guarantee future success. The increasing globalisation of the world wine
industry, consolidation of the retail distribution chains, the increasing marketing
orientation and expertise of Australia’s main competitors and the reality of a wine surplus
at present and in the near future are only some of the challenges facing the Australian
industry. These, and other challenges are recognised in “The Marketing Decade – Setting
the Australian Wine Marketing Agenda 2000 – 2010”, a joint publication of the
Winemakers’ Federation of Australia and the Australian Wine and Brandy Corporation
(2000). Although the main focus is on export, this document and other comments by wine
industry analysts have specifically highlighted the importance of the Australian domestic
market over the next decade. Most, if not all of Australia’s world-famous export brands
like Jacob’s Creek, Lindemans, Nottage Hill, Banrock Station, Penfolds and Rosemount
spent their “developmental stage” in the Australian domestic wine market. This is a basic
premise, or rather “philosophy” adopted in as far as the contribution that this study will
make to the existing knowledge base. Furthermore, if this market, which is currently
experiencing little growth, does not grow at least at the “low” rates expected over the next
ten years, the industry’s capacity to sell all of its production will be severely curtailed.
A precursor to any growth strategy is a thorough understanding of that particular market
and one means of achieving this is through market segmentation. The first record of any
attempt to segment the Australian domestic wine market was that of Dr. David McKinna,
in 1986. Since that time there have been a number of further efforts to define this market,
using a variety of methods. Each new result provided additional insight and understanding
of that market, as it should and added to the knowledge base in an incremental manner.
However, as there have been such a variety of methods used to segment this market during
this formative stage of ‘scientific exploration (and experimentation)’, none can be
described as the definitive work. However, what each new segmentation exercise provides
1

is a different perspective from which marketers can devise communication strategies to sell
their respective products.
Market segmentation provides different strategies for different target markets and provides
information to marketers on what the market wants and needs. This market intelligence
ensures that the wine industry continues to adopt a market orientation in its dealings with
stakeholders, as distinct from a product orientation (where the producers impose their will
on the market), an orientation that was dominant in the industry until the 1980s. This is the
‘big picture’ for the Australian wine industry. However, if the Australian domestic wine
market is to achieve the requisite growth, the actions of all the participants who operate in
the market must come under scrutiny. In particular, wine retailers, as the source of much of
the wine purchased in the market, must contribute to that growth.
The wine retail environment in Australia mirrors that in other parts of the world. The main
trend is one of large-scale consolidation. Large, national wine retail chain stores dominate
the market in much the same way as the supermarkets dominate the UK market, although
these chains do not have the same market share as the UK supermarkets. The number of
smaller independent retailers in Australia is falling, as the chains expand their spheres of
influence. (A recent media report (Allen, 2002) suggested that Coles Myer and
Woolworths controlled approximately 35% of the Australian off-premise (retail) alcohol
market.)
Regardless of the ownership of any particular wine retailer, each has to establish a position
in its respective market and decide on its target market. Once these are established, the
retailer must develop marketing communication strategies that are consistent with both
their position and target market. Successful strategies can only be developed with a
thorough understanding of both their market and customers. This can be achieved through
market segmentation and an understanding of consumer behaviour.
This research study offers a new perspective on both of these issues. The South Australian
wine market was segmented using a wine-related lifestyle approach. This market was
chosen as it is generally regarded as a good test market for research into aspects of the
wine market and financial and other constraints prevented the study being carried out in
other states of Australia. Although the wine-related lifestyle approach of segmentation has
been previously used, this study has refined that earlier technique and confirmed (or
2
otherwise disconfirmed or amended) those market segments. For the first time, a specific
consumer behaviour issue, that of preferred risk reduction strategies, examined each of
those identified wine market segments. These preferred strategies were then related back to
the “amphitheatre” of strategy execution – the wine retail environment.
This knowledge may provide a level of understanding of the South Australian wine market
not previously explored and could be a powerful tool for retailers when developing their
specific strategies. One desired outcome of this increased understanding would be
increased sales and profits for wine retailers and growth in the domestic market.
1.2 Main Research Problem
In the context of this study, the main research problem was:
“To examine the preferred risk reduction strategies adopted in identified South Australian
wine market lifestyle segments when purchasing wine, relate these to the wine retail
environment and develop an understanding of those market segments’ antecedents”.
1.3 Research Sub Problems
Three research sub problems evolved from the main research problem. These were:
• Identify lifestyle-based segments in the South Australian wine market;
• Identify and examine each segment’s preferred risk reduction strategies when
purchasing wine; and
• Translate those preferred risk reduction strategies into practical implications for the
wine retail trade.
1.4 Research Hypotheses
Four research hypotheses were formulated. These were:
1.4.1 Hypothesis 1
Reducing risk in wine purchasing leads to the purchase of higher quality wine.
3
1.4.2 Hypothesis 2
Consuming higher quality wine increases consumers’ knowledge and experience
of wine and that, in turn, leads to the continued consumption of quality wine.
1.4.3 Hypothesis 3
A consumer’s knowledge and experience of wine are antecedents to their wine
market segment.
1.4.4 Hypothesis 4
Confirmation of the South Australian wine market wine related lifestyle-based
segmentation structure identified by Bruwer et al. (2001).
1.5 Objectives of the Study
The study had two broad objectives. The primary objective was:
• To elicit a detailed understanding of the preferred risk reduction strategies
employed by each of the identified South Australian wine market segments.
The secondary objective was:
• To segment the South Australian wine market using a wine related lifestyle
method.
1.6 Research Assumption
Due to the nature of the research design employed in this study, the following assumption
had to be made:
That customers of the data collection points, namely Vintage Cellars stores at Walkerville,
Belair and Camden Park, Liquorland Stores at St Agnes and Ingle Farm, Edinburgh Cellars
at Mitcham, Melbourne Street Fine Wine Store, North Adelaide and Baily and Baily at St
Georges, all located in Adelaide, South Australia, were generally representative of South
Australian wine consumers. (A full explanation for the rationale behind the selection of
these eight wine retail stores can be found at paragraph 1.12.2 – Sampling Frame.)
4
1.7 Delimitations of the Study
• This study did not examine the impact that the customer’s personality actually had on
the risk reduction behaviour practised in the purchase of wine. For example, some
customers, by their nature, may be either risk takers or risk averse and these
personality traits may have an effect on their purchasing behaviour. The probing
required to examine these factors in detail was considered outside the scope of this
study.
• The study is limited to customers of the eight retail wine stores mentioned
immediately above (paragraph 1.6) and the time of the month and year during which it
was conducted (August and September 2001).
• Ideally, the data collection method should have been a probabilistic cluster sampling
technique conducted in sampled suburbs/clusters at the respondents’ household
address. However, due to financial constraints and the dictates of the study’s sponsor,
this was not a viable option. This resulted in the study having a narrower, but sharper,
geographic focus, namely in the Adelaide Metropolitan area only.
1.8 Clarification of Basic Terms and Concepts
1.8.1 Risk
Risk was defined as the perception of a hazard or the chance of bad consequences,
loss etc. In the context of purchasing wine, risk is present where there is
uncertainty about whether the purchase will meet the expectations of the
purchaser. Risk reduction theory suggests that consumers attempt to reduce the
risk attached to the purchase of a bottle of wine by a number of different means.
In theory, at least, the wine brand for which these strategies are the most effective
is likely to be the wine brand that is purchased.
1.8.2 The South Australian Wine Market
For the purposes of the research study, the South Australian wine market was
defined as any adult over the age of 18 years who had consumed wine in the
twelve months immediately preceding the gathering of the data for this research
study. Unless otherwise specified, any reference to “the market” is a reference to
the South Australian wine market.
5

1.8.3 Concept Brand
A wine brand based on a particular concept that will have appeal to a certain
consumer within the market. These brands are usually associated with clever, easy
to remember brand names and unusual packaging that is likely to catch the eye of
a potential purchaser. Examples include the BRL Hardy Wicked Wines range that
is positioned for the younger female market.
1.8.4 Safe Brand
One of a (usually quite small) number of brands in a consumer’s evoked set from
which the consumer makes the majority of his/her wine purchase choices.
1.9 Significance of the Study
The study aimed to examine the preferred risk reduction strategies employed by each of the
identified lifestyle segments of the South Australian wine market. The answers that the
study provided have the potential to assist both the wine retail sector and the Australian
wine industry in general, in a number of meaningful ways:
In the first instance, the study adds to the growing literature on the segmentation of the
Australian domestic wine market. This segmentation may provide a deeper understanding
of the market to the industry in general and may provide individual retailers with increased
knowledge of their own customer base. In the case of the retailer, this knowledge could
assist in creating a sustainable competitive advantage. For the Australian industry as a
whole, the knowledge may assist in developing strategies to grow the domestic market, an
area identified by industry analysts as crucial if Australia wishes to maintain its position in
the global market.
The examination of the preferred risk reduction strategies may be of significance to all
major stakeholders in the industry. For the first time, a study has provided an insight into
some of the key drivers of consumer behaviour in the South Australian wine market. From
a retailer’s perspective, this knowledge and application may assist the development of their
respective retail mixes in relation to their target markets, leading to increased sales and
profits. For the industry in general, a better understanding of the behaviour of its
6

consumers may provide a tighter focus when developing growth and branding strategies,
both key components in an increasingly global industry.
1.10 Outcomes and Contributions of the Research
The study further refined the wine-related lifestyle approach and provided a segmentation
model of the South Australian wine market. This approach, combined with the results of
the examination of the preferred risk reduction strategies, provided a framework for wine
retailers to develop a retail mix commensurate with their target markets.
1.11 Contextualisation of Disciplines or Fields
The study has its roots in the broader Marketing Discipline and in particular the fields of
Consumer Behaviour and Market Segmentation. In addition, the study also has relevance
to the Retail Management discipline.
1.12 Research Methodology
The following sections detail the research methodology employed in the study.
1.12.1 Sampling Population
The sample population was wine consumers living in the Adelaide metropolitan
area. That is, male and female wine consumers over the age of eighteen living in
that designated area.
1.12.2 Sampling Frame
The author was awarded the Liquorland/Vintage Cellars Retail Management
Scholarship for 2001. As part of this award, both Liquorland and Vintage Cellars
provided access to their customer base for the purposes of this research.
Therefore, the population sample was limited to those wine consumers who
actually purchased wine at Vintage Cellars stores at Walkerville, Belair, and
Camden Park, Liquorland Stores at St Agnes and Gilles Plains, The Edinburgh
Cellars at Mitcham, Melbourne Street Fine Wine Store at North Adelaide and the
Baily & Baily store at St. Georges.
7
Vintage Cellars and Liquorland Stores are part of a national wine retail chain. The
five stores included for the research study were specifically chosen by their
management because of their geographical location and the fact that they best
represent all of the socio-economic strata from which their target markets are
drawn. It was decided that the remaining stores should be drawn from
independent wine retailers in Adelaide, to provide the desired ‘balance’ to the
research study. This independence was reflected in those stores’ respective
positioning and target markets, where all three stores were considered “fine wine
retailers” with corresponding target markets.
1.12.3 Sampling Method
Within the financial and other constraints mentioned at paragraph 1.7, the
sampling method used was a probability technique that can be described as a
systematic random cluster sampling method. The cluster method was appropriate
because every store included in the study was regarded as an individual cluster.
Using a technique with a random start, the interviewers approached potential
respondents as they entered the stores, indicating a systematic approach to the
sampling. As every customer in every store had an equal chance of being included
in the sample, the method used qualified as a simple random one.
1.12.4 Data Collection Instrument
Communication and observation were the two ways considered in order to obtain
the primary data. Communication was the method of choice. Effective
communication required the use of a highly structured questionnaire, which was
therefore the data collection instrument of choice for the research study.
1.12.5 Data Collection Technique
The use of a questionnaire as the method of communication with the respondent
had three key issues that needed addressing:
1. Degree of Structure in the Questionnaire
8

The questionnaire was highly structured with only two open-ended questions.
The data sought was therefore mainly quantitative in nature, with some
qualitative elements.
2. Degree of Disguise
The questionnaire was completely undisguised, as its purpose was clear from
the start. This certainly contributed to the high response rate achieved.
3. Method of Administration
There were three available choices for administration of the questionnaire:
• Personal interview;
• Telephone interview; or
• Use of mail (either traditional or email).
Each of these options had its pros and cons, however, a face-to-face interview
was initially chosen because of its superior versatility. This technique
afforded the interviewer:
• Sample control, through a physical check of the prospective respondent;
• Sufficient quantity of data through a higher rate of completed
questionnaires;
• Superior quality of data through the ability to verify and explain any
issues or problems by way of the interaction with the respondent; and
• A higher response rate by presenting as highly professional to the
prospective respondents.
However, after the survey was administered at two venues over two days, it
became apparent that a face-to-face approach would be extremely inefficient,
due to the length of the questionnaire. Many potential respondents indicated
that they did not have twenty minutes (on average) to spare to complete the
survey in store. It was therefore decided that all potential respondents would
be given the choice of either completing the survey in store or taking one
away and completing it in their own time and at their own pace. If this option
was chosen, the respondents had a further choice of either returning the
completed survey in person to the store from which it originated, or using a
reply paid envelope to return the completed survey to the researcher. It is
acknowledged that this alternative of self-administration reduced the overall
9

control that the researcher had over the process, but the increased response
rate and reduced data collection time period far outweighed the negative
considerations.
In conclusion, the primary data was collected by way of a highly structured
and focused questionnaire that was administered either in face-to-face mode
by an interviewer, on premise at the retail locations listed above, or
completed in respondent’s own time and returned either to the originating
retail store or to the researcher.
1.12.6 Questionnaire Construction
The questionnaire was divided into 9 sections and each of these sections is briefly
described below:
Section 1 – Consumption of Wine
• Ten questions about the respondent’s consumption of wine. These questions
required either a self-reported figure, or a tick in a box.
Section 2 – Wine Consumption Occasions
• This section consisted of a table of possible wine consumption occasions
where respondents were asked to rank the occasions during which they drank
wine in the order of frequency, where 1 = the occasion at which the
respondent most often drank wine.
Section 3 – Wine Brands
• This section consisted of a table containing the names of a number of well-
known wine brands. The respondents were asked to tick a box if they had
purchased that brand in the month preceding the survey and also indicate the
number of bottles of each purchased in that time frame.
Section 4 – Wine Related Lifestyle
• This section consisted of sixty-one Likert scale questions (an extension of the
44 items previously used by Bruwer at al., (2001)) where respondents were
asked to indicate on a scale of one to seven their level of agreement with
various wine related lifestyle statements.
10

Section 5A – Strategies – General
• Respondents were asked to indicate which of six generic risk reduction
strategies they used when buying wine and then to rank those choices in order
of importance, where 1 = the most important strategy.
Section 5B – Strategies – Specific
• Respondents were asked to indicate which of eleven specific risk reduction
strategies they used when buying wine and then rank those choices in order of
importance, where 1 = the most important strategy.
Section 6 – Quality
• Respondents were asked whether the quality of the wine they now consumed
had changed over the past two years, by ticking the appropriate box from
three choices. If they indicated that the quality had improved in that time,
they were then asked to choose the reasons why, from a number of choices
provided and then rank their choices in order of importance, where 1 = the
most important.
• All respondents, regardless of their answer to the quality question were then
asked eight 7-point Likert scale questions about their opinions on drinking
higher quality wine.
Section 7 – Role of the Wine Retail Assistant
• Respondents were asked to indicate from a list of options provided, whether
they had used the advice of retail assistants when purchasing wine. This took
the form of a tick in the appropriate box.
Section 8 – Wine Knowledge
• This section consisted of ten multiple-choice questions that tested
respondent’s knowledge of wine. They circled their answers.
Section 9 – Demographic Information
• This section consisted of a series of questions that provided demographic
information about the respondent.
11
A copy of the questionnaire is contained as Appendix 1.
1.12.7 Data Processing, Analysis and Interpretation
As noted above, the great majority of the data collected was of a quantitative
nature, allowing the data to undergo some form of statistical manipulation. The
data from the completed questionnaires was pre-coded and entered into the SPSS
Version 10.0 statistical package, for manipulation. The SPSS package was the
package of choice, because sophisticated data analysis was required as well as the
use of statistical techniques in the analysis (eg factor and cluster analysis). The
results are displayed using tables, graphs and other diagrammatic techniques in
chapters 3 to 6.
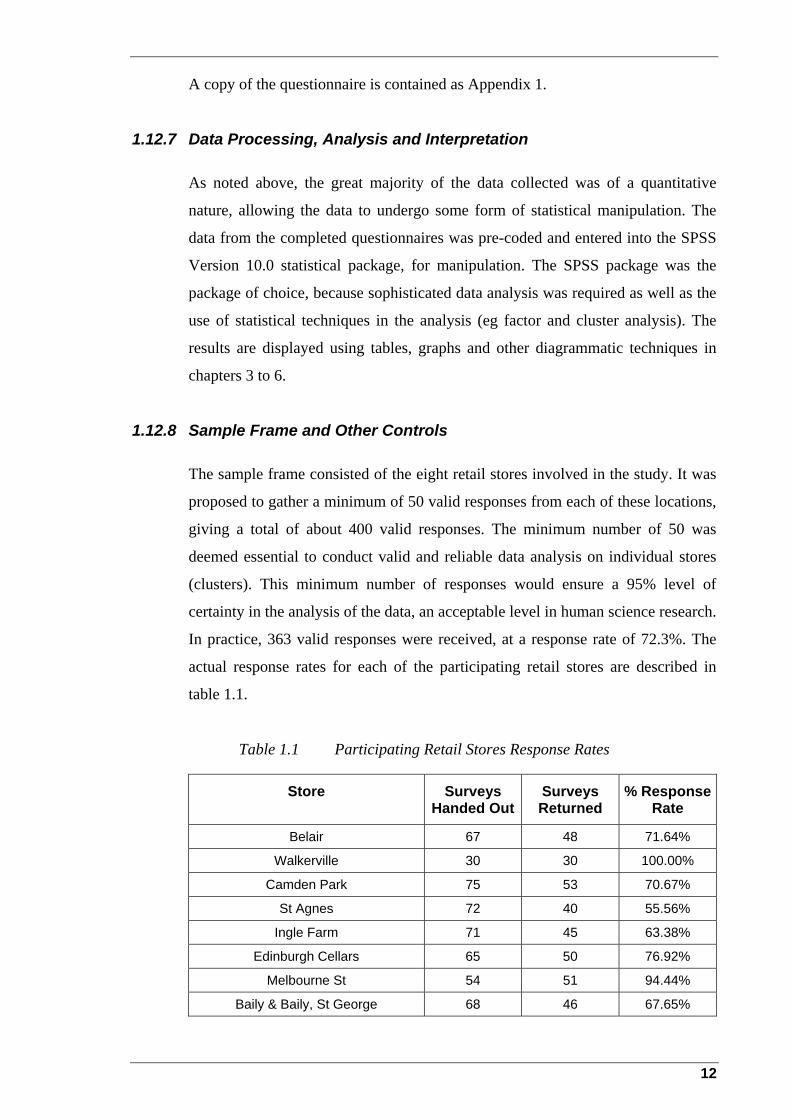
1.12.8 Sample Frame and Other Controls
The sample frame consisted of the eight retail stores involved in the study. It was
proposed to gather a minimum of 50 valid responses from each of these locations,
giving a total of about 400 valid responses. The minimum number of 50 was
deemed essential to conduct valid and reliable data analysis on individual stores
(clusters). This minimum number of responses would ensure a 95% level of
certainty in the analysis of the data, an acceptable level in human science research.
In practice, 363 valid responses were received, at a response rate of 72.3%. The
actual response rates for each of the participating retail stores are described in
table 1.1.
Table 1.1 Participating Retail Stores Response Rates
Store Surveys Handed Out
Surveys Returned
% Response Rate
Belair 67 48 71.64%
Walkerville 30 30 100.00%
Camden Park 75 53 70.67%
St Agnes 72 40 55.56%
Ingle Farm 71 45 63.38%
Edinburgh Cellars 65 50 76.92%
Melbourne St 54 51 94.44%
Baily & Baily, St George 68 46 67.65%
12
Store Surveys Handed Out
Surveys Returned
% Response Rate
Total 502 363 72.31%
Although no comparative information is available, a response rate of 72.3% for a
study of this nature and extent can safely be regarded as exceptionally high.
The questionnaire was administered by trained and well-briefed interviewers, to
ensure uniformity of application, conformity of results and limit interviewer bias.
Each interviewer was provided with written instructions to supplement the verbal
information provided to them. A copy of those written instructions is contained as
Appendix 2. The study author conducted random checks of completed
questionnaires to confirm the validity of responses. At some participating retail
stores, incentives (in the form of a bottle or magnum of wine) were made
available by the store management to ensure an adequate response rate. The
potential respondents were intercepted upon entering the store to ensure that there
were no preconceptions about the market research being conducted in store. In
addition, this method of interception minimised any potential bias pertaining to
that day’s purchases.
An assumption made about intercept interviews was that one person in two
refusing to co-operate in this type of setting was not uncommon. This was the
experience in the first two days of data collection, when the only option was to
complete the survey in store. However, once the option of completing the survey
in the respondent’s own time was made available, the rate of refusal to co-operate
diminished significantly. In the event of any refusal, the interviewer ‘replaced’
that person with the next most similar person entering the store, thereby limiting
respondent selection bias. In any event, non-response bias was expected to be
lower in this study, as the topic was likely to be one of interest to the wine
consumer and this was confirmed. However, non-response error and item non-
response error were limited by the use of professionally set questions. Response
error was limited by the use of a highly structured questionnaire and the option of
either a face-to-face interviewing technique or the ability to contact the study
author about any issues, further assisted in limiting this error type.
13

To ensure that the prospective respondents qualified to complete the
questionnaire, screening questions were posed.
1.13 Organisation of the Dissertation
This chapter has provided the framework within which the research study was conducted.
The main research problems and associated sub problems and hypotheses were introduced
and the actual methodology used during the study was explained in detail. The next chapter
(chapter 2) is mainly concerned with a thorough examination of the academic works that
underpinned this research. Chapter 3 identifies the various segments in the South
Australian wine market and forms the basis for the remainder of the analysis carried out in
the dissertation. Chapter 4 examines the use of risk reduction strategies in the purchase of
wine and chapter 5 takes this further by identifying the preferred risk reduction strategies
for all of the identified segments in the market. Chapter 6 explores the relationship
between a consumer’s wine knowledge and the quality of wine that they consume and
provides some additional demographic and consumption data about the market. Chapter 7
concludes this dissertation by discussing whether the research process had resolved the
main research problem.
14
Chapter 2 Literature Review
2.1 Introduction
One of the keys to a successful marketing strategy is a thorough understanding of
consumer behaviour, which can be described as an understanding of the how, when and
why consumers purchase goods and services. Most marketing strategies are based on
market segmentation and knowledge of how consumer behaviour differs from one segment
to another (Neal, Quester & Hawkins, 1999). Bauer, in the early 1960s, identified risk as a
contributing factor in the consumer buying decision process (Mitchell & Greatorex,
1989:31). In relation to the purchase of wine, Batt & Dean (2000: 34) put it succinctly …
“for the majority of consumers, purchasing wine from a retail liquor store evokes
considerable risk”. Mitchell & Greatorex, quoted in Spawton (1991a: 37), felt that … “the
majority of wine purchasers are highly risk sensitive and their wine purchase behaviour is
governed by factors that influence behaviour and the risk reduction strategies adopted
during the purchase process”. They suggested (1989: 34) … “It is important to marketers
to discover how consumers reduce risk in order to manipulate these strategies to the
advantage of their brands”.
This research study confronted the issues of wine market segmentation and risk reduction
and examined, for the first time in the history of this relatively young science, the preferred
risk reduction strategies employed by a number of identified segments in the South
Australian wine market. Previous research had centred purely on the identification of these
segments, but none had explored the risk reduction strategies employed by these segments,
that are methodologically, from primarily a deductive perspective.
This research study had the wine retail environment as its focus in terms of application
(refer chapter 1.1). Previous authors (eg. Mitchell & Greatorex, 1989: 31) contended that
reducing the risk (or perceived risk) associated with the purchase of wine … “could aid the
development of the … market”. Consequently, the focus of this research study was to
15
examine the ways in which reducing risk in the wine retail environment impacted on the
subsequent consumer buying behaviour.
The reduction in risk associated with the purchase of wine, will, according to Mitchell &
Greatorex (1989), lead to the purchase of higher quality wine. The consumption of a higher
quality wine also increases the knowledge and experience of the consumer. This is
(logically deductively) likely to have a two-fold effect. Firstly, it is likely to reinforce the
consumption of the higher quality wine and further reduce the risk and secondly, it is likely
to determine the segment into which the consumer fits.
An important assertion of this research study was that the wine retailer has control over
most ‘tangible’ aspects of their business. Many of these aspects were regarded as
manifesting themselves into strategies that assisted consumers in reducing the risk
associated with the purchase of their wine. If the wine retailer was aware of the different
types of strategies that produce the largest reduction in risk for the consumer segment/s
that frequent the store, then this was the foundation for a competitive advantage.
Consequently the reduction in risk was likely to improve the quality of the wine purchased
and hence increase the available profits.
Based on the above discussion, figure 1 below outlines a conceptual Risk Reduction Model
that was developed for and used as the theoretical framework in this research study.
Figure 2.1 Conceptual Risk Reduction Model for the Purchase of Wine
(* Note that 5 segments were assumed, as one of the study’s aims was to reconfirm and/or adjust the 5 previously identified lifestyle segments identified by Bruwer at al., (2001))
16
NOTE: This figure is included on page 16 of the print copy of the thesis held in the University of Adelaide Library.
F
that these examinations were of a general nature. No previous research has explored the
issue of risk reduction strategies employed by specific wine market segments and this
becomes the focus of the proposed research.
2.1 Development of a Marketing Orientation
Marketing text books describe the development of marketing as a science that evolved
from mass or consumer marketing in the 1950s, through industrial marketing in the 1960s,
to customer satisfaction, gl
or contextualisation purposes, this literature review will firstly explore market
segmentation as a construct and the various methods (bases) used to achieve segmentation.
The shortcomings in the ‘classical’ approaches are discussed and an alternative method of
segmentation introduced. The segmentation of the wine market in general and the
Australian wine market specifically, are covered in some detail, as it was central to the
research. It will become evident from the review that none of the literature has previously
covered the preferred risk reduction strategies employed by individual wine market
segments. A model of segmenting the South Australian market for the purposes of this
research is finally proposed.
Secondly, the review covers the risk reduction strategies identified in the literature and
links them to the wine retail environment. Two of the early writings about the wine
industry examined the influence of risk on the purchase of wine, but the review will show
obal and synchronous marketing in today’s environment
otler, Armstrong, Brown, Adam & Chandler, 2001). This development is further refined
ain a competitive advantage through target
arketing, they must adopt a marketing orientation. Various definitions of marketing
01: 19) state “…achieving
organizational goals depends on determining the needs and wants of target markets and
(K
into three distinct stages – mass marketing, where one product fits all buyers; product –
variety marketing, where two or more products meet buyers’ needs; and target marketing,
where products and services are tailored to meet the needs of identified target market
segments (Kotler et al. 2001).
Today, companies have realised that to sust
m
orientation have been suggested in the literature. Kotler et al. (20
delivering the desired satisfactions more effectively and efficiently than competitors do”.
They labelled this the marketing concept that “…starts with a well defined market, focuses
on customer needs, co-ordinates all the marketing activities affecting customers, and
17
makes profits by creating long-term customer relationships based on customer value and
satisfaction. Under the marketing concept, companies produce what consumers want,
thereby satisfying consumers and making profits”. Narver & Slater (1990: 22) alternatively
define marketing orientation as “… an organizational culture that most effectively and
efficiently creates the necessary behaviours for the creation of superior value for buyers
nd, thus, continuous superior performance for the business”. In further research they
ass market in an effort to decipher or make more
nse of those intangibles.
ket consisting of buyers with different needs and wants, into
a
stated that … “a market orientation is valuable because it focuses the organization on (i)
continuously collecting information about target customers’ needs and competitors’
capabilities, and (ii) using this information to create continuously superior customer
value.” (Slater & Narver, 1995: 63). Yet another view is that of Jaworski & Kohli
(1993:53) who propose that a marketing orientation consists of three components: “(i)
organization wide generation of market intelligence pertaining to current and future
customer needs, (ii) dissemination of the intelligence across departments, and (iii)
organization wide responsiveness to it”.
The common themes that emerge from these various theories are that any organisation that
has adopted a marketing orientation has a customer and competitor focus, undertakes
intelligence gathering about its markets, consumers and competitors and then creatively
uses that intelligence to remain one step ahead of its competition. This means that the
organisation is quick to react to consumer needs and wants, provides its goods and services
in a timely and efficient manner and ultimately provides shareholders with greater returns
on their investments.
Therefore, the key to understanding any market lies with the intangibles inherent in
consumer demand and consumer behaviour. The social changes of the 1960s fragmented
the consumer market so that mass marketing techniques were often redundant. Market
segmentation examines this fragmented m
se
2.3 Market Segmentation as a Construct
Market segmentation is defined in the literature (Kotler et al., 2001: 292) as … “dividing a
market into distinct groups of buyers with different needs, characteristics or behaviour who
might require separate products or marketing mixes”. Alternatively … “it is the division of
a heterogeneous mar
18
homogeneous segments of buyers with similar needs and wants” (Monash University
ely apply its marketing resources through the marketing mix to
eet the needs of its customers and it may identify additional marketing opportunities that
(unsegmented) mass market.
.4.1 Classical Segmentation Approaches and Their Shortcomings
segmenting markets come from one or a combination of the following variables:
geographic, demographic, behavioural and psychographic. Some proponents (eg.
Wyner, 1992) separate attitudes, needs and benefits from behavioural
characteristics, whilst others (eg. Kotler et al. 2001) include them under the
ion, usage rate, benefits
areas. Firstly, he sets out the strengths and weaknesses of these classical bases for
segmentation. He notes that demographics are descriptive variables that … “lack
product
needs”. Demographics will provide a great deal of detail about the consumer but
Faculty of Business and Economics, 2001), or “to identify different types of customers
who will be treated differently from a marketing perspective” (Wyner 1995: 40).
It follows that a company that understands its target market through segmentation will
more efficiently and effectiv
m
were not obviously apparent by examining the homogeneous
2.4 Bases for Market Segmentation
In this section, several bases for market segmentation, their pros and cons, and applications
to a ‘real world’ product category such as wine, will be discussed. First, an overview is
given of the traditional or classical segmentation approaches, as they are more commonly
known:
2
The marketing literature is generally agreed that the “classical” bases for
general banner of behavioural, along with usage occas
sought and loyalty status.
Wyner’s (1992: 39) observations have direct relevance to this study in two key
any direct link with a product category and any indication of unfulfilled
will give no pointers to the underlying motivations that drive that consumer
behaviour.
Wyner (1992) then discusses behavioural and psychographic measures. Heath
(1995: 75) described psychographic measures as joining … “consumers’
19
measurable demographic characteristics with the more abstract aspects of
attitudes, opinions and interests”. Wedel & Kamakura (2000: 259) take this one
tep further and state that psychographics and lifestyles are often used
lthough it may have been outside the scope of the article, Wyner (1992) does not
dynamic product category. Wyner (1992) goes on to state that
s
interchangeably in the literature, whereas they make the observation that there is a
… “distinction between the construct (lifestyles) and its operationalization
(psychographics)”. They further state that the main purpose of psychographics is
to … “obtain a better understanding of the consumer as a person by measuring
him/her on multiple psychological dimensions as well as on the way s/he lives,
things in which s/he is interested and his/her opinion on a diverse range of current
topics”.
Wyner (1992: 40) states that behavioural measures indicate which consumers
have responded to a marketing message, but they do not provide information on
why they responded in the manner in which they did. He contends that attitude
measures can assist the marketer in pinpointing those consumers in the target
market who … “are most receptive” to their appeals. Alternatively, attitude
measures, by their very nature, are more difficult to measure. Psychographic
measures attempt to … “isolate personality types that cut across product category
boundaries” (Wyner 1992: 40). However, he highlights that the issue of cutting
across those boundaries is also considered the weakness in psychographic
measures, as a personality type reveals nothing specific to the particular product
in question.
A
offer any alternative strategies in relation to the shortcomings that he identified in
each of the segmentation measures. Rather, he leaves it up to individual marketers
to decide what type, or combinations of measures best suit their company or
industry.
The second of Wyner’s (1992: 41) observations of relevance is the assertion that
… “ in a very dynamic product category there is likely to be some important
shifting between segments”. Given the very many brands that proliferate retailers’
shelves and the continuing influx of new producers and labels onto the market,
there can be little argument that wine, which forms the basis of this research
study, is a
20

migration may result from changes in the natural life cycle of consumers or occur
reduce the risk inherent in the purchase of wine.
2.4.2
Grunert, Brunso & Bisp, (1993) proposed a cross–culturally valid, food–related
lifestyle survey instrument as a means of segmenting the food market in several
European countries. The arguments that are put forward in relation to this
instrument address many of the criticisms of the ‘classical approach’ to
segmentation. As wine is closely and spontaneously related to food, these
arguments bear further scrutiny.
Lifestyle variables in consumer research are not a new concept, having first been
introduced by Lazer in 1963 (cited by Grunert et al. 1993; Kamakura & Wedel,
995; Wedel & Kamakura, 2000). Lifestyle variables are usually associated with
psychographic segmentation methods (Heath, 1995; Grunert et al. 1993), meaning
that the variable … “was subjective in nature (in contrast to objective criteria like
demographics or rate of usage) and that it was not product specific (unlike product
oking for improved research methods to assist in
advertising strategy design and copy writing.
as a result of external factors. In the case of Australian wine consumers, the
natural life cycle could equate to increased economic means. The external factors
mentioned by Wyner (1992) may relate to an increased wine knowledge and
experience. These factors may determine the consumer’s wine market segment, or
they could
An Attempt to Overcome the Shortcomings of Classical Segmentation Approaches
1
attitudes or preferences), but rather a general characteristic of the consumer
(Grunert et al. 1993: 4)”. Grunert et al. (1993) provided four main motives that
drove lifestyle research in marketing:
• Demographic and other traditional segmentation variables did not provide the
level of sophistication needed to understand the fragmented market.
• Advertising agencies were lo
• Researchers were looking for ways to identify the consumers to whom post
material values applied. This need fuelled interest in values and lifestyle
measures.
• The need to detect global segments (Grunert et al. 1993: 3 – 4).
21

Support for Grunert et al.’s (1993) approach is provided by Kamakura & Wedel
(1995), who provide an objective for lifestyle variables … “Because lifestyle
characteristics provide a rich view of the market and a more life-like portrait of
the consumer, they meet the demands of management practice for increasingly
clas lifestyle
opin edel, 1995: 308).
Wed
psychographics and lifestyle as a segmentation approach … “the quality of the
lying reasons
r observed consumer behaviour … the generality of the consumer profiles
search focus
redominated:
The derivation of the underlying dimensions is unclear and/or unsatisfactory;
sophisticated and actionable marketing information. Lifestyle schemes aim at
sifying consumers into segments with specific and identifiable
patterns, on the basis of numerous scales assessing activities, interests and
ions” (Plummer, 1974, cited in Kamakura & W
el & Kamakura (2000: 259) provide further reasons for the popularity of
motivational insights obtained is useful in understanding the under
fo
obtained through psychographic segmentation makes it applicable to a wide range
of products and services … the conceptual framework is flexible enough that
measurement instruments can be tailored to specific domains of applications …
the consumer profiles obtained are implementable, in that they provide guidance
for new product development and the execution of advertising messages”.
The lifestyle method of segmentation grew rapidly, in both popularity and as a
research method in the 1970s, during which two major areas of re
p
• AA – Activities and Attitudes; and
• AIO – Activities, Interests and Opinions.
The latter approach became the most widely adopted. Grunert et al. (1993: 9) refer
to this dominant approach as a … “cognitive, inductive approach”. However, they
further also soberly state (1993: 6–7) that despite their popularity, lifestyle
variables attracted criticism on five major grounds:
• “There is no agreement on what lifestyle means;
• The methods used are purely inductive and not guided by theory;
•
• The explanatory value of lifestyle types or dimensions with regard to
consumer choice behaviour is low and not well documented; and
22

• The cross-cultural validity of the international lifestyle instruments remains to
ng the theory that a hierarchy
c ur as a base, Grunert et al.
e system of
proposed the following five elements that linked food products and values:
. “Shopping scripts;
be demonstrated”.
These criticisms led to two proposals by them for improvement of the so-called
lifestyle model … “the first relates to sharpening the distinction between values
and lifestyles. The second is concerned with the lifestyle in a hierarchy of
cognitive categories” (Grunert et al. 1993: 11). Usi
of ognitive categories determine consumer behavio
1993: 13) proposed a definition of consumption-related lifestyle … “th
cognitive categories, scripts, and their associations, which relate a set of products
to a set of values”.
Grunert et al.’s (1993: 14) particular interest was food-related lifestyles and they
1
2. Meal preparation scripts;
3. Desired higher - order product attributes;
4. Desired consequences; and
5. Usage situations”.
These elements and their inter-relational nature are depicted in figure 2.
Figure 2.2 A Cognitive Structure Model for Food – Related Lifestyle
higher - orderutes
concreteattr ibutes/
productcategories
situations
scripts
Shoppingscripts
mealpreparation
values consequences attr ib
U sage
23
Source: Grunert et al. (1993: 15)
Grunert et al. (1993) felt that the different food-related lifestyles were a
combination of the relevant importance of these five elements (cognitive
categories) and the way that these elements relate to both one another on the one
hand and with the values and products at their respective ends of the hierarchy on
the other.
This theory formed the basis for the development of a survey instrument to
determine food-related lifestyles. Furthermore, Grunert et al. (1993: 33) stated
that this instrument was cognitively based and cross-culturally valid. They also
acknowledged … “a revised version of the instrument should be applied … in
order to study its properties for clustering and segmentation”. Due to the close
relationship between the food and wine markets, it is therefore probable that a
similar approach would succeed in segmenting the wi
this option, it is therefore appropriate to review the past attempts to segment the
wine market.
2.5 Wine Market Segmentation Approaches/Studies
Gluckman (1990), Spawton (1991a,b) and Lockshin (1999) have all been critical
of the wine industry’s mass marketing approach. Spawton (1991a) noted that the
main objective of mass marketing was to create a homogenous market. He further
indicated that an alternative to this approach in Australia was to market to
particular, identified target markets. Thus Spawton (1991a) recognised that the
wine market was not homogenous, and acknowledged the importance of wine
market segmentation in developing a deeper understanding of the wine consumer.
Essentially, nine different segmentation variables have been used to study wine
markets, both in Australia and elsewhere. These variables are examined in some
detail and include:
• Consumption;
ne market. Before exploring
• Risk reduction;
• Occasion based;
• Means-end chain analysis;
24

• Behavioural;
• Involvement;
• Geographical;
• Quality; and
• Wine-related lifestyle
Gluckman (1990: 30), in his meta-analysis of the United Kingdom (UK),
American and Canadian wine markets between the years 1978 and 1984, was one
of the first authors to suggest that the wine industry was slowly adopting a
r n … “it is increasingly evident that the wine marketing mix
phasis has changed from one of ability to dominate lines of distribution to one
fi best satisfy consumers’ needs”.
d kman (1990: 31) noted that some form of market/consumer
ld occur to identify … “the homogeneity of needs of the wine
that consumer segmentation offered greater scope than product
to the legislative constraints on wine. Gluckman (1990) further
kn ber of approaches to segmenting the wine market
resumably predominantly in the UK where he acknowledged that most of his
Consumers’ consumption; and
ma keting orientatio
em
of nding brands that
Ad itionally, Gluc
segmentation shou
consumer” and felt
segmentation due
ac owledged that a num
(p
data originated) had been tried, but none had proven to be more valuable than
another. The methods of segmentation that he described are closely aligned to the
traditional methods discussed earlier, namely:
• Drinking occasions;
• Types (price/quality) of wines;
• Consumer attitude types;
•
• Consumers’ demographic types.
Gluckman (1990: 35–36) then provided a generic overview of each of these
segmentation methods. The examples described in relation to the “types
(price/quality) of wines” segment should be considered, due to their similarity to
later work, describing this segment as:
• Connoisseurs’ wines;
• Good wines;
25
• Nice wines; and
• Plonk.
Sp ton (1991a,b) and Jennings aw & Wood (1994) were critical of the wine
u ion orientation approach to marketing, to the
etriment of a marketing oriented approach. This meant that the industry
nd adjust to an increasingly competitive
r Wood, 1994: 50). This accords with Gluckman’s
e rmally recognised reported approach to segmenting the Australian
ine market was that of McKinna in 1986. McKinna (1986: (i)) undertook a
erstand and segment the market”. From the qualitative stage of the
tudy, five market segments for wine were identified. By combining both the
quiring, authoritative and
pen–minded way … The connoisseur has a well developed palate … is
ind stry’s historical sales and product
d
concentrated on its production capabilities and sales and distribution channels
rather than collecting and analysing consumer information in an effort to tailor
their products to meet consumer needs … “by being production based, the wine
industry is poorly placed to respond a
ma ketplace” (Jennings &
(1990) view.
Th first fo
w
detailed study of the South Australian wine industry, as perceived by consumers
in Melbourne and Sydney, Australia’s two largest wine markets. The general
objective of the research was … “to study wine drinkers’ perceptions, levels of
knowledge and purchasing and consumption habits with respect to the South
Australian wine industry and South Australian wines”.
The study consisted of both a qualitative and a quantitative stage. McKinna (1986:
14) noted … “In a strategic sense, the single most important task in this exercise is
to clearly und
s
qualitative and quantitative data, McKinna (1986) proposed the following
segments and their descriptors. Given that much of the later work on the
Australian market was based on McKinna’s (1986) lexicon classicus work, it is
relevant to provide some detailed excerpts from his findings.
(i) The Wine Knowledgeable or Connoisseur The distinctive feature of the wine connoisseur is that he/she really knows wine, is
a student of wine and approaches the subject in an en
o
experimental and tries wines to make up his mind, rather than follow a trend or
fashion … A distinguishing feature of the wine connoisseur is his true
26

preparedness to experiment, to seek out new varieties, try new wine areas and
approach new vignerons, often without prior experience or knowledge … They
are not price sensitive and but wines at all levels in the price spectrum …
Branding is less important to the connoisseur. They tend to make their own mind
up based on such things as:
• The character of the particular grape or blend
• The ability and reputation of the winemaker
. Wine provides a perfect vehicle to express his/her
ience of life. … This person is
fluenced by information … The
p much
est in wine per se but, rather, the need for
information to impress his/her peers and be able to order wine in a restaurant
he/she talks about wine is often disguising a deep-down lack of knowledge about
• The reports on the quality of the particular vintage in the particular area
• The lasting qualities of the wine.
(ii) The Wine Pretentious or Aspirational The main distinguishing characteristic of the wine pretentious person is that
he/she is more into the image and aura surrounding the wine than the actuality of
the taste, the bouquet and/or general drinking experience … Whereas the
connoisseur gains personal, real enjoyment from the wine, the pretentious, whilst
enjoying wine, gains much more from the social aspects that surround wine rather
than the inherent properties of the wine per se. He/she uses wine to make a
statement about him/herself
individuality, sophistication, knowledge and exper
an information seeker about wine and is easily in
im ortant thing to note, though, is that this desire for information is not so
based on a deep-down personal inter
authoritatively or talk about it over a dinner party … The wine pretentious is
trendy and capricious … The apparent sophistication and confidence with which
the subject.
(iii) The Young Bottle Wine Drinkers The people in this group are almost always in their twenties or mid-thirties and in
white collar occupations on a career path … This group detest cask wine and
almost exclusively drink the low to lower-middle priced bottled wines, usually
preferring dry whites or dry reds … They do not really know enough about wine
or are not interested enough to be classified as either a connoisseur or a wine
pretentious. Because of their young age, they have not had the time to accumulate
much knowledge about wine and, because of their busy lifestyle, they do not have
27

the time to learn more. There is nor doubt that many will become the wine
connoisseurs of the future … Because of their independence and contempt for
peer influence, this group does not qualify as wine pretentious. They buy and
drink what they like themselves and do not care much about what others think;
they are too far down the career path to be worried about what their work
part of her
regular shopping trip. She either loyally buys her favourite brand and, in some
newspapers and letterbox leaflets … By their own admission, this group are very
colleagues think and, because their social life is spent with close friends with
similar tastes, they do not find any need to be pretentious about wine.
(iv) The Average Cask Wine Drinker In terms of volume, this group account for the majority of wine sales, but a
disproportionately small share of the profits. They almost exclusively drink cask
wine, although occasionally have a bottle on a special occasion, either for a dinner
party or to take to a BYO restaurant; this is usually a low to medium priced wine
… In choosing the cask wine, this group tend not to be very experimental; rather,
they choose from the three or four regular brands that they have tried and come to
trust. There is an element of safety in this process because there is an underlying
feeling that “you do not want to get stuck with 4 litres of wine that you do not
like” and which evolves what is perceived to be a relatively high level of
expenditure … The choice is generally from the nationally advised (sic) brands.
More often than not, the so-called ‘housewife’ purchases the wine as
cases, shops around for price specials between those in her repertoire. Typically,
they are price conscious and follow advertised specials, taking a lot of notice of
unsophisticated about wine and, having no real interest or pretence about the
subject, they simply want a wine they like to drink, which satisfies their palate and
which does not cost much … This group tend not to be influenced by peer group
pressure, making up their own mind to suit their individual taste … These people
see wine as a form of relaxation and reward.
(v) The New Wine Drinker The final group is the “new wine drinker” which, almost exclusively, comprises
younger, under 30 year olds … One interesting point about this group which
should be made at the outset, however, is that the younger wine drinker appears to
be much more interested and willing to try more variety than their older
counterparts, despite their lower level of knowledge. It is clear that many people
28

in this category will become heavy wine drinkers in the near future, with many
reaching the status of connoisseur … Interestingly though, some of this group
exhibit fairly sophisticated palates, preferring a wide range of wines including the
wood matured whites and reds … This group is reasonably price sensitive in the
sense that they are unlikely to purchase the higher priced wines … On the other
hand, they are not price sensitive in the sense that they do not shop around for
specials. More times than not, they would purchase from the local pub bottle shop
McKinna (1986) used a number of variables to arrive at his final five segments.
Aspirational drinker as one who is an avid information seeker. That information,
safe brands
h of McKinna’s (1986) work
rmed the basis of the later work of Spawton.
Spawton (1991b) believed that wine consumers were becoming more
Anderson & Stringer, 1998; Rabobank, 1999; Spahni, 1999 and 2000). Spawton
the segmentation variables were consumer expectations and risk reduction. He
oted the segments as:
on the way out to a party” (McKinna, 1986: 15–23).
Clearly he used demographics to describe each of the segments. McKinna (1986)
has also touched on risk reduction as a method, especially in the description of the
however, is used to boost their egos in the presence of their peer group, rather
than as a thirst for knowledge about wine. He also introduced the concept of
regular brands that are trusted – the concept later described by
Spawton (1991a,b). McKinna (1986: 14) pinpointed that demographics and
socioeconomics alone are not enough to segment the wine market when … “usage
patterns, attitudes, opinions, perceptions and preferences do not neatly fall into
such groups, but flow over all such boundaries”. Muc
fo
knowledgeable about wine and were generally drinking less wine, but wine of a
higher quality. Subsequent data has confirmed that as a worldwide trend (Berger,
(1991a: 40) stated that the wine market was one that should be segmented, in
order to identify the opportunities afforded by the consumers’ increasing
sophistication … “The adoption of market segmentation rather than the practice of
mass marketing will enhance the focus and differentiation so necessary to enhance
a growing fine wine market”. Spawton (1991a: 40) further wrote that McKinna’s
(1986) study identified four (this author’s emphasis) major segments, stating that
n
29
1. Connoisseurs This is the wine knowledgeable segment, the primary purchasers of fine
wines. These people consume wine on a regular (daily) basis. They have a
broad spectrum of tastes and like to experiment, although adoption of new
tastes may be slow. They are brand loyal, have strong preferences and make
their decisions in advance of purchase. They prefer to purchase from
specialist wine merchants, auctions, or directly from wineries. These
consumers see wine education as a hobby, read wine journals avidly, and are
not price sensitive.
2. Aspirational Drinkers Members of this segment are concerned with the social aspects of wine
drinking. They purchase fashionable wine styles and are attracted to the more
ds and labels. Brands act as symbols of status and for
3. consumers with little desire to appreciate wine. They are
are not prepared to experiment. They buy wines in
4.
are strongly influenced by the occasion where wine
unsophisticated and have limited parameters for
fashionable bran
reassurance. These buyers are highly risk-averse and will spend considerable
time in the search process. They will often need the confidence of the retail
assistant and will choose outlets dependent on convenience and their
confidence in the retail staff. Aspirational drinkers are strongly influenced by
wine writers, journalists and opinion leaders. They are likely to attend wine
appreciation courses.
Beverage Wine Consumers These are avid wine
loyal to a wine style and
an impersonal supermarket environment. They are brand-loyal to a range of
‘safe brands’, where choice is dependent on a consistent taste, price and
price-related promotions.
New Wine Drinkers These are the young who are attracted to wine based on the behaviour of their
parents or peer group. Preferences are not yet established but sparkling wine
and coolers may feature strongly in the choice of product consumed. Wine is
purchased at social occasions and often “on premises” at pubs, discos, parties
and restaurants. They
may be consumed. They are
choice, but often use price as a determinant for purchase.
30

Spawton (1991a,b) has condensed the five segments of McKinna to four and has
e some (unsubstantiated by any empirical research evidence) alterations to the
riptors of some of the seg
mad
desc ments. For example, Spawton (1991a,b) states that
connoisseurs are avid readers of wine journals, whereas McKinna (1986: 15)
desc
How
the s
It is
ignored one market segment, “the young bottle wine drinker”, especially one that
McK ntial to develop …
There is no doubt that many will become the wine connoisseurs of the future”.
McKinna (1986) stated that this segment consumed a lot of low to medium priced
’s
egments. They state that the original model of McKinna was devised from a
(1999) research concluded that there was empirical evidence to confirm the
Winchester’s, 1999) findings:
Hall & Winchester (1999)
ribes them less enthusiastically … “may or may not read wine articles”.
ever, it is fair to say that the general descriptors employed by Spawton reflect
entiments expressed by McKinna, where the two segments are ‘identical’.
a little more difficult to understand why Spawton (1991a,b) completely
inna (1986: 20) five years earlier, believed had the pote
“
wine that was quite often purchased in dozen lots. This segment seems to be one
that the Australian wine industry should actively target (as per Spawton’s (1991a:
40–41) conclusion that the consumer should be part of the industry’s strategic
agenda), thus making its ‘absence’ rather mystifying to say the least.
Hall & Winchester (1999: 24) set about an empirical confirmation of Spawton
s
qualitative study and that no empirical data was available to support its findings,
or the subsequent segments proposed by Spawton (1991a,b). Hall & Winchester’s
existence of three of Spawton’s four segments and that the fourth segment, ‘New
Wine Drinkers’, should be amended. The following table sets out their (Hall &
Table 2.1 Comparison of Wine Market Segments Identified
Spawton’s (1991) Segments Segments Identified,
Connoisseurs Connoisseurs
Aspirational Wine Drinkers Image Concerned
Beverage Wine Consumers Risk Averse
New Wine Drinkers Enjoyment
Source: Hall & Winchester (1999: 30)
31

It is interesting to note how authors used the segment descriptors ‘selectively’. For
example, Hall & Winchester’s (1999: 32) “Enjoyment” segment … “is concerned
about having a beverage that is easy to drink, relaxing, special to share and one
that helps to unwind”. In a follow-up publication, Hall & Winchester (2000: 71)
later furth at worried
abou eption of na’s
(1986: 20) “the Young bottle wine drinkers” lead life with
many meals eaten at restaurants and friends’ houses. They are described as
indepen or peer influences … “They buy and drink what
they like themselves and do not care much about what others think”. They spend
their time with their close friends, who share similar tastes.
t this, the secondary research stage, it appears to this author that Hall &
approach, a
rm of benefit segmentation. Although this type of research had previously been
mers and can be shown diagrammatically as:
er state th the “Enjoyment Oriented” drinkers are … “less
t what significant others’ perc their wine choice is”. McKin
a very active social
dent and having no time f
A
Winchester (1999) may actually have confirmed McKinna’s (1986) third segment,
the one omitted by Spawton (1991a,b) from his original documents.
Other authors also attempted to segment the wine market using a number of
different approaches. Johnson, Ringham and Jurd (1991) provided an insight into
behavioural segmentation of the Australian wine market. They felt that their
approach was superior to the traditional demographic and psychographic
segmentation schemes employed by researchers and marketers. Although they
have provided some empirical evidence to support their findings, their study is
severely limited by its proprietal nature that precludes a detailed analysis of their
results.
Dubow (1992) mentioned an American study undertaken some years earlier, that
had segmented the American wine market using an occasion based
fo
undertaken in the soft drinks market, it was once again unreported due to its
proprietal nature. This was the first of its kind reported about the American wine
market. Dubow (1992) concluded that occasion based segmentation was workable
and provided additional information to any benefits based segmentation attempt.
Judica and Perkins (1992) adopted a means-end chain approach to segmenting the
American sparkling wine market. This approach studied the behaviour and values
of consu
32
Figure 2.3 Means-end Chain Analysis
Product attributes (means) → consequences → value satisfaction (end)
Source: Adapted from Judica & Perkins (1992: 11)
This study segmented the market on the basis of usage rate or consumption (light
and heavy users). The extremely low number of respondents (n = 27) may have
undermined the validity of the findings and one could question their validity
levant to the overall population.
ccasions where wine could be consumed and demonstrated that a means-end
chain analysis prov e ct positioning and
the basis of the usage occasion and the → →
then provides the texture to associate specific brands with specific occasions, or
nd purchasing involvement as the basis. They
oncluded that using involvement as the segmentation variable was successful,
s the various wine segments. Rabobank (1999) segmented the world
ine market on the basis of quality, perhaps perpetuating the criticism that the
re
Hall & Lockshin (1999) also used the means-end chain approach to analyse
consumption situations in the Australian wine market. They identified eight
o
ided consid rable scope for both produ
market ted onsegmentation. They demonstrated that the market could be segmen
attributes consequences values chain
segments.
Lockshin, Spawton & Macintosh (1997) reported the first attempt to segment the
wine market using product, brand a
c
identifying five cluster groupings or segments that could be used for marketing
purposes These segments were identified as Choosy buyers; Brand conscious but
hate to shop; Uninvolved shopper; Interested shopper; and Lazy involved shopper.
Two European studies deserve brief mention in this discussion on wine market
segmentation. Sanchez & Gill (1998) segmented a portion of the Spanish wine
market on a geographical basis and concluded that it is the type of retail outlet that
differentiate
w
wine industry had historically adopted a mass marketing approach. However, the
five segments that Rabobank (1999) identified are accepted, at least by the wine
industry, as a legitimate means of segmenting the market (eg Winemakers’
Federation of Australia, 2000: 7).
33
NOTE: This figure is included on page 33 of the print copy of the thesis held in the University of Adelaide Library.
The most recent research on the Australian wine market is that of Bruwer, Li, &
Reid (2001). They state that it is imperative for the Australian industry to increase
onents or elements of a wine-related lifestyle.
hese components are:
. Consequences of wine consumption.
domestic consumption and to do that, producers must understand the market
through segmentation and target marketing.
They adopted a Wine-Related Lifestyle approach, based on Grunert et al.’s (1993)
earlier work, recognising that other segmentation techniques may not adequately
explain or predict consumer behaviour. Bruwer et al.’s (2001: 105) main assertion
is … “that lifestyle is how consumers mentally link products to the attainment of
life values”. Following Grunert et al.’s (1993) model, Bruwer et al. (2001: 105)
adapted it to consist of five comp
T
1. Wine consumption situations;
2. Ways of shopping;
3. Quality/attributes;
4. Drinking rituals; and
5
Their conceptual model is represented in the following figure:
34
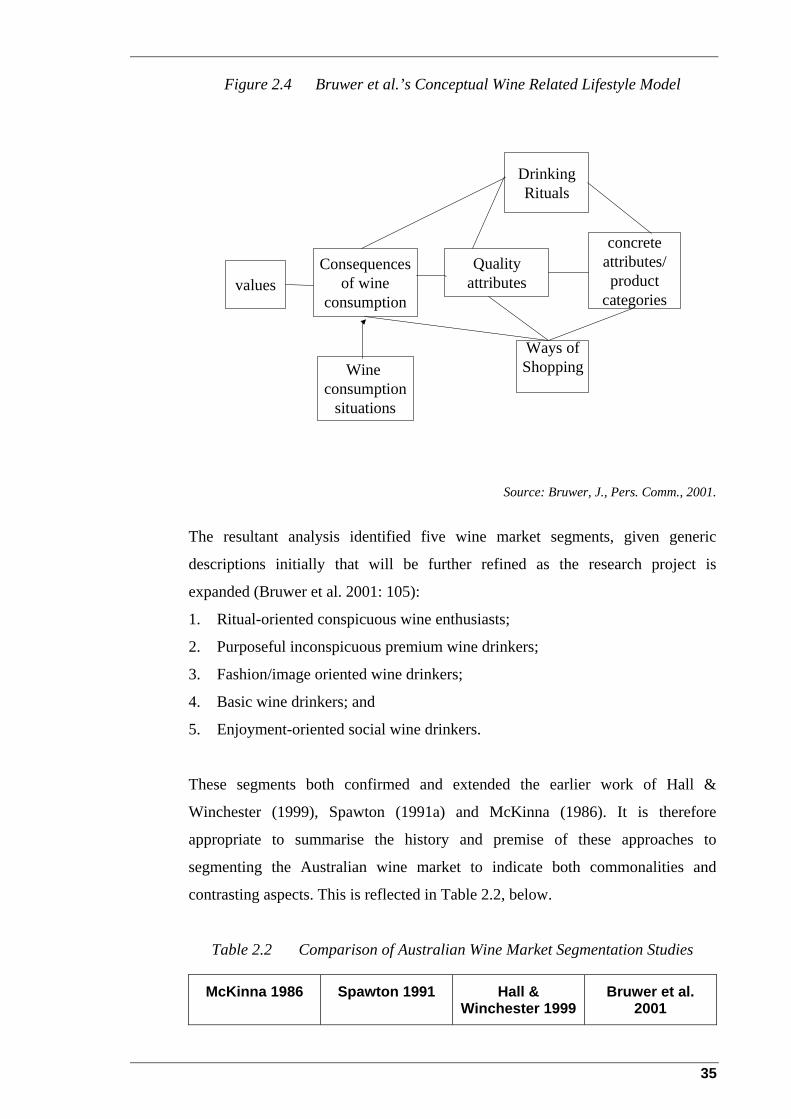
Figure 2.4 Bruwer et al.’s Conceptual Wine Related Lifestyle Model
valuesConsequences
of wineconsumption
Qualityattributes
concreteattributes/product
categories
Wine consumption
situations
DrinkingRituals
Ways ofShopping
Source: Bruwer, J., Pers. Comm., 2001.
The resultant analysis identified five wine market segments, given generic
descriptions initially that will be further refined as the research project is
expanded (Bruwer et al. 2001: 105):
1. Ritual-oriented conspicuous wine enthusiasts;
2. Purposeful inconspicuous premium wine drinkers;
3. Fashion/image oriented wine drinkers;
4. Basic wine drinkers; and
5. Enjoyment-oriented social wine drinkers.
These segments both confirmed and extended the earlier work of Hall &
Winchester (1999), Spawton (1991a) and McKinna (1986). It is therefore
appropriate to summarise the history and premise of these approaches to
segmenting the Australian wine market to indicate both commonalities and
contrasting aspects. This is reflected in Table 2.2, below.
Table 2.2 Comparison of Australian Wine Market Segmentation Studies
McKinna 1986 Spawton 1991 Hall & Winchester 1999
Bruwer et al. 2001
35
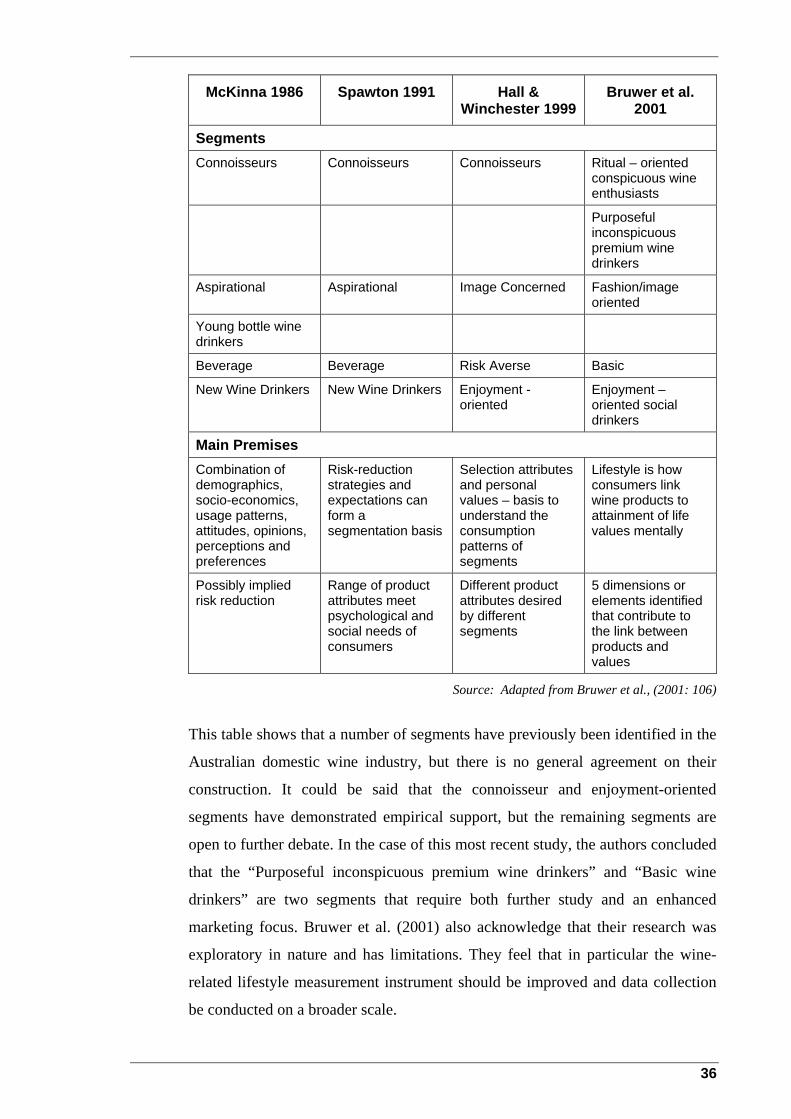
McKinna 1986 Spawton 1991 Hall & Winchester 1999
Bruwer et al. 2001
Segments Connoisseurs Connoisseurs Connoisseurs Ritual – oriented
conspicuous wine enthusiasts
Purposeful inconspicuous premium wine drinkers
Aspirational Aspirational Image Concerned Fashion/image oriented
Young bottle wine drinkers
Beverage Beverage Risk Averse Basic
New Wine Drinkers New Wine Drinkers Enjoyment - oriented
Enjoyment – oriented social drinkers
Main Premises Combination of demographics, socio-economics, usage patterns, attitudes, opinions, perceptions and preferences
Risk-reduction strategies and expectations can form a segmentation basis
Selection attributes and personal values – basis to understand the consumption patterns of segments
Lifestyle is how consumers link wine products to attainment of life values mentally
Possibly implied risk reduction
Range of product attributes meet psychological and social needs of consumers
Different product attributes desired by different segments
5 dimensions or elements identified that contribute to the link between products and values
Source: Adapted from Bruwer et al., (2001: 106)
This table shows that a number of segments have previously been identified in the
Australian domestic wine industry, but there is no general agreement on their
construction. It could be said that the connoisseur and enjoyment-oriented
segments have demonstrated empirical support, but the remaining segments are
open to further debate. In the case of this most recent study, the authors concluded
that the “Purposeful inconspicuous premium wine drinkers” and “Basic wine
drinkers” are two segments that require both further study and an enhanced
marketing focus. Bruwer et al. (2001) also acknowledge that their research was
exploratory in nature and has limitations. They feel that in particular the wine-
related lifestyle measurement instrument should be improved and data collection
be conducted on a broader scale.
36
2.6 Basis for Segmentation in this Research Study
This review of the literature on market segmentation in the Australian wine industry was
included because market segments are central to this research study. Although it was not
the major objective of this research to introduce another approach to segmenting the South
Australian wine market, a segmentation of that market had nevertheless to be undertaken.
From the earlier discussions, it was obvious that any number of approaches might have
been adopted when attempting to segment the South Australian wine market. However, the
approach taken by Bruwer et al. (2001) formed the basis of the segmentation exercise for
the purposes of the research study. There were three main reasons for this decision. The
first was that previous research findings were based on either ‘classical approaches’ to
segmentation, and/or combining these with a lack of sound empirical research evidence
and in the process falling short of explaining the phenomena satisfactorily. Secondly, that
Bruwer et al.’s (2001) findings were the most recent published on the topic and that
immediacy was relevant. Finally, the literature revealed (eg Grunert et al. 1993) that a
lifestyle approach provided the basis for a better understanding of consumer behaviour.
Bruwer et al.’s (2001) research was based on a wine-related lifestyle approach, the first of
this kind, and a similar approach was therefore relevant to this research study. This
approach also provided the additional benefit of proving (or amending) Bruwer et al.’s
(2001) findings.
It is now appropriate to turn to the second and third research sub problems and examine the
literature on risk reduction strategies employed when consumers purchase wine.
2.7 Risk Reduction Strategies and the Purchase of Wine
The research study examined the preferred risk reduction strategies employed by the
identified wine market segments and linked these strategies to the wine retail environment.
If the wine retailer has a good understanding of the types of consumers who frequent the
store (as would be expected in a well run business) and is aware of the appropriate risk
reduction strategies preferred by those consumers, then the retailer can adapt the retail mix
to target those consumers with the most appropriate strategies. This forms the foundation
for a competitive advantage.
37
2.7.1 Retail Factors and Risk Reduction Strategies
There are many variables under the control of a wine retailer that might impact on
the buying behaviour of consumers. Conceptually, these include, but are not
limited to:
• Store ambience and atmosphere, including:
o Visual communications;
o Lighting;
o Colours;
o Music/sounds; and
o Scents/smells.
• Price of the wine on offer;
• Assortment of wine on offer;
• Sales personnel, including:
o Their level of product knowledge;
o Their attitudes to customers; and
o Their ability to build a relationship with the customers
o Their general behaviour
• The store layout;
• Point of sale promotions;
• Other advertising and promotion offers;
• Non-tutored wine tastings;
• Tutored wine tastings;
• Wine club membership;
• Special events (such as tasting theme days, for example, a shiraz tasting day);
• Customer service and after sales service; and
• Complementary goods and services (e.g. glass hire and wine related
paraphernalia).
The research examined the strategies that a wine retailer can adopt in order to
reduce the risk associated with the purchase of a bottle of wine. These strategies
are likely to encompass most of the variables mentioned above. The mix of
strategies will depend on the store positioning and the type of customers who
frequent the store. If consumers perceive less risk associated with the purchase of
a bottle of wine, then they are likely to purchase higher quality wines that attract a
38
higher price (Mitchell & Greatorex, 1989). This is an obvious benefit to the
retailer, who is likely to make a greater profit on the sale of a higher quality bottle
of wine, than the sale of a lesser quality wine with a lower profit margin.
Mitchell & Greatorex (1989) undertook a detailed examination of the risk
reduction strategies employed in buying wine in the UK market. They noted that
the literature had identified four different types of risk and had provided them
with the generic names: functional, social, financial and physical. Mitchell &
Greatorex (1989: 31) state … “The four elements of risk combine in each
purchase decision to dictate the total amount of risk perceived in each purchase”.
They argue that the product (in this case, a bottle of wine) for which the risk
reduction is the most effective will be the product that is finally purchased by the
consumer. Furthermore, Mitchell & Greatorex (1989: 34) state that these risks had
a hierarchy associated with wine buying behaviour:
(i) Functional (taste);
(ii) Social (family and friends);
(iii) Financial (price); and
(iv) Physical (hangover, or reaction to the wine)
Mitchell & Greatorex (1989: 35–36) acknowledged that the generic ways in
which consumers can reduce risk in (most) consumer product buying situations
(Schiffman & Kanuk, 2001) also apply to the product wine. As such they related
these six specifically to ways in which consumers can reduce risk in their wine
purchase decisions. These risk reduction strategies, related to wine purchases,
were restated as:
• Consumers seek information – the more information a consumer has about
the wine, the more predictable the consequences of their purchase.
Consumers seek information from a variety of sources, including opinion
leaders, family and friends, wine writers, TV programs and in the retail
setting, sales people and wine waiters;
• Brand loyalty – consumers avoid risk by remaining loyal to a brand that has
previously met their needs;
• Store image – in the absence of any other information about a wine,
consumers trust the judgement of a reputable store;
39
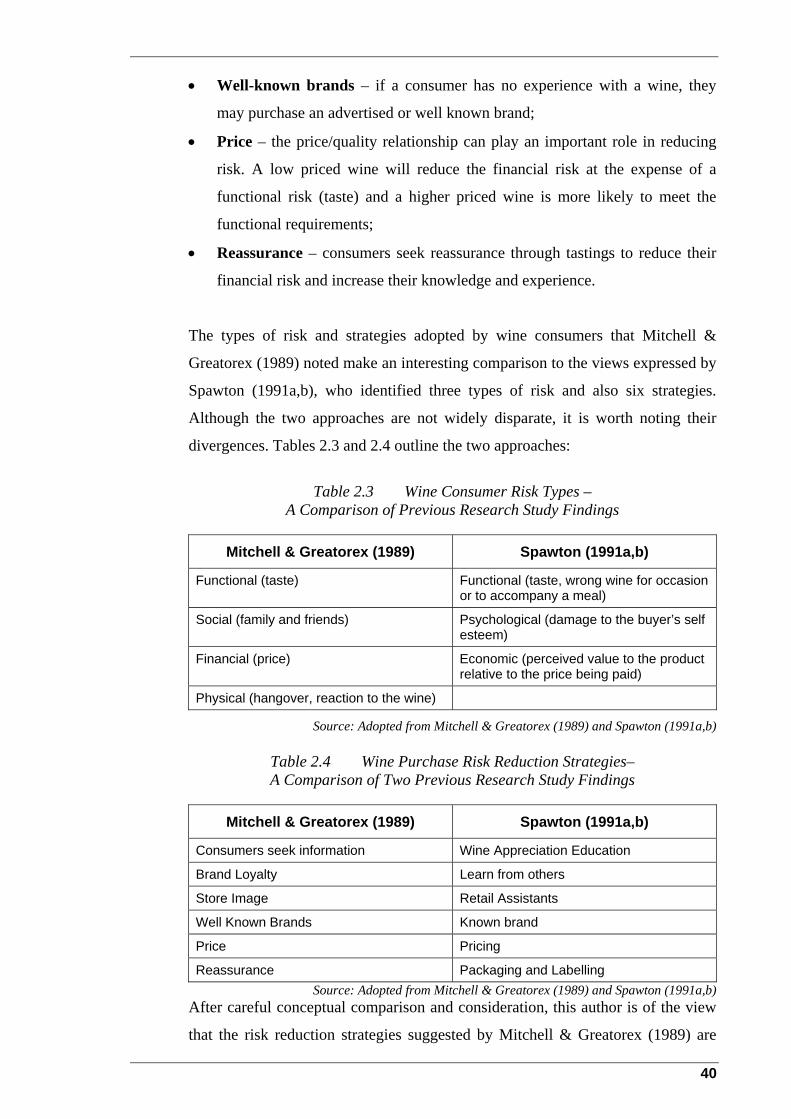
• Well-known brands – if a consumer has no experience with a wine, they
may purchase an advertised or well known brand;
• Price – the price/quality relationship can play an important role in reducing
risk. A low priced wine will reduce the financial risk at the expense of a
functional risk (taste) and a higher priced wine is more likely to meet the
functional requirements;
• Reassurance – consumers seek reassurance through tastings to reduce their
financial risk and increase their knowledge and experience.
The types of risk and strategies adopted by wine consumers that Mitchell &
Greatorex (1989) noted make an interesting comparison to the views expressed by
Spawton (1991a,b), who identified three types of risk and also six strategies.
Although the two approaches are not widely disparate, it is worth noting their
divergences. Tables 2.3 and 2.4 outline the two approaches:
Table 2.3 Wine Consumer Risk Types –
A Comparison of Previous Research Study Findings
Mitchell & Greatorex (1989) Spawton (1991a,b)
Functional (taste) Functional (taste, wrong wine for occasion or to accompany a meal)
Social (family and friends) Psychological (damage to the buyer’s self esteem)
Financial (price) Economic (perceived value to the product relative to the price being paid)
Physical (hangover, reaction to the wine)
Source: Adopted from Mitchell & Greatorex (1989) and Spawton (1991a,b)
Table 2.4 Wine Purchase Risk Reduction Strategies– A Comparison of Two Previous Research Study Findings
Mitchell & Greatorex (1989) Spawton (1991a,b)
Consumers seek information Wine Appreciation Education
Brand Loyalty Learn from others
Store Image Retail Assistants
Well Known Brands Known brand
Price Pricing
Reassurance Packaging and Labelling Source: Adopted from Mitchell & Greatorex (1989) and Spawton (1991a,b)
After careful conceptual comparison and consideration, this author is of the view
that the risk reduction strategies suggested by Mitchell & Greatorex (1989) are
40
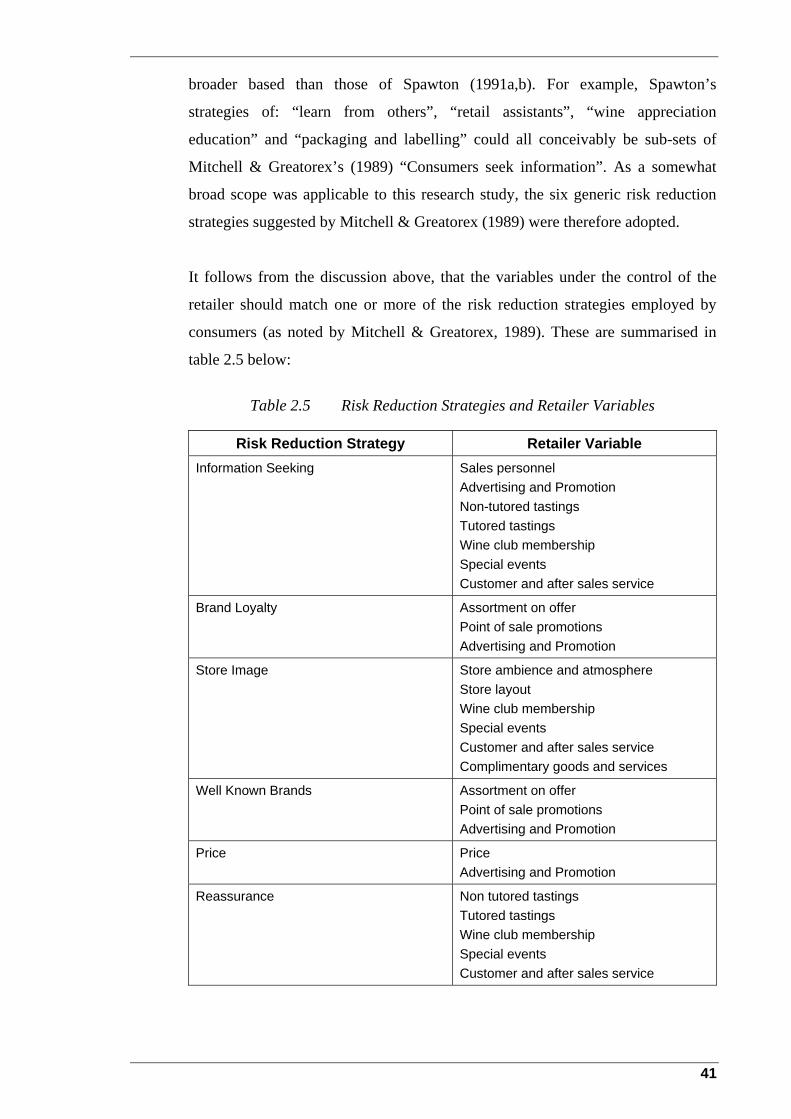
broader based than those of Spawton (1991a,b). For example, Spawton’s
strategies of: “learn from others”, “retail assistants”, “wine appreciation
education” and “packaging and labelling” could all conceivably be sub-sets of
Mitchell & Greatorex’s (1989) “Consumers seek information”. As a somewhat
broad scope was applicable to this research study, the six generic risk reduction
strategies suggested by Mitchell & Greatorex (1989) were therefore adopted.
It follows from the discussion above, that the variables under the control of the
retailer should match one or more of the risk reduction strategies employed by
consumers (as noted by Mitchell & Greatorex, 1989). These are summarised in
table 2.5 below:
Table 2.5 Risk Reduction Strategies and Retailer Variables
Risk Reduction Strategy Retailer Variable Information Seeking Sales personnel
Advertising and Promotion Non-tutored tastings Tutored tastings Wine club membership Special events Customer and after sales service
Brand Loyalty Assortment on offer Point of sale promotions Advertising and Promotion
Store Image Store ambience and atmosphere Store layout Wine club membership Special events Customer and after sales service Complimentary goods and services
Well Known Brands Assortment on offer Point of sale promotions Advertising and Promotion
Price Price Advertising and Promotion
Reassurance Non tutored tastings Tutored tastings Wine club membership Special events Customer and after sales service
41
Mitchell & Greatorex (1989: 38) undertook research to examine these six risk
reduction strategies and concluded that the most important risk reduction strategy
was … “that of seeking information from descriptions, taste codes, wine lists etc.,
and especially more informed sources such as family or friends. The opportunity
to taste was also welcomed”. Mitchell & Greatorex (1989: 35) also mentioned that
“opinion leaders” are a source of information. Shimp & De Lozier (1986, cited in
Edwards and Mort (1991: 9) reinforce this point … “Opinion leaders have the
ability to provide a valuable flow of communication to “opinion followers”,
thereby reducing the perceived risks attached to the adoption of new products or
behaviours”. Therefore, the role of significant other and opinion leaders will be
further explored and elucidated in this study.
Mitchell & Greatorex (1989) explored the various methods employed by
consumers to gather information. Apart from the factors mentioned above, they
felt that the very act of tasting wine should be regarded as information gathering.
That is a factor that is well within the control of the wine retailer. If not
approached from that premise, they felt that wine retailers were “missing” an
opportunity to influence the buying decisions of their customers, as customers
generally undervalued the opinions of sales assistants. They suggested that
retailers should strategically use their sales staff in conjunction with wine tastings,
thereby negating the most important risk (taste) and combining it with the most
important risk reduction strategy, viz. information gathering.
Gluckman (1990) made direct reference to the level of insecurity associated with
purchasing wine and recommended that marketing efforts should be directed at
relieving this insecurity and reinforcing the correctness of the purchase decision.
Although not mentioned by Gluckman per se, the retail assistant is the most
obvious choice to provide this reassurance. In this way, the sales assistant
provides information to the consumer by way of the reassurance and also limits
any possible financial risks attached to the purchase.
Other researchers have explored the role of the sales assistant in the buying
process. Sweeney, Soutar & Johnson (1999) provide a more recent confirmation
of the point raised above. They stated that consumers often hold sales people in
low esteem. However, they felt that with the trend towards a more informed and
42
sophisticated buyer, improved training and the adoption of the marketing concept
by retail, the role of sales people as an information source needed closer
consideration.
Specifically related to wine retailing, Macintosh & Lockshin (1997: 494) found
that consumers who established an interpersonal relationship with sales people
were … “generally more positive about the store and more loyal”. Lockshin &
Kahrimanis (1998: 182) found that the customers’ perception of wine retailers’
staff was a very important attribute when selecting a wine retailer, stating …
“stores that want to differentiate themselves from the competition must focus on
hiring and training their staff to be friendly and knowledgeable”.
Spawton (1991a: 38) felt that many retail outlets in Australia and elsewhere
realised the importance of their retail assistants and … “are reinstating the
personalised, wine knowledgeable retail service as a competitive thrust … ”.
Although the literature revealed that the role of the retail assistant has been
examined in many contexts, none of the literature points to an actual examination
of the role of the retail assistant in reducing risk. Sweeney et al. (1999: 78)
alluded to this issue by raising two pertinent questions … “While seeking the
provision of advice by a salesperson is often regarded as a risk reduction strategy
… does the provision of this information actually reduce risk? Does the manner
by which the staff offer service affect consumer risk perceptions?” Unfortunately,
these questions were rhetorical and only served to illustrate a point. Although not
formally part of any of the sub-problems, the role of the retail assistant was
nevertheless explored in the research study.
To date, the literature reviewed in this section has concentrated on information
seeking, in its various guises, as a risk reduction strategy. It is appropriate to
examine whether any of the other strategies identified above have been the focus
of previous research or comment.
Batt & Dean (2000), in more recent Australian research into the factors
influencing the consumer’s decision to purchase wine from a retail wine store,
referred to the earlier work of both Mitchell & Greatorex (1989) and Spawton
43
(1991a,b). In this context, it could be argued that the factors influencing the
purchase decision are analogous to the risk reduction strategies employed by the
consumer. Batt & Dean (2000) found that prior experience was the most
important variable that influenced a consumer’s decision to purchase wine. This
accords with Mitchell & Greatorex’s (1989) view that wine tasting was part of the
information seeking process. Batt & Dean (2000) also found that price was an
important variable, however, they qualified this by adding that as consumers were
prepared to pay more for their wine, the price became less of a factor in their
decision. This was again consistent with Mitchell & Greatorex’s (1989)
statements, that argued that as consumers became more knowledgeable, their level
of risk reduced and they drank wine of a higher quality.
Apart from prior experience and price, Batt & Dean (2000: 37) also found …
“that a number of both external and in-store variables also influenced the
consumer’s decision to purchase. Prior consumption in restaurants, price
discounts, in-store advice, tastings and advice from friends were perceived to be
important influences”. These findings were also entirely consistent with the earlier
findings of Mitchell & Greatorex (1989).
Hall & Winchester (2000) extended their earlier work (Hall & Winchester, 1999)
where they had offered empirical confirmation of the wine market segments
suggested by McKinna (1986) and Spawton (1991a,b), by exploring the
consumers’ value profiles of each of their identified segments. Whilst this
research provided different insights into the understanding of the wine market,
Hall & Winchester (2000: 71) may have inadvertently touched on the subject of
risk reduction in two of the segments. In describing the “Beverage Wine
Consumer”, they stated … “this segment is solely concerned with being free from
inner conflict … the product attributes most important to this segment were those
relating to improving their confidence with the purchase, including
recommendation of experts, friends and salesperson”. Furthermore, they state …
“we have noted that both of these segments require communication that
emphasises a “safe” purchase decision: safe from the point of view of insecurity
on part of the Beverage Wine Consumer and safe from a point of view that it will
be well enjoyed by friends for the Enjoyment Oriented consumer”.
44

It is also worth commenting further upon the work of Lockshin et al. (1997: 180)
that was previously mentioned in this literature review. Their research examined
three types of involvement as a means of segmenting the market. They have also
touched on an area that is germane to the proposed research. In referring to a wine
retailer, they stated that it would be useful for the retailer to understand the wine
market segments and then tailor their retailing strategies to attract the segment/s
that they desired. Although they are referring to strategies relating to the various
involvement levels of the consumers, the outcome is the same as if the strategies
were aimed at reducing risk. The desired result is to get the customer to spend
more money … “some customers may be more amenable to learning more and
eventually become more brand decision involved. This would likely raise their
consumption and their preferred price level, making them more valuable
customers”.
2.8 Identified Research Literature Knowledge Gap
All of the works referred to previously have touched in one way or another, on one or more
risk reduction strategies, both in their generic form and as a specific part of a wine retail
mix found in-store. Information seeking, in whatever form, appeared to be the most
common strategy employed by all types of consumers. However, apart from Mitchell &
Greatorex (1989), none of the research studies was specifically focussed on risk reduction
strategies, per se. However significantly, the preferred types of risk reduction strategies, be
they information seeking, price, the choice of known brands or any of the other strategies
suggested by Mitchell & Greatorex (1989), as they relate to the wine retail environment,
have not been explored in any systematic manner, segment by segment. This research
study attempts to close this gap as far as possible within its constraints in the current
knowledge base about wine market segments in the South Australian wine market.
2.9 Summary
This literature review has examined the various (“traditional”) methods of segmenting
various types of markets. The pros and cons of these various methods were included in this
examination. A lifestyle-related model of market segmentation was introduced as an
alternative that may overcome some of the criticisms of the traditional methods. A
conceptual risk reduction model for the purchase of wine was furthermore suggested as a
45

basis for the discussion and was eventually used in an inductive-deductive manner in the
execution of the research study (see chapters 3 to 6).
The segmentation of the wine market in general and the Australian wine market, in
particular, was examined in some depth. The various models used and their conclusions
were exposited in tabular format. The most recent model used to segment this market was a
wine-related lifestyle model and this formed the basis for this research study.
An examination of risk reduction strategies used in the context of wine purchases followed.
Although some of the segmentation models were based on risk reduction (e.g. Spawton
1991a,b), the literature review demonstrated that no previous research has concentrated on
the risk reduction strategies preferred by each of the segments identified in the South
Australian wine market. No previous studies have transferred the generic risk reduction
strategies into specific strategies relevant to wine retail. This therefore became the focus
and purpose of this research study.
Having established the fundamental, theoretical, academic and practical bases for the
research study, the following chapters three to five outline the detailed results of the study,
related to each of the identified research sub-problems.
46

Chapter 3 Identifying Lifestyle Based Segments in the South
Australian Wine Market
3.1 Introduction
A major objective of this study was to segment the South Australian wine market using a
wine-related lifestyle method. Although this was not the study’s primary objective, the
market segmentation exercise was the necessary and logical first step as it formed the basis
for all succeeding analyses. This chapter examines the process of identifying the wine-
related lifestyle segments and introduces consumer wine knowledge as a viable
discriminator between market segments.
Therefore, this chapter has two objectives:
• Identify lifestyle based segments; and
• Confirm (or otherwise) the segments identified by Bruwer et al. (2001); and
To meet those objectives, a number of quite specific tasks were completed. In
chronological order, these were:
• Using a series of factor analyses, the appropriate number of factors, or elements that
formed the basis of the succeeding cluster analysis was determined and variables were
allocated to each of those elements.
• Using the identified elements as the basis, a cluster analysis was undertaken.
• The data from the cluster analysis was analysed.
• A meaningful and robust segmentation of the South Australian wine market was
obtained and compared to the results of Bruwer et al. (2001).
One of the research hypotheses was formulated to assist this process. This was:
• Hypothesis 4 – Confirmation of the South Australian wine market wine-related
lifestyle based segmentation structure identified by Bruwer et al. (2001).
Each of the tasks outlined above are covered in the following sections.
47

3.2 Identifying the Elements Constituting the Clusters (Segments)
As mentioned, the work of Bruwer et al. (2001) formed the basis of the identification of
lifestyle-based segments in the South Australian wine market for this study. They
concluded: … “Further research using an improved version of the research instrument …
should now be conducted”. Their study was exploratory in nature and was undertaken
during July and August 2000 in several suburbs of Adelaide, South Australia. Unlike this
study, Bruwer et al. collected their data using face-to-face interviews at the respondent’s
household address.
Bruwer et al. (2001) concluded that there were five identifiable lifestyle based segments in
the Australian domestic wine market. The segments identified were:
• Enjoyment oriented social wine drinkers;
• Fashion/image oriented wine drinkers;
• Ritual oriented conspicuous wine enthusiasts;
• Purposeful inconspicuous premium wine drinkers; and
• Basic wine drinkers
Bruwer et al.’s (2001) survey consisted of fourty four 7-point Likert scale questions that
sought respondent’s Attitudes, Interests and Opinions (AIO) about a range of wine-related
topics. They had divided these questions into the five wine-related lifestyles components
they identified in their research model and each of these components consisted of a number
of elements, totalling 16 in all. These components and elements are listed in the following
table.
Table 3.1 Bruwer et al.’s Wine-related Lifestyle Components and Elements
Component Elements
Quality/Attributes Connoisseur related
Fashion or value related
Reasons for wine consumption Mood enhancing
Enjoyment
Health
Image
48
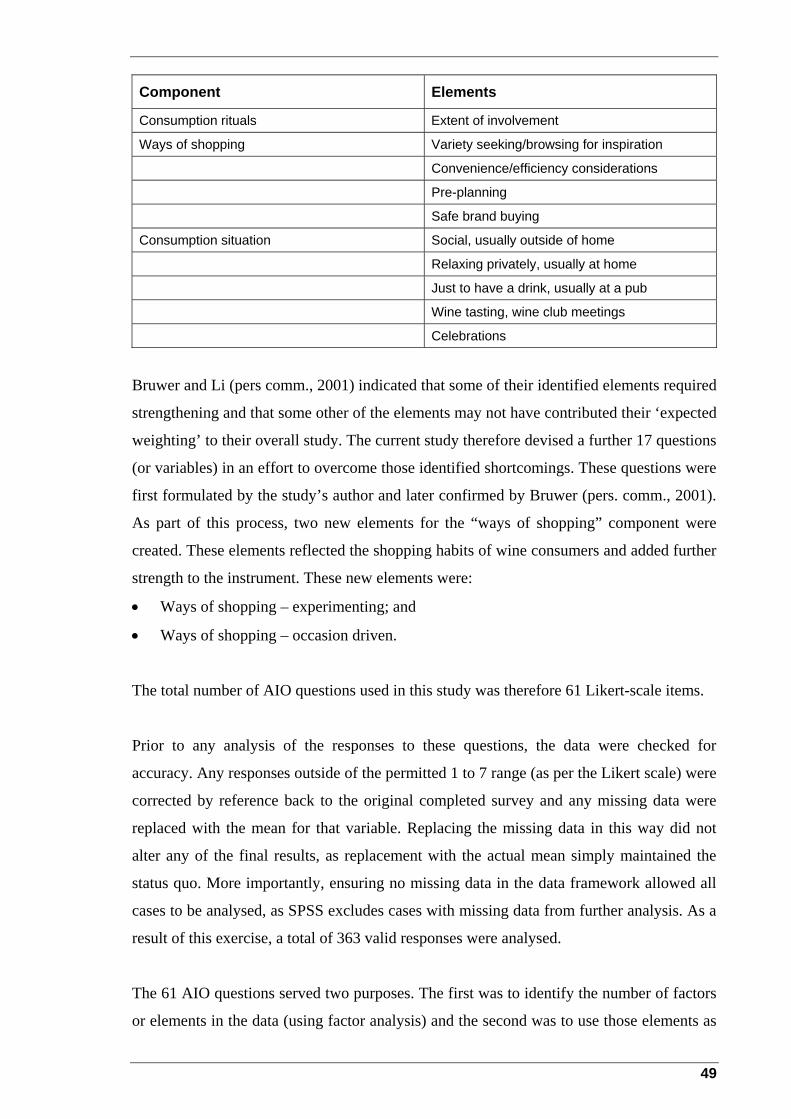
Component Elements
Consumption rituals Extent of involvement
Ways of shopping Variety seeking/browsing for inspiration
Convenience/efficiency considerations
Pre-planning
Safe brand buying
Consumption situation Social, usually outside of home
Relaxing privately, usually at home
Just to have a drink, usually at a pub
Wine tasting, wine club meetings
Celebrations
Bruwer and Li (pers comm., 2001) indicated that some of their identified elements required
strengthening and that some other of the elements may not have contributed their ‘expected
weighting’ to their overall study. The current study therefore devised a further 17 questions
(or variables) in an effort to overcome those identified shortcomings. These questions were
first formulated by the study’s author and later confirmed by Bruwer (pers. comm., 2001).
As part of this process, two new elements for the “ways of shopping” component were
created. These elements reflected the shopping habits of wine consumers and added further
strength to the instrument. These new elements were:
• Ways of shopping – experimenting; and
• Ways of shopping – occasion driven.
The total number of AIO questions used in this study was therefore 61 Likert-scale items.
Prior to any analysis of the responses to these questions, the data were checked for
accuracy. Any responses outside of the permitted 1 to 7 range (as per the Likert scale) were
corrected by reference back to the original completed survey and any missing data were
replaced with the mean for that variable. Replacing the missing data in this way did not
alter any of the final results, as replacement with the actual mean simply maintained the
status quo. More importantly, ensuring no missing data in the data framework allowed all
cases to be analysed, as SPSS excludes cases with missing data from further analysis. As a
result of this exercise, a total of 363 valid responses were analysed.
The 61 AIO questions served two purposes. The first was to identify the number of factors
or elements in the data (using factor analysis) and the second was to use those elements as
49
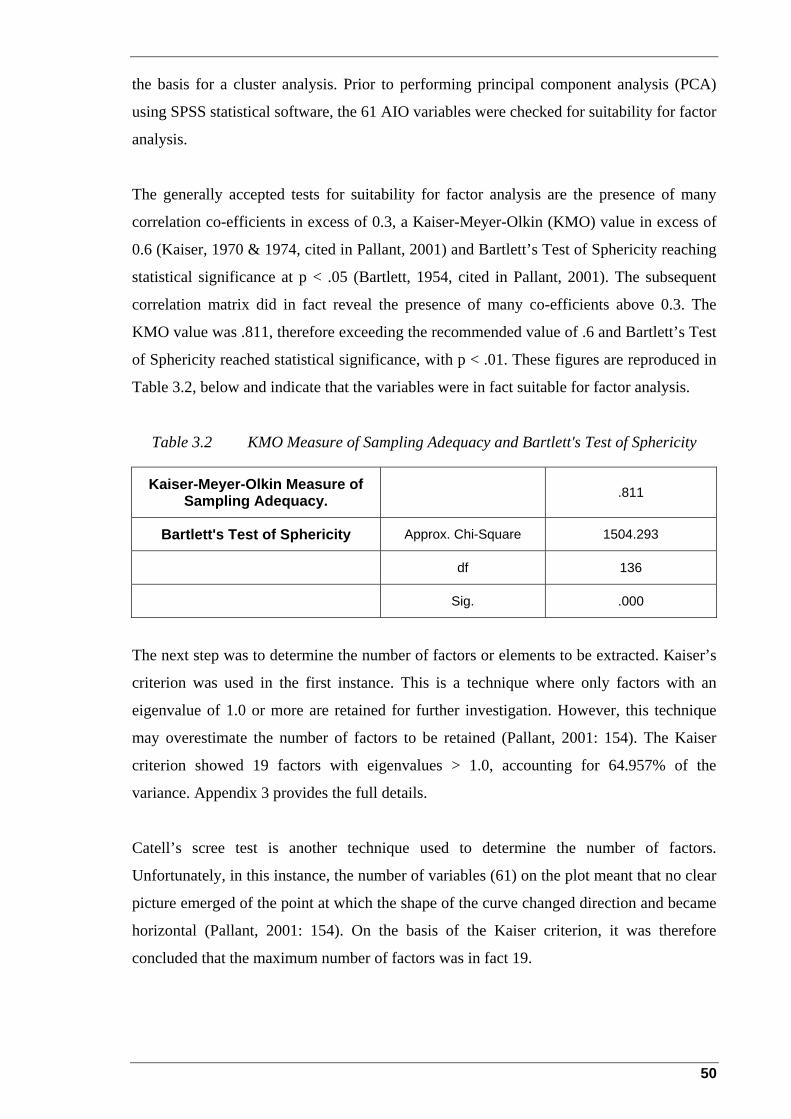
the basis for a cluster analysis. Prior to performing principal component analysis (PCA)
using SPSS statistical software, the 61 AIO variables were checked for suitability for factor
analysis.
The generally accepted tests for suitability for factor analysis are the presence of many
correlation co-efficients in excess of 0.3, a Kaiser-Meyer-Olkin (KMO) value in excess of
0.6 (Kaiser, 1970 & 1974, cited in Pallant, 2001) and Bartlett’s Test of Sphericity reaching
statistical significance at p < .05 (Bartlett, 1954, cited in Pallant, 2001). The subsequent
correlation matrix did in fact reveal the presence of many co-efficients above 0.3. The
KMO value was .811, therefore exceeding the recommended value of .6 and Bartlett’s Test
of Sphericity reached statistical significance, with p < .01. These figures are reproduced in
Table 3.2, below and indicate that the variables were in fact suitable for factor analysis.
Table 3.2 KMO Measure of Sampling Adequacy and Bartlett's Test of Sphericity
Kaiser-Meyer-Olkin Measure of Sampling Adequacy. .811
Bartlett's Test of Sphericity Approx. Chi-Square 1504.293
df 136
Sig. .000
The next step was to determine the number of factors or elements to be extracted. Kaiser’s
criterion was used in the first instance. This is a technique where only factors with an
eigenvalue of 1.0 or more are retained for further investigation. However, this technique
may overestimate the number of factors to be retained (Pallant, 2001: 154). The Kaiser
criterion showed 19 factors with eigenvalues > 1.0, accounting for 64.957% of the
variance. Appendix 3 provides the full details.
Catell’s scree test is another technique used to determine the number of factors.
Unfortunately, in this instance, the number of variables (61) on the plot meant that no clear
picture emerged of the point at which the shape of the curve changed direction and became
horizontal (Pallant, 2001: 154). On the basis of the Kaiser criterion, it was therefore
concluded that the maximum number of factors was in fact 19.
50
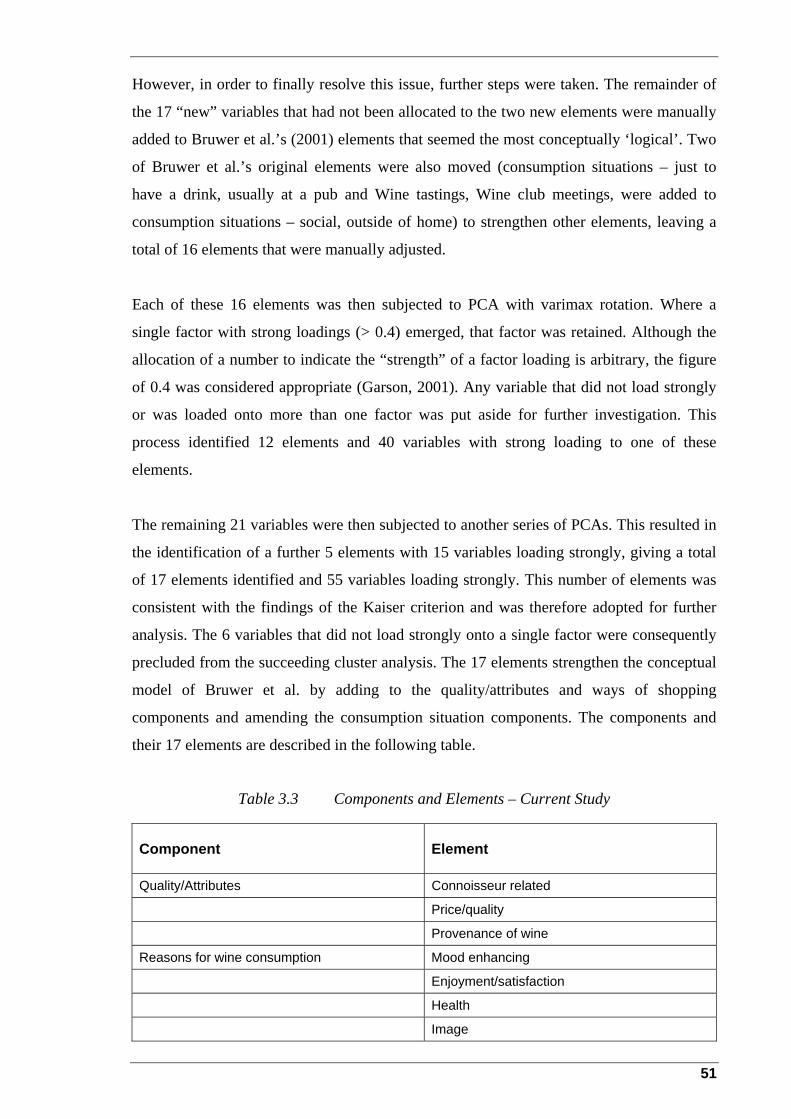
However, in order to finally resolve this issue, further steps were taken. The remainder of
the 17 “new” variables that had not been allocated to the two new elements were manually
added to Bruwer et al.’s (2001) elements that seemed the most conceptually ‘logical’. Two
of Bruwer et al.’s original elements were also moved (consumption situations – just to
have a drink, usually at a pub and Wine tastings, Wine club meetings, were added to
consumption situations – social, outside of home) to strengthen other elements, leaving a
total of 16 elements that were manually adjusted.
Each of these 16 elements was then subjected to PCA with varimax rotation. Where a
single factor with strong loadings (> 0.4) emerged, that factor was retained. Although the
allocation of a number to indicate the “strength” of a factor loading is arbitrary, the figure
of 0.4 was considered appropriate (Garson, 2001). Any variable that did not load strongly
or was loaded onto more than one factor was put aside for further investigation. This
process identified 12 elements and 40 variables with strong loading to one of these
elements.
The remaining 21 variables were then subjected to another series of PCAs. This resulted in
the identification of a further 5 elements with 15 variables loading strongly, giving a total
of 17 elements identified and 55 variables loading strongly. This number of elements was
consistent with the findings of the Kaiser criterion and was therefore adopted for further
analysis. The 6 variables that did not load strongly onto a single factor were consequently
precluded from the succeeding cluster analysis. The 17 elements strengthen the conceptual
model of Bruwer et al. by adding to the quality/attributes and ways of shopping
components and amending the consumption situation components. The components and
their 17 elements are described in the following table.
Table 3.3 Components and Elements – Current Study
Component Element
Quality/Attributes Connoisseur related
Price/quality
Provenance of wine
Reasons for wine consumption Mood enhancing
Enjoyment/satisfaction
Health
Image
51

Component Element
Consumption rituals Extent of involvement (storage and preparation)
Ways of shopping Variety seeking/experimenter
Convenience
Safe brand buying
Information seeking
Occasion driven
Spontaneity
Packaging/labelling
Consumption situation Out of home
In home
3.3 Identifying the Clusters (Segments)
Summated scores for the 17 elements identified in Table 3.3 above became the basis for
the cluster analysis used to determine the clusters or segments. Before the cluster analysis
proceeded, the reliability of the scale represented by the 17 elements was checked. The
resulting Cronbach alpha co-efficient was .6728. This figure was marginally below the
generally accepted figure of 0.70, however, the majority of the scales in use contained less
than ten items, therefore the alpha value was considered satisfactory (Pallant, 2001: 85 and
Li, pers comm., 2001).
Two types of cluster analyses were conducted using SPSS in order to finally identify the
clusters. The first was an exploratory approach using a Hierarchical Cluster analysis
providing a dendogram as its output. An examination of this dendogram indicated that the
solution contained somewhere between 4 and 7 clusters. This result was consistent with the
findings of other researchers of the Australian domestic wine market (for example, Hall &
Winchester 1999, Spawton 1991, Johnson et al., 1991, McKinna 1986 (cited in Hall &
Winchester 1999).
The second approach was the use of a K-Means Cluster Analysis where each of the
potential solutions (that is, 4 to 7 cluster solutions) was used as inputs. The solutions
containing 6 and 7 clusters respectively were rejected on the grounds that each contained
clusters with very few cases and were therefore (logically) an unreasonable representation
of the South Australian wine market. This left the 4 and 5 cluster solutions that were
52
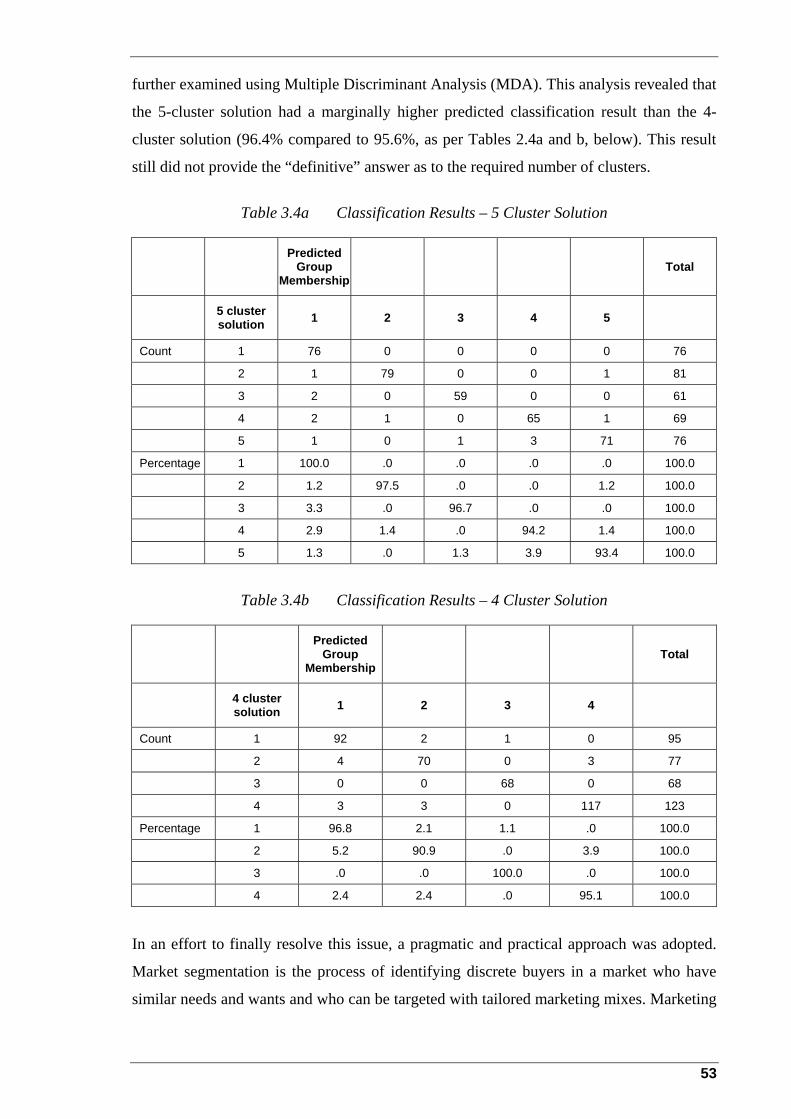
further examined using Multiple Discriminant Analysis (MDA). This analysis revealed that
the 5-cluster solution had a marginally higher predicted classification result than the 4-
cluster solution (96.4% compared to 95.6%, as per Tables 2.4a and b, below). This result
still did not provide the “definitive” answer as to the required number of clusters.
Table 3.4a Classification Results – 5 Cluster Solution
Predicted
Group Membership
Total
5 cluster solution 1 2 3 4 5
Count 1 76 0 0 0 0 76
2 1 79 0 0 1 81
3 2 0 59 0 0 61
4 2 1 0 65 1 69
5 1 0 1 3 71 76
Percentage 1 100.0 .0 .0 .0 .0 100.0
2 1.2 97.5 .0 .0 1.2 100.0
3 3.3 .0 96.7 .0 .0 100.0
4 2.9 1.4 .0 94.2 1.4 100.0
5 1.3 .0 1.3 3.9 93.4 100.0
Table 3.4b Classification Results – 4 Cluster Solution
Predicted
Group Membership
Total
4 cluster solution 1 2 3 4
Count 1 92 2 1 0 95
2 4 70 0 3 77
3 0 0 68 0 68
4 3 3 0 117 123
Percentage 1 96.8 2.1 1.1 .0 100.0
2 5.2 90.9 .0 3.9 100.0
3 .0 .0 100.0 .0 100.0
4 2.4 2.4 .0 95.1 100.0
In an effort to finally resolve this issue, a pragmatic and practical approach was adopted.
Market segmentation is the process of identifying discrete buyers in a market who have
similar needs and wants and who can be targeted with tailored marketing mixes. Marketing
53

texts (for example, Kotler et al. 2001) state that market segments must have the following
characteristics:
• measurability
• accessibility
• substantiality
• actionability
The Australian wine industry consists of about 1318 wineries (as at March 2001) of which
approximately 866 or 65.7% crush less than 100 tonnes per year and can therefore be
considered small or boutique producers (Winetitles, 2001). The majority of these producers
operate in niché markets and require market segments that will sustain super premium and
above prices (Rabobank, 1999). Therefore, for the majority of the industry (by number), a
larger number of segments that meet the characteristics described above are preferable. For
this reason, the five-cluster solution was preferred to the four-cluster solution
This decision meant that the study had identified once again that there are five wine-related
lifestyle segments in the South Australian wine market. The next task was to analyse these
results and identify and derive descriptors for each of the segments.
3.4 Data Interpretation
The final cluster centres of the segments identified above, which became the basis for the
ongoing analysis and interpretation, are outlined in the following table:
Table 3.5 Final Cluster Centres – 5 Cluster Solution
Cluster Element 1 2 3 4 5
consumption situation out of the home
4.90 5.43 4.43 5.64 4.73
consumption situation in home 4.66 5.43 4.31 5.38 4.16
shopping – variety seeking or experimenter
3.54 3.79 3.46 5.24 4.35
shopping – convenience 2.52 2.76 1.87 2.44 1.89
shopping – safe brand buying 2.26 3.35 3.33 1.91 2.73
54
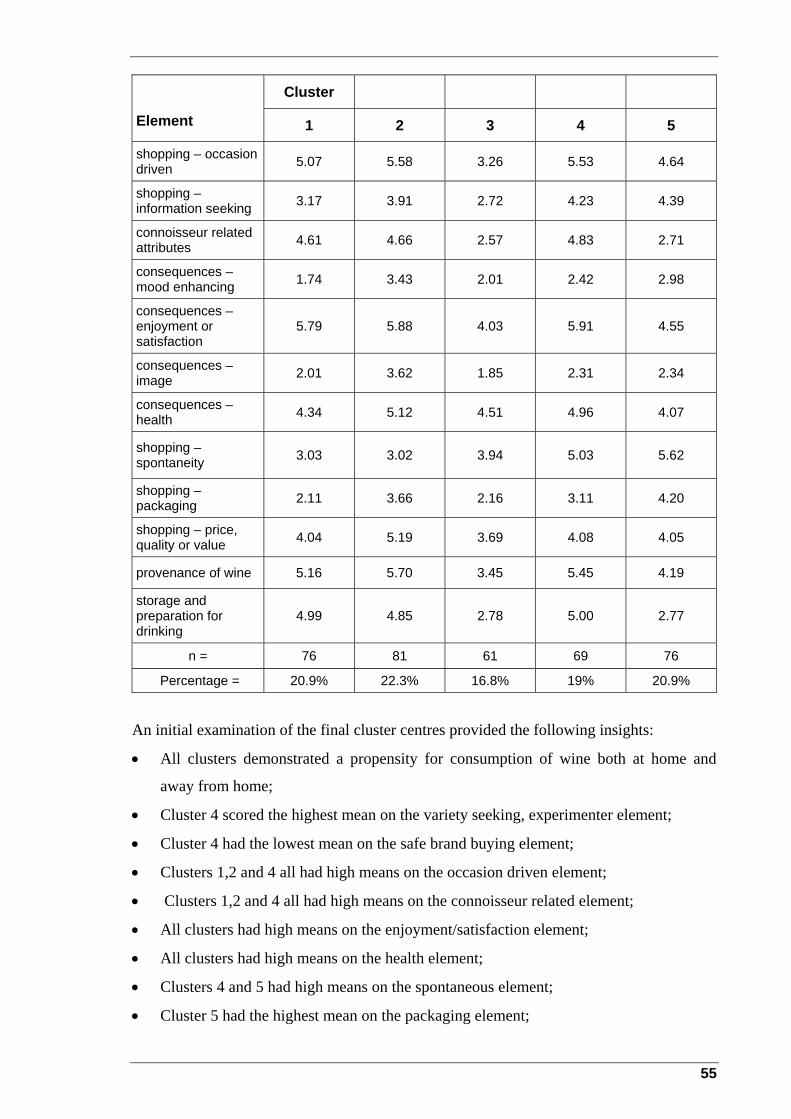
Cluster Element 1 2 3 4 5
shopping – occasion driven 5.07 5.58 3.26 5.53 4.64
shopping – information seeking 3.17 3.91 2.72 4.23 4.39
connoisseur related attributes 4.61 4.66 2.57 4.83 2.71
consequences – mood enhancing 1.74 3.43 2.01 2.42 2.98
consequences – enjoyment or satisfaction
5.79 5.88 4.03 5.91 4.55
consequences – image 2.01 3.62 1.85 2.31 2.34
consequences – health 4.34 5.12 4.51 4.96 4.07
shopping – spontaneity 3.03 3.02 3.94 5.03 5.62
shopping – packaging 2.11 3.66 2.16 3.11 4.20
shopping – price, quality or value 4.04 5.19 3.69 4.08 4.05
provenance of wine 5.16 5.70 3.45 5.45 4.19
storage and preparation for drinking
4.99 4.85 2.78 5.00 2.77
n = 76 81 61 69 76
Percentage = 20.9% 22.3% 16.8% 19% 20.9%
An initial examination of the final cluster centres provided the following insights:
• All clusters demonstrated a propensity for consumption of wine both at home and
away from home;
• Cluster 4 scored the highest mean on the variety seeking, experimenter element;
• Cluster 4 had the lowest mean on the safe brand buying element;
• Clusters 1,2 and 4 all had high means on the occasion driven element;
• Clusters 1,2 and 4 all had high means on the connoisseur related element;
• All clusters had high means on the enjoyment/satisfaction element;
• All clusters had high means on the health element;
• Clusters 4 and 5 had high means on the spontaneous element;
• Cluster 5 had the highest mean on the packaging element;
55

• Cluster 2 had the highest mean on the price/quality element; and
• Clusters 1,2 and 4 had high means on both the provenance and preparation and storage
elements.
This cursory examination revealed that clusters 1, 2 and 4 appeared quite ‘similar’ in
nature and that further analysis was required to differentiate them. However, clusters 3 and
5 were very different from the other three clusters and there were clearly identifiable
differences between those two clusters.
Cluster 3 had the second highest mean on the safe brand-buying element, but did not
display any other high mean scores. The cluster had the lowest mean score on the
connoisseur, price/quality, provenance and image elements. It also scored very low on the
preparation and storage element. This series of mean scores had that cluster tentatively
identified as the “basic wine drinker” segment.
Cluster 5 had relatively high mean scores on the spontaneous, information seeking and
enjoyment elements. It also had the highest mean on the packaging element. It had
comparatively low means scores on the provenance and storage and preparation elements
and the second lowest score on the connoisseur element. This cluster was tentatively
identified as the “enjoyment oriented wine drinker”.
The first step taken to differentiate between clusters 1, 2 and 4 was a study of their
respective mean scores against the ten wine knowledge multiple-choice questions (the
discussion under hypotheses 2 and 3 later in this chapter provide a detailed examination of
the role of knowledge in this research). The results for each of the clusters are displayed in
the following table:
Table 3.6 Mean Knowledge Score by Cluster
Cluster Mean Knowledge Score
1 69.3%
2 64.0%
4 77.1%
3 51.2%
5 49.5%
56

Clusters 3 and 5 are displayed for comparative purposes.
This table clearly indicates that cluster 4 has the most wine knowledge followed by cluster
1 and then 2. These knowledge means were then subjected to a series of independent
sample t–tests to check for significance between the clusters. These tests revealed that
there were no significant differences between cluster 1 (M = 6.9342, SD = 1.9619) and
cluster 2 (M = 6.3951, SD = 2.0657, t(155) = 1.675 and p = .096). However, cluster 4 (M =
7.7101, SD = 1.4461) was significantly larger than both clusters 1 and 2 (t(137.367) = -
2.727; p = .007 and t(142.889) = -4.565; p = .000) respectively. This indicated that cluster
4 was the most wine knowledgeable segment and that the knowledge was an appropriate
discriminator between cluster 4 and the others.
To further differentiate between clusters 1, 2 and 4, their mean scores on a number of
individual variables and selected elements were compared using independent sample t-
tests. The variables and elements that showed statistical significance between the three
clusters are exhibited in Table 3.7.
Table 3.7 Clusters 1, 2 and 4 – Statistical Significance on Selected Variables and Elements
Variables/ elements
5 cluster solution N Mean Std.
DeviationP (cluster
2 cf cluster 1)
P (cluster 2 cf
cluster 4)
P (cluster 4 cf
cluster 1)
It is risky to buy lesser-known wine brands.
2 81 3.7778 1.7321 **
1 76 2.7105 1.6233 -
4 69 2.5520 1.6141 **
I take more notice of wine-related articles in the press and TV than I did two years ago.
2 81 5.1728 1.4815 *
1 76 3.8339 2.1696 **
4 69 4.9275 2.1984 -
I would like to learn more about wine styles and their countries of origin.
2 81 5.5556 1.5248 **
1 76 4.8553 2.0245 **
4 69 6.0290 1.1372 **
57
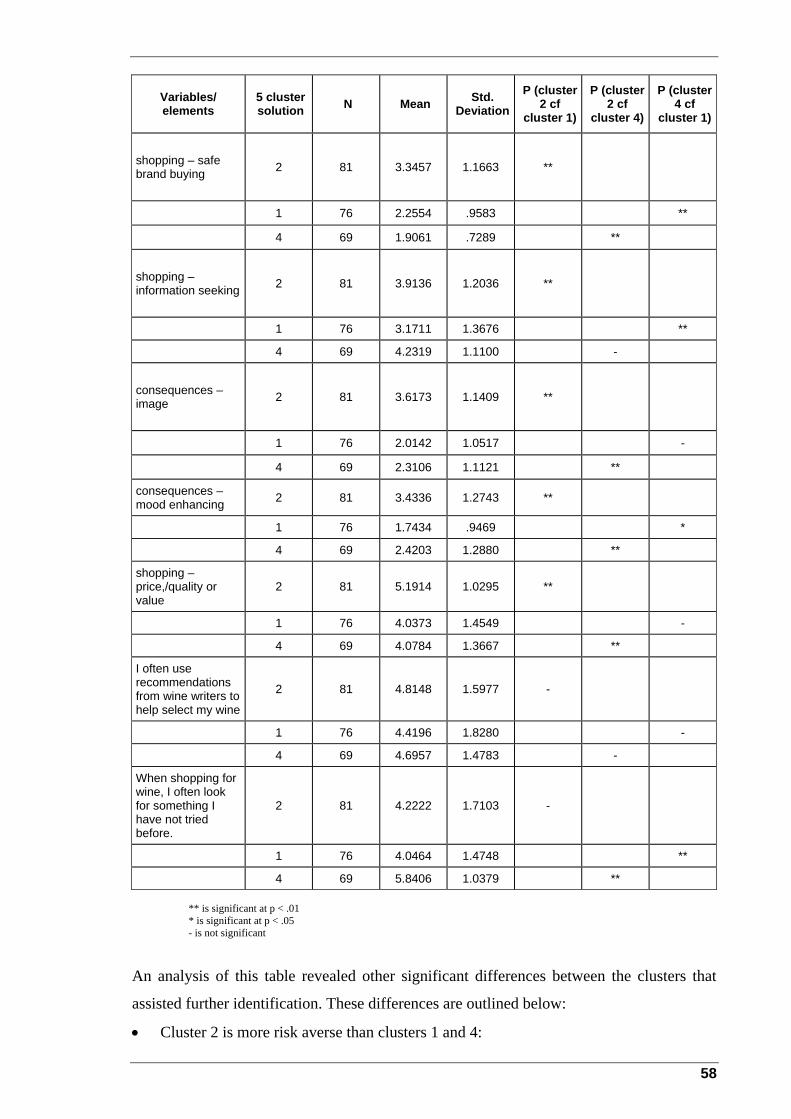
Variables/ elements
5 cluster solution N Mean Std.
DeviationP (cluster
2 cf P (cluster
2 cf P (cluster
4 cf cluster 1) cluster 4) cluster 1)
shopping – safe brand buying 2 81 3.3457 1.1663 **
1 76 2.2554 .9583 **
4 69 1.9061 .7289 **
shopping – information seeking 2 81 3.9136 1.2036 **
1 76 3.1711 1.3676 **
4 69 4.2319 1.1100 -
consequences – image 2 81 3.6173 1.1409 **
1 76 2.0142 1.0517 -
4 69 2.3106 1.1121 **
consequences – mood enhancing 2 81 3.4336 1.2743 **
1 76 1.7434 .9469 *
4 69 2.4203 1.2880 **
shopping – price,/quality or value
2 81 5.1914 1.0295 **
1 76 4.0373 1.4549 -
4 69 4.0784 1.3667 **
I often use recommendations from wine writers to help select my wine
2 81 4.8148 1.5977 -
1 76 4.4196 1.8280 -
4 69 4.6957 1.4783 -
When shopping for wine, I often look for something I have not tried before.
2 81 4.2222 1.7103 -
1 76 4.0464 1.4748 **
4 69 5.8406 1.0379 ** ** is significant at p < .01 * is significant at p < .05 - is not significant
An analysis of this table revealed other significant differences between the clusters that
assisted further identification. These differences are outlined below:
• Cluster 2 is more risk averse than clusters 1 and 4:
58
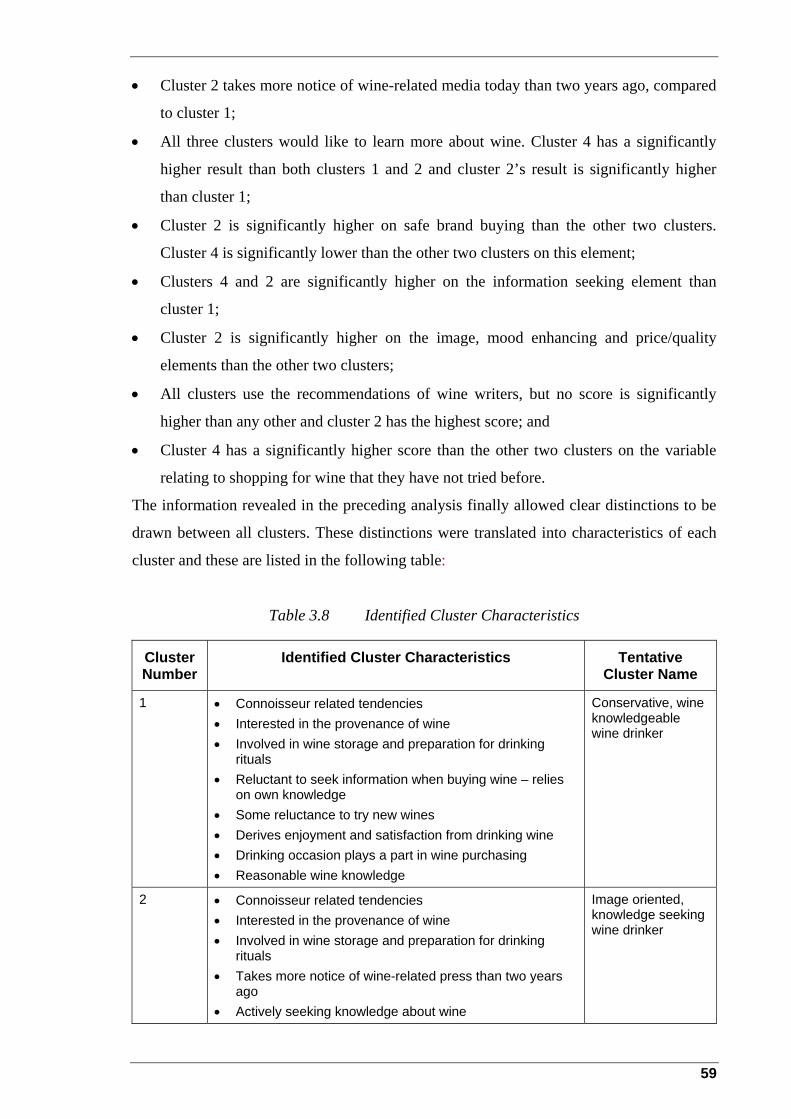
• Cluster 2 takes more notice of wine-related media today than two years ago, compared
to cluster 1;
• All three clusters would like to learn more about wine. Cluster 4 has a significantly
higher result than both clusters 1 and 2 and cluster 2’s result is significantly higher
than cluster 1;
• Cluster 2 is significantly higher on safe brand buying than the other two clusters.
Cluster 4 is significantly lower than the other two clusters on this element;
• Clusters 4 and 2 are significantly higher on the information seeking element than
cluster 1;
• Cluster 2 is significantly higher on the image, mood enhancing and price/quality
elements than the other two clusters;
• All clusters use the recommendations of wine writers, but no score is significantly
higher than any other and cluster 2 has the highest score; and
• Cluster 4 has a significantly higher score than the other two clusters on the variable
relating to shopping for wine that they have not tried before.
The information revealed in the preceding analysis finally allowed clear distinctions to be
drawn between all clusters. These distinctions were translated into characteristics of each
cluster and these are listed in the following table:
Table 3.8 Identified Cluster Characteristics
Cluster Number
Identified Cluster Characteristics Tentative Cluster Name
1 • Connoisseur related tendencies • Interested in the provenance of wine • Involved in wine storage and preparation for drinking
rituals • Reluctant to seek information when buying wine – relies
on own knowledge • Some reluctance to try new wines • Derives enjoyment and satisfaction from drinking wine • Drinking occasion plays a part in wine purchasing • Reasonable wine knowledge
Conservative, wine knowledgeable wine drinker
2 • Connoisseur related tendencies • Interested in the provenance of wine • Involved in wine storage and preparation for drinking
rituals • Takes more notice of wine-related press than two years
ago • Actively seeking knowledge about wine
Image oriented, knowledge seeking wine drinker
59
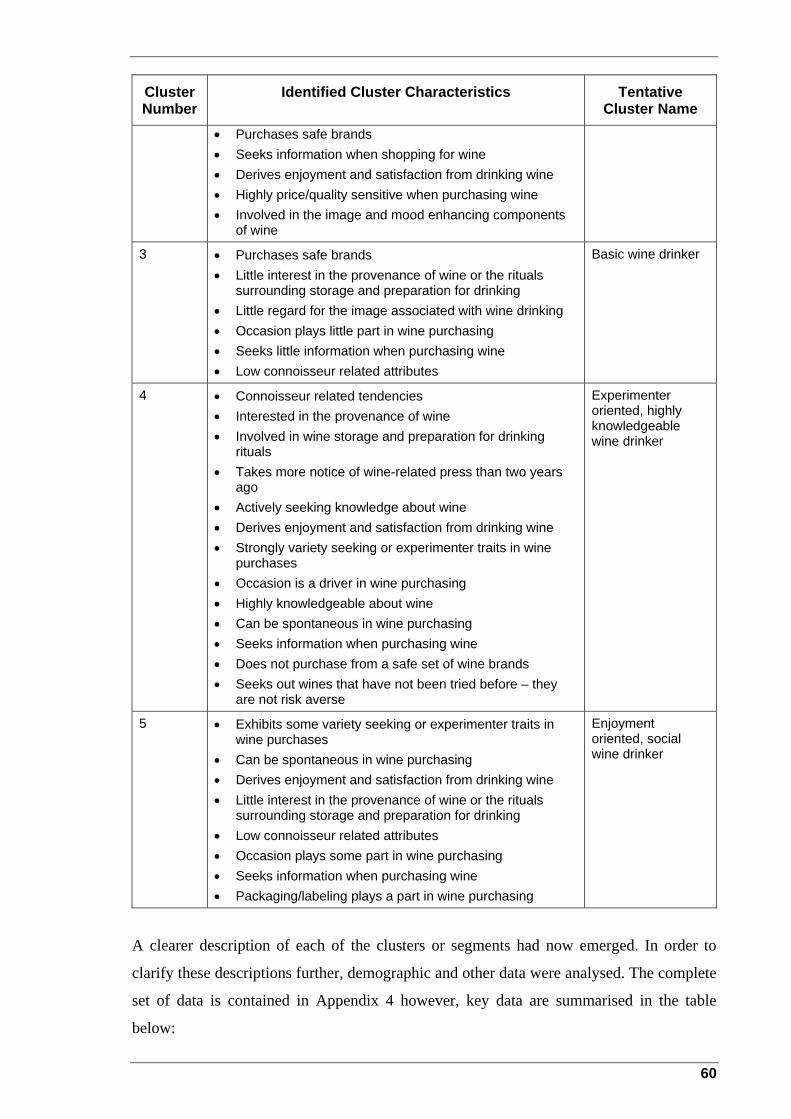
Cluster Number
Identified Cluster Characteristics Tentative Cluster Name
• Purchases safe brands • Seeks information when shopping for wine • Derives enjoyment and satisfaction from drinking wine • Highly price/quality sensitive when purchasing wine • Involved in the image and mood enhancing components
of wine
3 • Purchases safe brands • Little interest in the provenance of wine or the rituals
surrounding storage and preparation for drinking • Little regard for the image associated with wine drinking • Occasion plays little part in wine purchasing • Seeks little information when purchasing wine • Low connoisseur related attributes
Basic wine drinker
4 • Connoisseur related tendencies • Interested in the provenance of wine • Involved in wine storage and preparation for drinking
rituals • Takes more notice of wine-related press than two years
ago • Actively seeking knowledge about wine • Derives enjoyment and satisfaction from drinking wine • Strongly variety seeking or experimenter traits in wine
purchases • Occasion is a driver in wine purchasing • Highly knowledgeable about wine • Can be spontaneous in wine purchasing • Seeks information when purchasing wine • Does not purchase from a safe set of wine brands • Seeks out wines that have not been tried before – they
are not risk averse
Experimenter oriented, highly knowledgeable wine drinker
5 • Exhibits some variety seeking or experimenter traits in wine purchases
• Can be spontaneous in wine purchasing • Derives enjoyment and satisfaction from drinking wine • Little interest in the provenance of wine or the rituals
surrounding storage and preparation for drinking • Low connoisseur related attributes • Occasion plays some part in wine purchasing • Seeks information when purchasing wine • Packaging/labeling plays a part in wine purchasing
Enjoyment oriented, social wine drinker
A clearer description of each of the clusters or segments had now emerged. In order to
clarify these descriptions further, demographic and other data were analysed. The complete
set of data is contained in Appendix 4 however, key data are summarised in the table
below:
60
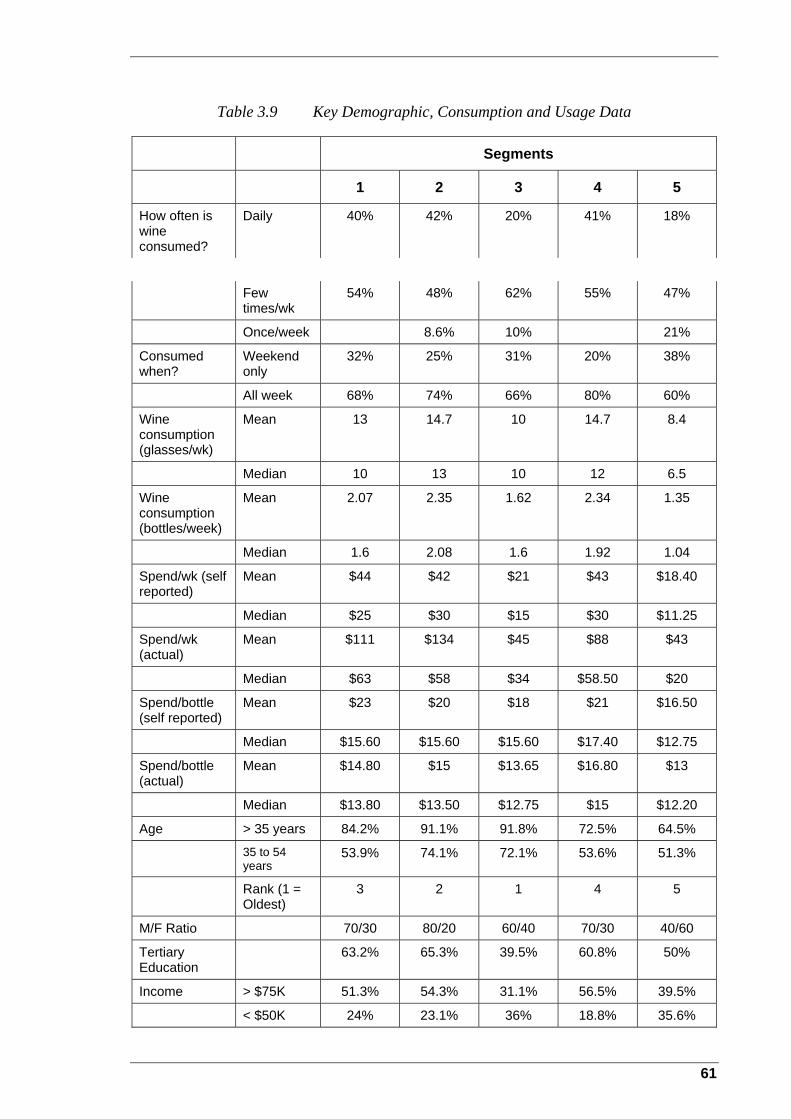
Table 3.9 Key Demographic, Consumption and Usage Data
Segments
1 2 3 4 5
How often is wine consumed?
Daily 40% 42% 20% 41% 18%
Few times/wk
54% 48% 62% 55% 47%
Once/week 8.6% 10% 21%
Consumed when?
Weekend only
32% 25% 31% 20% 38%
All week 68% 74% 66% 80% 60%
Wine consumption (glasses/wk)
Mean 13 14.7 10 14.7 8.4
Median 10 13 10 12 6.5
Wine consumption (bottles/week)
Mean 2.07 2.35 1.62 2.34 1.35
Median 1.6 2.08 1.6 1.92 1.04
Spend/wk (self reported)
Mean $44 $42 $21 $43 $18.40
Median $25 $30 $15 $30 $11.25
Spend/wk (actual)
Mean $111 $134 $45 $88 $43
Median $63 $58 $34 $58.50 $20
Spend/bottle (self reported)
Mean $23 $20 $18 $21 $16.50
Median $15.60 $15.60 $15.60 $17.40 $12.75
Spend/bottle (actual)
Mean $14.80 $15 $13.65 $16.80 $13
Median $13.80 $13.50 $12.75 $15 $12.20
Age > 35 years 84.2% 91.1% 91.8% 72.5% 64.5%
35 to 54 years
53.9% 74.1% 72.1% 53.6% 51.3%
Rank (1 = Oldest)
3 2 1 4 5
M/F Ratio 70/30 80/20 60/40 70/30 40/60
Tertiary Education
63.2% 65.3% 39.5% 60.8% 50%
Income > $75K 51.3% 54.3% 31.1% 56.5% 39.5%
< $50K 24% 23.1% 36% 18.8% 35.6%
61
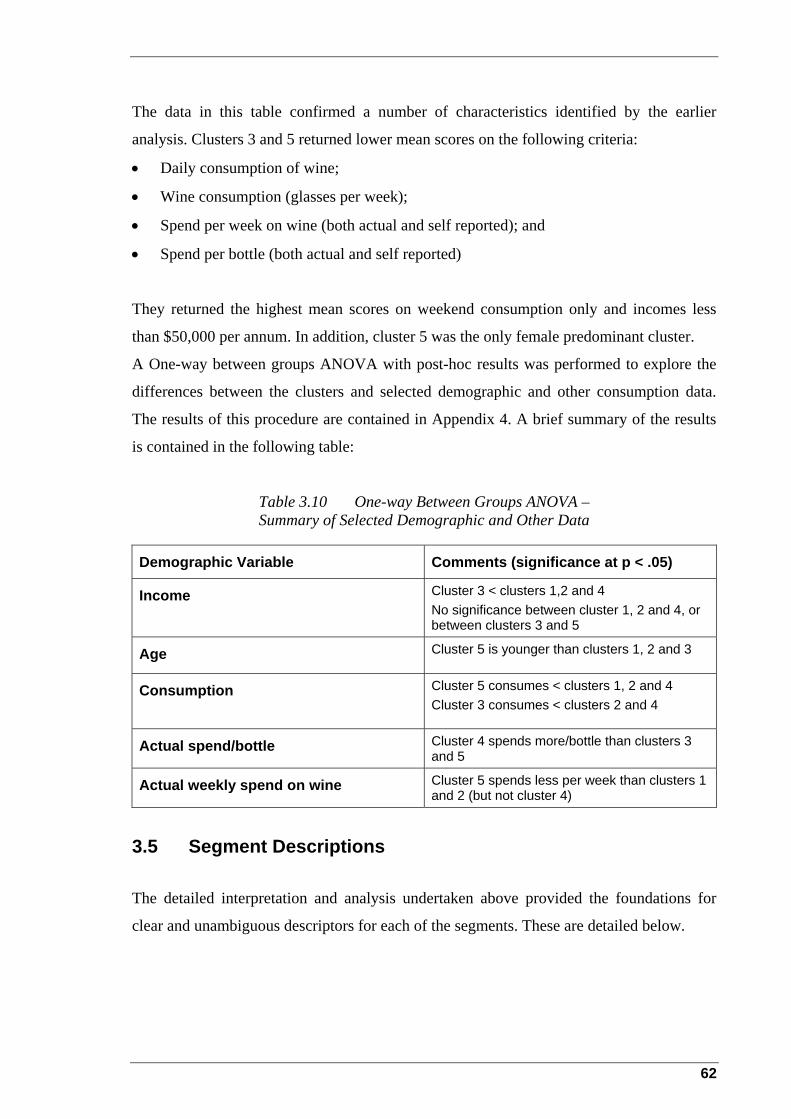
The data in this table confirmed a number of characteristics identified by the earlier
analysis. Clusters 3 and 5 returned lower mean scores on the following criteria:
• Daily consumption of wine;
• Wine consumption (glasses per week);
• Spend per week on wine (both actual and self reported); and
They returned the highest mean scores on weekend consumption only and incomes less
than $50,000 per annum. In addition, cluster 5 was the only female predominant cluster.
A One-way between groups ANOVA with post-hoc results was performed to explore the
differences between the clusters and selected demographic and other consumption data.
The results of this procedure are contained in Appendix 4. A brief summary of the results
is contained in the following table:
Table 3.10 One-way Between Groups ANOVA – Summary of Selected Demographic and Other Data
Demographic Variable Comments (significance at p < .05)
• Spend per bottle (both actual and self reported)
Income Cluster 3 < clusters 1,2 and 4
Age Cluster 5 is younger than clusters 1, 2 and 3
Consumption Cluster 5 consumes < clusters 1, 2 and 4 Cluster 3 consumes < clusters 2 and 4
Actual spend/bottle Cluster 4 spends more/bottle than clusters 3 and 5
Actual weekly spend on wine Cluster 5 spends less per week than clusters 1 and 2 (but not cluster 4)
No significance between cluster 1, 2 and 4, or between clusters 3 and 5
3.5 Segment Descriptions
The detailed interpretation and analysis undertaken above provided the foundations for
clear and unambiguous descriptors for each of the segments. These are detailed below.
62

3.5.1 Segment 1 – Conservative, Wine Knowledgeable Wine Drinkers (20.9%)
The drinkers in this segment of the South Australian wine market are likely to be
tertiary educated males (63.2% tertiary educated; male/female ratio = 70/30),
working in a professional capacity with over half having a household income in
excess of $75,000 per year. These drinkers demonstrate connoisseur related
tendencies, are interested in the provenance of the wine they drink and are
involved in wine storage and preparation for drinking rituals – they are likely to
have a cellar at home or some other space used solely for the storage of wine and
they use the correct glassware, decant their wine and check it for spoilage prior to
consuming the wine. They derive enjoyment and satisfaction from drinking wine
and approximately 40% of them drink wine every day. These consumers display a
good knowledge of wine and wine-related matters.
When purchasing wine, the occasion during which the wine will be consumed
plays a role in the purchase decision. They are somewhat reluctant to purchase
wines that they have not tried before and they do not seek information or advice
when purchasing wine. Rather, they tend to rely on their own knowledge and
beliefs and hence their purchases could become “stereotyped” – they are likely to
purchase similar styles of wines over the years and do not exhibit variety seeking
or experimenter behaviour. Their purchases are rarely spontaneous, although they
have a wide selection of brands from which to choose. Their preferred retailers are
fine wine specialist stores.
3.5.2 Segment 2 – Image Oriented, Knowledge Seeking, Wine Drinker (22.3%)
The drinkers in this segment share many of the characteristics of the previous
segment. They are likely to be tertiary educated males (65.3% tertiary educated;
male/female ratio = 80/20), with over half having a household income in excess of
$75,000 per year. They also display connoisseur tendencies and are interested in
the provenance of the wine they drink and they have a dedicated cellar (or space)
for storing wine. They indulge in pre-drinking rituals and about 40% drink wine
every day.
63
These consumers have some knowledge about wine and they are actively seeking
to further their existing knowledge. One way in which this is manifested is that
they take more notice of wine-related media today than they did two years ago, a
reflection of their growing interest in wine.
When purchasing wine, they seek information about their prospective purchases
and they are guided by the views of wine writers and other opinion leaders. They
are risk averse, as they tend to purchase the recommendations of others. They are
particularly mindful of the price of the wines they buy, but this does not mean that
they buy cheap wines. Rather, they tend to have the view that the more expensive
the wine, the better it is. They have been drinking wine for some time, probably
since their University days, but they now have the income to buy the wines
recommended by others. Their preferred retailers are fine wine stores.
They derive a lot of enjoyment and satisfaction from drinking wine and they like
the image that drinking wine portrays.
3.5.3 Segment 3 – Basic Wine Drinker (16.8%)
These wine consumers have little time for the rituals and image that surround the
drinking of wine. They drink wine because they enjoy it. These wine drinkers are
comparatively well educated compared to the general population, with 39.5%
having a tertiary education, however, their average household income is lower
than all but one other segment, with 36% earning less than $50,000 per year. The
male/female ratio is 60/40, so the male dominance seen in the previous two
segments is diminishing.
When purchasing their wine, this segment does not take into account the occasion
at which the wine will be drunk and they seek little information about their
purchases. They have a number of safe brands from which they choose their wine
– these brands have served their purpose in the past and will do so in the future.
Their self-reported weekly spend on wine is $21 and their average spend on a
bottle of wine is $18. They are less frequent drinkers of wine than some other
segments. Their preferred retailers are national wine chains.
64

3.5.4 Segment 4 – Experimenter, Highly Knowledgeable Wine Drinkers (19%)
The consumers in this segment share the same connoisseur tendencies and the
interest in the provenance of the wine and the associated rituals as segments 1 and
2. What separates them (in part) from those other two segments is their very
detailed knowledge of wine and wine-related subjects. This segment had a
significantly higher mean knowledge score than the next highest scoring segment.
Although they have this detailed knowledge, they want to learn more and are
therefore updating their knowledge on a regular basis. They are also likely to be
well-educated males (60.8% tertiary educated; male/female ratio = 70/30), with
household earnings in excess of $75,000 per year (56.5% earn in excess of this
amount).
The other distinguishing factor is their approach to buying wine. They like to take
a chance when buying wine and they are keen to drink wine that they have not
tried before. They are experimenters in their wine buying. They are also keen to
ask for advice and seek information about the wines they are considering. This is
consistent with their quest for knowledge and their interest in the provenance of
the wine. This can also lead to spontaneous buying of wine – perhaps a sales
person has recommended a wine and provided information about that wine and
the consumer is happy to buy something different based on that recommendation.
As a result of this experimenter approach, they do not have a safe set of brands
from which they purchase, although it is likely that they become brand loyal to
those wines that meet their “experimenter” needs and wants. Their preferred
retailers are fine wine stores.
3.5.5 Segment 5 – Enjoyment Oriented, Social Wine Drinkers (20.9%)
This segment has a predominance of female consumers, with the male/female
ratio 40/60. Half of the drinkers in this segment have tertiary qualifications, but
their average household income is lower, with 35.6% earning less than $50,000
per year. The average age of this segment is lower than segments 1, 2 and 3.
This segment has little time for the rituals and image that surround the drinking of
wine, but they do derive enjoyment and satisfaction from drinking wine. Almost
65

40% of these consumers only drink wine at the weekend, which is consistent with
socialising and enjoying a glass of wine. They are less likely to drink wine on a
daily basis than all other consumers and they have the highest rate of once a week
consumers, therefore, they could be classed as more occasional drinkers. Their
average weekly consumption is correspondingly the lowest of all segments at 8.4
glasses.
In their purchasing behaviour, the occasion during which the wine will be
consumed plays some part. They seek some information before purchasing wine
and they exhibit some variety seeking or experimenter traits, perhaps because of
the information they receive. These consumers also exhibit quite strong
spontaneous buying behaviour and the packaging and labelling of a bottle is an
influence in their purchases. This may indicate that this segment is attracted to
“concept” brands. Their preferred retailers are national wine chains.
3.6 Lifestyle Based Wine Market Segments – Discussion
The preceding sections outlined the processes that identified, labelled and characterised
each of the five wine-related lifestyle segments of the South Australian wine market. The
discussion that follows specifically examines the hypothesis that was formulated in relation
to this chapter.
3.6.1 Hypothesis 4 – Confirmation of the South Australian Wine Market Wine-related Lifestyle Based Segmentation Structure Identified by Bruwer et al. (2001).
Bruwer et al. (2001) identified five lifestyle based market segments and this result
has been replicated by this study. This discussion is concerned with comparing the
two sets of identified segments and arriving at a conclusion about their similarities
and differences, so that the hypothesis may be confirmed (or otherwise). The
following table is a convenient method of setting out the descriptions of Bruwer et
al.’s (2001) segments and those identified in this study.
66

Table 3.15 Market Segment Comparison
Bruwer et al. (2001) segments
Current study’s segments
Comments
Enjoyment Oriented Social Wine Drinkers (14%) • 25 – 54 years old • female majority • higher education status
= “average” • 50% earn < $40K pa • weekend drinkers, but
regular
• red wine mainly
• 1.6 bottles per week average consumption
• $11.07 average spend per bottle
Enjoyment Oriented, Social Wine Drinkers (20.9%) • youngest in study • female majority • 50% have tertiary
education • 35.6% < $50K pa • weekend, regular
drinkers
• red and white wine preferred
• 1.4/ 1 bottle per week* (mean/median)
• $13/$16.50 spend** (actual/self reported)
• compatible • compatible • compatible
• reasonable fit • compatible
• reasonable fit
• reasonable fit
• reasonable fit
Fashion/Image Oriented Wine Drinkers (19%) • 18 – 44 years old • Female/male = 50/50 • Higher education status
= very high • Income +, - $50K pa • Regular drinkers
anytime • Highest on sparkling,
but mainly red wine • 0.9 bottles per week
consumption • $13.50 average spend
per bottle
Ritual Oriented Conspicuous Wine Enthusiasts (18%) • under 34 years old • higher education status
= high • income > $75K pa • drink almost everyday • red wine mainly • 1.8 bottles per week
average • $18.29 average spend
per bottle
Image Oriented, Knowledge Seeking Wine Drinkers (22.3%) • 2nd oldest in this study • 65.3% tertiary educated
• 54.3% > $75K • 42% drink wine daily • red wine preference • 2.4/2 bottles per week
• $15/$20 average spend
per bottle
• not compatible • compatible
• compatible • compatible • compatible • reasonable fit
• reasonable fit
Purposeful Inconspicuous Premium Wine Drinkers (25%) • 35 – 54 years old
Conservative, Knowledgeable Wine Drinkers (20.9%) • 54% 35 – 54 years old
• compatible
67

Bruwer et al. (2001) segments
Current study’s segments
Comments
• male majority • higher education status
= high • income (highest) >
$100K pa • regular wine drinkers • red wine mainly • 1.4 bottles per week
average consumption • $17.11 average spend
per bottle
• male majority • 63.2% tertiary educated
• 32.9% > $100K pa (2nd
highest) • 40% drink wine daily • red wine preferred • 2.1/1.6 bottles per week
• $14.80/$23 average
spend per bottle
• compatible • compatible
• reasonable fit
• compatible • compatible • reasonable (on mean)
• reasonable fit
Basic Wine Drinkers (24%) • 45+ years old • female mainly • higher education status
= “average” • income (lowest) <$40K
pa (42%) • weekend wine drinkers • red and white wine
drinkers • 0.6 bottles per week
average consumption • $10.67 average spend
per bottle
Basic Wine Drinkers (16.8%) • oldest • male/female = 60/40 • 39.5% tertiary educated
• 36.1% < $50K pa
• weekend wine drinkers • red and white wine
drinkers • 1.6/1.6 bottles per week
• $13.65/$18 per bottle
• compatible • reasonable fit • compatible
• compatible
• compatible • compatible
• this study is higher
• this study is higher
Experimenter, Highly Knowledgeable Wine Drinkers (19%) • 53.6% 35 – 54 years
old (2nd youngest) • male majority • 60.8% tertiary educated • 56.5% > $75K pa • 41% drink wine daily • red wine preferred • 2.3/1.9 bottles per week • $16.80/$21 average
spend per bottle
Where: * the first figure presented is the mean consumption figure and the second is the median consumption figure. ** the first figure is the actual average spend per week on wine and the second figure is the self reported figure.
The information in this table illustrated compatibility or reasonable fit for much of
the demographic data. The obvious discrepancy was the lack of fit for the Bruwer
et al. (2001) segment identified as Image/Fashion oriented wine drinkers. The data
68

indicated that the other four segments identified by Bruwer et al. (2001) were
replicated in this study. These four segments are now discussed individually.
The “enjoyment oriented, social wine drinkers” identified by Bruwer et al. (2001)
closely resembled the “enjoyment oriented, social wine drinkers” of this study.
There were compatible fits in age, sex, frequency and timing of drinking wine and
education status. Reasonable fits against income, wine preference, consumption
and spending habits were experienced. The increase in spend per bottle identified
in the current study may, in part, be accounted by natural price rises that occurred
in the twelve month gap between the two studies. Unfortunately, Bruwer et al. did
not provide detailed descriptors of their identified segments, so a comparison
between the characteristics of the two segments was not possible. However, the
characteristics of the segment identified in this study were consistent with the
intent identified by Bruwer et al. (2001). On balance, therefore, Bruwer et al.’s
(2001) segment of “enjoyment oriented, social wine drinkers” was confirmed.
Bruwer et al. (2001) argued that the “connoisseur” segment previously identified
by both McKinna (1986) and Spawton (1991a,b) and subsequently confirmed by
Hall & Winchester (1999) actually consisted of two sub-segments – their “ritual
oriented conspicuous wine enthusiasts” and “purposeful inconspicuous wine
drinkers”. They concluded that the latter segment was previously concealed in the
South Australian wine market. They further alluded that the former segment was
akin to the “connoisseur” segment – the type of wine drinker who might be
described as a “connoisseur” by others (the type of consumer who might have
been stereotyped as a “wine snob”). The characteristics of this segment included
an ostentatious display of their wine knowledge and a ritualistic approach to
drinking wine.
The “image oriented knowledge seeking wine drinker” identified by this study
shared many of these characteristics. They have a somewhat ritualistic approach
to wine drinking and they enjoy the image associated with drinking wine. They
have some wine knowledge and are actively seeking to improve that knowledge
and they may not be averse to displaying that knowledge as part of the image they
portray. In addition, many of the demographic data including education, income,
wine preference and frequency of drinking are compatible and the weekly and
69
average spend per bottle were a reasonable fit. The obvious non-fit was in the age
groups of the two segments, but on balance, the data provided a close
resemblance. Bruwer et al.’s (2001) “ritual oriented conspicuous wine
enthusiasts” segment was therefore also confirmed.
As discussed above, Bruwer et al. (2001) concluded that their “purposeful
inconspicuous wine drinkers” segment had been previously concealed in the
market. It can be implied that this segment was knowledgeable, but did not
display this knowledge in any untoward public display. They enjoy wine and
drink it as part of their daily routine and they have a collection from which to
choose their wine. Many of these characteristics are similar to the “conservative,
wine knowledgeable wine drinkers” identified in this study. In addition, the
demographic data displayed compatibility on the age, sex, education, frequency
and preference of wine criteria. Reasonable fits were displayed on the
consumption and spend criteria. Bruwer et al.’s (2001) “purposeful inconspicuous
wine drinkers” segment was therefore also confirmed.
Both studies identified a “basic wine drinker” segment. Many of the demographic
data provided compatible fits, especially in the age, education, income, frequency
and preference of wine criteria. Like all of the previous segments, there were
some discrepancies in the consumption and average spend data, with the current
study returning higher figures. There was also an anomaly in the sex
demographic. Bruwer et al. (2001) described this segment as mainly female. The
current study found a 40/60 female/male ratio. This discrepancy may be
accounted for by the differences in data collection used in the two studies –
household versus in store interception. Notwithstanding the comments above, it is
clear that the South Australian wine market has a segment of basic wine drinkers
and therefore Bruwer et al.’s (2001) “basic wine drinkers” segment is confirmed
as well.
The “experimenter, highly knowledgeable wine drinker” identified in this study
did not have a close resemblance to the remaining segment of Bruwer et al.’s
(2001) study – the “fashion/image oriented wine drinkers” segment. Although
some similarities were observed, most notably in the education and wine
preference criteria, wide discrepancies were noted on the sex, consumption and
70

spend criteria. More importantly, the indicative brands noted by Bruwer et al.
(2001) (Koonunga Hill, Kingston Estate Chardonnay, Wolf Blass Riesling) are
most unlikely to be indicative of a segment that has an “experimenter”
characteristic. Indicative brands of a segment with this characteristic are likely to
include brands from more unusual or up and coming wine producing districts, or
brands that are perceived as exciting and innovative. Bruwer et al.’s (2001)
“fashion/image oriented wine drinkers” segment was therefore not confirmed.
A closer examination of that segment’s characteristics revealed that the majority
of them were shared between the “image oriented knowledge seeking wine
drinker” and the “enjoyment oriented, social wine drinkers” segments identified
by this study. In other words, that segment was “subsumed” in two other
segments.
To conclude this discussion on the segments identified by this study, four of
Bruwer et al.’s (2001) segments were confirmed and one new segment was
identified by this study. Bruwer et al. (2001) concluded that the connoisseur
segment identified in a number of previous studies actually concealed a segment,
that they labeled the “purposeful inconspicuous premium wine drinkers”. This
study revealed that, in fact, there might have been a further segment concealed
under the catchall and hence inappropriate banner of “connoisseur”.
3.7 Implications for the Australian Wine Industry
Of particular interest to the wine industry is the final make up of the South Australian wine
market. This study has revealed a market consisting of:
• two segments (43.2% of the market) that will purchase and consume super premium
(and above) wines;
• one segment (19% of the market) that certainly leans towards that end of the market,
but is also willing to experiment across all price points;
• one segment (16.8% of the market) that is brand loyal and is likely to purchase at a
particular price point; and
• one segment (20.9% of the market) that displays some spontaneous and experimenter
characteristics and may be drawn to concept wine brands.
71

Whilst three of the segments identified here have so-called connoisseur attributes (read
from the final cluster centre, Table 3.5), it is more appropriate to state that all three
segments have the propensity to purchase super premium wines (as evidenced by their
respective average spend per bottle amounts), although the use of the word “premium” was
not used in any of the descriptors. This information is valuable to the wine industry, as the
majority of producers (by number) rely on niché markets for their survival and these
markets, by their nature, must be populated by consumers who are prepared to purchase
wines at these price points and higher. This study identified that 62.2% of the market might
fall into this category.
The two remaining segments are also of interest to the industry and require better
understanding. For example, the basic wine drinker segment identified here showed a clear
preference for consumption of bottled wine (67.2% indicating a preference for mainly
bottled wine, 26.2% indicating a mix of both cask and bottled wine and 6.6% indicating a
preference for cask wine). These figures may indicate a shift away from cask wine to
bottled wine in this segment and if that were the case, would indicate some considerable
potential to grow that segment. The enjoyment oriented wine drinker segment also requires
a deeper understanding. In particular, if the segment were attracted to concept brands, this
would be of significant interest to the industry.
To complete the picture, the five segments identified here and their relationship to Bruwer
et al. (2001) and the segments identified in other published research studies are described
in Table 3.16.
Table 3.16 Amended Australian Domestic Wine Market Segments
McKinna 1986 Spawton 1991 Hall &
Winchester 1999
Bruwer et al. 2001
Current Study
Segments
Connoisseurs Connoisseurs Connoisseurs Ritual – oriented conspicuous wine enthusiasts
Image oriented, knowledge seeking wine drinkers
Purposeful inconspicuous premium wine drinkers
Conservative, knowledgeable wine drinkers
72

McKinna 1986 Spawton 1991 Hall & Winchester
Bruwer et al. 2001
Current Study
1999
Segments
Experimenter, highly knowledgeable wine drinkers
Aspirational Aspirational Image Concerned
Fashion/image oriented
Young bottle wine drinkers
Beverage Beverage Risk Averse Basic Basic wine drinkers
New Wine Drinkers
New Wine Drinkers
Enjoyment – oriented
Enjoyment – oriented social drinkers
Enjoyment oriented, social wine drinkers
Source: Adapted from Bruwer et al., (2001 : 106)
3.8 Conclusions
This chapter identified five wine-related lifestyle segments in the South Australian wine
market and these segments form the basis of the further analysis undertaken in this study.
These segments were labelled:
• Conservative, knowledgeable wine drinkers;
• Image oriented, knowledge seeking wine drinkers;
• Basic wine drinkers;
• Experimenter, highly knowledgeable wine drinkers; and
• Enjoyment oriented, social wine drinkers.
Whilst four of the segments identified here are consistent with those identified by Bruwer
et al.’s (2001) study (the basis form which this research was developed), this study
identified a segment that has previously not been identified in the South Australian wine
market and could be considered a “concealed” segment, similar to the concept first raised
in Bruwer et al.’s study. This segment is likely to be significant to the Australian wine
industry, as it is relatively large (19% of consumers) and may indicate a purchasing
preference for wine brands that operate in niché markets and are considered by this
segment to be new, exciting and innovative. These brands or producers can be described as
boutique producers, but by number, they constitute a majority of the industry. It will be of
interest to them that this segment may be attracted to their products given the appropriate
communication messages.
73
The enjoyment oriented spontaneous wine drinkers and basic wine drinkers segment are
also of interest to the industry. In the case of the former, because of their potential to
purchase concept brands and the latter because of a possible trading up from cask to
bottled wines.
This chapter has established that the South Australian wine market consists of five
segments and these have been described in detail above. The next chapter is concerned
with an examination of the use of any risk reduction strategies employed by these segments
when they purchase wine.
74
Chapter 4 Identification and Examination of Each Segment’s Preferred Risk Reduction Strategies When Purchasing Wine
4.1 Introduction
The previous chapter identified five lifestyle segments in the South Australian wine market
and described their characteristics in some detail. This chapter attempts to solve the second
research sub problem that was:
• Identify and examine each segment’s preferred risk reduction strategies when
purchasing wine.
Risk was first identified as being part of the purchase decision process in 1960 (Bauer,
1960, cited in Mitchell & Greatorex, 1989). It is now understood that consumers undertake
some form of risk reduction in the majority of their purchases. The greater the level of risk
associated with the purchase, or the more complex the product being purchased, increases
the use of risk reducing behaviour. As many consumers perceive wine as a complex
product, some form of risk reduction behaviour is likely to be exhibited during its
purchase.
Mitchell & Greatorex (1989) stated that there were six generic risk reduction strategies
used by consumers. These were:
• Consumers seek information;
• Brand loyalty;
• Store image;
• Well-known brands;
• Price; and
• Reassurance
These generic strategies formed the basis of the examination of this sub-problem. The
objective of this chapter is therefore to explore whether any of these risk reduction
75
strategies are employed when wine is purchased and if so, identify the favoured strategies
of each of the segments in the market.
One hypothesis was formulated in relation to this sub-problem:
• Hypothesis 1 – Reducing risk in wine purchasing leads to the purchase of higher
quality wine.
The underlying assumption for this hypothesis was based on the work of Mitchell &
Greatorex (1989: 33), who stated … “As consumers gain experience and knowledge they
feel more able to make a purchase with less risk and this results in their purchasing quality
wines of a higher price” . If this statement is correct, it should be of interest to both wine
retailers and the wine industry generally. Quality wines attract higher prices than wines of
lesser quality and in most instances, provide higher profit margins to both producers and
retailers. Increasing the incidence of sales of these wines is therefore likely to increase
retailers’ profits. As far as the industry is concerned, many small and medium sized
producers position their products as quality wines, with commensurate price points and
increasing sales at these points would benefit those producers.
In order to test this hypothesis, respondents were asked to indicate which of the six generic
risk reduction strategies they used when purchasing wine and to rank those strategies that
they used in order of importance, where 1 was the most important strategy, 2 the next most
important and so on, until all strategies were ranked. The respondents were also asked to
complete their rankings over three different price points, that were chosen to represent the
demarcation between low, mid and high priced wines. The use of these different price
points served a number of purposes. Firstly, not all respondents would buy wine across all
price points. Some would only purchase wine at the lower end of the price scale, whilst
others would not buy wine below $15 per bottle. This demarcation allowed a separate
analysis of the preferred risk reduction strategies at the different price points. Secondly, the
price/quality relationship was employed. In the absence of any other criteria, the price of
the wine was an indicator of the quality of the wine. The higher the price of the bottle of
wine, the higher the assumed quality of that wine. The six strategies were presented to
respondents in a random order and can be seen at Section 5A of the Questionnaire in
Appendix 1.
76
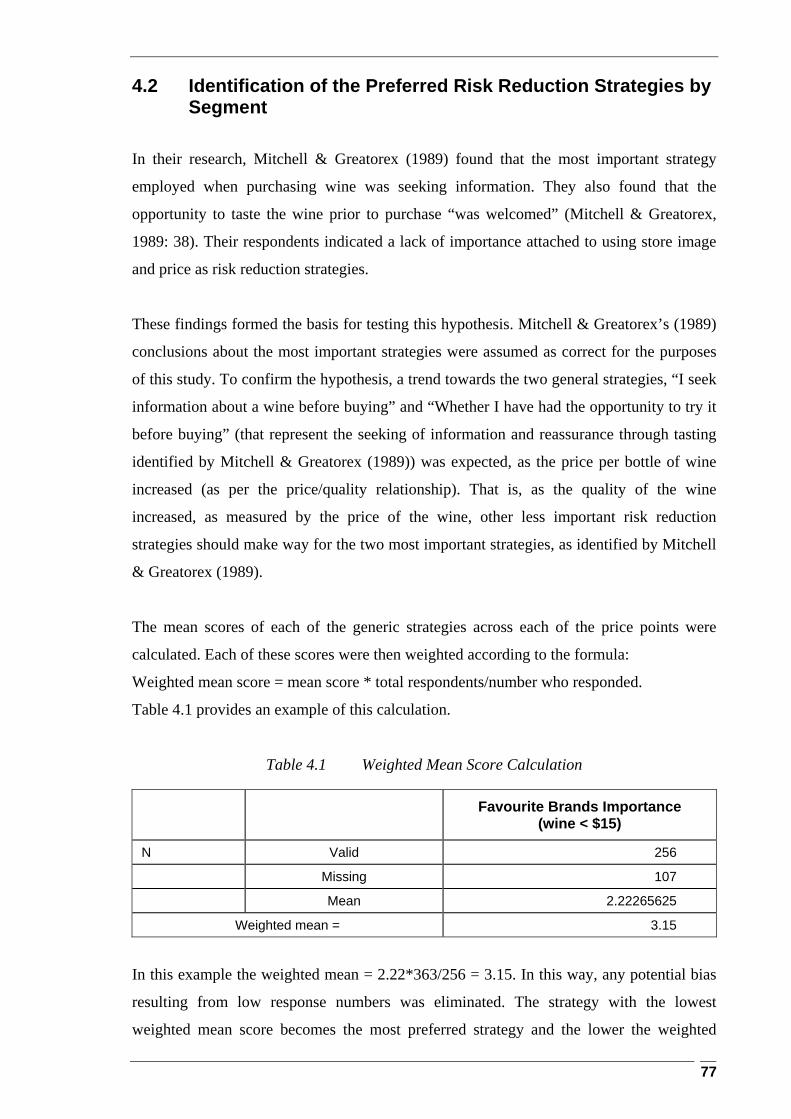
4.2 Identification of the Preferred Risk Reduction Strategies by Segment
In their research, Mitchell & Greatorex (1989) found that the most important strategy
employed when purchasing wine was seeking information. They also found that the
opportunity to taste the wine prior to purchase “was welcomed” (Mitchell & Greatorex,
1989: 38). Their respondents indicated a lack of importance attached to using store image
and price as risk reduction strategies.
These findings formed the basis for testing this hypothesis. Mitchell & Greatorex’s (1989)
conclusions about the most important strategies were assumed as correct for the purposes
of this study. To confirm the hypothesis, a trend towards the two general strategies, “I seek
information about a wine before buying” and “Whether I have had the opportunity to try it
before buying” (that represent the seeking of information and reassurance through tasting
identified by Mitchell & Greatorex (1989)) was expected, as the price per bottle of wine
increased (as per the price/quality relationship). That is, as the quality of the wine
increased, as measured by the price of the wine, other less important risk reduction
strategies should make way for the two most important strategies, as identified by Mitchell
& Greatorex (1989).
The mean scores of each of the generic strategies across each of the price points were
calculated. Each of these scores were then weighted according to the formula:
Weighted mean score = mean score * total respondents/number who responded.
Table 4.1 provides an example of this calculation.
Table 4.1 Weighted Mean Score Calculation
Favourite Brands Importance (wine < $15)
N Valid 256
Missing 107
Mean 2.22265625
Weighted mean = 3.15
In this example the weighted mean = 2.22*363/256 = 3.15. In this way, any potential bias
resulting from low response numbers was eliminated. The strategy with the lowest
weighted mean score becomes the most preferred strategy and the lower the weighted
77
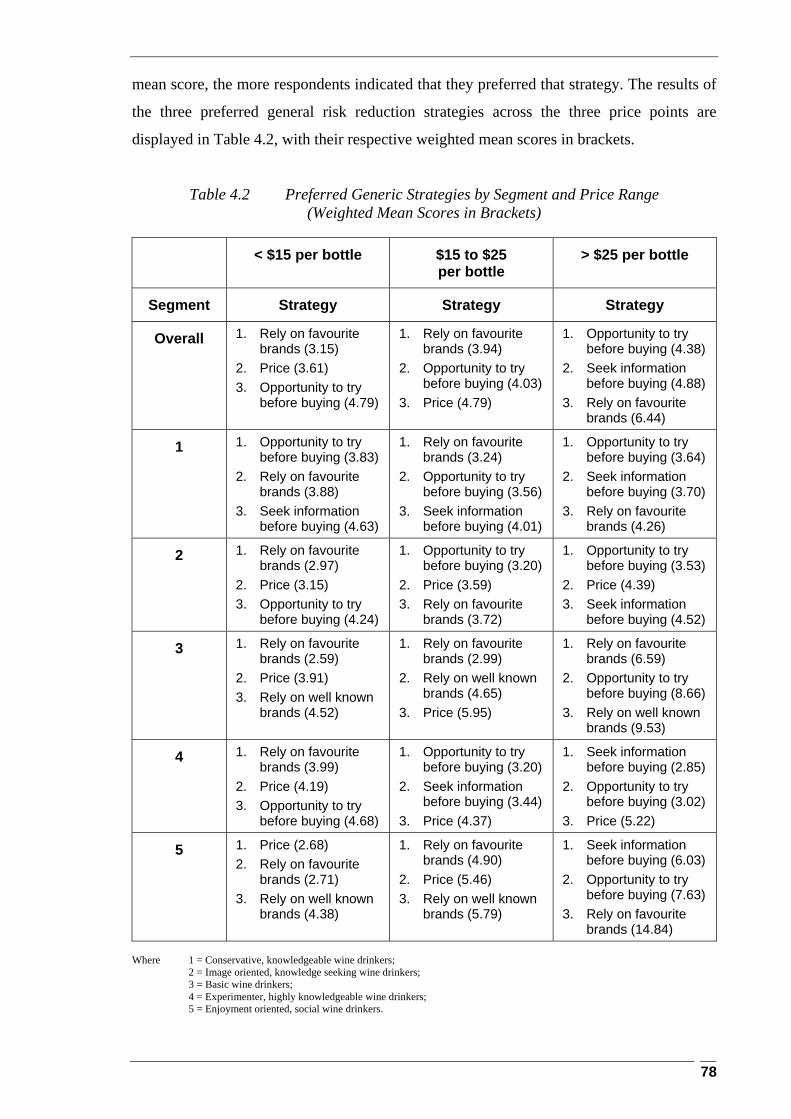
mean score, the more respondents indicated that they preferred that strategy. The results of
the three preferred general risk reduction strategies across the three price points are
displayed in Table 4.2, with their respective weighted mean scores in brackets.
Table 4.2 Preferred Generic Strategies by Segment and Price Range (Weighted Mean Scores in Brackets)
< $15 per bottle $15 to $25 per bottle
> $25 per bottle
Segment Strategy Strategy Strategy
Overall 1. Rely on favourite brands (3.15)
2. Price (3.61) 3. Opportunity to try
before buying (4.79)
1. Rely on favourite brands (3.94)
2. Opportunity to try before buying (4.03)
3. Price (4.79)
1. Opportunity to try before buying (4.38)
2. Seek information before buying (4.88)
3. Rely on favourite brands (6.44)
1 1. Opportunity to try before buying (3.83)
2. Rely on favourite brands (3.88)
3. Seek information before buying (4.63)
1. Rely on favourite brands (3.24)
2. Opportunity to try before buying (3.56)
3. Seek information before buying (4.01)
1. Opportunity to try before buying (3.64)
2. Seek information before buying (3.70)
3. Rely on favourite brands (4.26)
2 1. Rely on favourite brands (2.97)
2. Price (3.15) 3. Opportunity to try
before buying (4.24)
1. Opportunity to try before buying (3.20)
2. Price (3.59) 3. Rely on favourite
brands (3.72)
1. Opportunity to try before buying (3.53)
2. Price (4.39) 3. Seek information
before buying (4.52)
3 1. Rely on favourite brands (2.59)
2. Price (3.91) 3. Rely on well known
brands (4.52)
1. Rely on favourite brands (2.99)
2. Rely on well known brands (4.65)
3. Price (5.95)
1. Rely on favourite brands (6.59)
2. Opportunity to try before buying (8.66)
3. Rely on well known brands (9.53)
4 1. Rely on favourite brands (3.99)
2. Price (4.19) 3. Opportunity to try
before buying (4.68)
1. Opportunity to try before buying (3.20)
2. Seek information before buying (3.44)
3. Price (4.37)
1. Seek information before buying (2.85)
2. Opportunity to try before buying (3.02)
3. Price (5.22)
5 1. Price (2.68) 2. Rely on favourite
brands (2.71) 3. Rely on well known
brands (4.38)
1. Rely on favourite brands (4.90)
2. Price (5.46) 3. Rely on well known
brands (5.79)
1. Seek information before buying (6.03)
2. Opportunity to try before buying (7.63)
3. Rely on favourite brands (14.84)
Where 1 = Conservative, knowledgeable wine drinkers; 2 = Image oriented, knowledge seeking wine drinkers; 3 = Basic wine drinkers; 4 = Experimenter, highly knowledgeable wine drinkers; 5 = Enjoyment oriented, social wine drinkers.
78

4.3 Discussion of These Results
Section 4.2 identified the three most preferred strategies, both overall and for each of the
segments. These results are now examined in more detail.
4.3.1 Overall Result
As the price per bottle increases, the influence of the two strategies identified by
Mitchell & Greatorex (1989) as the most important, becomes more pronounced.
In the under $15 per bottle range, relying on favourite brands is ranked number
one and the opportunity to try before purchasing is ranked the third most
important strategy. At the $15 to $25 range, relying on favourite brands is still
ranked number one, but the opportunity to try before purchasing and seeking
information before buying are now ranked numbers 2 and 3 respectively. At the
over $25 price points, the opportunity to try before purchasing and seeking
information before buying are ranked numbers 1 and 2.
This trend indicated that as the price of a bottle of wine increased (and hence as
the quality of the wine increased), the nature of the preferred risk reduction
strategies changed, so that at the most expensive price points, the two preferred
strategies matched the two most important strategies identified by Mitchell &
Greatorex (1989). This indicated two things:
• The findings of Mitchell & Greatorex (1989) about the importance of
information seeking and tasting wine as a method of reassurance prior to
purchase were conditionally supported by this study. The support is only
conditional, as this study found that the opportunity to try before purchase
was ranked more important (overall), than information seeking, which in turn.
reversed Mitchell & Greatorex’s (1989) findings.
• This study was based on the assumption that as the price of the wine
increased, any trend towards the two strategies identified by Mitchell &
Greatorex indicated that the employment of risk reduction behaviour led to
the purchase of higher quality wine. This formed the basis of the hypothesis
related to this sub-problem and as the results discussed above demonstrated
such a trend, the hypothesis was confirmed.
In the under $15 range, the most preferred strategy was relying on favourite
brands and that result is not controversial. Although there are a plethora of wines
79

on the market in that price range, this indicated that consumers purchase wines
that have previously satisfied their needs and as a result overcome any financial
and functional risks that may have been associated with the purchase of that bottle
of wine. This result also indicated that at that price range, there is less likely to be
any experimentation on behalf of wine consumers. Spawton’s (1991a, b) “safe
brands” might exist within this price range.
In the $15 to $25 range, the reliance on favourite brands was the most preferred
strategy, but the opportunity to try before purchasing was now ranked number 2
and the gap between the two weighted mean scores was minimal (3.94 and 4.03
respectively). As very little separated these preferred strategies, one interpretation
of the data might be that at the price points closer to $15, the preferred strategy
remained a reliance on favourite brands, but as the price of a bottle increased
towards the $25 mark, the preferred strategy may have shifted towards the
opportunity to try before purchasing.
In the over $25 range, consumers actively sought reassurance and information to
increase their knowledge prior to the purchase of the wine. This is entirely
consistent with Mitchell & Greatorex’s (1989) earlier findings and indicated that
the reduction of both the financial and functional risks through reassurance and
information seeking strategies was an important consideration.
One other relevant point indicated by the data was the lack of importance placed
on price as a preferred risk reduction strategy (only one mention in the 9 preferred
strategies reported overall) and the total lack of store image as a preferred
strategy. This accords entirely with the earlier finding of Mitchell & Greatorex
(1989).
Each of the five identified segments is now analysed.
4.3.2 Segment 1 – Conservative, Knowledgeable Wine Drinkers.
The results for this segment showed a similar trend to the overall results, whereby
the opportunity to try before purchasing and seeking information before buying
were ranked numbers 1 and 2 respectively at the > $25 range. The scores for all
80
the preferred strategies at the $15 to $25 and > $25 ranges were lower than the
scores at the < $15 range. This indicated that more wine was purchased at those
higher price points, which is consistent with the earlier analysis on this segment.
In fact, the lowest score of 3.24 was returned for the preferred strategy in the $15
to $25 range, that of relying on favourite brands. This result was also consistent
with the previous analysis that suggested that consumers in this segment were
likely to purchase wines and wine brands of a similar type and style from one year
to the next. These results reinforced that interpretation and provided a more
detailed understanding of the segment. They also suggested that many of the
wines and brands purchased by this segment might be in the $15 to $25 range. As
the price of wines increased, this segment turned to reassurance and information
seeking as a means of reducing their risk, which was consistent with the overall
result.
4.3.3 Segment 2 – Image Oriented, Knowledge Seeking Wine Drinkers.
This segment showed a general trend that was consistent with the overall result,
however the preferred strategy of seeking information before buying was only
ranked third in importance in the > $25 range. The importance of the opportunity
to try before purchasing as a preferred strategy increased as the price of the wine
increased. Perhaps the most striking result here was the importance of price as a
preferred risk reduction strategy. This was ranked as the second most important
across all three price ranges. Whilst this result conflicts with the overall results,
where price was a relatively unimportant strategy, it is consistent with the earlier
analysis undertaken on this segment.
That analysis found that this segment had the highest score on the “price/quality
or value” element and concluded that price was an important consideration in their
purchasing behaviour. These results confirmed that analysis and showed that this
segment used price as an important risk reduction strategy. In this instance, the
use of price was more likely to negate the functional and social risks associated
with the purchase. The higher the price of the wine purchased, the better the
perceived quality of the wine and the increased likelihood that the wine would
meet their taste requirements. Similarly, the social risk is decreased. This segment
81

is one that likes the image associated with drinking wine and seeks out the
“praise” of their peers about their knowledge of wine and their choice of wines for
different occasions. In their opinion, a more expensive wine is more likely to be
accepted by their peers, thereby increasing their perceived “standing” within that
peer group.
4.3.4 Segment 3 – Basic Wine Drinkers.
The results from this segment were the most divergent from the overall results.
The most preferred strategy across all three price ranges was relying on favourite
brands. Whereas this result matched that of the overall result for the two price
ranges under $25, this was the only segment that had a consistent preferred
strategy over all price ranges. The scores also uniformly increased as the price
increased, which indicated that the number of people who bought wine in the
more expensive price ranges also decreased. This result is consistent with the
characteristics of the segment, as the previous analysis suggested that their
preferred price points were towards the lower end of the scale. This was
confirmed by their average price per bottle figures.
Of more interest was the result itself. Previous analysis suggested that the segment
purchased safe brands. This was reflected in their relatively high score on that
particular element. This result confirmed that earlier analysis and added further to
the knowledge about that segment. As their preferred risk reduction strategy
across all price points was relying on favourite brands, it can be concluded that
this segment used a number of safe brands from which they made their wine
purchases and these safe brands were more likely than not to be in the < $15 price
range, as this is where the majority of their purchases were made. For consumers
in this segment, the result confirmed the existence of Spawton’s (1991a,b) “safe
brands”.
In an effort to try and identify some of these safe brands, an analysis was
undertaken of the wines that respondents from this segment reported that they had
purchased in the month prior to completing the survey (this was data collected
from Section 3 of the survey form). The mean number of bottles purchased for
each brand was computed and that figure was then multiplied by the actual
number of respondents who had purchased that brand and then divided by the
82

number of respondents in that segment (61), to form an adjusted mean (adjusted
mean = mean * n /61, where n = number of respondents who actually purchased
the brand). Therefore, the highest adjusted mean represented the most purchased
brand. It is likely that any “safe brands” would come from the top ten brands
purchased by that segment. The results of this exercise revealed that the most
purchased wines in both the red and white wine categories were generally from
brands that are well represented in the “commercial” category of wines found in
most wine retailers. With the possible exception of the Penfolds Bin range
appearing in the red wine section at number 8, there were no surprises in these
results. The results are displayed in Table 4.3 below.
Table 4.3 Top 10 Brands, Red and White Wines Purchased by Segment 3
RED WINE WHITE WINE
Other Red wine $10 to $20 Sparkling White Wine
Number who purchased 12 Number who
purchased 13
Mean purchase (bottles) 5.25 Mean purchase
(bottles) 3.85
Adjusted Mean 1.03 Adjusted Mean 0.82
Peter Lehmann Red Wine Range Other White wine $10 to $20
Number who purchased 11 Number who
purchased 7
Mean purchase (bottles) 4.36 Mean purchase
(bottles) 4.29
Adjusted Mean 0.79 Adjusted Mean 0.49
Rosemount Split Label Red Range Banrock Station White Range
Number who purchased 13 Number who
purchased 5
Mean purchase (bottles) 2.31 Mean purchase
(bottles) 5.20
Adjusted Mean 0.49 Adjusted Mean 0.43
Rawsons Retreat Red Queen Adelaide Whites
Number who purchased 12 Number who
purchased 4
83

RED WINE WHITE WINE
Mean purchase (bottles) 2.33 Mean purchase
(bottles) 5.00
Adjusted Mean 0.46 Adjusted Mean 0.33
Lindemans Red Bin Range Rosemount Diamond Label White Range
Number who purchased 2 Number who
purchased 5
Mean purchase (bottles) 10.00 Mean purchase
(bottles) 3.80
Adjusted Mean 0.33 Adjusted Mean 0.31
Mc Williams Hanwood Red Range Jacobs Creek White Range
Number who purchased 3 Number who
purchased 6
Mean purchase (bottles) 6.67 Mean purchase
(bottles) 3.00
Adjusted Mean 0.33 Adjusted Mean 0.30
Red 2 Litre Cask White 2 Litre Cask
Number who purchased 5 Number who
purchased 6
Mean purchase (bottles) 4.00 Mean purchase
(bottles) 2.67
Adjusted Mean 0.33 Adjusted Mean 0.26
Penfolds Bin Red Range White 4 Litre Cask
Number who purchased 7 Number who
purchased 7
Mean purchase (bottles) 2.57 Mean purchase
(bottles) 2.00
Adjusted Mean 0.30 Adjusted Mean 0.23
Yalumba Galway Shiraz Rosemount Split Label White Range
Number who purchased 9 Number who
purchased 4
Mean purchase (bottles) 2.00 Mean purchase
(bottles) 3.00
Adjusted Mean 0.30 Adjusted Mean 0.20
Annies Lane Red Range Peter Lehmann White Range
84
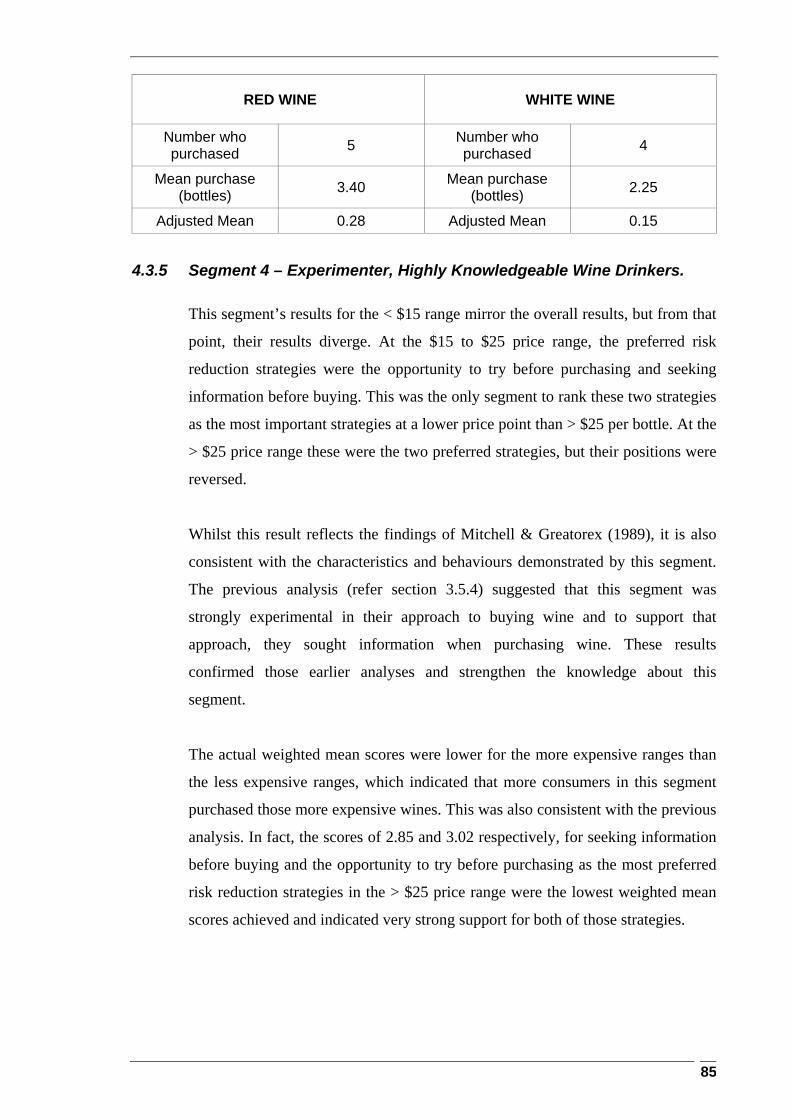
RED WINE WHITE WINE
Number who purchased 5 Number who
purchased 4
Mean purchase (bottles) 3.40 Mean purchase
(bottles) 2.25
Adjusted Mean 0.28 Adjusted Mean 0.15
4.3.5 Segment 4 – Experimenter, Highly Knowledgeable Wine Drinkers.
This segment’s results for the < $15 range mirror the overall results, but from that
point, their results diverge. At the $15 to $25 price range, the preferred risk
reduction strategies were the opportunity to try before purchasing and seeking
information before buying. This was the only segment to rank these two strategies
as the most important strategies at a lower price point than > $25 per bottle. At the
> $25 price range these were the two preferred strategies, but their positions were
reversed.
Whilst this result reflects the findings of Mitchell & Greatorex (1989), it is also
consistent with the characteristics and behaviours demonstrated by this segment.
The previous analysis (refer section 3.5.4) suggested that this segment was
strongly experimental in their approach to buying wine and to support that
approach, they sought information when purchasing wine. These results
confirmed those earlier analyses and strengthen the knowledge about this
segment.
The actual weighted mean scores were lower for the more expensive ranges than
the less expensive ranges, which indicated that more consumers in this segment
purchased those more expensive wines. This was also consistent with the previous
analysis. In fact, the scores of 2.85 and 3.02 respectively, for seeking information
before buying and the opportunity to try before purchasing as the most preferred
risk reduction strategies in the > $25 price range were the lowest weighted mean
scores achieved and indicated very strong support for both of those strategies.
85

4.3.6 Segment 5 – Enjoyment Oriented, Social Wine Drinkers.
This segment shared many of the results with other segments, however, there were
some that required comment. The preferred risk reduction strategy in the < $15
range was price and this was the only occasion where price was preferred as a
strategy. It was unlikely that price was used as a substitute for quality in this
instance. It was more likely that price was used to reduce the financial risk
associated with the purchase, as this segment did not score as high as other
segments on the price/quality or value element. The more likely explanation
would be buying wine to a budget and this was consistent with the earlier
analysis.
The $15 to $25 range revealed that the preferred strategy was relying on favourite
brands. Once again, this is not inconsistent with the earlier analysis, that revealed
that this segment used packaging and labelling in their purchasing behaviour and
they might be attracted to “concept” brands. It might be that these concept brands
had met their requirements and were now part of the segment’s evoked set.
The results for the > $25 range indicated that fewer consumers in this segment
purchased wine priced in that range and this was also consistent with the previous
analysis. The actual results mirrored those obtained for the previous segment and
that is not altogether unsurprising. Both of these segments shared some
experimenter traits and sought out information about the wine prior to purchase,
to support this behaviour. A preferred risk reduction strategy of seeking
information was therefore expected, although the strength of the support shown by
this segment was less than that afforded by the previous segment.
4.4 Conclusions
This chapter was concerned with identifying the preferred generic risk reduction strategies
employed by each of the five segments in the South Australian wine market, when they
purchased a bottle of wine. Earlier research by Mitchell & Greatorex (1989) found that the
two most important risk reduction strategies (out of the six generic strategies available)
were that consumers sought information about their intended wine purchase and that they
sought reassurance through tasting the wine prior to buying it. Using these findings, in the
first instance, this research investigated any trends that were prevalent in the preferred risk
reduction strategies employed across three price points. The premise used was that as the
86

wines became more expensive, the two strategies identified by Mitchell & Greatorex
would come to the fore. The findings showed that this did in fact occur and that in the >
$25 price range, the opportunity to try before buying and seeking information before
buying were the two preferred strategies. The hypothesis formulated in relation to this
chapter was therefore confirmed and conditional support was offered to the findings of
Mitchell & Greatorex (1989), as this research’s findings were the reverse of their earlier
research.
The preferred strategies of each of the five segments were then examined. In general, the
trends prevalent in the overall results were repeated in the individual segments. The major
discrepancy was found in the basic wine drinkers segment (segment 3), where the strategy
relying on favourite brands, was preferred across all three-price points. This analysis was
consistent with the earlier analysis and interpretation performed on that segment and
suggested that this segment used a number of “safe brands” from which the majority of
their wine purchasing took place, thus confirming Spawton’s (1991a,b) assertions. An
attempt was made to identify some of the brands that might comprise these “safe brands”.
Apart from that segment, the trend towards the opportunity to try before buying and
seeking information before buying strategies was consistent in all segments and across the
price points. Segment 4, the experimenter, highly knowledgeable wine drinkers, showed
the strongest support for these strategies and this is consistent with their desire to have
variety in their wine purchasing, backed by information and research. In fact, the
information derived from this particular part of the overall research, confirmed what earlier
analysis had suggested about each of the segments and therefore strengthened the
knowledge about each.
The research sub-problem associated with this chapter was therefore resolved.
The next chapter is concerned with extending these generic risk reduction strategies into
the wine retail environment and identifying those specific preferred strategies over which
retail management have control.
87
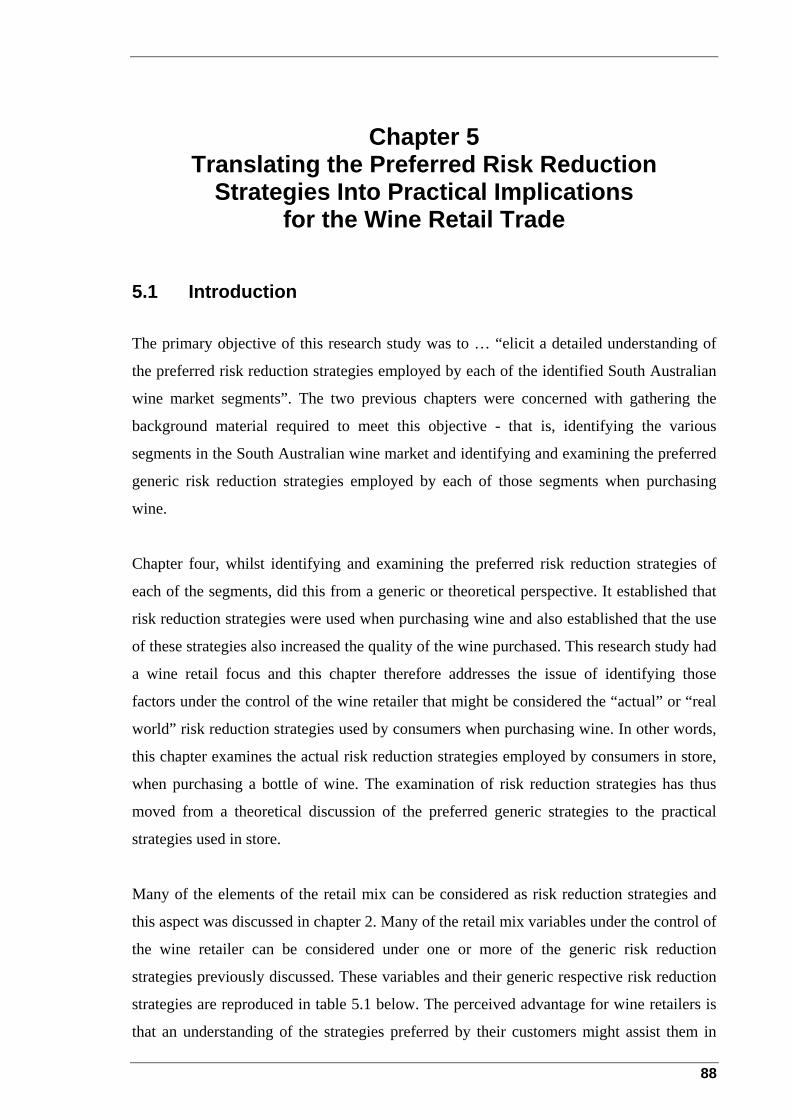
Chapter 5 Translating the Preferred Risk Reduction
Strategies Into Practical Implications for the Wine Retail Trade
5.1 Introduction
The primary objective of this research study was to … “elicit a detailed understanding of
the preferred risk reduction strategies employed by each of the identified South Australian
wine market segments”. The two previous chapters were concerned with gathering the
background material required to meet this objective - that is, identifying the various
segments in the South Australian wine market and identifying and examining the preferred
generic risk reduction strategies employed by each of those segments when purchasing
wine.
Chapter four, whilst identifying and examining the preferred risk reduction strategies of
each of the segments, did this from a generic or theoretical perspective. It established that
risk reduction strategies were used when purchasing wine and also established that the use
of these strategies also increased the quality of the wine purchased. This research study had
a wine retail focus and this chapter therefore addresses the issue of identifying those
factors under the control of the wine retailer that might be considered the “actual” or “real
world” risk reduction strategies used by consumers when purchasing wine. In other words,
this chapter examines the actual risk reduction strategies employed by consumers in store,
when purchasing a bottle of wine. The examination of risk reduction strategies has thus
moved from a theoretical discussion of the preferred generic strategies to the practical
strategies used in store.
Many of the elements of the retail mix can be considered as risk reduction strategies and
this aspect was discussed in chapter 2. Many of the retail mix variables under the control of
the wine retailer can be considered under one or more of the generic risk reduction
strategies previously discussed. These variables and their generic respective risk reduction
strategies are reproduced in table 5.1 below. The perceived advantage for wine retailers is
that an understanding of the strategies preferred by their customers might assist them in
88
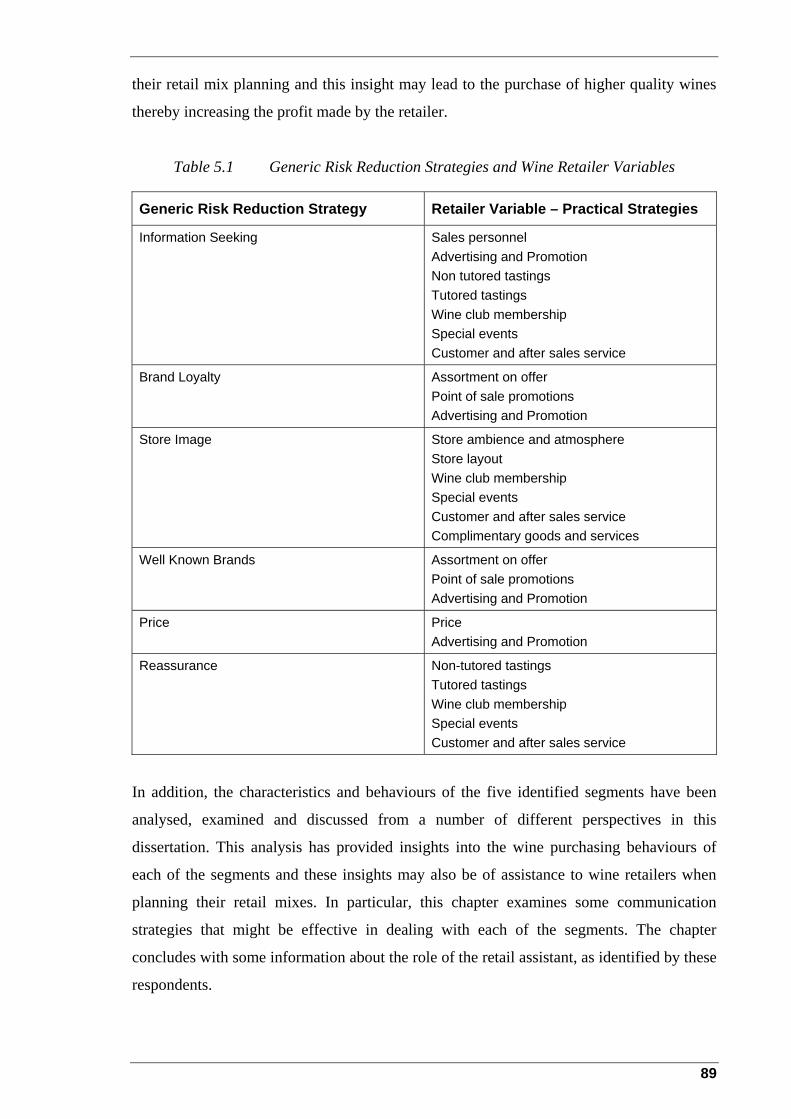
their retail mix planning and this insight may lead to the purchase of higher quality wines
thereby increasing the profit made by the retailer.
Table 5.1 Generic Risk Reduction Strategies and Wine Retailer Variables
Generic Risk Reduction Strategy Retailer Variable – Practical Strategies
Information Seeking Sales personnel Advertising and Promotion Non tutored tastings Tutored tastings Wine club membership Special events Customer and after sales service
Brand Loyalty Assortment on offer Point of sale promotions Advertising and Promotion
Store Image Store ambience and atmosphere Store layout Wine club membership Special events Customer and after sales service Complimentary goods and services
Well Known Brands Assortment on offer Point of sale promotions Advertising and Promotion
Price Price Advertising and Promotion
Reassurance Non-tutored tastings Tutored tastings Wine club membership Special events Customer and after sales service
In addition, the characteristics and behaviours of the five identified segments have been
analysed, examined and discussed from a number of different perspectives in this
dissertation. This analysis has provided insights into the wine purchasing behaviours of
each of the segments and these insights may also be of assistance to wine retailers when
planning their retail mixes. In particular, this chapter examines some communication
strategies that might be effective in dealing with each of the segments. The chapter
concludes with some information about the role of the retail assistant, as identified by these
respondents.
89
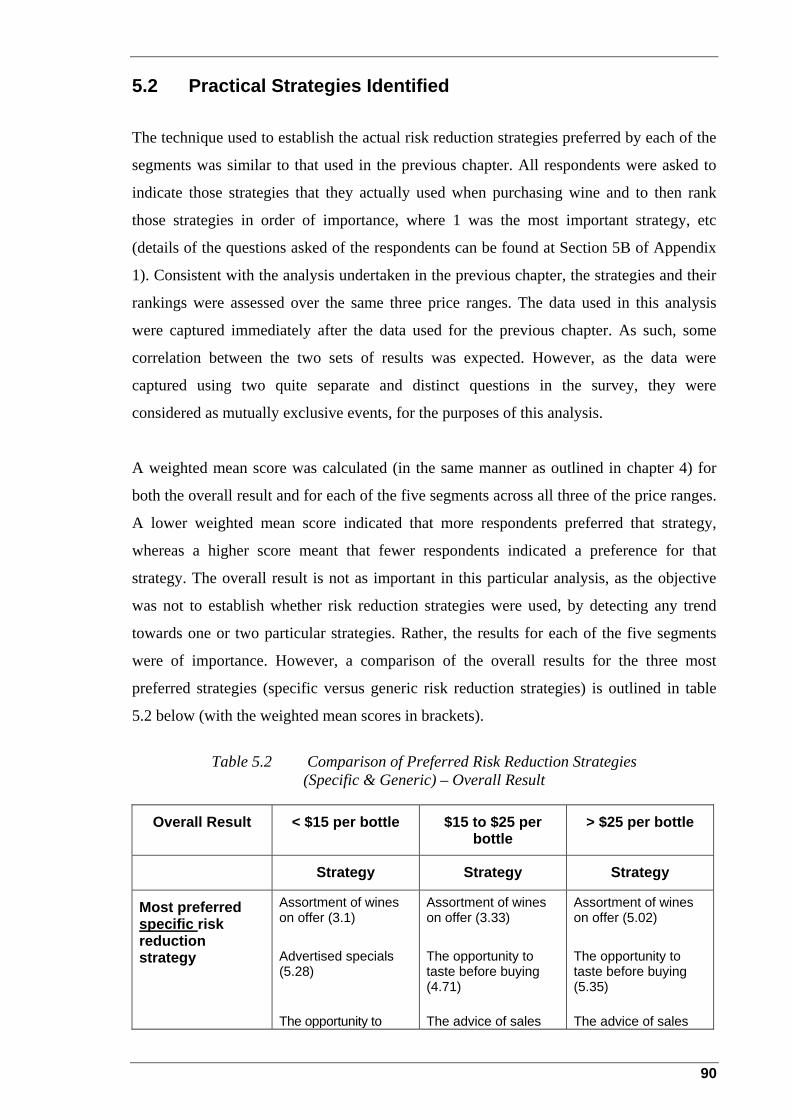
5.2 Practical Strategies Identified
The technique used to establish the actual risk reduction strategies preferred by each of the
segments was similar to that used in the previous chapter. All respondents were asked to
indicate those strategies that they actually used when purchasing wine and to then rank
those strategies in order of importance, where 1 was the most important strategy, etc
(details of the questions asked of the respondents can be found at Section 5B of Appendix
1). Consistent with the analysis undertaken in the previous chapter, the strategies and their
rankings were assessed over the same three price ranges. The data used in this analysis
were captured immediately after the data used for the previous chapter. As such, some
correlation between the two sets of results was expected. However, as the data were
captured using two quite separate and distinct questions in the survey, they were
considered as mutually exclusive events, for the purposes of this analysis.
A weighted mean score was calculated (in the same manner as outlined in chapter 4) for
both the overall result and for each of the five segments across all three of the price ranges.
A lower weighted mean score indicated that more respondents preferred that strategy,
whereas a higher score meant that fewer respondents indicated a preference for that
strategy. The overall result is not as important in this particular analysis, as the objective
was not to establish whether risk reduction strategies were used, by detecting any trend
towards one or two particular strategies. Rather, the results for each of the five segments
were of importance. However, a comparison of the overall results for the three most
preferred strategies (specific versus generic risk reduction strategies) is outlined in table
5.2 below (with the weighted mean scores in brackets).
Table 5.2 Comparison of Preferred Risk Reduction Strategies
(Specific & Generic) – Overall Result
Overall Result < $15 per bottle $15 to $25 per bottle
> $25 per bottle
Strategy Strategy Strategy
Most preferred specific risk reduction strategy
Assortment of wines on offer (3.1) Advertised specials (5.28) The opportunity to
Assortment of wines on offer (3.33) The opportunity to taste before buying (4.71) The advice of sales
Assortment of wines on offer (5.02) The opportunity to taste before buying (5.35) The advice of sales
90

Overall Result < $15 per bottle $15 to $25 per bottle
> $25 per bottle
Strategy Strategy Strategy
taste before buying (5.51)
personnel (6.32) personnel (7.53)
Most preferred generic risk reduction strategy
Rely on favourite brands (3.15) Price (3.61) Opportunity to try before buying (4.79)
Rely on favourite brands (3.94) Opportunity to try before buying (4.03) Price (4.79)
Opportunity to try before buying (4.38) Seek information before buying (4.88) Rely on favourite brands (6.44)
This comparison demonstrated that the results for the preferred generic risk reduction
strategies were not duplicated by the results for the preferred specific risk reduction
strategies. The assortment of wines on offer at the wine retailer (which as a generic
strategy could be considered either as relying on favourite brands or relying on well known
brands) was the most preferred specific strategy across all three price ranges. By
comparison, the overall results for the generic strategies showed that relying on favourite
brands was the most preferred strategy at price points < $25 per bottle and that the
opportunity to try before buying was the most preferred at > $25 per bottle. The
opportunity to try before buying was ranked the second or third most preferred specific
strategy across all price points and indicated that the majority of consumers sought
information or reassurance through tasting wine before purchase. This result is broadly
consistent with the generic result. Of particular interest is the emergence of the advice of
sales personnel as the third ranked strategy for wines in the > $15 price range. It is well
documented (for example, Mitchell & Greatorex, 1989: 43) that generally, consumers are
reluctant to ask the advice of wine sales staff or alternatively, hold their opinions in low
regard. It seems that, at least with the consumers in this sample, that their advice is both
welcome and heeded. The role of the wine retail assistant is examined in more detail later
in this chapter.
5.3 Discussion of These Results
Although there were some similarities in both sets of results, it is not the overall results,
but those of each individual segment that are of interest here. In the discussion that follows
on each segment, a comparison between the specific and generic risk reduction strategies
91
will be tabulated, followed by some implications for wine retailers that flow from the
results.
5.3.1 Segment 1 – Conservative, Wine Knowledgeable Wine Drinkers.
The comparison between the most preferred generic and specific risk reduction
strategies for this segment is outlined in table 5.3.
Table 5.3 Most Preferred Generic and Specific Risk Reduction Strategies – Segment 1
Segment 1 Conservative, Wine Knowledgeable Wine Drinkers
<$15 per bottle $15 to $25 per bottle
> $25 per bottle
Most preferred specific risk reduction strategy
Assortment of wines on offer (3.65) The opportunity to taste before buying (4.16) Advertised specials (5.50)
Assortment of wines on offer (3.08) The opportunity to taste before buying (3.19) Level of service offered by retailer (6.00)
The opportunity to taste before buying (3.50) Assortment of wines on offer (3.56) Level of service offered by retailer (7.05)
Most preferred generic risk reduction strategy
Opportunity to try before buying (3.83) Rely on favourite brands (3.88) Seek information before buying (4.63)
Rely on favourite brands (3.24) Opportunity to try before buying (3.56) Seek information before buying (4.01)
Opportunity to try before buying (3.64) Seek information before buying (3.70) Rely on favourite brands (4.26)
These results showed some consistency between the preferred generic and specific
strategies. In the > $25 per bottle price range, the opportunity to try before buying
was the preferred strategy. This is perhaps a reflection of the conservative nature
of this consumer, as they seek reassurance before spending a lot of money on the
wines that they purchase. In the lower price ranges, the assortment of wines was
the preferred option. Once again, this is consistent with the previous analysis
about this consumer. They are likely to have a number of brands and styles of
wines that they purchase every year, indicative of their brand loyalty and as a
result, they would require the assortment of wine on offer at their wine retailer of
92

preference to include those brands. This segment was the only one that ranked the
level of service offered by the retailer in their top three strategies. This is not to
suggest that wine retailers should neglect that part of their retail mix, but is once
again a reflection of the generally more conservative nature of this consumer.
Their expectations of the level of service provided may be higher than other
consumers and consequently they use that as a measuring stick when it comes to
choosing wine from a retailer.
5.3.1.1 Retail Implications – Segment 1
The implications for a wine retailer who has customers from this segment might
include:
• The assortment of wines that might appeal to this segment are likely to
include super and ultra premium (Rabobank, 1999) wines from the four
largest producers in the Australian industry (Southcorp, BRL Hardy, Beringer
Blass and Orlando Wyndham). These large producers are the ones most likely
to provide such an assortment of wines. These wines are found in most fine
wine stores and the “up market” national chain stores and therefore the needs
of this segment in relation to wine assortment, are likely to be met.
• Regular tastings of wines that meet the criteria discussed above would satisfy
the segment’s preference for tasting wine before buying.
• The issue of the level of service provided to this segment should not be
discounted, however, it would be a folly if a wine retailer only provided a
high level of service (both before and after purchase) to consumers who they
identified as being in this segment. A continued high level of service to all
consumers should be the absolute minimum level of service provided to any
customer in a retail environment.
5.3.2 Segment 2 – Image Oriented, Knowledge Seeking Wine Drinkers.
The comparison between the most preferred generic and specific risk reduction
strategies for this segment is outlined in table 5.4.
93
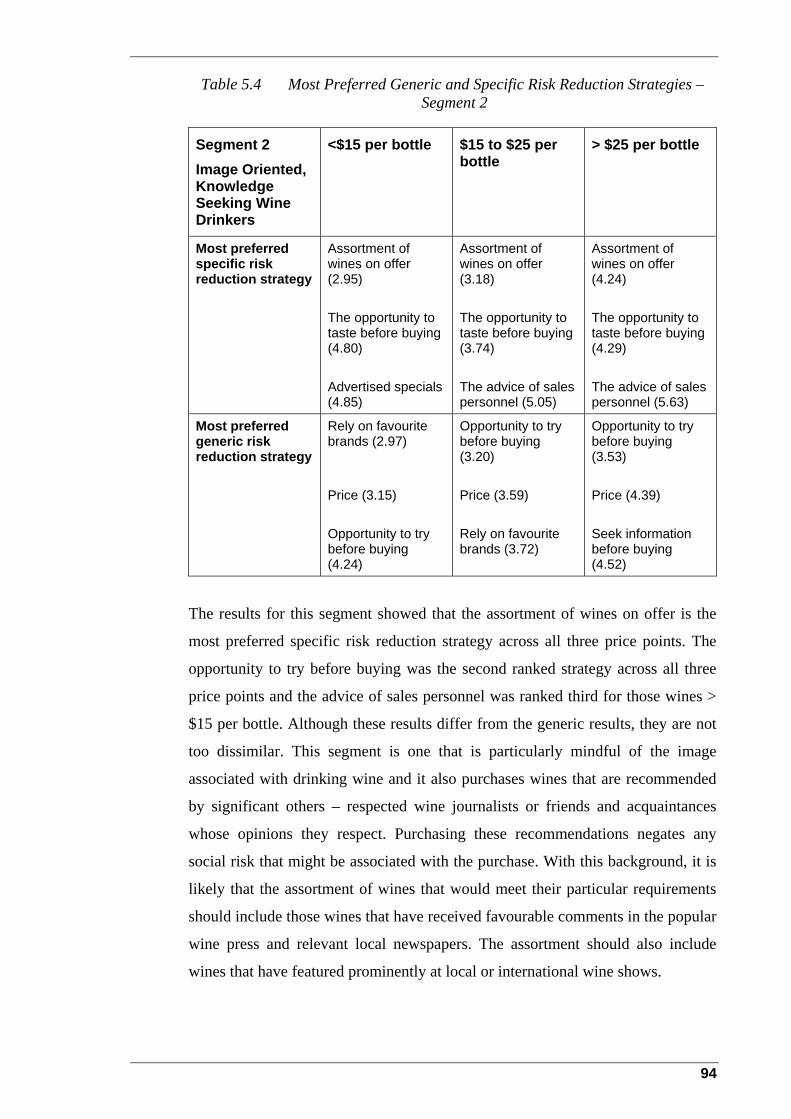
Table 5.4 Most Preferred Generic and Specific Risk Reduction Strategies – Segment 2
Segment 2 Image Oriented, Knowledge Seeking Wine Drinkers
<$15 per bottle $15 to $25 per bottle
> $25 per bottle
Most preferred specific risk reduction strategy
Assortment of wines on offer (2.95) The opportunity to taste before buying (4.80) Advertised specials (4.85)
Assortment of wines on offer (3.18) The opportunity to taste before buying (3.74) The advice of sales personnel (5.05)
Assortment of wines on offer (4.24) The opportunity to taste before buying (4.29) The advice of sales personnel (5.63)
Most preferred generic risk reduction strategy
Rely on favourite brands (2.97) Price (3.15) Opportunity to try before buying (4.24)
Opportunity to try before buying (3.20) Price (3.59) Rely on favourite brands (3.72)
Opportunity to try before buying (3.53) Price (4.39) Seek information before buying (4.52)
The results for this segment showed that the assortment of wines on offer is the
most preferred specific risk reduction strategy across all three price points. The
opportunity to try before buying was the second ranked strategy across all three
price points and the advice of sales personnel was ranked third for those wines >
$15 per bottle. Although these results differ from the generic results, they are not
too dissimilar. This segment is one that is particularly mindful of the image
associated with drinking wine and it also purchases wines that are recommended
by significant others – respected wine journalists or friends and acquaintances
whose opinions they respect. Purchasing these recommendations negates any
social risk that might be associated with the purchase. With this background, it is
likely that the assortment of wines that would meet their particular requirements
should include those wines that have received favourable comments in the popular
wine press and relevant local newspapers. The assortment should also include
wines that have featured prominently at local or international wine shows.
94

This segment’s propensity to purchase wines recommended by others is somewhat
offset by their preference to try wines before buying them. In this way, they are
able to seek reassurance about their prospective purchases and hence alleviate
both the financial and functional risks associated with the purchase. The advice of
sales personnel ranks third for wines that cost > $15 per bottle. Although the
recommendations of sales personnel are likely to be rated below those of other
opinion leaders, their opinions are nevertheless likely to be well received by this
segment, especially if a relationship between the customer and the staff had
developed over time. Other researchers (for example, Macintosh & Lockshin,
1997) have commented on the importance of the customer-salesperson
relationship and the link to store loyalty.
5.3.2.1 Retail Implications – Segment 2
The implications for wine retailers who have customers in this segment include:
• The assortment of wines on offer that might meet this segment’s requirements
should include as many of the recent medal and trophy winners that have
received favourable publicity, that the wine retailer can justify stocking. In
many instances, these wines may be expensive and might not fit the
positioning of the particular store. It is more likely that the independent wine
stores will actively pursue this type of assortment, whereas the national chain
stores are more likely to have a limited range of wines available that meet this
criterion.
• The opportunity to taste wines before buying should be made available to this
segment. This opportunity should perhaps extend beyond the regular tastings
that are sponsored by wine companies and include impromptu tastings that
can be used to showcase a particular award winning wine or assist in
educating the customers about a particular wine or wine style. Although the
wine retailer may have to meet the expense of this exercise, it is likely that
the costs will be recouped, as this segment is in a position to spend large
amounts of money on wines that meet their needs.
• The advice of the sales staff should not be underestimated. Staff should be
well trained, not only about the wines that they sell (and all that entails), but
also in the art of building relationships with the customers. If members of this
95
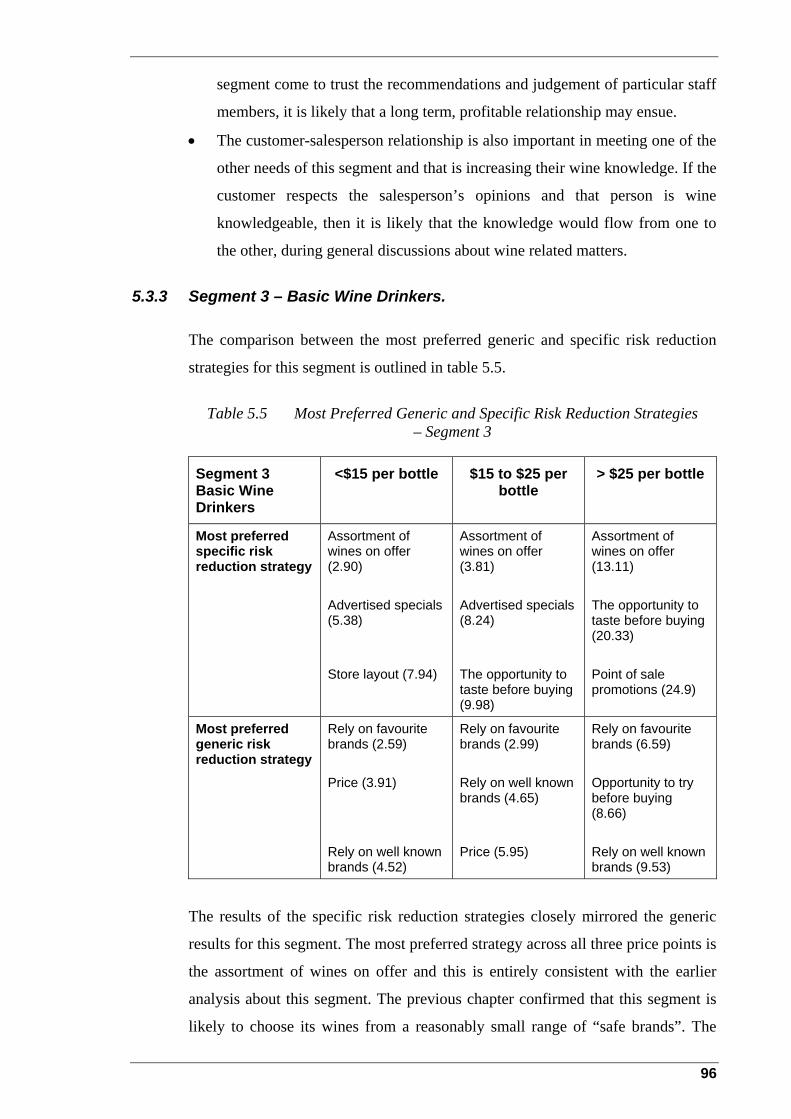
segment come to trust the recommendations and judgement of particular staff
members, it is likely that a long term, profitable relationship may ensue.
• The customer-salesperson relationship is also important in meeting one of the
other needs of this segment and that is increasing their wine knowledge. If the
customer respects the salesperson’s opinions and that person is wine
knowledgeable, then it is likely that the knowledge would flow from one to
the other, during general discussions about wine related matters.
5.3.3 Segment 3 – Basic Wine Drinkers.
The comparison between the most preferred generic and specific risk reduction
strategies for this segment is outlined in table 5.5.
Table 5.5 Most Preferred Generic and Specific Risk Reduction Strategies
– Segment 3
Segment 3 Basic Wine Drinkers
<$15 per bottle $15 to $25 per bottle
> $25 per bottle
Most preferred specific risk reduction strategy
Assortment of wines on offer (2.90) Advertised specials (5.38) Store layout (7.94)
Assortment of wines on offer (3.81) Advertised specials (8.24) The opportunity to taste before buying (9.98)
Assortment of wines on offer (13.11) The opportunity to taste before buying (20.33) Point of sale promotions (24.9)
Most preferred generic risk reduction strategy
Rely on favourite brands (2.59) Price (3.91) Rely on well known brands (4.52)
Rely on favourite brands (2.99) Rely on well known brands (4.65) Price (5.95)
Rely on favourite brands (6.59) Opportunity to try before buying (8.66) Rely on well known brands (9.53)
The results of the specific risk reduction strategies closely mirrored the generic
results for this segment. The most preferred strategy across all three price points is
the assortment of wines on offer and this is entirely consistent with the earlier
analysis about this segment. The previous chapter confirmed that this segment is
likely to choose its wines from a reasonably small range of “safe brands”. The
96

identification of the assortment of wines on offer as the preferred risk reduction
strategy confirms that previous analysis and suggests that the assortment that
meets their needs should contain their “safe brands”. The previous chapter
attempted to identify some of the brands that might be in this segment’s evoked
set and the majority of those brands identified could be considered commercial
wines made by many of the larger wine companies. These are the types of brands
that are stocked in the majority of wine retailers, regardless of their positioning or
location. It is therefore likely that all wine retailers would meet the needs of this
segment in reference to their assortment of wines.
The other results for this segment are also of interest. Whilst previous segments
have shown a reasonably narrow range of strategies in the three preferred across
each of the price ranges, the number of strategies that feature here have increased.
Advertised specials are the second ranked strategies for wines < $25 per bottle,
which is the price range where the segment does the majority of its purchasing.
This would indicate that the segment is likely to be attracted to wines from their
evoked set that are on special from time to time. Once again, this is likely to occur
on a regular basis, as the wines that they purchase are those that attract that type
of promotion. The store layout was the third ranked strategy for wines < $15 per
bottle. This suggests that the consumers in this segment enjoy the familiarity of
their local wine retailer and are able to go straight to the area in the store that
houses their preferred wines. This would negate their having to ask questions of
the sales staff and thereby revealing their (perceived) ignorance of wine. The high
weighted mean scores for the > $25 per bottle confirms that this segment does not
purchase as many wines in that range as other segments.
5.3.3.1 Implications for Retailers – Segment 3
The implications for wine retailers who have customers in this segment include:
• The range of wines should include a wide selection of the commercial wines
produced by the larger wine companies. This range should include as many of
the “safe brands” identified in the previous chapter that is consistent with the
retailer’s positioning.
• These commercial wines should be the subject of regular advertising and
promotional strategies.
97
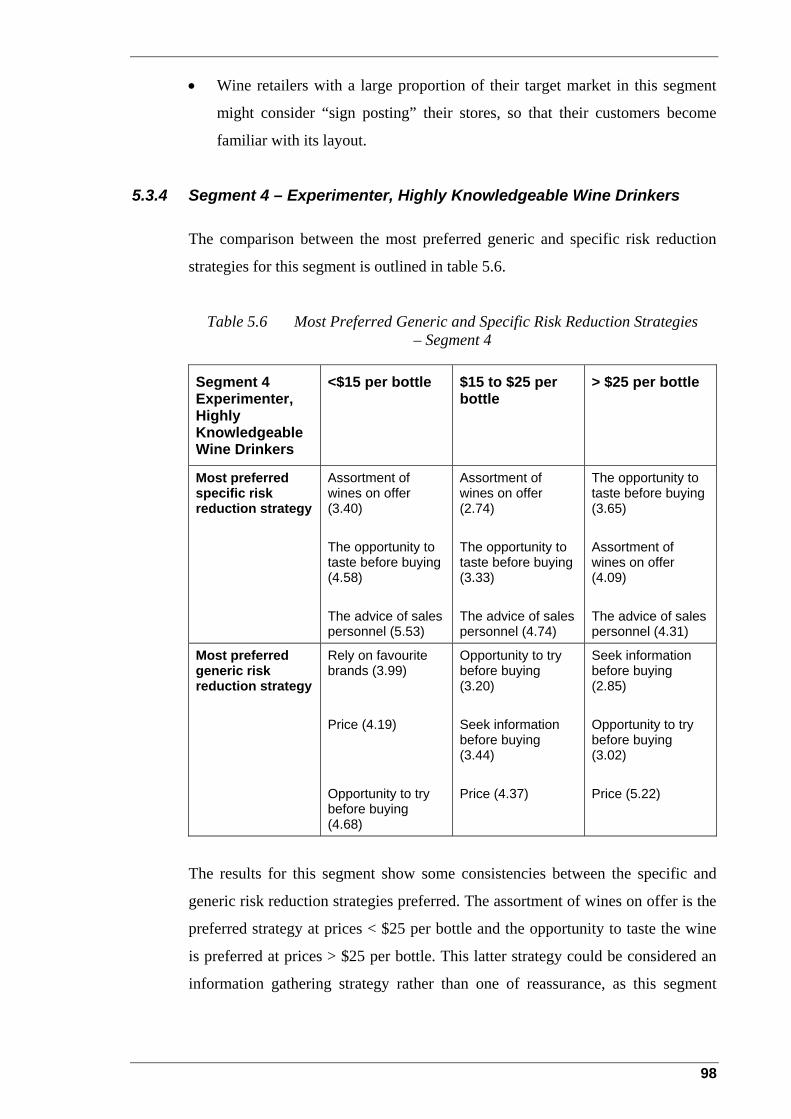
• Wine retailers with a large proportion of their target market in this segment
might consider “sign posting” their stores, so that their customers become
familiar with its layout.
5.3.4 Segment 4 – Experimenter, Highly Knowledgeable Wine Drinkers
The comparison between the most preferred generic and specific risk reduction
strategies for this segment is outlined in table 5.6.
Table 5.6 Most Preferred Generic and Specific Risk Reduction Strategies – Segment 4
Segment 4 Experimenter, Highly Knowledgeable Wine Drinkers
<$15 per bottle $15 to $25 per bottle
> $25 per bottle
Most preferred specific risk reduction strategy
Assortment of wines on offer (3.40) The opportunity to taste before buying (4.58) The advice of sales personnel (5.53)
Assortment of wines on offer (2.74) The opportunity to taste before buying (3.33) The advice of sales personnel (4.74)
The opportunity to taste before buying (3.65) Assortment of wines on offer (4.09) The advice of sales personnel (4.31)
Most preferred generic risk reduction strategy
Rely on favourite brands (3.99) Price (4.19) Opportunity to try before buying (4.68)
Opportunity to try before buying (3.20) Seek information before buying (3.44) Price (4.37)
Seek information before buying (2.85) Opportunity to try before buying (3.02) Price (5.22)
The results for this segment show some consistencies between the specific and
generic risk reduction strategies preferred. The assortment of wines on offer is the
preferred strategy at prices < $25 per bottle and the opportunity to taste the wine
is preferred at prices > $25 per bottle. This latter strategy could be considered an
information gathering strategy rather than one of reassurance, as this segment
98
displays some spontaneous wine purchase behaviour and that spontaneity is not
consistent with reassurance seeking behaviour.
This segment also displays considerable “experimenter” behaviour when
purchasing wine and that might explain the preference for the assortment of wines
as a strategy. It is conceivable that this segment looks for the more unusual or
different wines and wine styles and this is therefore reflected in their choice of
strategy – they require these unusual or different wines across all price points (the
assortment of wines is ranked second for wines > $25 per bottle). The assortment
of wines that meet their needs is likely to contain wines from boutique and small
producers that are hard to find or are not well known, or are sourced from regions
that are less well known, but have a reputation for quality products.
The advice of sales personnel was ranked third across all price points. This
segment seeks information from these staff and acts on their recommendations.
They are highly wine knowledgeable and it follows that if any relationship were
to be built between the customer and staff, the staff must be highly trained in the
more “esoteric” wine styles, regions and varieties and have knowledge of wines
from other countries.
5.3.4.1 Implications for Retailers – Segment 4
The implications for wine retailers include:
• The stocking of the types and styles of wines that are likely to appeal to this
segment may be beyond the scope of many wine retailers. It is likely that
wine retailers that position themselves as champions of boutique and smaller
producers would be in a better position to stock the types of wines that would
meet their needs. It is less likely that the national chain stores would have the
capacity to stock these types of wines on the off chance that the wines might
sell.
• The recruitment and training of staff who are able to build a long-term
relationship with this segment are crucial. The staff must be very wine
knowledgeable and be in a position to upgrade their knowledge in the same
way that this segment does. They should have the skills to intelligently
99

discuss new or different wines in a way that captures the attention of this
segment.
5.3.5 Segment 5 – Enjoyment Oriented, Social Wine Drinkers.
The comparison between the most preferred generic and specific risk reduction
strategies for this segment is outlined in table 5.7.
Table 5.7 Most Preferred Generic and Specific Risk Reduction Strategies – Segment 5
Segment 5 Enjoyment Oriented, Social Wine Drinkers
<$15 per bottle $15 to $25 per bottle
> $25 per bottle
Most preferred specific risk reduction strategy
Assortment of wines on offer (2.74) Advertised specials (4.23) The advice of sales personnel (5.17)
Assortment of wines on offer (3.93) The advice of sales personnel (7.51) Advertised specials (8.03)
Assortment of wines on offer (7.07) The advice of sales personnel (8.68) The opportunity to taste before buying (12.50)
Most preferred generic risk reduction strategy
Price (2.68) Rely on favourite brands (2.71) Rely on well known brands (4.38)
Rely on favourite brands (4.90) Price (5.46) Rely on well known brands (5.79)
Seek information before buying (6.03) Opportunity to try before buying (7.63) Rely on favourite brands (14.84)
These results indicated that the assortment of wines on offer was the most
preferred strategy of this segment across all three price points. The higher scores
for wines > $25 per bottle confirms that the majority of their purchases are made
at prices below this point. The previous analysis demonstrated that this segment
exhibits some variety and experimenter behaviours when purchasing wine. This
might explain the choice of the assortment of wines on offer as the preferred
strategy in much the same way as the previous segment. This segment wants some
different wines to the “mainstream” from which to choose. In addition, the
100
previous analysis revealed that this segment might be drawn to “concept” brands,
so it is likely that the assortment should contain a good choice of these brands.
The advice of sales personnel also featured in the three most preferred strategies
across the price points. This is also consistent with the variety and experimenter
characteristics, as they would rely heavily on that advice, as their own knowledge
is limited. Advertised specials appeared as a strategy and this is also consistent
with their behaviour. Their average purchases are at the lower end of the scale and
it is therefore likely that they would seek out discounted specials.
The implication for wine retailers include:
• The assortment on offer should contain many of the “concept” brands that are
becoming commonplace in the market. Not all wine retailers would feel
comfortable with this, as those brands and styles might not be compatible
with their own positioning. However, these wines are likely to find a place on
the shelves of the national chain retailers that are the preferred retailer for this
segment.
5.3.7 Retail Implications Summarised
A tabular summary of the retail implications for each of the segments is provided
in table 5.8. It should be noted that although the levels of customer service and the
specific skills of sales personnel were of particular importance to some segments,
these aspects of the retail mix should not be overlooked for any of the segments.
Table 5.8 Summary of Retail Implications by Segment
Segment Retail Implications
Segment 1 – Conservative, Knowledgeable Wine Drinkers.
• The assortment might include super and ultra premium wines from the four largest producers in the Australian industry (Southcorp, BRL Hardy, Beringer Blass and Orlando Wyndham).
• Regular tastings of these wines. • High level of customer service
(common to all segments).
Segment 2 – Image Oriented, Knowledge Seeking Wine Drinkers.
• The assortment of wines might include as many of the recent medal and trophy winners that have received favourable publicity.
• The opportunity to taste these wines
101
Segment Retail Implications before buying should be made available to this segment.
• Staff should be well trained, not only about the wines that they sell (and all that entails), but also in the art of building relationships with the customers (also common to all segments).
Segment 3 – Basic wine drinkers. • The assortment of wines might include a wide selection of the commercial wines produced by the larger wine companies and include identified “safe brands”.
• These commercial wines should be
the subject of regular advertising and promotional strategies.
• Wine retailers with a large proportion of their target market in this segment might consider “sign posting” their stores, so that their customers become familiar with its layout.
Segment 4 – Experimenter, Highly Knowledgeable Wine Drinkers.
• The assortment might include a number of new, innovative or hard to find wines that are perceived as exciting by this segment.
• The recruitment and training of staff who are able to build a long-term relationship with this segment are crucial. The staff must be very wine knowledgeable and be in a position to upgrade their knowledge in the same way that this segment does. They should have the skills to intelligently discuss new or different wines in a way that captures the attention of this segment.
Segment 5 – Enjoyment Oriented, Social Wine Drinkers.
• The assortment on offer might contain many of the “concept” brands that are becoming commonplace in the market.
5.4 Assortment of Wines – A Final Word
Although the preference for the assortment of wines on offer was explained by reference to
the characteristics and behaviours of each of the segments, the lack of consistency between
the preferred specific and generic risk reduction strategies was of concern. At the outset, it
was expected that there would be some correlation between the two sets of strategies, but
this did not eventuate. One explanation for this may have been that the meaning of “ the
102
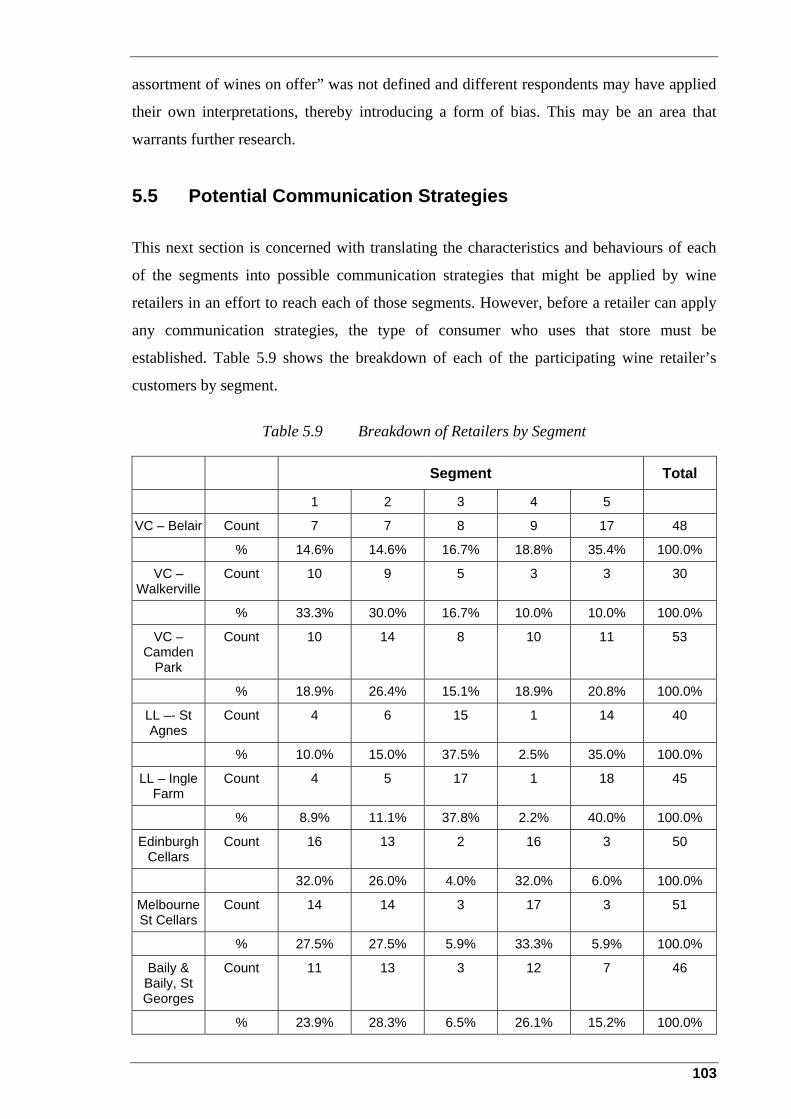
assortment of wines on offer” was not defined and different respondents may have applied
their own interpretations, thereby introducing a form of bias. This may be an area that
warrants further research.
5.5 Potential Communication Strategies
This next section is concerned with translating the characteristics and behaviours of each
of the segments into possible communication strategies that might be applied by wine
retailers in an effort to reach each of those segments. However, before a retailer can apply
any communication strategies, the type of consumer who uses that store must be
established. Table 5.9 shows the breakdown of each of the participating wine retailer’s
customers by segment.
Table 5.9 Breakdown of Retailers by Segment
Segment Total
1 2 3 4 5
VC – Belair Count 7 7 8 9 17 48
% 14.6% 14.6% 16.7% 18.8% 35.4% 100.0%
VC – Walkerville
Count 10 9 5 3 3 30
% 33.3% 30.0% 16.7% 10.0% 10.0% 100.0%
VC – Camden
Park
Count 10 14 8 10 11 53
% 18.9% 26.4% 15.1% 18.9% 20.8% 100.0%
LL –- St Agnes
Count 4 6 15 1 14 40
% 10.0% 15.0% 37.5% 2.5% 35.0% 100.0%
LL – Ingle Farm
Count 4 5 17 1 18 45
% 8.9% 11.1% 37.8% 2.2% 40.0% 100.0%
Edinburgh Cellars
Count 16 13 2 16 3 50
32.0% 26.0% 4.0% 32.0% 6.0% 100.0%
Melbourne St Cellars
Count 14 14 3 17 3 51
% 27.5% 27.5% 5.9% 33.3% 5.9% 100.0%
Baily & Baily, St Georges
Count 11 13 3 12 7 46
% 23.9% 28.3% 6.5% 26.1% 15.2% 100.0%
103

Segment Total
1 2 3 4 5
Total Count 76 81 61 69 76 363
% 20.9% 22.3% 16.8% 19.0% 20.9% 100.0% Where: VC = Vintage Cellars; LL = Liquorland Segment 1 = Conservative, wine knowledgeable wine drinkers Segment 2 = Image oriented, knowledge seeking wine drinkers Segment 3 = Basic wine drinkers Segment 4 = Experimenter, highly knowledgeable wine drinkers Segment 5 = Enjoyment oriented, social wine drinkers
This table reveals that the three stores that can be considered as independent specialist
wine retailers – Edinburgh Cellars, Melbourne Street Cellars and Baily & Baily, St
Georges all have high percentages (90%, 88.3% and 78.3% respectively) of their customer
base drawn from Segments 1, 2 and 4, the segments that are generally wine knowledgeable
and have a higher average spend per bottle than the other segments. Of the national chain
stores, the three Vintage Cellars stores have more customers drawn from these three
knowledgeable segments compared to the Liquorland stores, although Vintage Cellars at
Belair has over one third of its customers from segment 5. The two Liquorland stores each
have over 70% of their customer base drawn from segments 3 and 5. This different mix of
customer would impact on the communication strategies used by each of the stores.
The previous analysis undertaken revealed many characteristics and behaviours
attributable to each segment. These characteristics and behaviours lend themselves to
keywords or images that might attract the attention of each of these segments. If these
keywords or images were used in the context of advertising and promotion
communications, they might provide the catalyst that breaks through the clutter associated
with all messages of this type. Some suggested words, phrases and images that might
attract the attention of the various segments, if contained within communication messages,
include:
Segment 1 – Conservative, Wine Knowledgeable Wine Drinkers • Favoured by wine lovers and connoisseurs
• Traditional style of wine
• Provides satisfaction
• Images of a conservative, “gentleman’s drinking club”
Segment 2 – Image Oriented, Knowledge Seeking Wine Drinkers • As recommended by – wine writers, wine critics etc.
104

• This wine was awarded x points in the prestigious _______ wine magazine
• This wine won a trophy/gold medal at the prestigious _________ Wine Show
• This wine is favoured by __________
• As drunk by ______________
• Tutored wine tastings and expert advice available here through the auspices of well
respected wine writer and educator __________________
• Images of a group of friends at a wine tasting
Segment 3– Basic Wine Drinkers • Advertised specials and discounts should target the commercially available wines
made by Australia’s leading wine companies
• Images of sitting around a table at home, enjoying a glass of wine with food
Segment 4 – Experimenter, Highly Knowledgeable Wine Drinkers Any of the following words used when describing wines, wine styles, wine regions, grape
varieties, and viticultural or winemaking techniques:
• New
• Exciting
• Innovative
• Different
• Eclectic
In addition, they are likely to be interested in tutored and untutored wine tastings and
specialised wine tastings that introduce new regions, countries or styles of wine.
Segment 5 – Enjoyment Oriented, Social Wine Drinkers • Fun
• Enjoyment
• Exciting
• Perfect for a social drink/occasion
• Images of good times/parties or other celebrations
• Al fresco dining scenes
• Smiling, laughing images
105
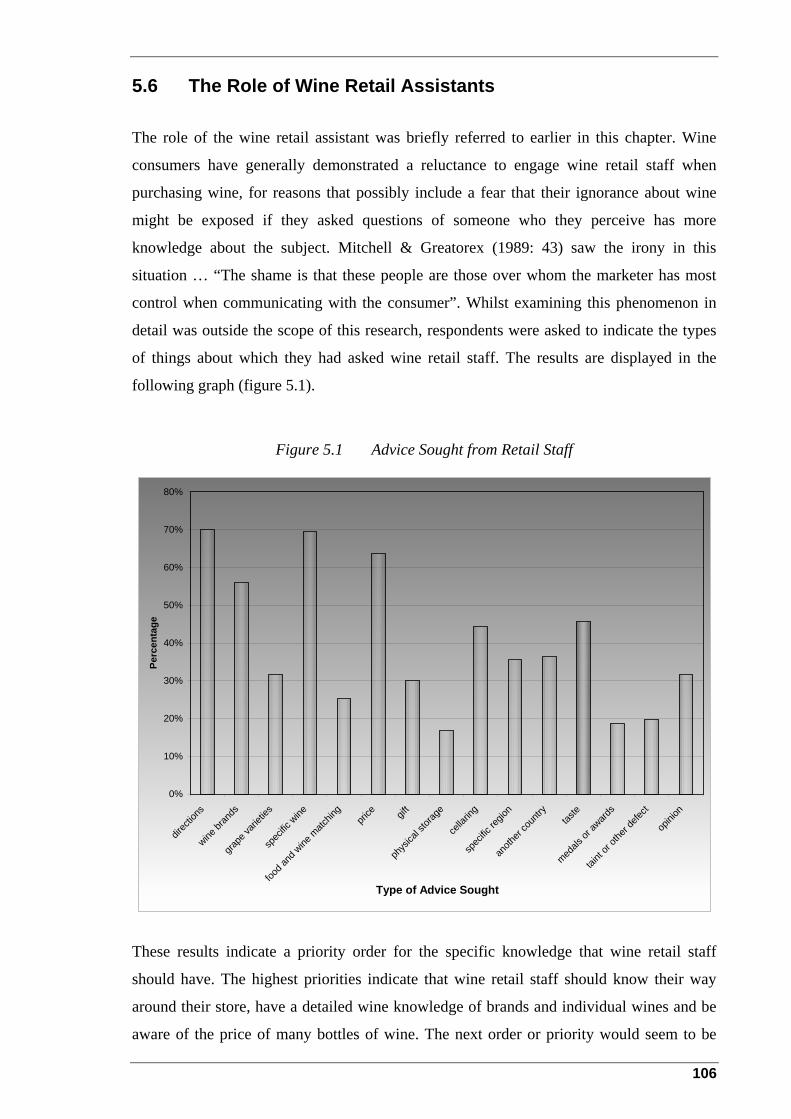
5.6 The Role of Wine Retail Assistants
The role of the wine retail assistant was briefly referred to earlier in this chapter. Wine
consumers have generally demonstrated a reluctance to engage wine retail staff when
purchasing wine, for reasons that possibly include a fear that their ignorance about wine
might be exposed if they asked questions of someone who they perceive has more
knowledge about the subject. Mitchell & Greatorex (1989: 43) saw the irony in this
situation … “The shame is that these people are those over whom the marketer has most
control when communicating with the consumer”. Whilst examining this phenomenon in
detail was outside the scope of this research, respondents were asked to indicate the types
of things about which they had asked wine retail staff. The results are displayed in the
following graph (figure 5.1).
Figure 5.1 Advice Sought from Retail Staff
0%
10%
20%
30%
40%
50%
60%
70%
80%
direc
tions
wine br
ands
grape
varie
ties
spec
ific w
ine
food a
nd w
ine m
atchin
gpri
ce
gift
phys
ical s
torag
e
cella
ring
spec
ific re
gion
anoth
er co
untry
taste
medals
or aw
ards
taint
or oth
er de
fect
opini
on
Type of Advice Sought
Perc
enta
ge
These results indicate a priority order for the specific knowledge that wine retail staff
should have. The highest priorities indicate that wine retail staff should know their way
around their store, have a detailed wine knowledge of brands and individual wines and be
aware of the price of many bottles of wine. The next order or priority would seem to be
106
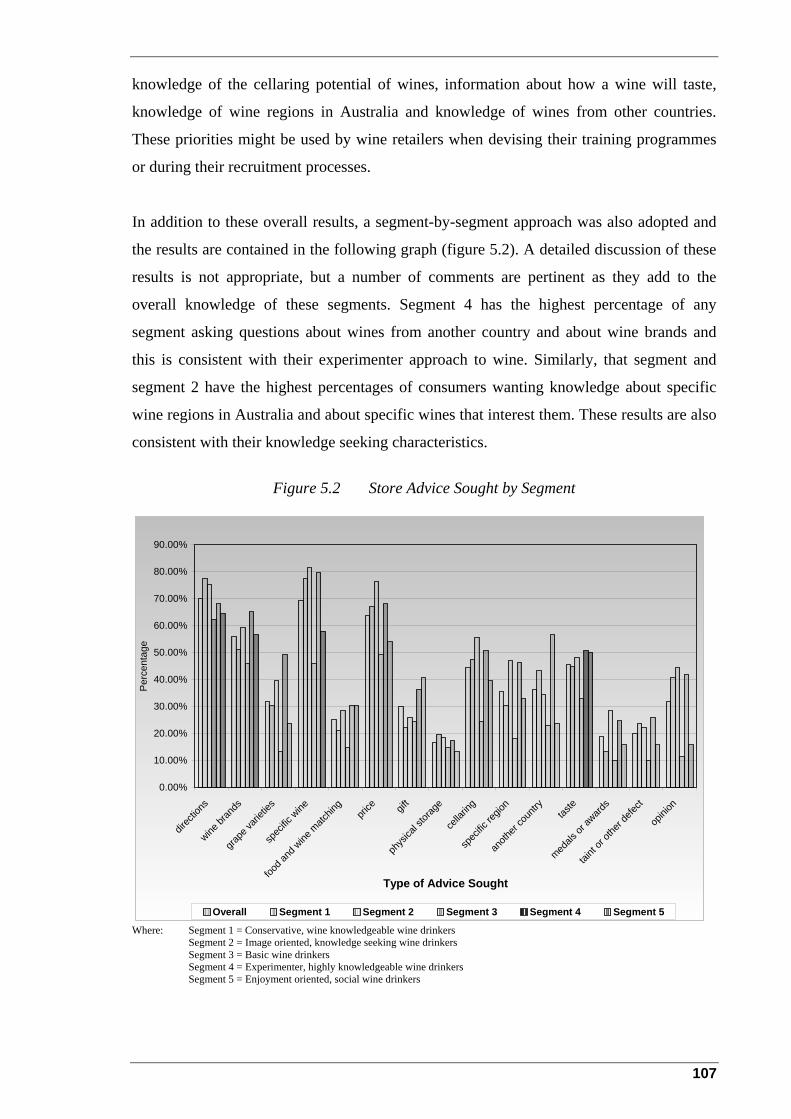
knowledge of the cellaring potential of wines, information about how a wine will taste,
knowledge of wine regions in Australia and knowledge of wines from other countries.
These priorities might be used by wine retailers when devising their training programmes
or during their recruitment processes.
In addition to these overall results, a segment-by-segment approach was also adopted and
the results are contained in the following graph (figure 5.2). A detailed discussion of these
results is not appropriate, but a number of comments are pertinent as they add to the
overall knowledge of these segments. Segment 4 has the highest percentage of any
segment asking questions about wines from another country and about wine brands and
this is consistent with their experimenter approach to wine. Similarly, that segment and
segment 2 have the highest percentages of consumers wanting knowledge about specific
wine regions in Australia and about specific wines that interest them. These results are also
consistent with their knowledge seeking characteristics.
Figure 5.2 Store Advice Sought by Segment
0.00%
10.00%
20.00%
30.00%
40.00%
50.00%
60.00%
70.00%
80.00%
90.00%
direc
tions
wine br
ands
grape
varie
ties
spec
ific w
ine
food a
nd w
ine m
atchin
gpri
ce
gift
phys
ical s
torag
e
cella
ring
spec
ific re
gion
anoth
er co
untry
taste
medals
or aw
ards
taint
or oth
er de
fect
opini
on
Type of Advice Sought
Per
cent
age
Overall Segment 1 Segment 2 Segment 3 Segment 4 Segment 5
Where: Segment 1 = Conservative, wine knowledgeable wine drinkers Segment 2 = Image oriented, knowledge seeking wine drinkers Segment 3 = Basic wine drinkers Segment 4 = Experimenter, highly knowledgeable wine drinkers Segment 5 = Enjoyment oriented, social wine drinkers
107

5.7 Conclusion
This chapter examined the preferred specific risk reduction strategies employed by each of
the five segments in the South Australian wine market. Although some correlation between
the preferred generic and specific strategies was expected, this did not materialise. The
assortment of wines on offer at the wine retailer was the most preferred strategy for the
majority of segments across most price points. However, the comparison between the
generic and specific strategies did reveal some overall consistencies.
The preference for the assortment of wines on offer was analysed against the established
behaviours and characteristics of each segment and in each instance, was found to be
consistent with those established traits. The implications for the wine retailer were also
discussed and it became clear that each store’s positioning was a crucial factor in deciding
the assortment of wines on offer. Whilst this might seem an obvious statement, it is
important if a store positioned itself as appealing to all potential consumers in the market.
A store attempting this feat might find it extremely difficult to stock an assortment of
wines that might appeal to all five segments. It is likely that the breadth and depth of wines
required to do this would be beyond the means and scope of most retailers. It is therefore
crucial that a retailer understands its market and tailors its assortment accordingly.
The chapter concluded with a brief discussion about some key words and images that
might be used in the context of advertising and promotion communications that might
attract the attention of the various segments. The priorities for the specific knowledge
expected of wine sales assistants were also identified and they might prove useful in the
recruitment and the training and development of such staff.
Chapter 6 now examines the relationship between a consumer’s wine knowledge and the
quality of wine that they consume and also provides some additional demographic and
consumption data about the market.
108
Chapter 6 Other South Australian Wine Market Perspectives
6.1 Introduction
The three preceding chapters were concerned with the three sub problems associated with
this research study and an examination of the two hypotheses that were directly related to
those sub problems. During the research process, two additional hypotheses were
developed that were directly related to the model proposed for the research and hence the
main research problem.
These hypotheses were:
• Hypothesis 2 – Consuming higher quality wine increases consumers’ knowledge and
experience of wine and that, in turn, leads to the consumption of higher quality wine;
and
• Hypothesis 3 – A consumer’s knowledge and experience of wine are antecedents to
their wine market segment.
The objective of these hypotheses was to:
• Explore the relationship between consumers’ knowledge, the identified wine-related
lifestyle segments and the consumption of higher quality wine.
These two hypotheses explore the relationship between a consumer’s wine knowledge and
the quality of the wine they consume and suggest that a consumer’s level of wine
knowledge is a strong indicator of the market segment in which they might be placed.
This chapter is therefore mainly concerned with an examination of those two hypotheses.
Although not unplanned, the research process also provided an additional rich vein of
information about the South Australian wine market and it is appropriate that this
information provides further enrichment of the knowledge field here. This information
takes the form of demographic and wine consumption situation data.
Each of the hypotheses is now discussed in detail.
109
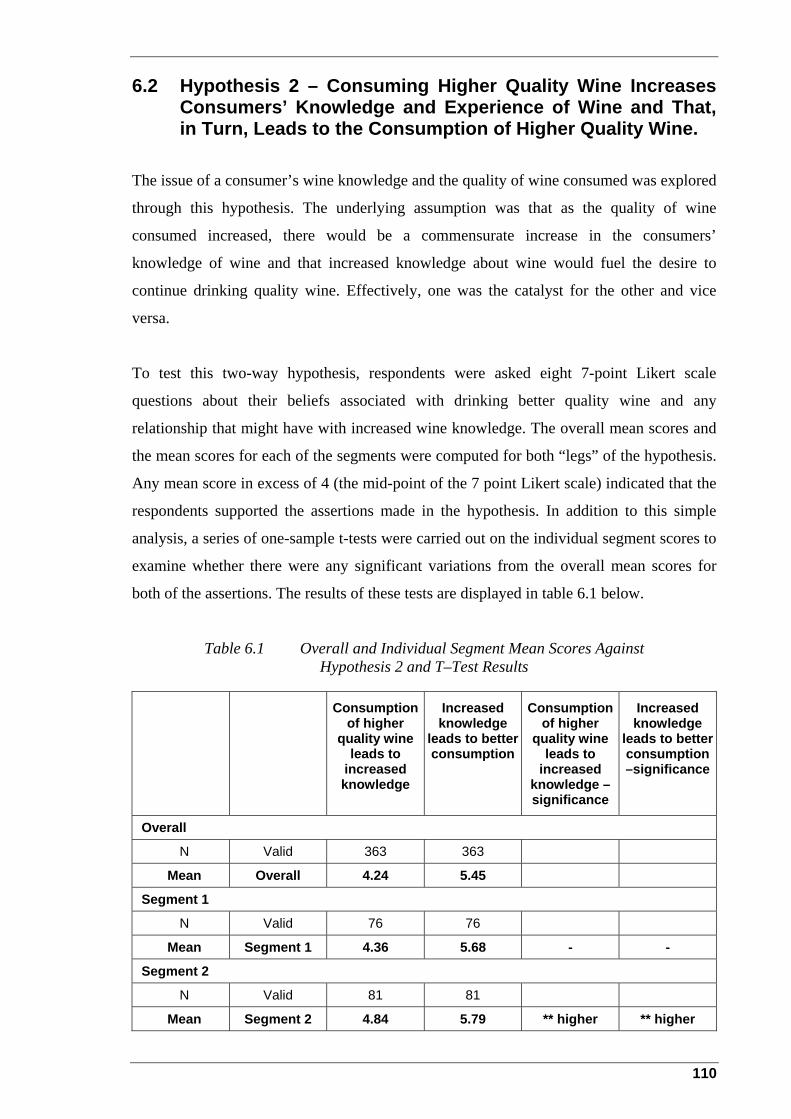
6.2 Hypothesis 2 – Consuming Higher Quality Wine Increases Consumers’ Knowledge and Experience of Wine and That, in Turn, Leads to the Consumption of Higher Quality Wine.
The issue of a consumer’s wine knowledge and the quality of wine consumed was explored
through this hypothesis. The underlying assumption was that as the quality of wine
consumed increased, there would be a commensurate increase in the consumers’
knowledge of wine and that increased knowledge about wine would fuel the desire to
continue drinking quality wine. Effectively, one was the catalyst for the other and vice
versa.
To test this two-way hypothesis, respondents were asked eight 7-point Likert scale
questions about their beliefs associated with drinking better quality wine and any
relationship that might have with increased wine knowledge. The overall mean scores and
the mean scores for each of the segments were computed for both “legs” of the hypothesis.
Any mean score in excess of 4 (the mid-point of the 7 point Likert scale) indicated that the
respondents supported the assertions made in the hypothesis. In addition to this simple
analysis, a series of one-sample t-tests were carried out on the individual segment scores to
examine whether there were any significant variations from the overall mean scores for
both of the assertions. The results of these tests are displayed in table 6.1 below.
Table 6.1 Overall and Individual Segment Mean Scores Against Hypothesis 2 and T–Test Results
Consumption of higher
quality wine leads to
increased knowledge
Increased knowledge
leads to better consumption
Consumption of higher
quality wine leads to
increased knowledge – significance
Increased knowledge
leads to better consumption –significance
Overall
N Valid 363 363
Mean Overall 4.24 5.45
Segment 1
N Valid 76 76
Mean Segment 1 4.36 5.68 - -
Segment 2
N Valid 81 81
Mean Segment 2 4.84 5.79 ** higher ** higher
110

Consumption of higher
Increased knowledge
Consumption of higher
Increased knowledge
quality wine leads to
increased knowledge
leads to better consumption
quality wine leads to
increased knowledge – significance
leads to better consumption –significance
Segment 3
N Valid 61 61
Mean Segment 3 3.28 4.54 ** lower ** lower
Segment 4
N Valid 69 69
Mean Segment 4 4.76 5.95 ** higher ** higher
Segment 5
N Valid 76 76
Mean Segment 5 3.76 5.12 ** lower * lower ** is significant at p < .01 * is significant at p < .05 - not significant
The results show that the overall mean scores for both of the assertions were greater than
4.0. These scores were 4.24 and 5.45 respectively, indicating that in the overall opinion of
the respondents:
• Consumption of higher quality wine leads to an increase in consumers’ knowledge
(and experience) about wine; and
• The increased knowledge about wine brought about by drinking higher quality wine is
a driver for consumers maintaining consumption of quality wines.
As a result of these findings, the hypothesis is supported. However, an analysis of the
segment-by-segment results reveals that this support was not unanimous. From previous
analysis it is known that segments 1, 2 and 4 consume more expensive wine and it is
generally well accepted that in the absence of any other indicators, price is a substitute for
quality (for example, Gluckman, 1990; Mitchell & Greatorex, 1989). Table 6.1 indicated
that these three segments returned higher mean scores than the overall mean on both
assertions. On the surface, it therefore appeared that the three segments that consumed the
more expensive wine were unanimous in their support for the hypothesis. The simple t-
tests applied to the means revealed that segments 2 and 4 had significantly higher scores
(at p < .01) than both overall means and that segment 1’s scores on both criteria were not
significantly higher than the overall mean scores. This would indicate guarded support
111
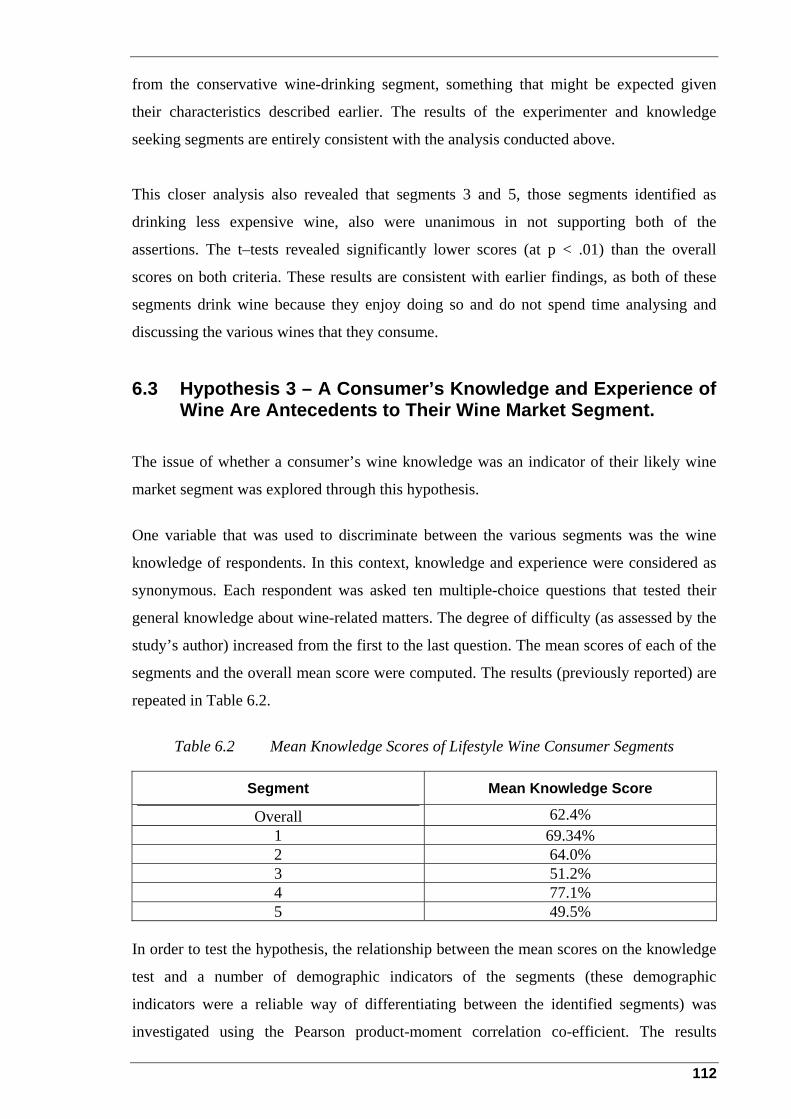
from the conservative wine-drinking segment, something that might be expected given
their characteristics described earlier. The results of the experimenter and knowledge
seeking segments are entirely consistent with the analysis conducted above.
This closer analysis also revealed that segments 3 and 5, those segments identified as
drinking less expensive wine, also were unanimous in not supporting both of the
assertions. The t–tests revealed significantly lower scores (at p < .01) than the overall
scores on both criteria. These results are consistent with earlier findings, as both of these
segments drink wine because they enjoy doing so and do not spend time analysing and
discussing the various wines that they consume.
6.3 Hypothesis 3 – A Consumer’s Knowledge and Experience of Wine Are Antecedents to Their Wine Market Segment.
The issue of whether a consumer’s wine knowledge was an indicator of their likely wine
market segment was explored through this hypothesis.
One variable that was used to discriminate between the various segments was the wine
knowledge of respondents. In this context, knowledge and experience were considered as
synonymous. Each respondent was asked ten multiple-choice questions that tested their
general knowledge about wine-related matters. The degree of difficulty (as assessed by the
study’s author) increased from the first to the last question. The mean scores of each of the
segments and the overall mean score were computed. The results (previously reported) are
repeated in Table 6.2.
Table 6.2 Mean Knowledge Scores of Lifestyle Wine Consumer Segments
Segment Mean Knowledge Score
Overall 62.4% 1 69.34% 2 64.0% 3 51.2% 4 77.1% 5 49.5%
In order to test the hypothesis, the relationship between the mean scores on the knowledge
test and a number of demographic indicators of the segments (these demographic
indicators were a reliable way of differentiating between the identified segments) was
investigated using the Pearson product-moment correlation co-efficient. The results
112
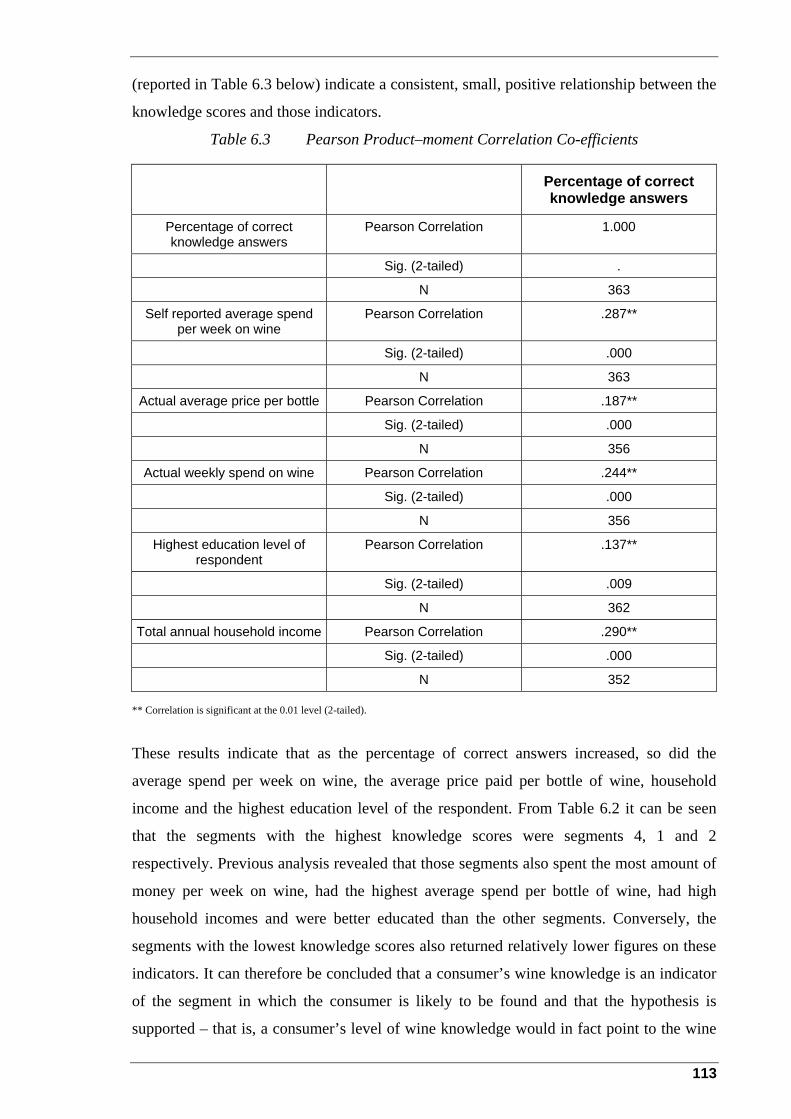
(reported in Table 6.3 below) indicate a consistent, small, positive relationship between the
knowledge scores and those indicators.
Table 6.3 Pearson Product–moment Correlation Co-efficients
Percentage of correct knowledge answers
Percentage of correct knowledge answers
Pearson Correlation 1.000
Sig. (2-tailed) .
N 363
Self reported average spend per week on wine
Pearson Correlation .287**
Sig. (2-tailed) .000
N 363
Actual average price per bottle Pearson Correlation .187**
Sig. (2-tailed) .000
N 356
Actual weekly spend on wine Pearson Correlation .244**
Sig. (2-tailed) .000
N 356
Highest education level of respondent
Pearson Correlation .137**
Sig. (2-tailed) .009
N 362
Total annual household income Pearson Correlation .290**
Sig. (2-tailed) .000
N 352 ** Correlation is significant at the 0.01 level (2-tailed).
These results indicate that as the percentage of correct answers increased, so did the
average spend per week on wine, the average price paid per bottle of wine, household
income and the highest education level of the respondent. From Table 6.2 it can be seen
that the segments with the highest knowledge scores were segments 4, 1 and 2
respectively. Previous analysis revealed that those segments also spent the most amount of
money per week on wine, had the highest average spend per bottle of wine, had high
household incomes and were better educated than the other segments. Conversely, the
segments with the lowest knowledge scores also returned relatively lower figures on these
indicators. It can therefore be concluded that a consumer’s wine knowledge is an indicator
of the segment in which the consumer is likely to be found and that the hypothesis is
supported – that is, a consumer’s level of wine knowledge would in fact point to the wine
113
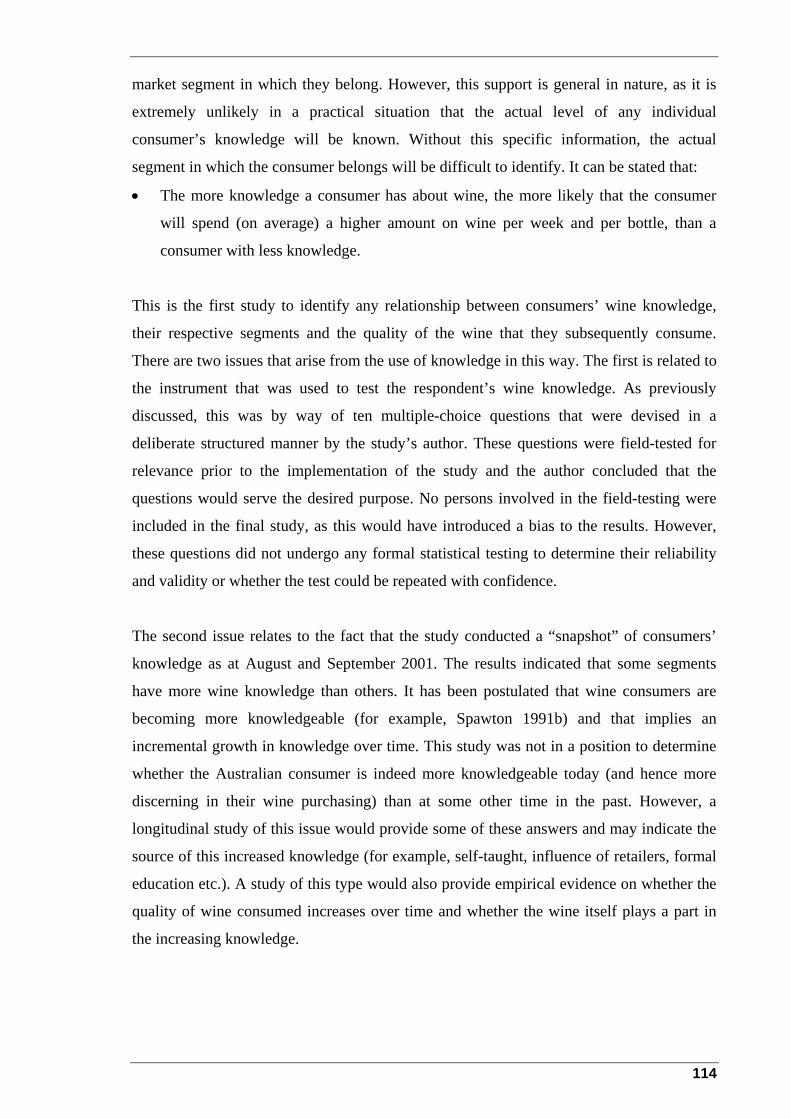
market segment in which they belong. However, this support is general in nature, as it is
extremely unlikely in a practical situation that the actual level of any individual
consumer’s knowledge will be known. Without this specific information, the actual
segment in which the consumer belongs will be difficult to identify. It can be stated that:
• The more knowledge a consumer has about wine, the more likely that the consumer
will spend (on average) a higher amount on wine per week and per bottle, than a
consumer with less knowledge.
This is the first study to identify any relationship between consumers’ wine knowledge,
their respective segments and the quality of the wine that they subsequently consume.
There are two issues that arise from the use of knowledge in this way. The first is related to
the instrument that was used to test the respondent’s wine knowledge. As previously
discussed, this was by way of ten multiple-choice questions that were devised in a
deliberate structured manner by the study’s author. These questions were field-tested for
relevance prior to the implementation of the study and the author concluded that the
questions would serve the desired purpose. No persons involved in the field-testing were
included in the final study, as this would have introduced a bias to the results. However,
these questions did not undergo any formal statistical testing to determine their reliability
and validity or whether the test could be repeated with confidence.
The second issue relates to the fact that the study conducted a “snapshot” of consumers’
knowledge as at August and September 2001. The results indicated that some segments
have more wine knowledge than others. It has been postulated that wine consumers are
becoming more knowledgeable (for example, Spawton 1991b) and that implies an
incremental growth in knowledge over time. This study was not in a position to determine
whether the Australian consumer is indeed more knowledgeable today (and hence more
discerning in their wine purchasing) than at some other time in the past. However, a
longitudinal study of this issue would provide some of these answers and may indicate the
source of this increased knowledge (for example, self-taught, influence of retailers, formal
education etc.). A study of this type would also provide empirical evidence on whether the
quality of wine consumed increases over time and whether the wine itself plays a part in
the increasing knowledge.
114
Therefore, the contribution of the “knowledge-test” lies not only with the perspectives it
brought, but in that it set a benchmark from which further research in this regard could be
conducted.
6.4 Quality of Wine Consumed – A Further Discussion
A final research analysis was carried out in relation to the quality issue. Respondents were
asked whether the quality of wine that they now consumed had changed over the past two
years and their responses were limited to:
• Improved
• Stayed more or less the same; or
• Decreased
The results of this question were analysed using a straightforward percentage of
respondents that answered each question. The results are displayed in Table 6.4.
Table 6.4 Quality Improvement Over the Past 2 Years
Quality Frequency Percent (%)
Overall Improved 209 57.58
Stayed more or less the same 152 41.87
Decreased 2 0.55
Segment 1 Improved 41 53.95
Stayed more or less the same 34 44.74
Decreased 1 1.32
Segment 2 Improved 49 60.49
Stayed more or less the same 32 39.51
Segment 3 Improved 32 52.46
Stayed more or less the same 29 47.54
Segment 4 Improved 46 66.67
Stayed more or less the same 23 33.33
Segment 5 Improved 41 53.95
Stayed more or less the same 34 44.74
Decreased 1 1.32 Where: Segment 1 = Conservative, wine knowledgeable wine drinkers Segment 2 = Image oriented, knowledge seeking wine drinkers Segment 3 = Basic wine drinkers Segment 4 = Experimenter, highly knowledgeable wine drinkers Segment 5 = Enjoyment oriented, social wine drinkers.
The results indicated that about 58% of respondents felt that the quality of the wine that
they consumed had improved over the past two years. Interestingly, three segments’
115

“improved” percentages were below this overall figure. Segments 3 and 5, as the two
segments at the lower-end of the average price per bottle spend, were ‘expected’ to have
this result. It confirmed that many of the consumers in those segments had not improved
the quality of the wine they had consumed. The result for segment 1, the conservative
consumers, was a little more surprising. As 54% indicated that their quality of wine had
improved, this meant that 46% felt that the quality had stayed the same or decreased.
However, this is consistent with the earlier analysis that revealed that many of these
consumers tended to purchase wines of a similar style. It would tend to indicate that they
purchase the same brands, year after year (although they may purchase a great many
brands) and that their cellars are made up of “vertical” tastings of these brands. They
would therefore possibly consider that the quality of their wines has not necessarily
improved over time. This same argument might also be relevant for segment 3 consumers,
as they were previously shown to purchase their wines from a relatively small series of
safe brands.
The results for segments 2 and 4 are also entirely consistent with the earlier analysis. These
two segments are actively seeking to upgrade their knowledge (albeit, from segment 4’s
already high base) and they both exhibited purchasing behaviour that indicated a
preference for trying wines that they have not tried before. In the case of segment 2, these
wines were recommended by wine writers or other opinion leaders and for segment 4,
recommended by sales staff or via their own research. Although there was nothing to
indicate that the experimenters would try less expensive wine, it is likely that both
segments, through their purchasing behaviour, have increased the general quality of the
wine that they consume.
Those respondents who indicated that the quality of the wine they now consumed had
improved were then asked to indicate the reasons why that had occurred and to rank their
answers in order of importance. The format of the question posed in the survey can be
found at Section 6 of Appendix 1. The opportunity to provide other reasons was afforded
to respondents and 25, or 6.9% of respondents did so. 44% of these respondents indicated
that a higher disposable income was the reason behind the increase in quality. Other
reasons provided included:
• Wine making techniques had improved;
• Overseas travel had broadened their horizons; and
• Cellaring of wine enabled the consumption of better wine.
116
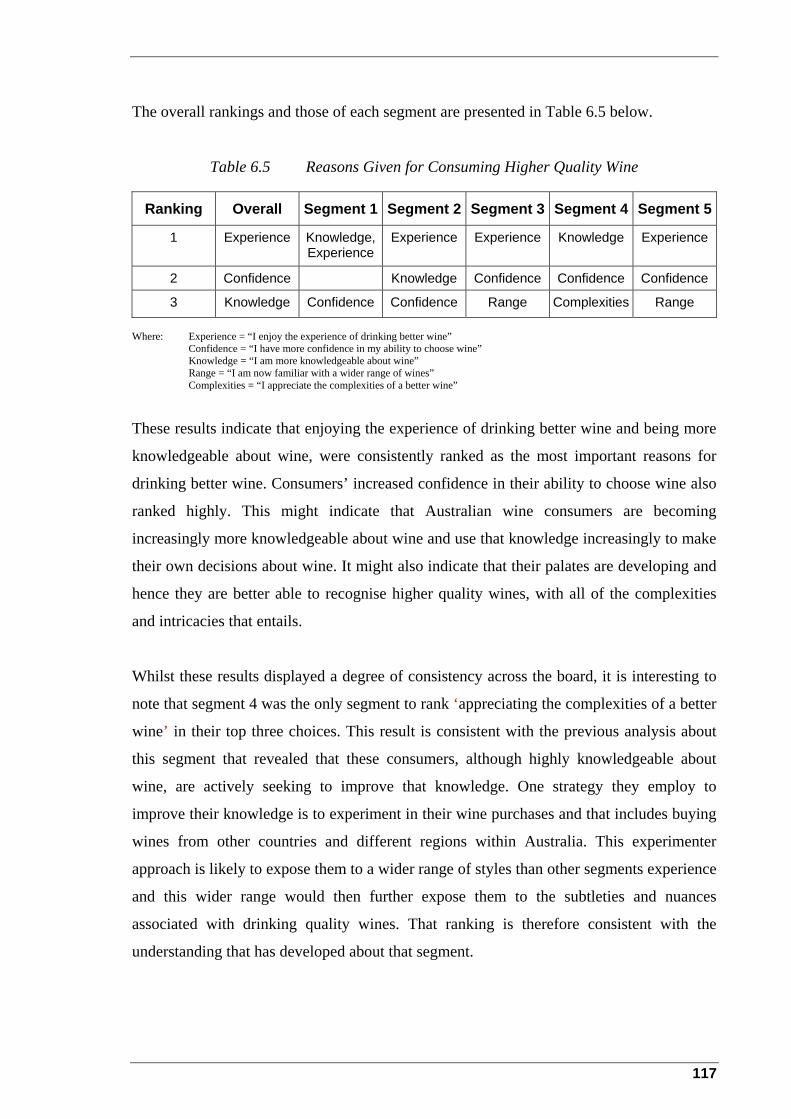
The overall rankings and those of each segment are presented in Table 6.5 below.
Table 6.5 Reasons Given for Consuming Higher Quality Wine
Ranking Overall Segment 1 Segment 2 Segment 3 Segment 4 Segment 5
1 Experience Knowledge, Experience
Experience Experience Knowledge Experience
2 Confidence Knowledge Confidence Confidence Confidence
3 Knowledge Confidence Confidence Range Complexities Range Where: Experience = “I enjoy the experience of drinking better wine” Confidence = “I have more confidence in my ability to choose wine” Knowledge = “I am more knowledgeable about wine” Range = “I am now familiar with a wider range of wines” Complexities = “I appreciate the complexities of a better wine”
These results indicate that enjoying the experience of drinking better wine and being more
knowledgeable about wine, were consistently ranked as the most important reasons for
drinking better wine. Consumers’ increased confidence in their ability to choose wine also
ranked highly. This might indicate that Australian wine consumers are becoming
increasingly more knowledgeable about wine and use that knowledge increasingly to make
their own decisions about wine. It might also indicate that their palates are developing and
hence they are better able to recognise higher quality wines, with all of the complexities
and intricacies that entails.
Whilst these results displayed a degree of consistency across the board, it is interesting to
note that segment 4 was the only segment to rank ‘appreciating the complexities of a better
wine’ in their top three choices. This result is consistent with the previous analysis about
this segment that revealed that these consumers, although highly knowledgeable about
wine, are actively seeking to improve that knowledge. One strategy they employ to
improve their knowledge is to experiment in their wine purchases and that includes buying
wines from other countries and different regions within Australia. This experimenter
approach is likely to expose them to a wider range of styles than other segments experience
and this wider range would then further expose them to the subtleties and nuances
associated with drinking quality wines. That ranking is therefore consistent with the
understanding that has developed about that segment.
117

6.5 Demographic and Consumption Data
The following section outlines, in a series of figures in the form of charts and graphs, some
key demographic and consumption information about the study’s respondents.
6.5.1 Age of Respondents
Figure 6.1 Age of Respondents
Age of Respondent
over 6555 to 6545 to 5435 to 4425 to 3418 to 24
Per
cent
40
30
20
10
0
The median age of respondents was in the 45 to 54 year age group.
118

6.5.2 Gender of Respondents
Figure 6.2 Gender of Respondents
Gender of respondent
malefemale
Per
cent
70
60
50
40
30
20
10
0
Figure 6.2 indicates that 35.3% of the respondents were female and 64.7% were
males. This does not mean that the South Australian wine market can be described
as having this female/male ratio. What can be said with confidence is that of the
population who actually buy wine, 35.3% are female and 64.7% are male. The
data that was collected allowed some analysis of the proportion of wine consumed
by males and females. This data is outlined in the following table:
Table 6.6 Wine Consumption by Gender
N Total glasses/wk
Ave Glasses/wk % of wine consumed
Female 128 1207 9.4258 27.2%
Male 235 3237 13.7745 72.8%
Table 6.6 indicates that although females account for 35.3% of purchasers of
wine, the amount that they actually consume is 27.2%. Consequently it can be
deduced that in some cases (about 8%) females’ role in the wine purchase process
is simply that – procurement of the product, not consumption thereof.
119
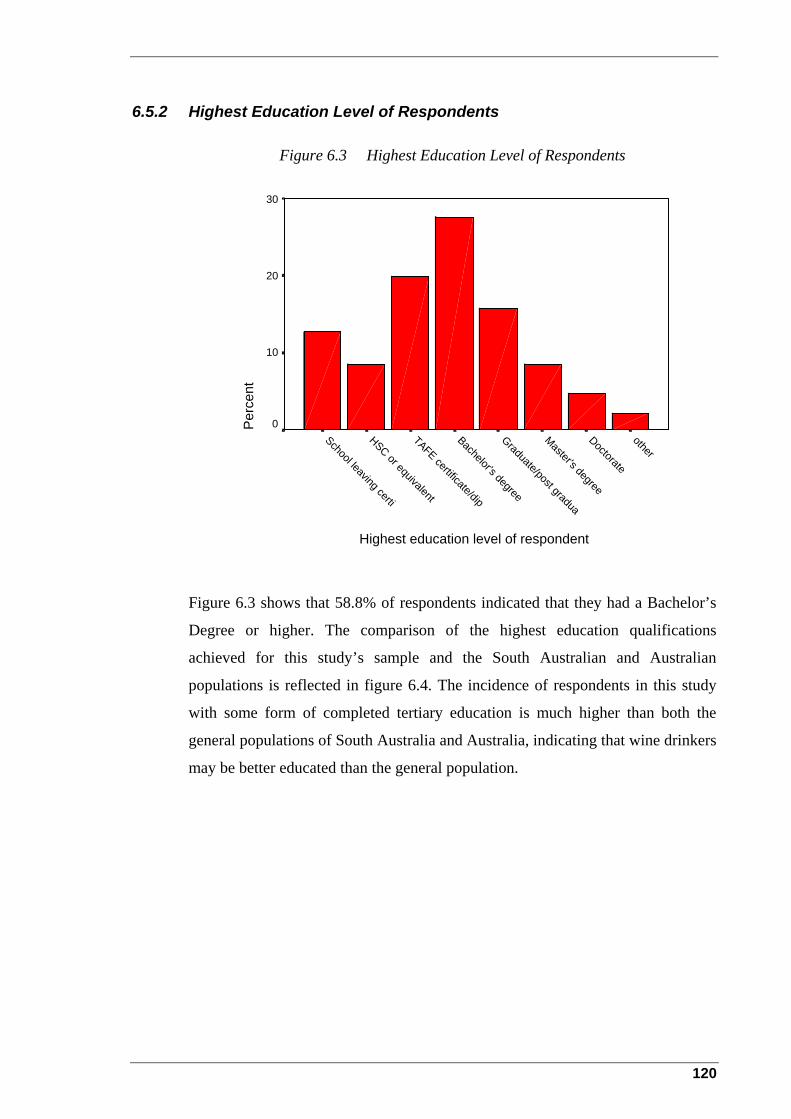
6.5.2 Highest Education Level of Respondents
Figure 6.3 Highest Education Level of Respondents
Highest education level of respondent
otherDoctorate
Master's degree
Graduate/post gradua
Bachelor's degree
TAFE certificate/dip
HSC or equivalent
School leaving certi
Per
cent
30
20
10
0
Figure 6.3 shows that 58.8% of respondents indicated that they had a Bachelor’s
Degree or higher. The comparison of the highest education qualifications
achieved for this study’s sample and the South Australian and Australian
populations is reflected in figure 6.4. The incidence of respondents in this study
with some form of completed tertiary education is much higher than both the
general populations of South Australia and Australia, indicating that wine drinkers
may be better educated than the general population.
120

Figure 6.4 Highest Education Level – A Comparison
0.00%
5.00%
10.00%
15.00%
20.00%
25.00%
30.00%
Bachelor's degree Graduate/post graduate diploma Higher Degree
This study SA Aus
Source: Australian Bureau of Statistics 1996 Census Data Where: SA = South Australia, Aus = Australia
6.5.4 Total Household Income of Respondents
Figure 6.5 Total Annual Household Income
Total annual household income
> $100,000$75,000 to $100,000
$50,000 to $75,000$25,000 to $50,000
< $25,000
Per
cent
30
20
10
0
This chart indicates that the total annual household income of respondents was
very evenly spread between the four class intervals representing incomes >
$25,000 per annum. 25% of respondents reported a household income > $100,000
per annum.
121
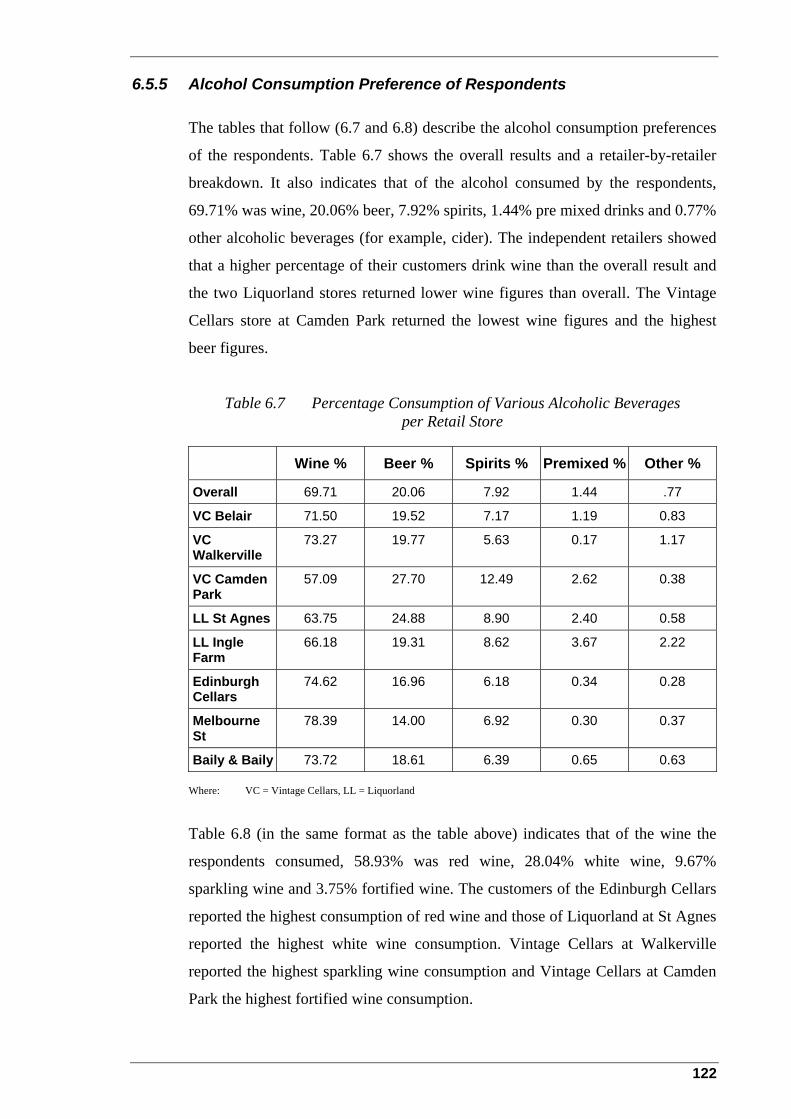
6.5.5 Alcohol Consumption Preference of Respondents
The tables that follow (6.7 and 6.8) describe the alcohol consumption preferences
of the respondents. Table 6.7 shows the overall results and a retailer-by-retailer
breakdown. It also indicates that of the alcohol consumed by the respondents,
69.71% was wine, 20.06% beer, 7.92% spirits, 1.44% pre mixed drinks and 0.77%
other alcoholic beverages (for example, cider). The independent retailers showed
that a higher percentage of their customers drink wine than the overall result and
the two Liquorland stores returned lower wine figures than overall. The Vintage
Cellars store at Camden Park returned the lowest wine figures and the highest
beer figures.
Table 6.7 Percentage Consumption of Various Alcoholic Beverages per Retail Store
Wine % Beer % Spirits % Premixed % Other %
Overall 69.71 20.06 7.92 1.44 .77
VC Belair 71.50 19.52 7.17 1.19 0.83
VC Walkerville
73.27 19.77 5.63 0.17 1.17
VC Camden Park
57.09 27.70 12.49 2.62 0.38
LL St Agnes 63.75 24.88 8.90 2.40 0.58
LL Ingle Farm
66.18 19.31 8.62 3.67 2.22
Edinburgh Cellars
74.62 16.96 6.18 0.34 0.28
Melbourne St
78.39 14.00 6.92 0.30 0.37
Baily & Baily 73.72 18.61 6.39 0.65 0.63 Where: VC = Vintage Cellars, LL = Liquorland
Table 6.8 (in the same format as the table above) indicates that of the wine the
respondents consumed, 58.93% was red wine, 28.04% white wine, 9.67%
sparkling wine and 3.75% fortified wine. The customers of the Edinburgh Cellars
reported the highest consumption of red wine and those of Liquorland at St Agnes
reported the highest white wine consumption. Vintage Cellars at Walkerville
reported the highest sparkling wine consumption and Vintage Cellars at Camden
Park the highest fortified wine consumption.
122
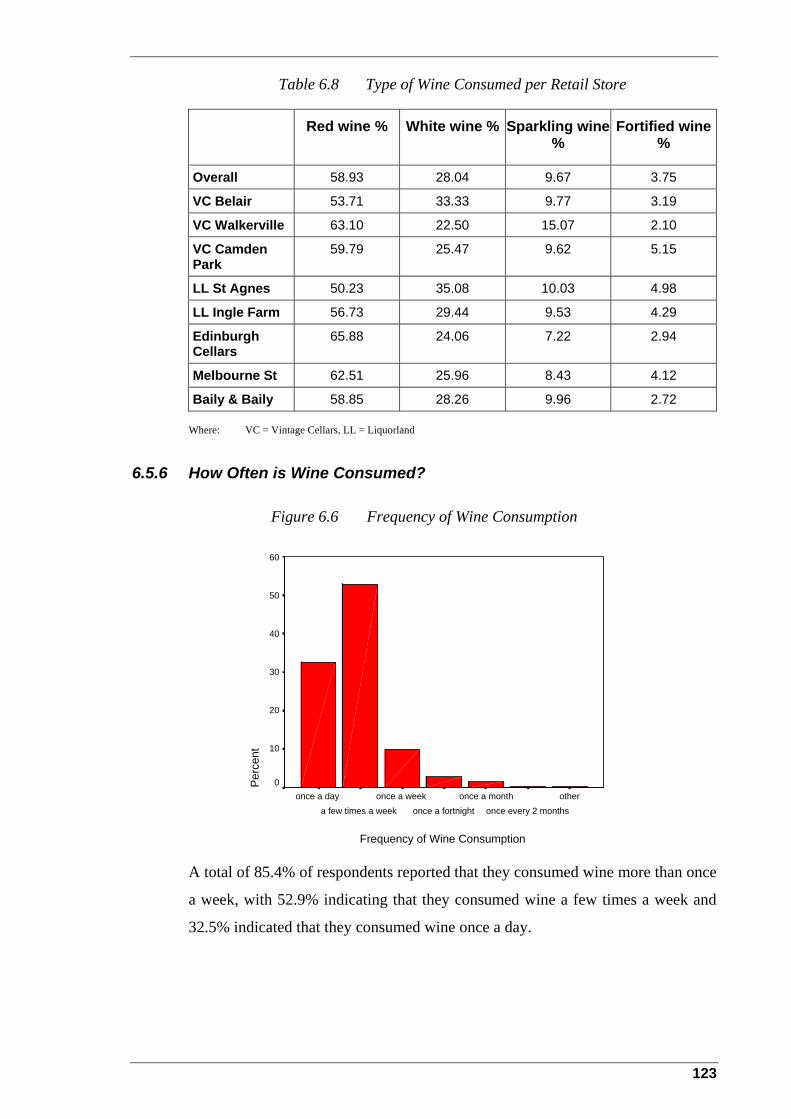
Table 6.8 Type of Wine Consumed per Retail Store
Red wine % White wine % Sparkling wine %
Fortified wine %
Overall 58.93 28.04 9.67 3.75
VC Belair 53.71 33.33 9.77 3.19
VC Walkerville 63.10 22.50 15.07 2.10
VC Camden Park
59.79 25.47 9.62 5.15
LL St Agnes 50.23 35.08 10.03 4.98
LL Ingle Farm 56.73 29.44 9.53 4.29
Edinburgh Cellars
65.88 24.06 7.22 2.94
Melbourne St 62.51 25.96 8.43 4.12
Baily & Baily 58.85 28.26 9.96 2.72
Where: VC = Vintage Cellars, LL = Liquorland
6.5.6 How Often is Wine Consumed?
Figure 6.6 Frequency of Wine Consumption
Frequency of Wine Consumption
otheronce every 2 months
once a monthonce a fortnight
once a weeka few times a week
once a day
Perc
ent
60
50
40
30
20
10
0
A total of 85.4% of respondents reported that they consumed wine more than once
a week, with 52.9% indicating that they consumed wine a few times a week and
32.5% indicated that they consumed wine once a day.
123
6.5.7 Cellaring of Wine
As part of the data collection exercise, respondents were asked to indicate, on
average, how long it would be before the wine that was purchased on the day that
the survey was conducted, would be drunk. The results are reproduced in the
following table (6.9) and indicate that the average length of time between
purchase and consumption was 512 days or 1.4 years and that the median length
of time was 90 days (in this instance, the median is the better indicator, as the
effects of any outlying data are negated). This result was contrary to
“conventional wine retail industry wisdom”, where the belief is that a very high
percentage of wine is consumed within twenty-four hours of purchase. These
results would indicate that there is an element of “cellaring” wine in the market
and that this element is of considerable extent. This data might also indicate that a
large percentage of wine purchases are occasion-driven, indicating that is there is
a clear purpose when purchasing wine takes place.
Table 6.9 Period Within Which Wine will be Consumed
Mean (days) Mean (years) Median (days)
Overall 512.01 1.40 90
Segment 1 964.38 2.64 730
Segment 2 707.6 1.94 365
Segment 3 115.07 0.32 14
Segment 4 584.9 1.60 180
Segment 5 103.59 0.28 8.5 Where: Segment 1 = Conservative, wine knowledgeable wine drinkers Segment 2 = Image oriented, knowledge seeking wine drinkers Segment 3 = Basic wine drinkers Segment 4 = Experimenter, highly knowledgeable wine drinkers Segment 5 = Enjoyment oriented, social wine drinkers
The results by segment are also consistent with the previous analysis performed
on each segment. Segment 1, the conservative, traditional consumer has both the
longest mean and median time periods over which their wine is kept. Segment 2,
the consumer who aims to become a “connoisseur” of fine wine, has the second
longest time period. Segments 3 and 5 are the segments that have little time for
the rituals associated with wine drinking, including the cellaring of wine and this
is reflected in their respective mean and median scores. In this instance, their
median scores are closer to the “conventional wisdom” alluded to above. Segment
124
4 does cellar the wine that it purchases, but not for the same length of time as the
other comparable segments. This might indicate some impatience on behalf of this
consumer, who may be very keen to try a wine that they have purchased, or are
keen to share it with a friend.
However, these figures do not provide the industry with some information that it
might find of interest. They do not reveal the types of wines that are cellared by
each of the segments, nor the percentage of wines that are purchased specifically
for cellaring. This information may be of interest when devising advertising and
promotion strategies and may be used to influence individual consumer’s
purchasing behaviour.
6.6 Wine Consumption Occasions
The study collected data on the occasions during which wine was consumed. Respondents
were asked to nominate from a list provided, the occasions during which they drank wine
and then rank those occasions to indicate the occasions during which they most often drank
wine (as opposed to drank the most wine). A ranking of one therefore indicated that wine
was consumed most often during that occasion. A weighted mean score was then computed
for each of the listed occasions and the occasion with the lowest weighted mean score was
the one during which wine was consumed most often. The results of the three highest
ranking occasions overall and for each of the segments are described in Table 6.10 below
(weighted mean scores are in brackets).
Table 6.10 Wine Consumption Occasions – Rankings
Rank Overall Segment 1 Segment 2 Segment 3 Segment 4 Segment 5
1 Meal with friends (2.47)
Meal with family (2.47)
Meal with friends (2.61)
Meal with friends (2.63)
Meal with friends (2.23)
Meal with friends (2.29)
2 Meal with family (2.71)
Meal with friends (2.58)
Meal with family (2.71)
Meal with family (2.78)
Meal with family (2.69)
Meal with family (2.92)
3 Party or celebration
(5.21)
Party or celebration
(5.97)
Party or celebration
(4.91)
Party or celebration
(4.78)
With friends no meal (5.13)
Party or celebration
(4.58)
These results show a remarkable consistency between the overall results and across all
segments. “Drinking wine whilst eating a meal with friends” was the occasion where wine
was most often consumed. The only segment that did not rank that as number one was
125
segment 1, which ranked “drinking wine whilst eating a meal with family” as number one.
Although this result may appear to be contradictory, this segment is more conservative in
nature than other segments and they may consider that “drinking wine with the evening
meal” is a tradition that should be followed. All other segments ranked “drinking wine
with a meal with friends” as number one. This reinforces the consideration that wine is
very much a part of many consumers’ social behaviour and is something that is shared with
their friends. The fact that “drinking wine with a meal with the family” is number two also
reinforces that and indicates that wine drinking is very much a part of the meal ritual. The
only segment that did not rate “drinking wine at a party or other celebration” at number
three was segment 4, who had “drinking wine with friends” in that position. This result is
somewhat consistent with the earlier analysis, as that segment enjoys experimenting and
trying different types and styles of wine. It may be that as part of their desire to increase
their knowledge, they share wine with friends who have similar likes and interests and that
they use this occasion as another way of increasing their wine knowledge. The remainder
of the segments ranked “drinking wine at parties and other celebrations” as number three.
The accepted wisdom is that champagne or other sparkling wine is the drink of choice
when celebrating something special. This result may indicate that other wine styles are
gaining acceptance as the beverage of choice at parties etc. perhaps at the expense of more
traditional beverages like beer or spirits.
Another important issue that arises from the identification of having a meal with friends as
the occasion when wine is most often consumed, is the use of such an image in advertising
and promotion communications. As all segments have a strong identification with that
occasion, any corresponding message is likely to be well received by most consumers in
the market.
6.7 Conclusion
This chapter has introduced the relationship between consumers’ wine knowledge, their
wine market segment and the quality of the wine they consumed. This was the first time
that this relationship has been explored in a study of this type. Although the techniques
used in this research were rudimentary, the results indicated that the level of a consumer’s
wine knowledge was a good indicator of the segment in which they should be found and
also an indicator of the amount of money they would spend on wine in a given period of
time.
126

The research further indicated that there is a relationship between the quality of wine
consumed and the level of the consumer’s wine knowledge. As consumers drink better
quality wine, their level of knowledge is likely to increase and with that increased
knowledge comes a desire to maintain consumption of a better quality wine.
This chapter provided additional demographic and consumption data about the South
Australian wine market that has also added to the understanding of that market. The last
chapter in this dissertation summarises the research study.
127

Chapter 7 Conclusions and Recommendations
7.1 Introduction
This research study was made possible by the author being granted the Liquorland/Vintage
Cellars Retail Management Scholarship for 2001 and that accounts for both the wine retail
focus and the choice of five of the wine retail stores that participated in the study.
This retail focus aimed to provide wine retailers and other interested parties in the wine
industry with information, that if implemented and acted upon, might attract increased
wine sales in the Australian domestic wine market. The current growth in that market can
be described as “sluggish”, at only about 2% per annum. Although the Australian wine
industry has achieved spectacular success in export markets, it cannot ignore its domestic
market. This is especially so in the wake of the terrorist attacks in the United States of
September 11, 2001 (and at the time of writing, the impact of those events on the United
States market in particular was difficult to gauge), increased global supply of wine grapes,
increasing global competition, better marketing efforts by Australia’s competitors and the
possibility of a global recession.
The basis for this research was the exploratory research undertaken by Bruwer et al. in
2000 and published in 2001. This exploratory study was the first to use lifestyle as the
basis for segmenting a wine market, although it had previously been used to examine food
markets in Europe. Bruwer et al. (2001) concluded that lifestyle was a viable basis for
segmenting a wine market, but felt that their methodology could be improved.
This study attempted to overcome some of the shortcomings identified by Bruwer et al.
(2001) by increasing the number of AIO questions asked of respondents and strengthening
the elements that formed the basis of the ensuing statistical analysis.
In addition to these improvements, for the first time, this study used consumers’ wine
knowledge as a discriminator between segments and examined any relationship between
that knowledge and experience of wine and the quality of the wine that they consumed.
128

The generic and specific risk reduction strategies favoured by the identified segments were
also explored. The collection of consumption data, wine brand purchase data, data relating
to wine sales assistants and demographic data combined to make this study one of the
largest ever undertaken of the South Australian wine market.
This final chapter therefore re-examines the main research problem and looks briefly at the
limitations imposed on this research study and notes the opportunities for further research
identified during the research process. It concludes with a discussion on whether the
research process provided a solution to that problem.
7.2 The Research Study Summarised
The main research problem defined for this research study was:
“To examine the preferred risk reduction strategies adopted in identified South Australian
wine market segments when purchasing wine, relate these to the wine retail environment
and develop an understanding of those market segments’ antecedents”.
In order to solve that main problem, a number of research sub problems were developed,
each of which became the focus of a chapter in this document. These sub problems were:
• Identify lifestyle-based segments in the South Australian wine market;
• Identify and examine each segment’s preferred risk reduction strategies when
purchasing wine; and
• Translate those preferred risk reduction strategies into practical implications for the
wine retail trade.
Four hypotheses were also developed to assist the research process. The following
hypothesis related to the first sub problem:
• Hypothesis 4 – Confirmation of the South Australian wine market wine related
lifestyle based segmentation structure identified by Bruwer et al. (2001).
The following hypothesis related to the second sub problem: • Hypothesis 1 – Reducing risk in wine purchasing leads to the purchase of higher
quality wine.
129
The third sub problem could be examined without reference to any hypotheses. The
remaining hypotheses were directly related to that part of the main research problem that
dealt with the wine market’s antecedents. These hypotheses were:
• Hypothesis 2 – Consuming higher quality wine increases consumers’ knowledge and
experience of wine and that, in turn, leads to the continued consumption of quality
wine.
• Hypothesis 3 – Consumers’ knowledge and experience of wine are antecedents to their
wine market segment.
Each of the three sub problems is now summarised and a conclusion drawn about whether
each was resolved through the research process. The two remaining hypotheses are also
summarised.
7.2.1 First Research Sub Problem
Although the major objective of the study was not to segment the South
Australian wine market, this was a necessary first step in the process and was the
substance of the first sub problem. The results of this research indicated that there
are five segments in the South Australian wine market. These segments are:
Segment 1 – Conservative, knowledgeable wine drinkers;
Segment 2 – Image oriented, knowledge seeking wine drinkers;
Segment 3 – Basic wine drinkers;
Segment 4 – Experimenter, highly knowledgeable wine drinkers; and
Segment 5 – Enjoyment oriented, social wine drinkers.
The five segments identified in this study parallel four of the five segments that
Bruwer et al. (2001) identified. This study could not confirm the existence of
Bruwer et al.’s. (2001) “Fashion/image oriented wine drinkers”. Rather, it
concluded that this segment was subsumed into segments 2 and 5 and the
“experimenter, highly knowledgeable wine drinker” segment emerged as a new
segment in the South Australian wine market. These results indicate that the
market has elements of the previously identified (for example, Spawton, 1991a,b
and Hall & Winchester, 1999) “connoisseur” type wine drinkers who are quite
conservative and traditional in their approach to purchasing behaviour and the
drinking of wine. This study also agreed with previous studies (for example, Hall
130

& Winchester, 1999 and Bruwer et al., 2001) that the “Basic wine drinkers” and
“Enjoyment oriented, social wine drinkers” are an integral part of the South
Australian wine market. Bruwer et al.’s. (2001) “Ritual oriented, conspicuous
wine enthusiasts” segment was also confirmed, however, this study identified that
this consumer was concerned with the image surrounding the drinking of wine
and was keen to increase their knowledge about wine.
For the first time, the consumers’ level of knowledge about wine was used as a
discriminator between segments. This study identified a highly knowledgeable
group of consumers who were keen to experiment with their wine purchases. This
segment is of particular interest to the wine industry, as it demonstrates that a
significant portion of the market (19%) support the products of boutique and other
small to medium size producers that constitute such a large part of the industry.
In addition to this particular segment, the study highlighted that two other
segments (1 and 2), totalling 43.2% of the market, averaged in excess of $20 per
bottle on their wine purchases. Although the wines that would be of interest to
these two segments may not necessarily be the same as those of the previous
segment, it is nevertheless of interest to the industry that such a large market share
is willing to part with that sort of money when purchasing wine.
In relation to the hypothesis concerned with the first sub problem, these findings
indicate that:
Hypothesis 4 – Confirmation of the South Australian wine market wine related
lifestyle based segmentation structure identified by Bruwer et al. (2001) – was
mainly supported, in that four of their five segments were replicated.
The first sub problem – Identify lifestyle-based segments in the South Australian
wine market – was therefore solved. In addition to solving this sub problem, the
use of lifestyle as a legitimate and valid method of segmenting a wine market was
confirmed.
131

7.2.2 Second Research Sub Problem
The second research sub problem was concerned with identifying the preferred
risk reduction strategies of each of the South Australian wine market segments,
when purchasing wine. The risk reduction strategies used in this part of the
research were the six generic strategies identified in the literature and repeated in
Mitchell & Greatorex’s (1989) work.
In the first instance, it had to be established that risk reduction behaviour was
employed when purchasing wine and the relevant hypothesis explored the
relationship between risk reduction and the purchase of higher quality wine. The
methodology adopted here was to establish that risk reduction was a part of wine
purchase behaviour, through questioning respondents about how they bought
wine. Having established that risk reduction did play a part, any trends in the
preferred risk reduction strategies as the price of wines increased (using price as
an indicator of quality), were examined. To confirm the hypothesis, a trend
towards the two most important risk reduction strategies (information seeking and
seeking reassurance through tasting prior to purchase) identified by Mitchell &
Greatorex (1989), was sought. The overall results demonstrated a definite trend
towards these two strategies and the hypothesis – Reducing risk in wine
purchasing leads to the purchase of higher quality wine – was therefore
confirmed.
The preferred risk reduction strategies of each of the identified segments were
then analysed in some detail. The general trend towards these two strategies was
noticeable across the five segments, however there were some noticeable
exceptions. Segment 3 – the basic wine drinkers – had a preference for relying on
favourite brands across all three price points. This was not unsurprising, as they
had scored relatively highly on the safe brands element of the lifestyle questions.
This result confirmed that, at least for this segment, that Spawton’s (1991a,b)
assertions that some consumers rely on safe brands for their wine purchases were
supported.
The establishment of the use of risk reduction strategies by those consumers
purchasing wine and the subsequent identification of the preferred strategies for
132
each of the five segments in the South Australian wine market meant that this
research sub problem – identify and examine each segment’s preferred risk
reduction strategies when purchasing wine – was resolved.
7.2.3 Third Research Sub Problem
The third research sub problem took the issue of risk reduction strategies from the
theoretical to the practical, as it examined how wine retailers could implement
elements of the retail mix in such a way as to respond to the preferences of their
customers. The methodology used here was to question respondents on their use
of specific risk reduction strategies when purchasing wine, where those strategies
were directly under the control of the wine retailer.
There was an expectation that there would be some correlation between the
specific strategies and the generic or general strategies discussed in the previous
sub problem. Although there was a general trend towards the specific strategies
that represented Mitchell & Greatorex’s (1989) two most important strategies,
overall, the most preferred strategy was the assortment of wines on offer. This
specific strategy equated to the generic strategies of brand loyalty and well-known
brands, neither of which ranked highly in the overall generic results. Although of
interest, the overall results were secondary in importance to the individual
segment’s results as wine retailers would be more interested in targeting the
specific customers who frequent their stores.
In nearly all instances, the preference for the assortment of wines on offer was the
preferred strategy across the segments. This preference was analysed having
regard to the behaviours and characteristics of each of the segments (that had been
previously identified) and was explained in these terms. The identification of
assortment as the preferred option raised a number of potential areas for further
research.
Of further interest was the emergence of the advice of wine sales staff as a
preferred strategy and this issue might have implications for the recruitment and
training and development of those staff.
133

As the preferences for each of the segments were identified and those preferences
were discussed in terms of how they could be assimilated in wine retailers’ retail
mixes, this sub problem – translate those preferred risk reduction strategies into
practical implications for the wine retail trade – was resolved.
7.2.4 The Two Remaining Hypotheses
As well as using knowledge as a discriminator between segments, the relationship
between the consumers’ knowledge and experience of wine and the quality of
wine that they consumed was also explored. This relationship was directly
relevant to any discussion on the identified segments’ antecedents. In general
terms, it was found that as consumers’ knowledge and experience of wine
increased, the quality of the wine that they consumed also increased. This
consumption of better wine then reinforced the consumers’ desire to maintain that
level of quality in their wine consumption. It was also found that a consumer’s
knowledge about wine was a good indicator of the segment in which they could
be found, although in practical terms, it was acknowledged that without some way
of gauging the level and extent of that knowledge, the actual segment was purely
guesswork. However, it was shown that a consumer’s knowledge was an
antecedent to their wine market segment. On the basis of these findings:
• Hypothesis 2 – Consuming higher quality wine increases consumers’
knowledge and experience of wine and that, in turn, leads to the continued
consumption of quality wine – was confirmed.
• Hypothesis 3 – A consumer’s knowledge and experience of wine are
antecedents to their wine market segment – was confirmed.
In addition, the part of the main research problem relating to the segments’
antecedents was also resolved.
7.3 Research Limitations
• The research study could not take into account the personality of the respondents when
examining the area of risk reduction. Some respondents might have been risk takers
and others might have been risk averse and these personality traits would have
impacted on whether risk reduction strategies were employed when purchasing wine
134

and if so, the types and frequency of strategies employed. This psychological aspect of
wine purchasing behaviour was considered outside the scope of the research study.
• The research study was limited to customers of the eight participating wine retail
stores in the Adelaide metropolitan area during the months of August and September
2001.
7.4 Recommendations for Further Research
This study identified a number of areas that might benefit from further research. These
areas, in no order of importance, are briefly outlined below:
• This research study was based on the exploratory study conducted by Bruwer et al.
(2001), but it was only the second attempt ever to segment a wine market using
lifestyle as the basis. Although this research confirmed Bruwer et al.’s conclusion that
lifestyle is a valid and viable method of segmenting a wine market, further fine-tuning
of the research instrument is recommended.
• This research study was undertaken in eight wine retail stores in the Adelaide
metropolitan area. These eight stores were chosen on the assumption that their
customers were a fair representation of the South Australian wine market. This
assumption may have been somewhat inaccurate and therefore the research should be
replicated both in other wine retailers within Adelaide and in other metropolitan areas
around Australia. (For example, if this research was replicated in the eastern states of
Australia, where wine is available for purchase in supermarkets, the median and mean
figures for the price of wine purchased may well be lower. In addition, the percentage
of respondents in the “wine knowledgeable” segments may well be lower.)
• Similar to the point raised immediately above, the research could be replicated at
cellar-door outlets and a comparison of results undertaken to see whether there were
any significant differences in consumers who purchase wine from these different
venues.
• As noted in the chapter relating to retail strategies, the choice of assortment as the
preferred risk reduction strategy of all segments was unexpected. Further research on
consumers’ understanding of assortment and whether it is the preferred strategy would
confirm or disconfirm the findings of this research.
• The issue of the male/female wine consumption ratio was not resolved by this
research. This research found that approximately one-third of wine purchasers in the
135
South Australian market was female (as distinct from the estimated 70% in the UK
market). What was not resolved and would be of interest to the industry generally is
the amount and types of wine consumed by females compared to males.
• The study collected some rudimentary data on the length of time wines were cellared
prior to consumption. This was not undertaken as the primary focus and therefore did
not collect data on issues like the types of wine that were cellared, the actual length of
time cellared and the significant differences in the cellaring habits of the various
segments. This information might be of interest to various players in the wine
industry.
• Two sets of data relating to the amount that respondents spent on wine were collected.
A self-reported monthly spend on wine figure was provided. In addition, respondents
were asked to nominate (from a list provided) the wine brands and their respective
numbers that they had purchased in the month preceding the completion of the survey.
Although this data contained an element of self-reporting, it was felt that it would
provide a more accurate figure on the amount of money spent per month than the self-
reported figure. The results indicated that the average monthly spend figures
calculated from the actual purchases was significantly higher (p < .01) than the self-
reported mean monthly spend on wine ($344.94 and $136.86 respectively). There
might be a number of reasons for this discrepancy, including that many consumers
have no real idea of the actual amount of money that they spend per month on wine.
As the average monthly spend on wine is a figure of interest to many parts of the
industry, it is an area that should be further researched, perhaps through the use of a
diary system over a period of time.
• Similarly, respondents were asked to estimate the number of glasses of wine
consumed per week. Although the interviewers described what constituted a glass of
wine, the resultant figures may not have been a true reflection of the amount of wine
consumed. As the actual amount of alcohol consumed per week should be of interest
to all drinkers, a more rigid form of data collection for this important area should be
devised.
• This study was the first to use consumers’ wine knowledge as a discriminator between
segments and was the first to explore the relationship between knowledge and the
quality of wine consumed. The basis for determining the consumers’ knowledge was a
set of multiple choice questions asked as part of the data collection process. These
questions were not subjected to any statistical tests to determine reliability prior to
their implementation. Notwithstanding this, the results obtained provided consistent
136

and reliable scores across the segments. This whole area of the knowledge of
consumers could become the subject of further research, including a longitudinal study
that could measure any incremental advances in wine knowledge.
• The segmentation exercise realised one “new” segment – the experimenter, highly
knowledgeable wine drinker. The characteristics attributed to this segment indicate
that these consumers could play a very important role in the future of the domestic
wine industry. As result, further knowledge is required of this segment and it should
become the focus of a more detailed study.
• The South Australian wine market is subject to change over time. Whilst the findings
of this research may be relevant to the market as it was at the time of the research, the
market will not remain static. If the wine industry is to continue to develop and learn, a
segmentation exercise such as this should be undertaken on a regular basis. In that
way, a benchmark for the market would be established and changes over time would
be monitored and tracked. Any developing trends in the market would become
apparent and the industry might find itself in a better position to predict those trends.
This would further enhance the growth of the domestic market.
7.5 Did the Study Achieve its Aim?
This question is absolutely fundamental when evaluating the overall success of the
research study. If the research was successful, then the main research problem must have
been solved, so it is pertinent to examine each of the elements of the problem and decide
whether the research has resolved the inherent issues. The research problem can be broken
up into four parts:
• Identify the segments in the South Australian wine market;
• Examine their preferred risk reduction strategies when purchasing wine;
• Relate those preferred strategies to the wine retail environment; and
• Develop an understanding of each of the identified segments antecedents.
Each of these factors is briefly discussed.
7.5.1 Identify the Segments in the South Australian Wine Market
This study undertook a detailed segmentation study of the South Australian wine
market using wine-related lifestyle as the basis for that exercise. The data
137
identified five wine-related lifestyle segments and they have been the focus of
much of this study. The conclusion was drawn that lifestyle can be considered a
legitimate and insightful basis for segmenting a wine market. It is also the opinion
of the author, that the resulting segments are representative of the state of the
South Australian wine market in 2001. It is clear that this portion of the research
problem was answered.
7.5.2 Examine Their Preferred Risk Reduction Strategies When Purchasing Wine
The preferred risk reduction strategies when purchasing wine for each of the
identified segments were examined using both a generic and a specific approach.
The generic approach provided results that suggested that risk reduction strategies
were employed and those results provided conditional support for the findings of
earlier researchers on this issue. These preferred generic risk reduction strategies
also provided further insights into the characteristics and behaviours of each of the
segments and added strength to the analysis on each that had been discussed
earlier in the document. This section of the research problem was therefore also
resolved.
7.5.3 Relate Those Preferred Strategies to the Wine Retail Environment
The specific risk reduction strategies referred to above, provided the data to
consider this part of the problem. Although there was an expectation that the
results from the analysis of both the generic and specific strategies might provide
some correlations, this did not occur at the level that was expected. The results
demonstrated that for the majority of wine purchasers over the range of prices,
that the assortment of wines on offer was the most preferred risk reduction
strategy. In other words, the majority of purchasers found comfort in having a
wide array of wine from which to make their purchase. This result was not
inconsistent with the behaviours and characteristics of individual segments and
that were discussed in detail earlier. These behaviours and characteristics and the
results of the preferred risk reduction strategies, provided some key words,
phrases and images that might be useful to wine retailers when devising their
communication strategies. It can therefore be said that this section of the problem
138
was answered, however, it also raised some issues that might benefit from further
research.
7.5.4 Develop an Understanding of Each of the Identified Segments’ Antecedents
This particular topic has been an implicit part of all discussions and analysis about
each of the identified segments. The behaviours and characteristics of each of the
segments provided insights into the psyche of the consumers who make up each
of the segments. These behaviours and characteristics provide pointers as to how
each of the segments might react when confronted with a particular purchasing
situation. In addition, the knowledge levels of each of the segments were analysed
and related to the quality of the wine that might be purchased and consumed by
each of the segments. This use of knowledge was a first in research of this type
and provided certain pointers about each of the segments. All of this data
combined to provide detailed information about each of the segments and allowed
a resolution to this part of the problem.
7.6 Conclusions
The inescapable conclusion drawn from the discussion above must be that the main
research problem was resolved through the efforts of this study. Furthermore, the results of
this study confirmed that the South Australian wine market is a dynamic and fluid market.
The five identified segments are considered (by this author) to be a reasonable
representation of the South Australian wine market in late 2001 and demonstrate that the
market has indeed evolved from the days of McKinna and Spawton. This is entirely
appropriate and results from this study that confirmed those earlier works would be
unexpected, in much the same way that if this study were replicated in 2010 and a similar
market structure was found then. What these results do indicate is that those earlier
researchers provided a remarkable insight into the market, as it was then, to such an extent
that many of their ideas and suppositions remain true today.
As the consumption of wine has become more widespread and as wine has become the
lifestyle beverage of choice for so many Australians, a segmentation study using lifestyle
as the basis has many merits and these have been identified herein.
139
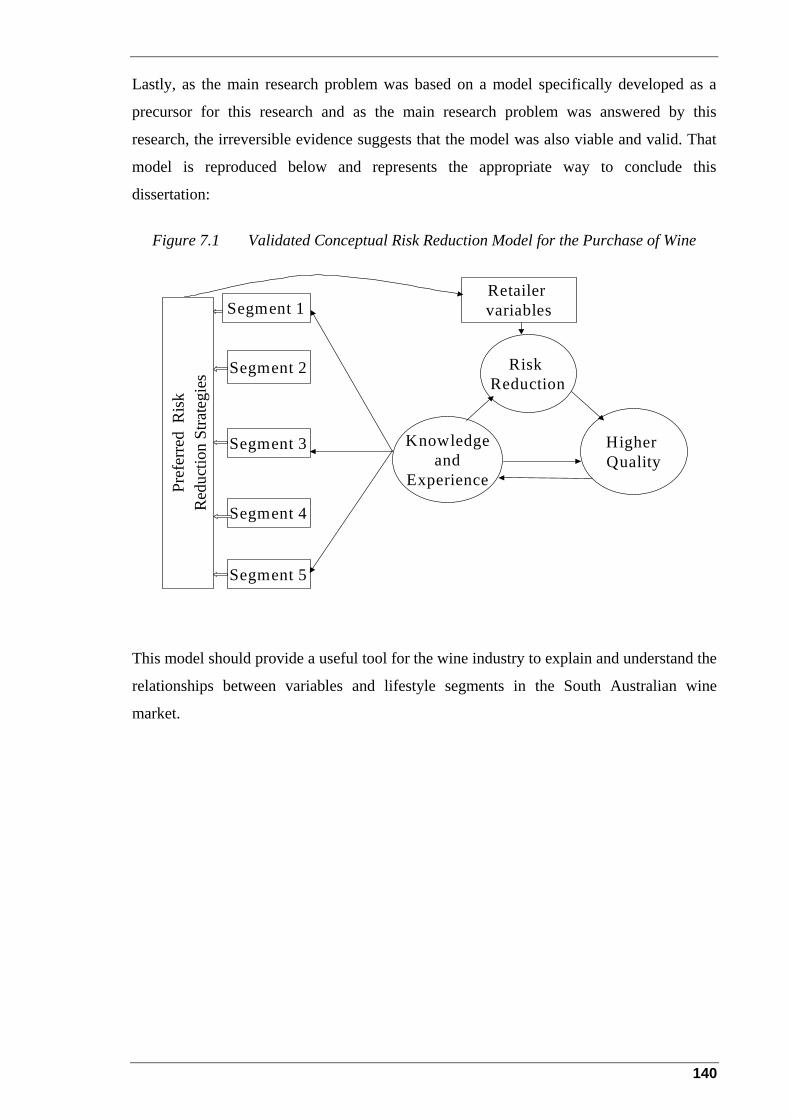
Lastly, as the main research problem was based on a model specifically developed as a
precursor for this research and as the main research problem was answered by this
research, the irreversible evidence suggests that the model was also viable and valid. That
model is reproduced below and represents the appropriate way to conclude this
dissertation:
Figure 7.1 Validated Conceptual Risk Reduction Model for the Purchase of Wine
Retailer variables
Risk Reduction
Higher Quality
Knowledgeand
Experience
Segment 1
Segment 2
Segment 3
Segment 4
Segment 5
Pref
erre
d R
isk
Red
uctio
n St
rate
gies
This model should provide a useful tool for the wine industry to explain and understand the
relationships between variables and lifestyle segments in the South Australian wine
market.
140

Appendix 1 Survey Questionnaire
A Survey Undertaken by Adelaide University
Australia
ADELAIDEUNIVERSITY
August 2001
141

Introduction
Dear Sir/Madam, This research study aims to extend the knowledge base of the Australian domestic wine market
and explore the relationships between the consumer and the wine retail environment. Trent
Johnson, a student at Adelaide University, is undertaking this research as part of his Masters
Degree in Wine Business. His supervisor at Adelaide University is Dr Johan Bruwer. You have
been chosen to help us to increase the understanding about these topics, so that the findings can
be used to improve business and consumer relationships in the Australian wine industry.
The questionnaire should only take about 20 minutes of your time to complete. All your details will be kept totally confidential. We will not give any of your personal details out to another company. All reporting will be in summary form only. You are guaranteed not to receive any sales pitches or mailings as a result of your participation in this study.
Instructions
1. Please use a dark pen. 2. Please answer every question. 3. Please answer all questions as honestly as possible. Once again, thank you for your help in this valuable research. If you have any queries please do not hesitate to contact either: Mr Trent Johnson 8271 2682 or 0414 800 548 E-mail: [email protected] Or Dr Johan Bruwer Senior Lecturer: Wine Marketing Tel: 8303 6764 E-mail: [email protected]
To be completed by Interviewer:
Store:
Respondent:
142

Section 1: Consumption of Wine
1. Please divide your consumption of alcoholic beverages between the following categories (to add up to 100%)
Wine ______% Beer ______% Spirits ______% Pre-mixed drinks ______% Other ______%
2. Please divide your consumption of wine between the following categories (to add up to 100%)
Red wine ______% White wine ______% Sparkling wine ______% Fortified wine ______%
3. How often do you drink wine? (please tick most appropriate option) Once a day ______ A few times a week ______ Once a week ______ Once a fortnight ______ Once a month ______ Once every 2 months ______ Other ______
4. In which part of the week do you normally drink wine? (please tick most appropriate option)
Mostly during the week (Monday – Thursday) ______ Mostly during the weekend (Friday – Sunday) ______ A combination of both weekdays and weekends ______
5. Do you normally drink cask or bottled wine? (please tick most appropriate option)
Mainly cask ______ Mainly bottled ______ A mix of both (50:50) ______ Uncertain ______
6. Approximately how many glasses of wine do you consume in a typical week? ______ 7. Approximately how much would you spend on wine in a typical month? $______ 8. Are you the main wine buyer in your household? Yes _____ No ______
143
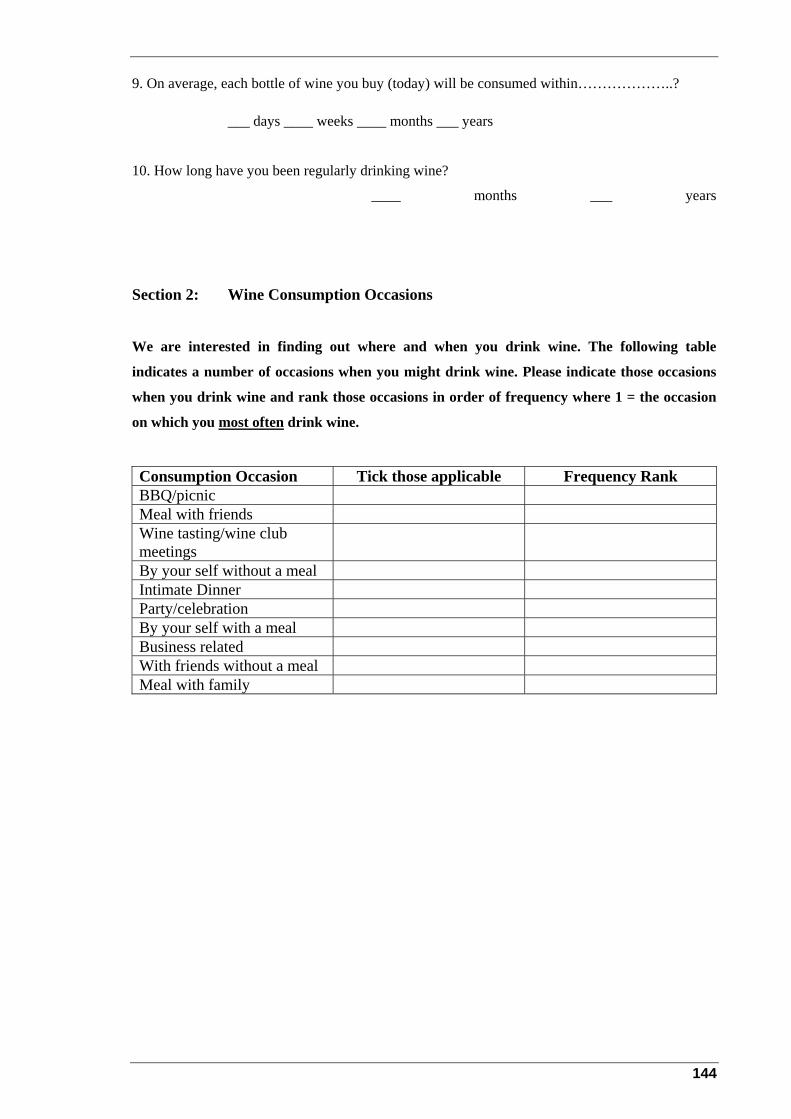
9. On average, each bottle of wine you buy (today) will be consumed within………………..? ___ days ____ weeks ____ months ___ years
10. How long have you been regularly drinking wine?
____ months ___ years
Section 2: Wine Consumption Occasions
We are interested in finding out where and when you drink wine. The following table
indicates a number of occasions when you might drink wine. Please indicate those occasions
when you drink wine and rank those occasions in order of frequency where 1 = the occasion
on which you most often drink wine.
Consumption Occasion Tick those applicable Frequency Rank BBQ/picnic Meal with friends Wine tasting/wine club meetings
By your self without a meal Intimate Dinner Party/celebration By your self with a meal Business related With friends without a meal Meal with family
144
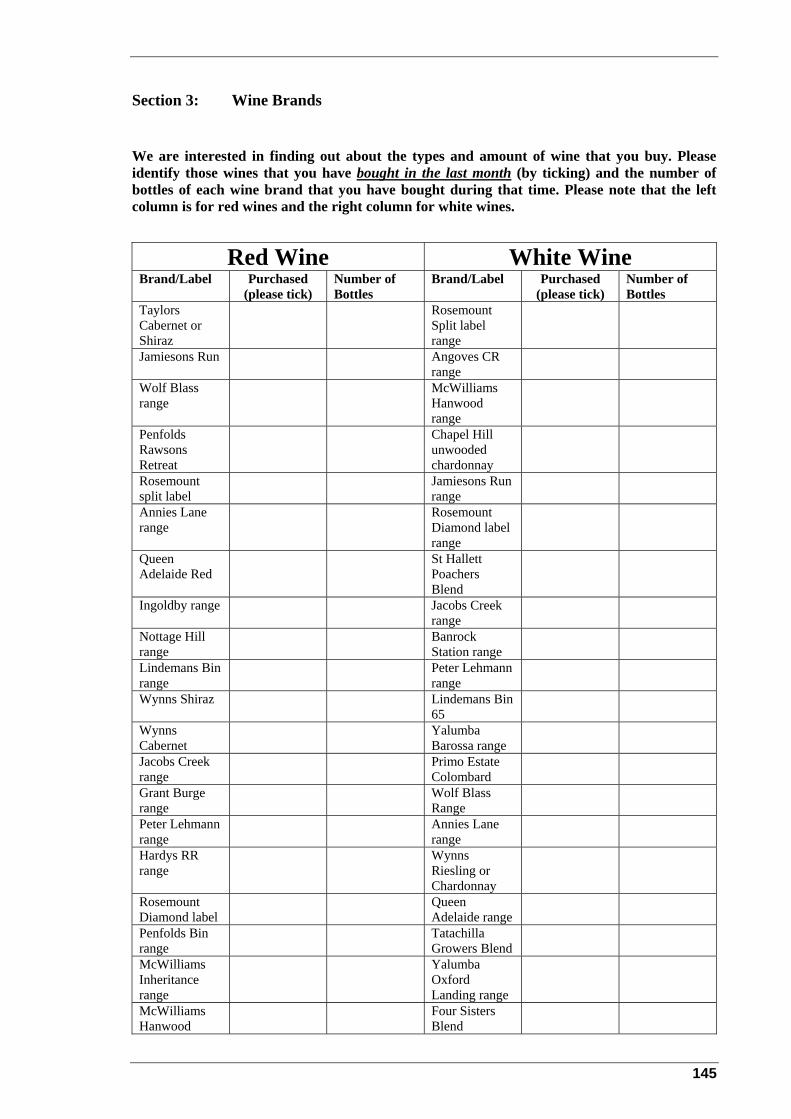
Section 3: Wine Brands
We are interested in finding out about the types and amount of wine that you buy. Please identify those wines that you have bought in the last month (by ticking) and the number of bottles of each wine brand that you have bought during that time. Please note that the left column is for red wines and the right column for white wines.
Red Wine White Wine Brand/Label Purchased
(please tick) Number of Bottles
Brand/Label Purchased (please tick)
Number of Bottles
Taylors Cabernet or Shiraz
Rosemount Split label range
Jamiesons Run Angoves CR range
Wolf Blass range
McWilliams Hanwood range
Penfolds Rawsons Retreat
Chapel Hill unwooded chardonnay
Rosemount split label
Jamiesons Run range
Annies Lane range
Rosemount Diamond label range
Queen Adelaide Red
St Hallett Poachers Blend
Ingoldby range Jacobs Creek range
Nottage Hill range
Banrock Station range
Lindemans Bin range
Peter Lehmann range
Wynns Shiraz Lindemans Bin 65
Wynns Cabernet
Yalumba Barossa range
Jacobs Creek range
Primo Estate Colombard
Grant Burge range
Wolf Blass Range
Peter Lehmann range
Annies Lane range
Hardys RR range
Wynns Riesling or Chardonnay
Rosemount Diamond label
Queen Adelaide range
Tatachilla Growers Blend
McWilliams
Penfolds Bin range
Yalumba Oxford Landing range
Inheritance range McWilliams Four Sisters
Blend Hanwood
145
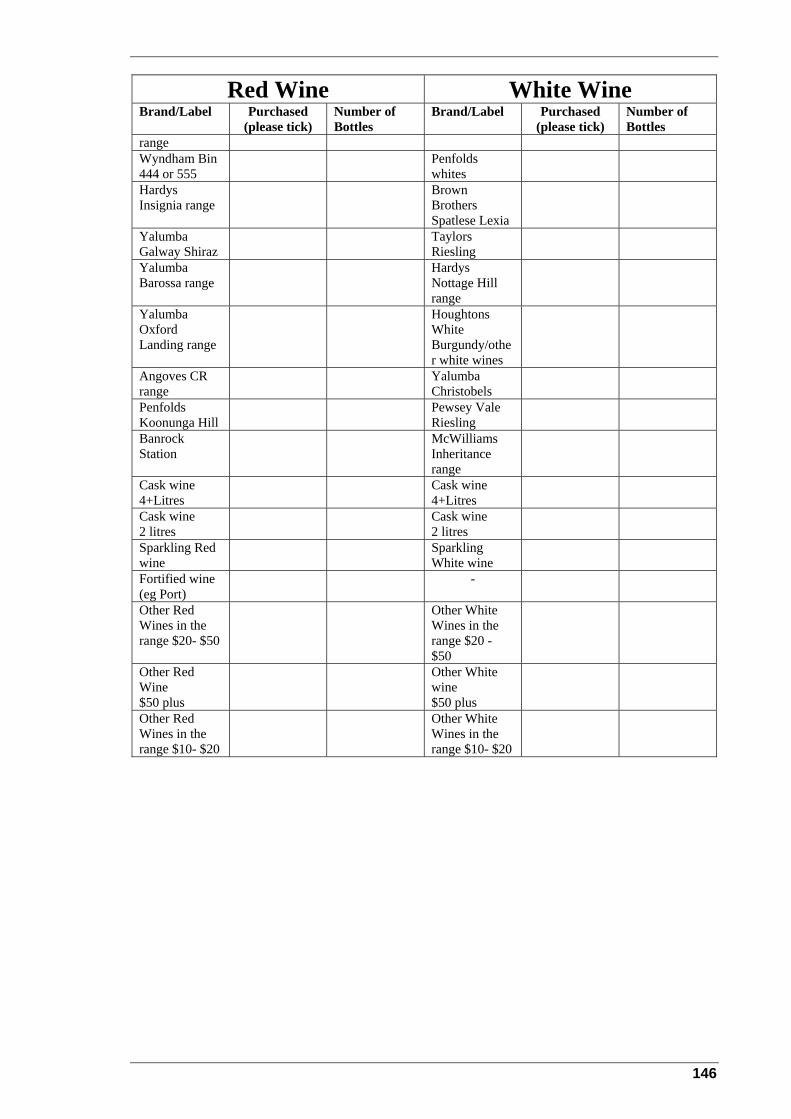
Red Wine White Wine Brand/Label Purchased Number of
Bottles Brand/Label Purchased
(please tick) Number of Bottles (please tick)
range Wyndham Bin 444 or 555
Penfolds whites
Hardys Insignia range
Brown Brothers Spatlese Lexia
Yalumba Galway Shiraz
Taylors Riesling
Yalumba Barossa range
Hardys Nottage Hill range
Yalumba Oxford Landing range
Houghtons White Burgundy/other white wines
Angoves CR range
Yalumba Christobels
Penfolds Koonunga Hill
Pewsey Vale Riesling
Banrock Station
McWilliams Inheritance range
Cask wine 4+Litres
Cask wine 4+Litres
Cask wine 2 litres
Cask wine 2 litres
Sparkling Red wine
Sparkling White wine
Fortified wine (eg Port)
-
Other Red Wines in the range $20- $50
Other White Wines in the range $20 - $50
Other Red Wine $50 plus
Other White wine $50 plus
Other Red Wines in the range $10- $20
Other White Wines in the range $10- $20
146

Section 4: Wine Related Lifestyle
This section has been deliberately removed for trademark reasons.
Section 5A: Strategies - General
We would like to find out how you go about buying your wine. Please indicate which of the following you use when you buy wine and then rank those that you do use in their order of importance (where 1 is the most important and 6 the least important). Please only complete the applicable price ranges.
Wine under $15/bottle Wine over $15 and under $25/bottle Wine over $25/bottle
Use (tick
where
applicable)
Importance Use (tick
where
applicable)
Importance Use (tick
where
applicable)
Importance
I have a few favourite brands from which I usually buy my wine.
The reputation of the wine store
Whether I have had the opportunity to try it before buying
I seek information about a wine before buying it
The price of the wine
Whether the wine is a well known brand to me
147
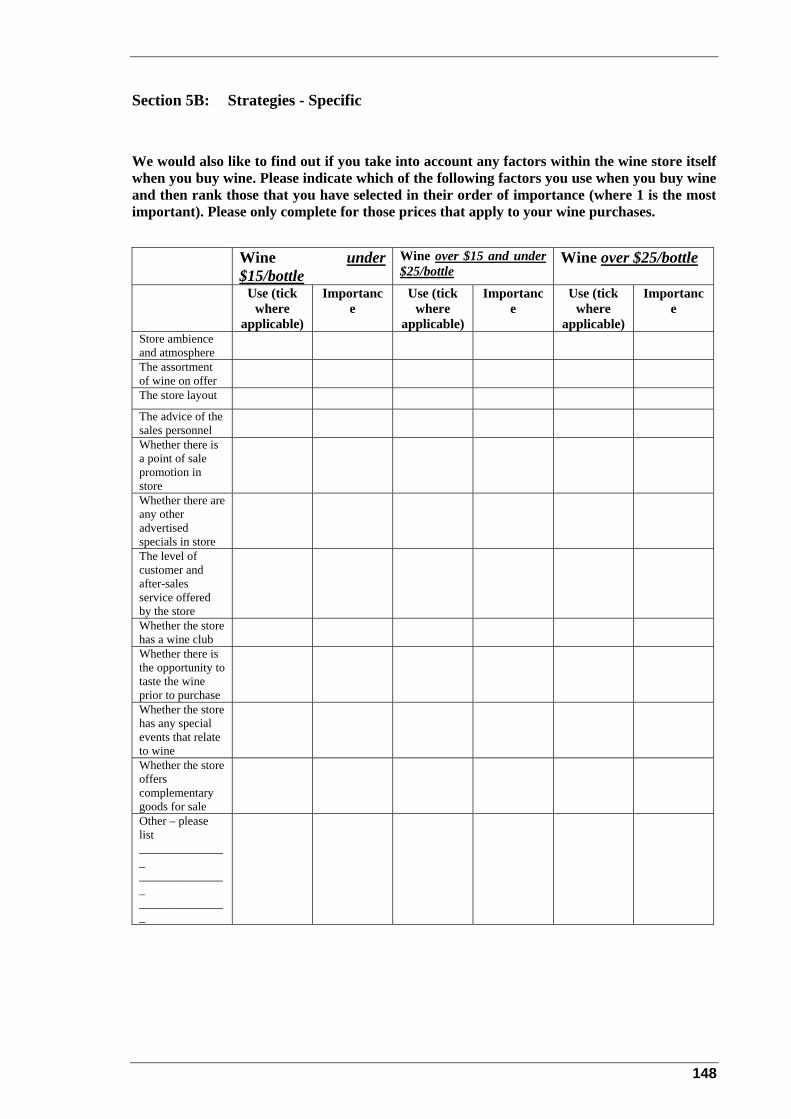
Section 5B: Strategies - Specific
We would also like to find out if you take into account any factors within the wine store itself when you buy wine. Please indicate which of the following factors you use when you buy wine and then rank those that you have selected in their order of importance (where 1 is the most important). Please only complete for those prices that apply to your wine purchases.
Wine under $15/bottle
Wine over $15 and under $25/bottle
Wine over $25/bottle
Use (tick where
applicable)
Importance
Use (tick where
applicable)
Importance
Use (tick where
applicable)
Importance
Store ambience and atmosphere
The assortment of wine on offer
The store layout
The advice of the sales personnel
Whether there is a point of sale promotion in store
Whether there are any other advertised specials in store
The level of customer and after-sales service offered by the store
Whether the store has a wine club
Whether there is the opportunity to taste the wine prior to purchase
Whether the store has any special events that relate to wine
Whether the store offers complementary goods for sale
Other – please list _______________ _______________ _______________
148
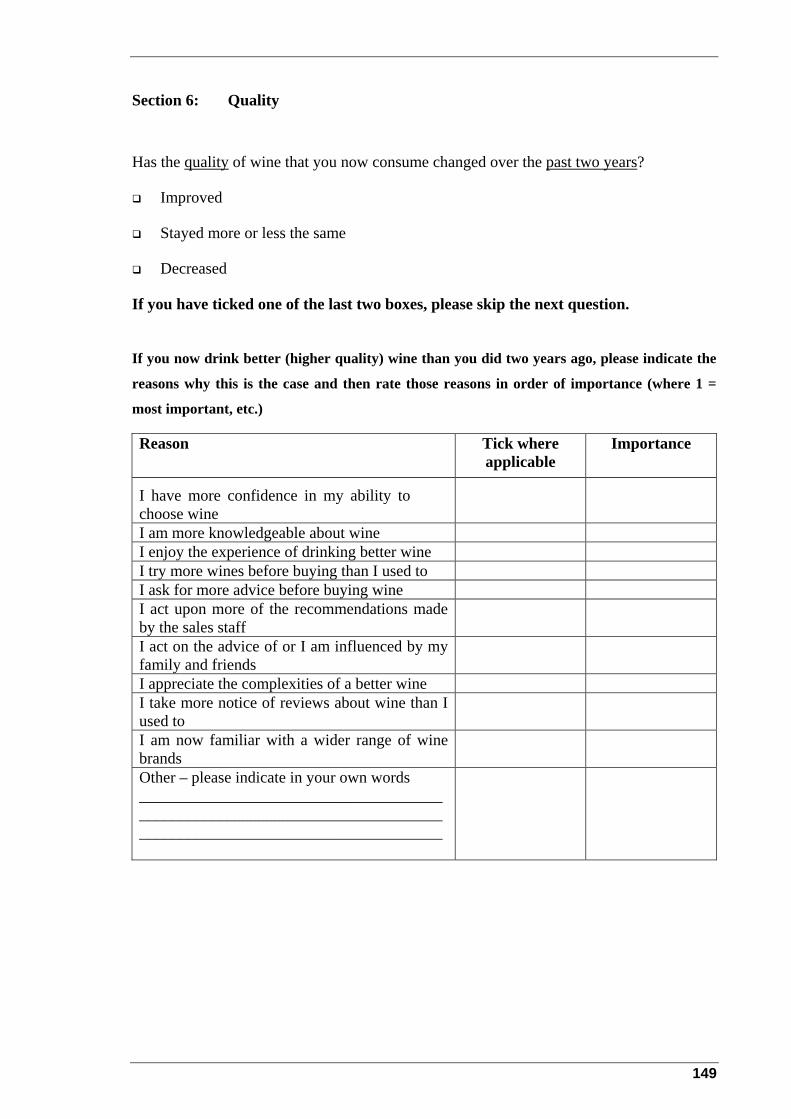
Section 6: Quality
Has the quality of wine that you now consume changed over the past two years?
Improved
Stayed more or less the same
Decreased
If you have ticked one of the last two boxes, please skip the next question.
If you now drink better (higher quality) wine than you did two years ago, please indicate the
reasons why this is the case and then rate those reasons in order of importance (where 1 =
most important, etc.)
Reason Tick where applicable
Importance
I have more confidence in my ability to choose wine
I am more knowledgeable about wine I enjoy the experience of drinking better wine I try more wines before buying than I used to I ask for more advice before buying wine I act upon more of the recommendations made by the sales staff
I act on the advice of or I am influenced by my family and friends
I appreciate the complexities of a better wine I take more notice of reviews about wine than I used to
I am now familiar with a wider range of wine brands
Other – please indicate in your own words ______________________________________ ______________________________________ ______________________________________
149
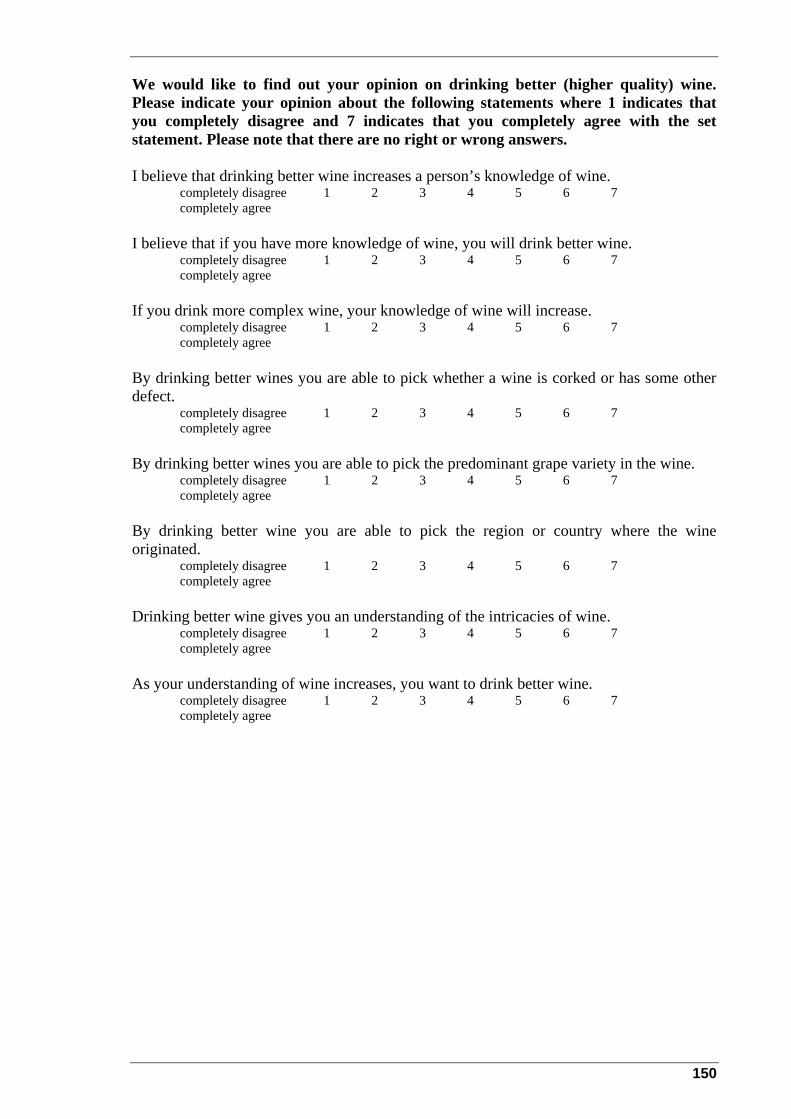
We would like to find out your opinion on drinking better (higher quality) wine. Please indicate your opinion about the following statements where 1 indicates that you completely disagree and 7 indicates that you completely agree with the set statement. Please note that there are no right or wrong answers. I believe that drinking better wine increases a person’s knowledge of wine.
completely disagree 1 2 3 4 5 6 7 completely agree I believe that if you have more knowledge of wine, you will drink better wine.
completely disagree 1 2 3 4 5 6 7 completely agree If you drink more complex wine, your knowledge of wine will increase.
completely disagree 1 2 3 4 5 6 7 completely agree By drinking better wines you are able to pick whether a wine is corked or has some other defect.
completely disagree 1 2 3 4 5 6 7 completely agree By drinking better wines you are able to pick the predominant grape variety in the wine.
completely disagree 1 2 3 4 5 6 7 completely agree By drinking better wine you are able to pick the region or country where the wine originated.
completely disagree 1 2 3 4 5 6 7 completely agree Drinking better wine gives you an understanding of the intricacies of wine.
completely disagree 1 2 3 4 5 6 7 completely agree As your understanding of wine increases, you want to drink better wine.
completely disagree 1 2 3 4 5 6 7 completely agree
150

Section 7: Role of the Wine Retail Assistant
We would like to learn more about the role the wine store sales assistant plays in your wine
purchases. From the following list, please indicate those aspects that you have asked about
and also those aspects that you would like to ask about, but have not (yet), for some reason or
another.
Aspect Yes (tick where applicable)
Would like to ask, but have not for some reason (tick
where applicable).
I have asked for directions to wines inside the wine store.
I have asked for information about wine brands. I have asked for information about grape varieties.
I have asked for information about a specific wine of interest.
I have asked for information about wine and food matching.
I have asked for details about the price of wine. I have asked advice about an appropriate wine for a gift.
I have asked for info about the physical storage of wine.
I have asked for advice whether a wine would benefit from cellaring.
I have asked for information about wine from a specific region in Australia.
I have asked for info about wines from another country.
I have asked for information about how a wine will taste.
I have asked for details about wines that have won medals or awards.
I have asked whether a wine has a taint or other defect.
I have asked for comments about an opinion that I hold about a wine.
151
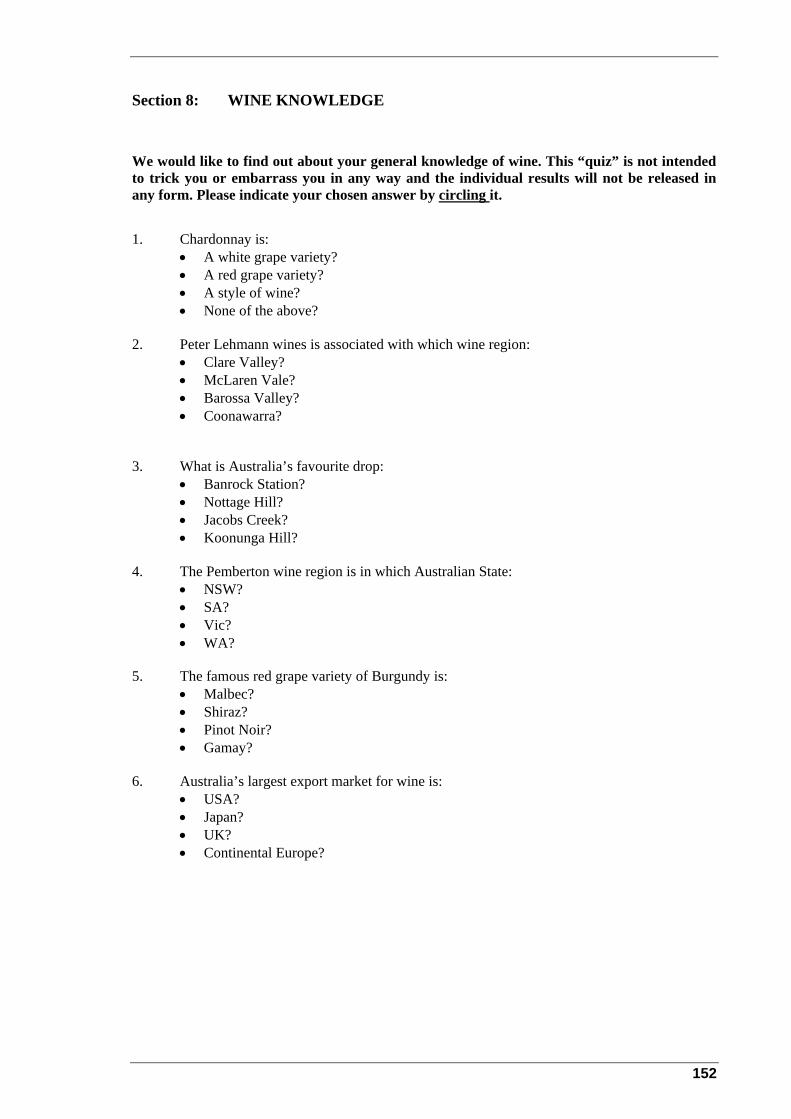
Section 8: WINE KNOWLEDGE
We would like to find out about your general knowledge of wine. This “quiz” is not intended to trick you or embarrass you in any way and the individual results will not be released in any form. Please indicate your chosen answer by circling it.
1. Chardonnay is: • A white grape variety? • A red grape variety? • A style of wine? • None of the above?
2. Peter Lehmann wines is associated with which wine region:
• Clare Valley? • McLaren Vale? • Barossa Valley? • Coonawarra?
3. What is Australia’s favourite drop: • Banrock Station? • Nottage Hill? • Jacobs Creek? • Koonunga Hill?
4. The Pemberton wine region is in which Australian State:
• NSW? • SA? • Vic? • WA?
5. The famous red grape variety of Burgundy is: • Malbec? • Shiraz? • Pinot Noir? • Gamay?
6. Australia’s largest export market for wine is:
• USA? • Japan? • UK? • Continental Europe?
152
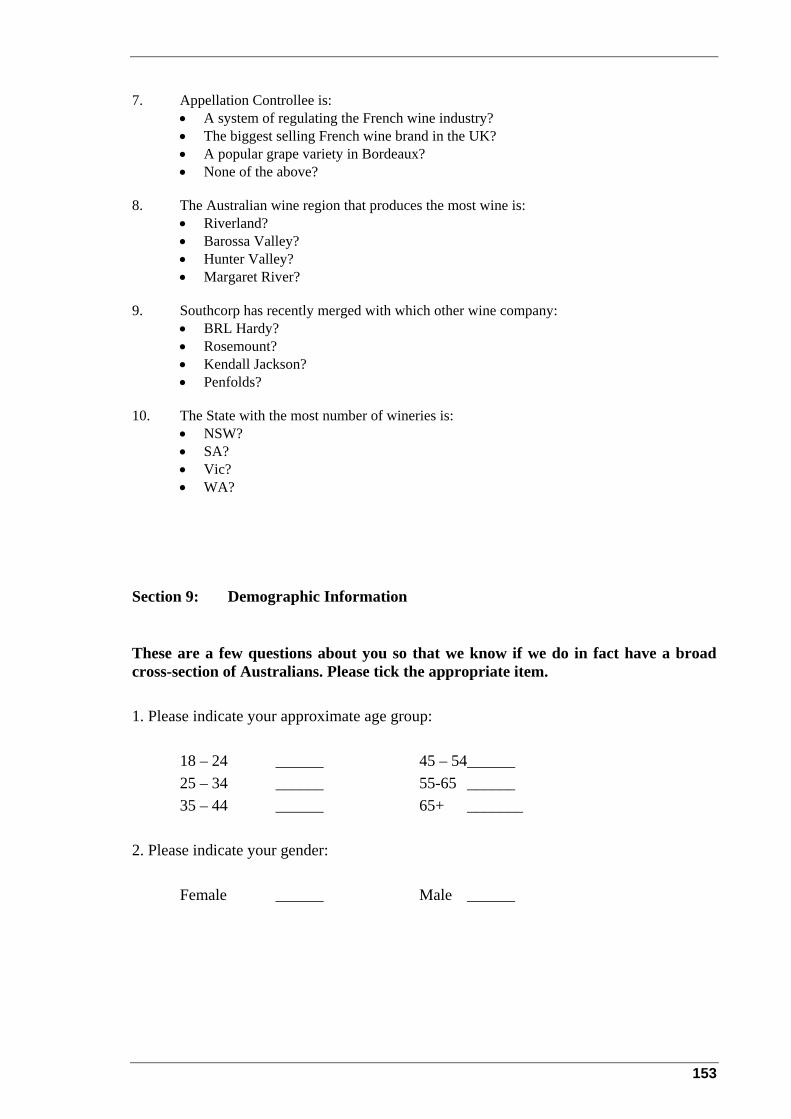
7. Appellation Controllee is:
• A system of regulating the French wine industry? • The biggest selling French wine brand in the UK? • A popular grape variety in Bordeaux? • None of the above?
8. The Australian wine region that produces the most wine is:
• Riverland? • Barossa Valley? • Hunter Valley? • Margaret River?
9. Southcorp has recently merged with which other wine company:
• BRL Hardy? • Rosemount? • Kendall Jackson? • Penfolds?
10. The State with the most number of wineries is: • NSW? • SA? • Vic? • WA?
Section 9: Demographic Information
These are a few questions about you so that we know if we do in fact have a broad cross-section of Australians. Please tick the appropriate item. 1. Please indicate your approximate age group:
18 – 24 ______ 45 – 54______ 25 – 34 ______ 55-65 ______ 35 – 44 ______ 65+ _______
2. Please indicate your gender:
Female ______ Male ______
153
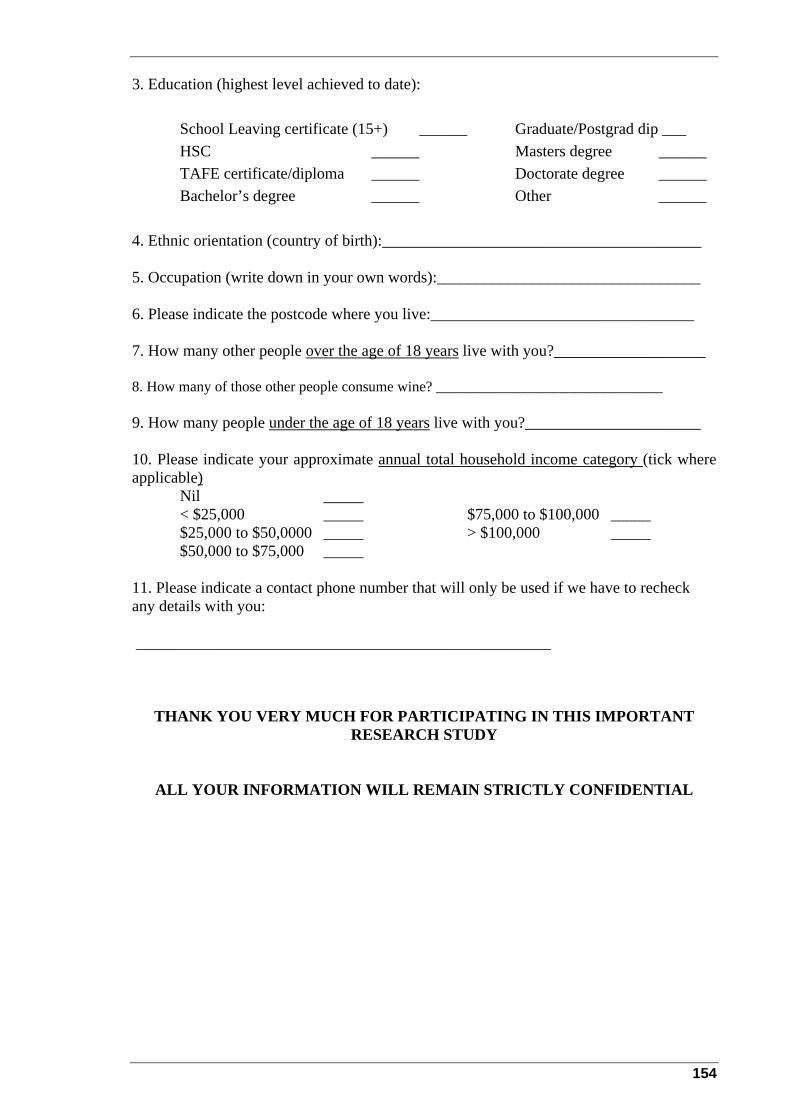
3. Education (highest level achieved to date):
School Leaving certificate (15+) ______ Graduate/Postgrad dip ___ HSC ______ Masters degree ______ TAFE certificate/diploma ______ Doctorate degree ______ Bachelor’s degree ______ Other ______
4. Ethnic orientation (country of birth):________________________________________ 5. Occupation (write down in your own words):_________________________________ 6. Please indicate the postcode where you live:_________________________________ 7. How many other people over the age of 18 years live with you?___________________ 8. How many of those other people consume wine? _______________________________ 9. How many people under the age of 18 years live with you?______________________ 10. Please indicate your approximate annual total household income category (tick where applicable) Nil _____
< $25,000 _____ $75,000 to $100,000 _____ $25,000 to $50,0000 _____ > $100,000 _____ $50,000 to $75,000 _____ 11. Please indicate a contact phone number that will only be used if we have to recheck any details with you: ____________________________________________________
THANK YOU VERY MUCH FOR PARTICIPATING IN THIS IMPORTANT RESEARCH STUDY
ALL YOUR INFORMATION WILL REMAIN STRICTLY CONFIDENTIAL
154
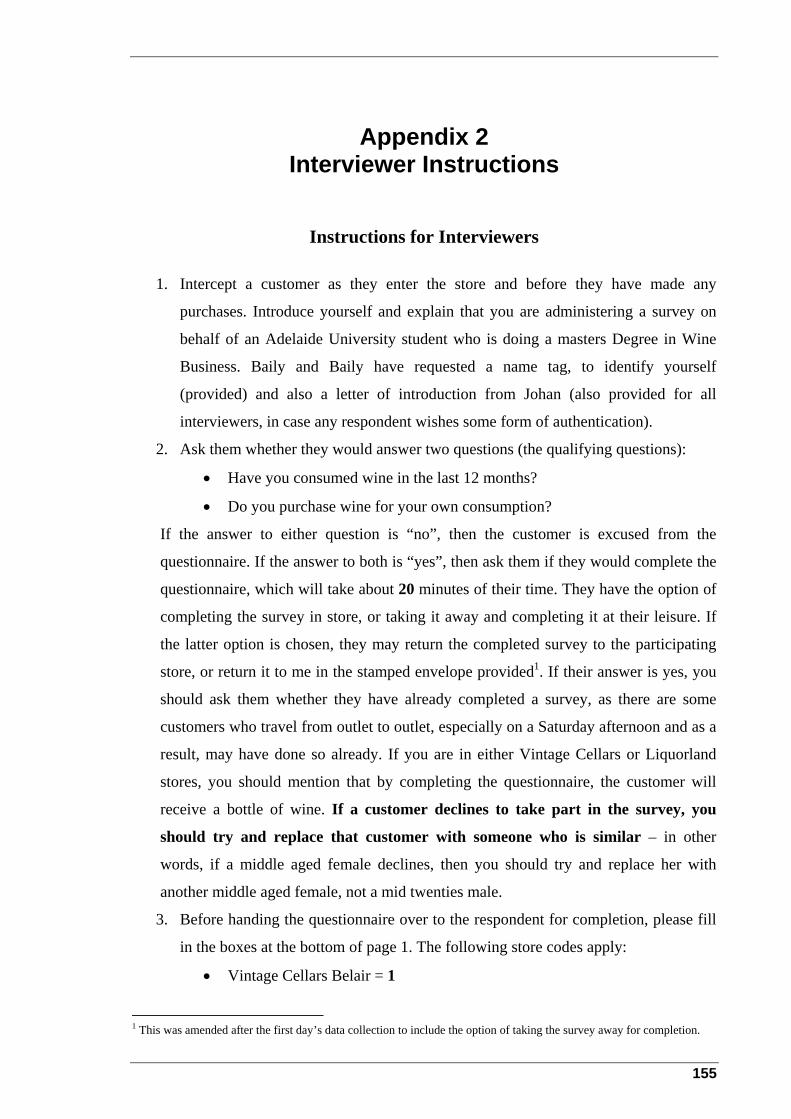
Appendix 2 Interviewer Instructions
Instructions for Interviewers
1. Intercept a customer as they enter the store and before they have made any
purchases. Introduce yourself and explain that you are administering a survey on
behalf of an Adelaide University student who is doing a masters Degree in Wine
Business. Baily and Baily have requested a name tag, to identify yourself
(provided) and also a letter of introduction from Johan (also provided for all
interviewers, in case any respondent wishes some form of authentication).
2. Ask them whether they would answer two questions (the qualifying questions):
• Have you consumed wine in the last 12 months?
• Do you purchase wine for your own consumption?
If the answer to either question is “no”, then the customer is excused from the
questionnaire. If the answer to both is “yes”, then ask them if they would complete the
questionnaire, which will take about 20 minutes of their time. They have the option of
completing the survey in store, or taking it away and completing it at their leisure. If
the latter option is chosen, they may return the completed survey to the participating
store, or return it to me in the stamped envelope provided1. If their answer is yes, you
should ask them whether they have already completed a survey, as there are some
customers who travel from outlet to outlet, especially on a Saturday afternoon and as a
result, may have done so already. If you are in either Vintage Cellars or Liquorland
stores, you should mention that by completing the questionnaire, the customer will
receive a bottle of wine. If a customer declines to take part in the survey, you
should try and replace that customer with someone who is similar – in other
words, if a middle aged female declines, then you should try and replace her with
another middle aged female, not a mid twenties male.
3. Before handing the questionnaire over to the respondent for completion, please fill
in the boxes at the bottom of page 1. The following store codes apply:
• Vintage Cellars Belair = 1
1 This was amended after the first day’s data collection to include the option of taking the survey away for completion.
155
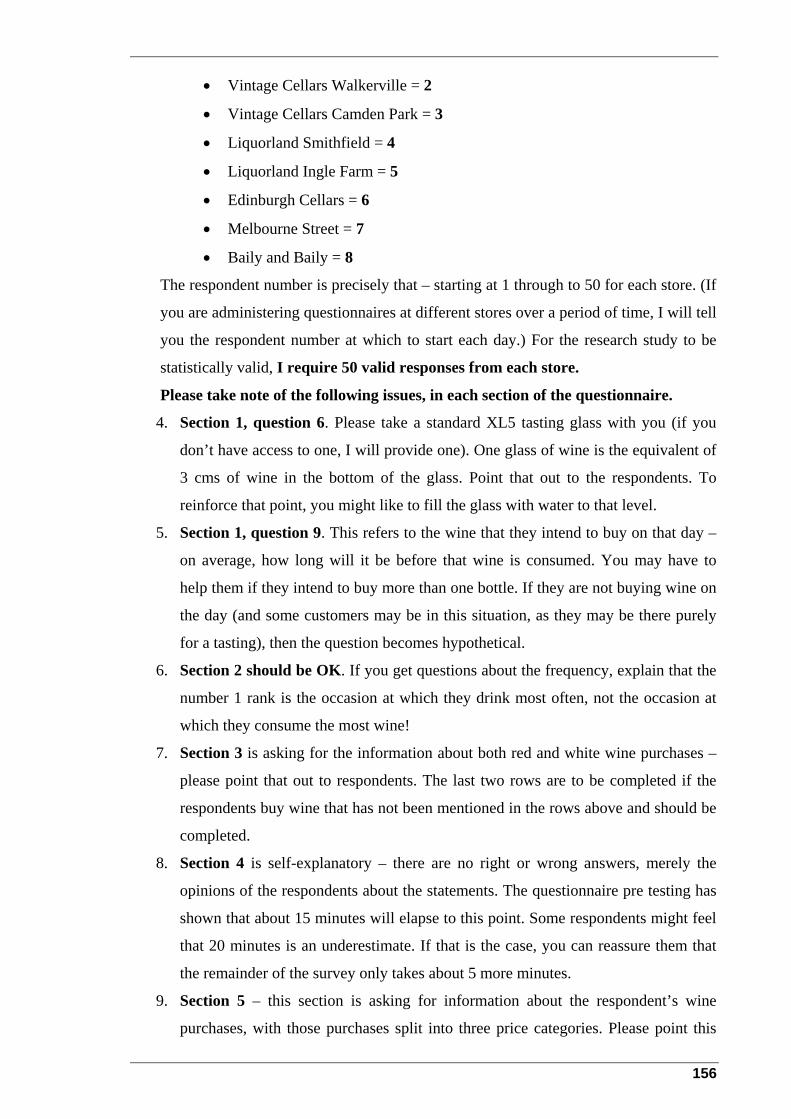
• Vintage Cellars Walkerville = 2
• Vintage Cellars Camden Park = 3
• Liquorland Smithfield = 4
• Liquorland Ingle Farm = 5
• Edinburgh Cellars = 6
• Melbourne Street = 7
• Baily and Baily = 8
The respondent number is precisely that – starting at 1 through to 50 for each store. (If
you are administering questionnaires at different stores over a period of time, I will tell
you the respondent number at which to start each day.) For the research study to be
statistically valid, I require 50 valid responses from each store.
Please take note of the following issues, in each section of the questionnaire.
4. Section 1, question 6. Please take a standard XL5 tasting glass with you (if you
don’t have access to one, I will provide one). One glass of wine is the equivalent of
3 cms of wine in the bottom of the glass. Point that out to the respondents. To
reinforce that point, you might like to fill the glass with water to that level.
5. Section 1, question 9. This refers to the wine that they intend to buy on that day –
on average, how long will it be before that wine is consumed. You may have to
help them if they intend to buy more than one bottle. If they are not buying wine on
the day (and some customers may be in this situation, as they may be there purely
for a tasting), then the question becomes hypothetical.
6. Section 2 should be OK. If you get questions about the frequency, explain that the
number 1 rank is the occasion at which they drink most often, not the occasion at
which they consume the most wine!
7. Section 3 is asking for the information about both red and white wine purchases –
please point that out to respondents. The last two rows are to be completed if the
respondents buy wine that has not been mentioned in the rows above and should be
completed.
8. Section 4 is self-explanatory – there are no right or wrong answers, merely the
opinions of the respondents about the statements. The questionnaire pre testing has
shown that about 15 minutes will elapse to this point. Some respondents might feel
that 20 minutes is an underestimate. If that is the case, you can reassure them that
the remainder of the survey only takes about 5 more minutes.
9. Section 5 – this section is asking for information about the respondent’s wine
purchases, with those purchases split into three price categories. Please point this
156
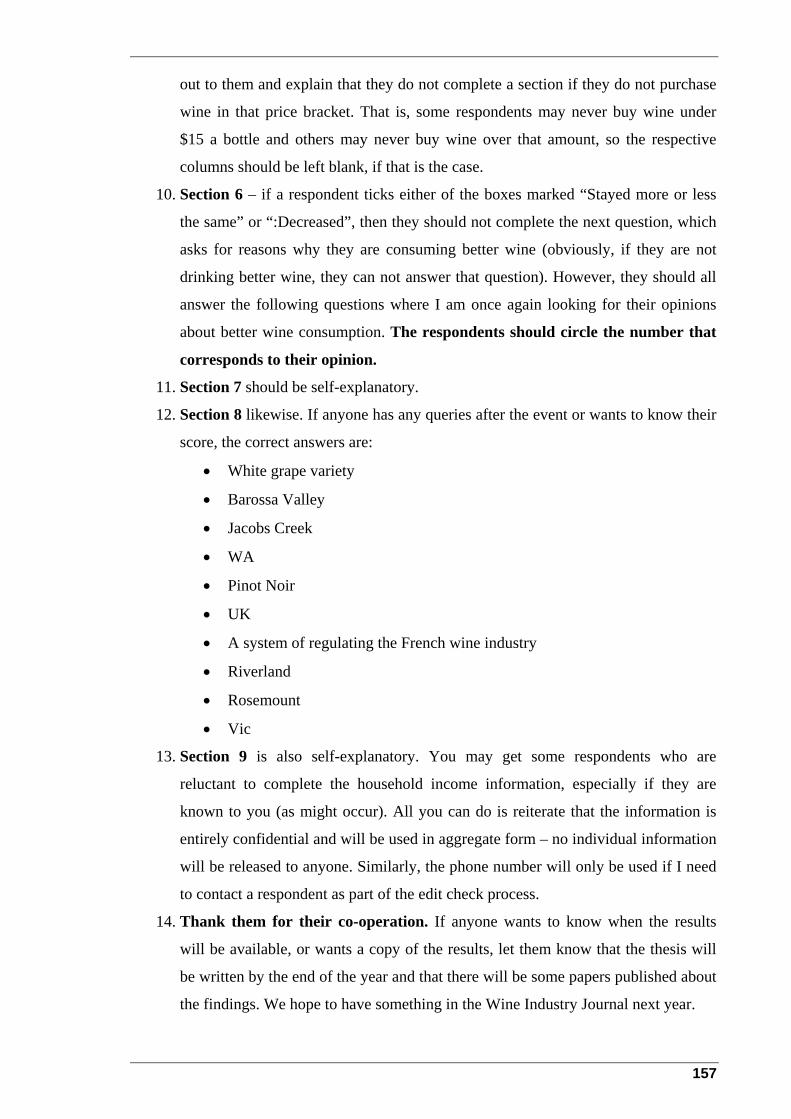
out to them and explain that they do not complete a section if they do not purchase
wine in that price bracket. That is, some respondents may never buy wine under
$15 a bottle and others may never buy wine over that amount, so the respective
columns should be left blank, if that is the case.
10. Section 6 – if a respondent ticks either of the boxes marked “Stayed more or less
the same” or “:Decreased”, then they should not complete the next question, which
asks for reasons why they are consuming better wine (obviously, if they are not
drinking better wine, they can not answer that question). However, they should all
answer the following questions where I am once again looking for their opinions
about better wine consumption. The respondents should circle the number that
corresponds to their opinion.
11. Section 7 should be self-explanatory.
12. Section 8 likewise. If anyone has any queries after the event or wants to know their
score, the correct answers are:
• White grape variety
• Barossa Valley
• Jacobs Creek
• WA
• Pinot Noir
• UK
• A system of regulating the French wine industry
• Riverland
• Rosemount
• Vic
13. Section 9 is also self-explanatory. You may get some respondents who are
reluctant to complete the household income information, especially if they are
known to you (as might occur). All you can do is reiterate that the information is
entirely confidential and will be used in aggregate form – no individual information
will be released to anyone. Similarly, the phone number will only be used if I need
to contact a respondent as part of the edit check process.
14. Thank them for their co-operation. If anyone wants to know when the results
will be available, or wants a copy of the results, let them know that the thesis will
be written by the end of the year and that there will be some papers published about
the findings. We hope to have something in the Wine Industry Journal next year.
157

158

Appendix 3 Principal Component Analysis – Total Variance
Explained
Total Variance Explained
Initial Eigenvalues
Extraction Sums of Squared Loadings
Component Total % of Variance Cumulative %
Total % of Variance Cumulative %
1 9.997 16.389 16.389 9.997 16.389 16.389 2 3.400 5.574 21.963 3.400 5.574 21.963 3 3.309 5.424 27.387 3.309 5.424 27.387 4 2.582 4.232 31.619 2.582 4.232 31.619 5 2.088 3.424 35.043 2.088 3.424 35.043 6 1.699 2.786 37.829 1.699 2.786 37.829 7 1.631 2.673 40.502 1.631 2.673 40.502 8 1.508 2.473 42.975 1.508 2.473 42.975 9 1.486 2.437 45.411 1.486 2.437 45.411
10 1.356 2.224 47.635 1.356 2.224 47.635 11 1.288 2.112 49.747 1.288 2.112 49.747 12 1.282 2.101 51.848 1.282 2.101 51.848 13 1.208 1.980 53.828 1.208 1.980 53.828 14 1.195 1.959 55.787 1.195 1.959 55.787 15 1.146 1.879 57.666 1.146 1.879 57.666 16 1.129 1.851 59.517 1.129 1.851 59.517 17 1.069 1.752 61.269 1.069 1.752 61.269 18 1.025 1.681 62.950 1.025 1.681 62.950 19 1.004 1.646 64.597 1.004 1.646 64.597 20 .950 1.558 66.155 21 .909 1.490 67.644 22 .883 1.448 69.092 23 .858 1.407 70.499 24 .857 1.404 71.904 25 .815 1.335 73.239 26 .793 1.301 74.539
.760 1.246 75.786 28 .740 1.213 76.998 29 .711 1.165 78.163
.672 79.265 31 .663 1.086 80.351 32 .647 1.060 81.411 33 .624 1.023 82.435 34 .599 .982 83.417 35 .586 .961 84.378
.577 85.325 37 .553 .906 86.231 38 .538 .882 87.113 39 .531 .871 87.983
.492 88.790 41 .475 .778 89.568
27
30 1.101
36 .946
40 .807
159
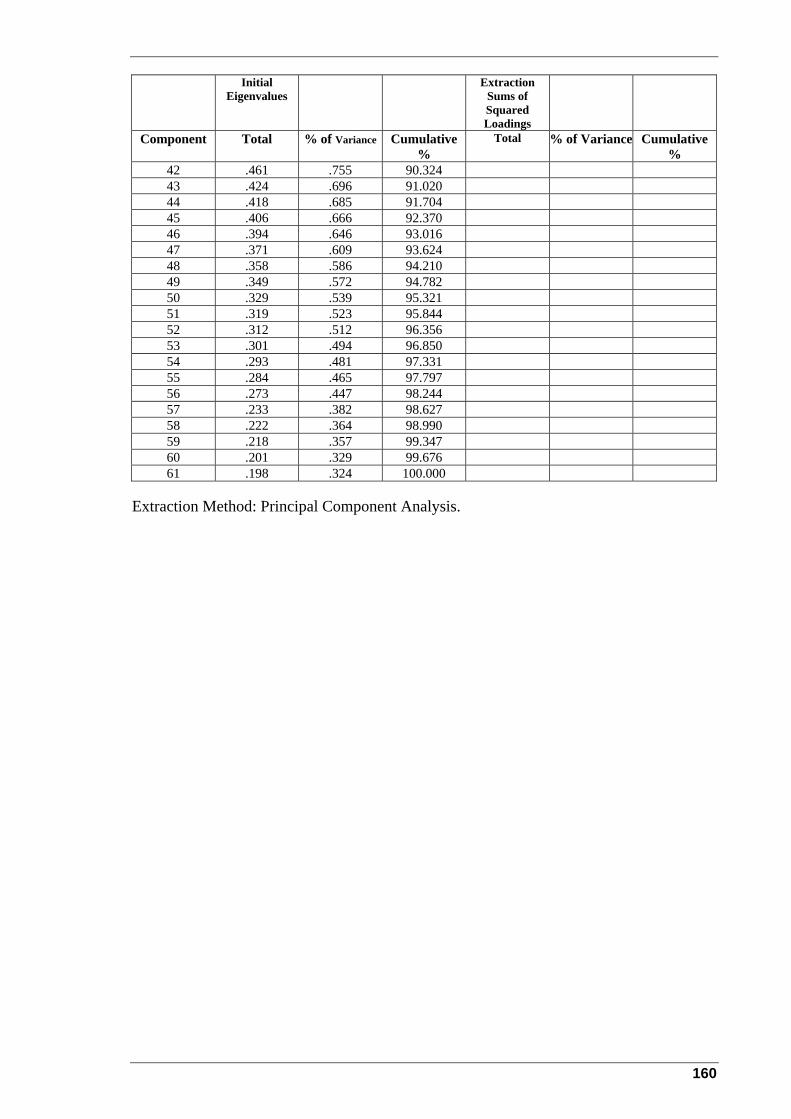
Initial Eigenvalues
Extraction Sums of Squared
Loadings Component Total % of Variance Cumulative
% Total % of Variance Cumulative
% 42 .461 .755 90.324 43 .424 .696 91.020 44 .418 .685 91.704 45 .406 .666 92.370 46 .394 .646 93.016 47 .371 .609 93.624 48 .358 .586 94.210 49 .349 .572 94.782 50 .329 .539 95.321 51 .319 .523 95.844 52 .312 .512 96.356 53 .301 .494 96.850 54 .293 .481 97.331 55 .284 .465 97.797 56 .273 .447 98.244 57 .233 .382 98.627 58 .222 .364 98.990 59 .218 .357 99.347 60 .201 .329 99.676 61 .198 .324 100.000
Extraction Method: Principal Component Analysis.
160
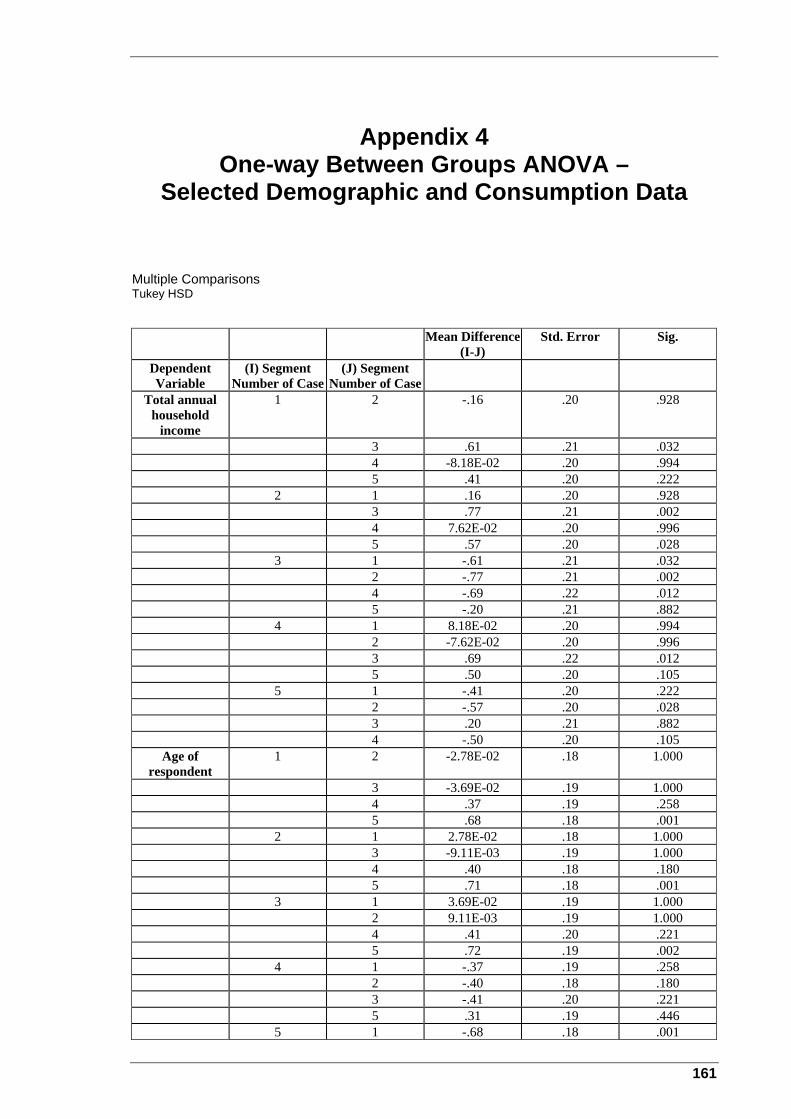
Appendix 4 One-way Between Groups ANOVA –
Selected Demographic and Consumption Data
Multiple Comparisons Tukey HSD
Mean Difference (I-J)
Std. Error Sig.
Dependent Variable
(I) Segment Number of Case
(J) Segment Number of Case
Total annual household
income
1 2 -.16 .20 .928
3 .61 .21 .032 4 -8.18E-02 .20 .994 5 .41 .20 .222 2 1 .16 .20 .928 3 .77 .21 .002 4 7.62E-02 .20 .996 5 .57 .20 .028 3 1 -.61 .21 .032 2 -.77 .21 .002 4 -.69 .22 .012 5 -.20 .21 .882 4 1 8.18E-02 .20 .994 2 -7.62E-02 .20 .996 3 .69 .22 .012 5 .50 .20 .105 5 1 -.41 .20 .222 2 -.57 .20 .028 3 .20 .21 .882 4 -.50 .20 .105
Age of respondent
1 2 -2.78E-02 .18 1.000
3 -3.69E-02 .19 1.000 4 .37 .19 .258
5 .68 .001 2 1 2.78E-02 .18 1.000 3 -9.11E-03 .19 1.000 4 .40 .18 .180 5 .71 .18 .001 3 1 3.69E-02 .19 1.000 2 9.11E-03 .19 1.000 4 .41 .20 .221
5 .72 .19 .002 4 1 -.37 .19
2 -.40 .18 .180 3 -.41 .20 .221
5 .31 .19 .446 5 1 -.68 .18 .001
.18
.258
161
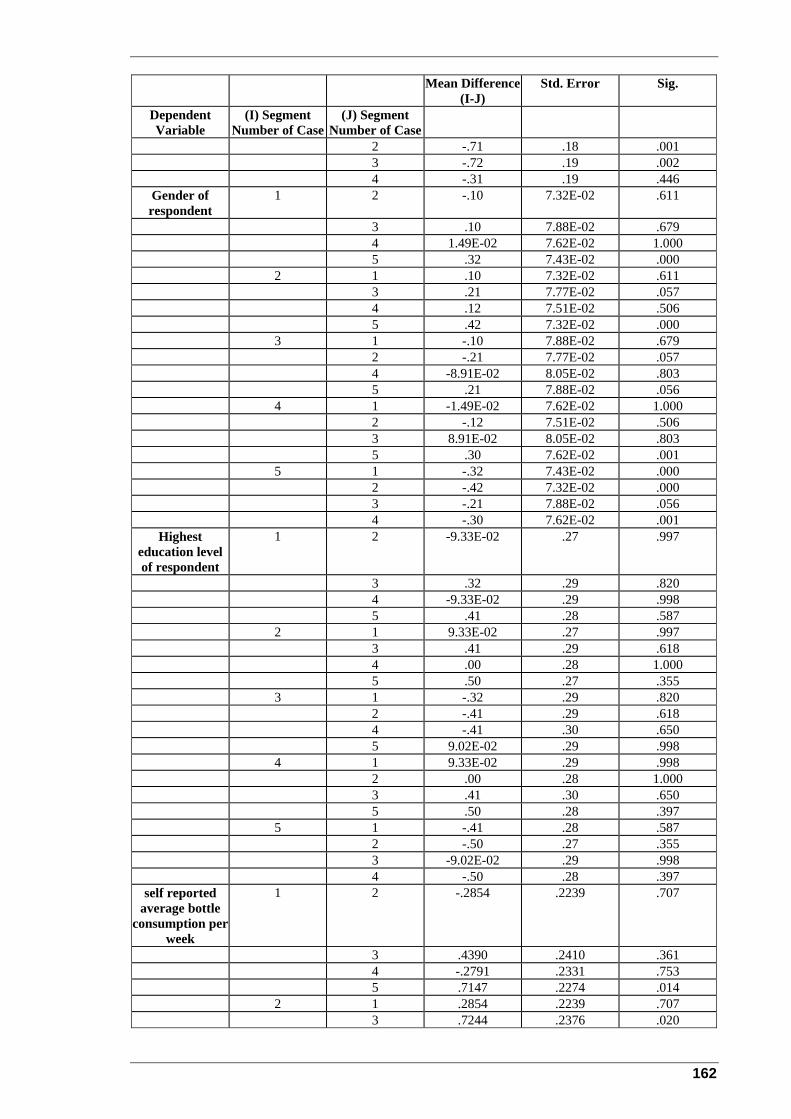
Mean Difference (I-J)
Std. Error Sig.
Dependent Variable
(I) Segment Number of Case
(J) Segment Number of Case
2 -.71 .18 .001 3 -.72 .19 .002 4 -.31 .19 .446
Gender of respondent
1 2 -.10 7.32E-02 .611
3 .10 7.88E-02 .679 4 1.49E-02 7.62E-02 1.000 .32 5 7.43E-02 .000 2 1 .10 7.32E-02 .611 3 .21 7.77E-02 .057 4 .12 7.51E-02 .506
.42 7.32E-02 3 1 -.10 7.88E-02 .679 2 -.21 7.77E-02 .057 4 -8.91E-02 8.05E-02 .803 5 .21 7.88E-02 .056 4 1 -1.49E-02 7.62E-02 1.000 2 -.12 7.51E-02 .506 3 8.91E-02 8.05E-02 .803 5 .30 7.62E-02 .001 5 1 -.32 7.43E-02 .000 2 -.42 7.32E-02 .000 3 -.21 7.88E-02 .056 4 -.30 7.62E-02 .001
Highest education level of respondent
1 2 -9.33E-02 .27 .997
3 .32 .29 .820 4 -9.33E-02 .29 .998 5 .41 .28 .587 2 1 9.33E-02 .27 .997 3 .41 .29 .618 4 .00 .28 1.000 5 .50 .27 .355 3 1 -.32 .29 .820 2 -.41 .29 .618 4 -.41 .30 .650 5 9.02E-02 .29 .998 4 1 9.33E-02 .29 .998 2 .00 .28 1.000 3 .41 .30 .650 5 .50 .28 .397
5 1 -.41 .28 .587 2 -.50 .27 .355 3 -9.02E-02 .29 .998 4 -.50 .28 .397
self reported average bottle
consumption per week
1 2 -.2854 .2239 .707
3 .4390 .2410 .361 4 -.2791 .2331 .753 5 .7147 .2274 .014 2 1 .2854 .2239 .707 3 .7244 .2376 .020
5 .000
162
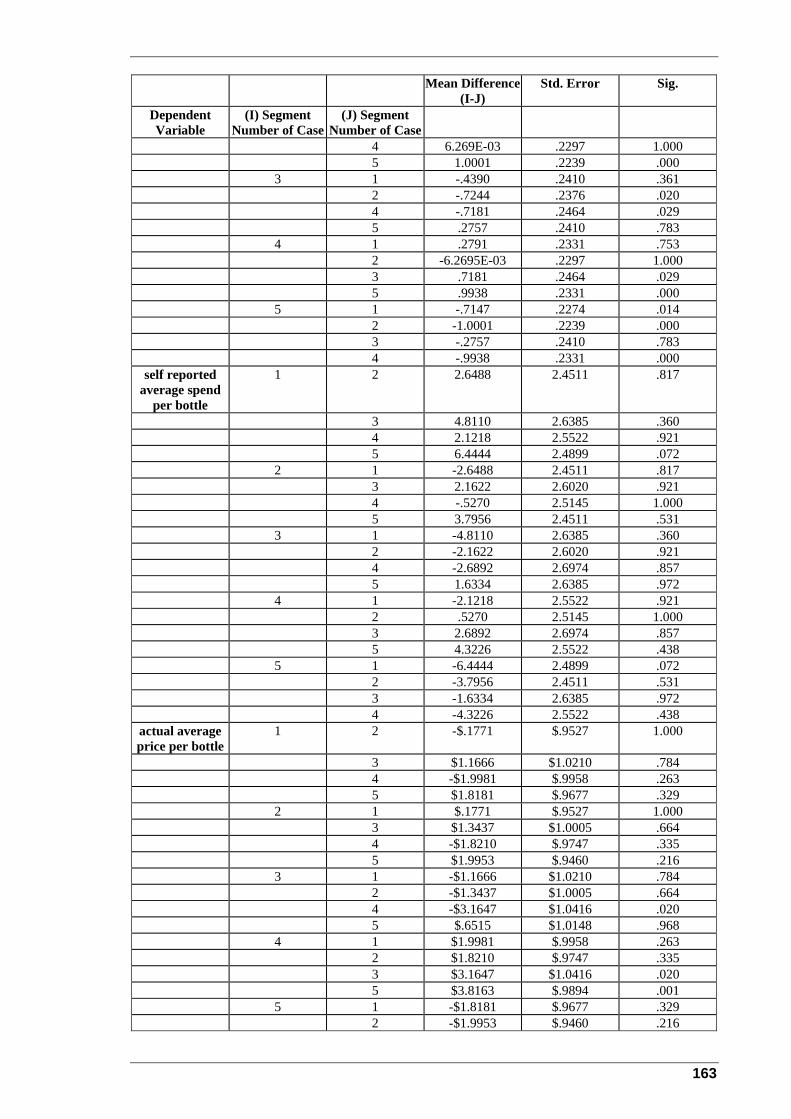
Mean Difference (I-J)
Std. Error Sig.
Dependent Variable
(I) Segment Number of Case
(J) Segment Number of Case
4 6.269E-03 .2297 1.000 5 1.0001 .2239 .000 3 1 -.4390 .2410 .361 2 -.7244 .2376 .020 4 -.7181 .2464 .029 5 .2757 .2410 .783 4 1 .2791 .2331 .753 2 -6.2695E-03 .2297 1.000 3 .7181 .2464 .029 5 .9938 .2331 .000 5 1 -.7147 .2274 .014 2 -1.0001 .2239 .000 3 -.2757 .2410 .783 4 -.9938 .2331 .000
self reported average spend
per bottle
1 2 2.6488 2.4511 .817
3 4.8110 2.6385 .360 4 2.1218 2.5522 .921 5 6.4444 2.4899 .072 2 1 -2.6488 2.4511 .817 3 2.1622 2.6020 .921 4 -.5270 2.5145 1.000 5 3.7956 2.4511 .531 3 1 -4.8110 2.6385 .360 2 -2.1622 2.6020 .921 4 -2.6892 2.6974 .857
5 1.6334 2.6385 .972 4 1 -2.1218 2.5522 .921 2 .5270 2.5145 1.000 3 2.6892 2.6974 .857 5 4.3226 2.5522 .438 5 1 -6.4444 2.4899 .072 2 -3.7956 2.4511 .531 3 -1.6334 2.6385 .972 4 -4.3226 2.5522 .438
actual average price per bottle
1 2 -$.1771 $.9527 1.000
3 $1.0210 .784 4 -$1.9981 $.9958 .263 5 $1.8181 $.9677 .329 2 1 $.1771 $.9527 1.000
3 $1.3437 $1.0005 .664 $.9747 4 -$1.8210 .335 5 $.9460 $1.9953 .216 3 1 -$1.1666 $1.0210
2 -$1.3437 $1.0005 .664 4 -$3.1647 $1.0416 .020 5 $.6515 $1.0148 .968 4 1 $1.9981 $.9958 .263
2 $1.8210 $.9747 .335 3 $3.1647 $1.0416 .020
$3.8163 $.9894 .001 5 1 -$1.8181 .329 $.9677 2 -$1.9953 $.9460 .216
$1.1666
.784
5
163
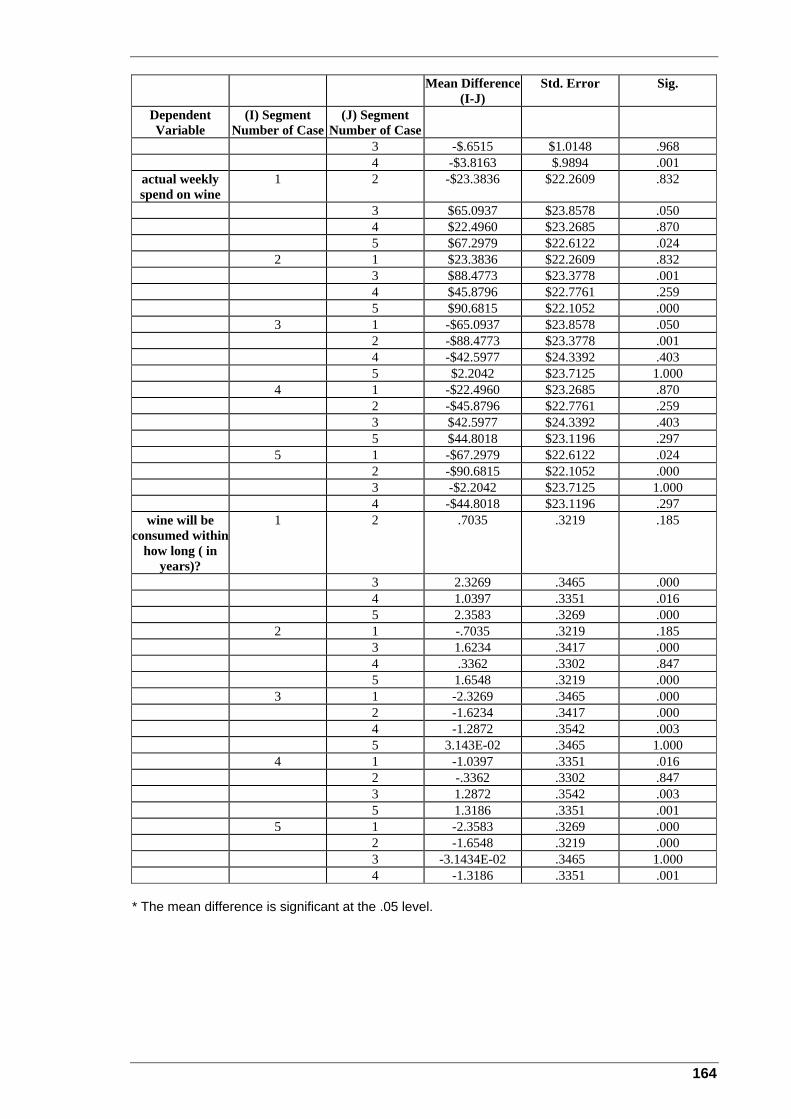
Mean Difference (I-J)
Std. Error Sig.
Dependent Variable
(I) Segment Number of Case
(J) Segment Number of Case
3 -$.6515 $1.0148 .968 4 -$3.8163 $.9894 .001
actual weekly spend on wine
1 2 -$23.3836 $22.2609 .832
3 $65.0937 $23.8578 .050 4 $22.4960 $23.2685 .870 5 $67.2979 $22.6122 .024 2 $22.2609 1 $23.3836 .832 3 $88.4773 $23.3778 .001 4 $45.8796 $22.7761 .259 5 $90.6815 $22.1052 .000 3 1 -$65.0937 $23.8578 .050 2 -$88.4773 $23.3778 .001 4 -$42.5977 $24.3392 .403 5 $2.2042 $23.7125 1.000 4 1 -$22.4960 $23.2685 .870 2 -$45.8796 $22.7761 .259 3 $42.5977 $24.3392 .403 5 $44.8018 $23.1196 .297 5 1 -$67.2979 $22.6122 .024 2 -$90.6815 $22.1052 .000 3 -$2.2042 $23.7125 1.000 4 -$44.8018 $23.1196 .297
wine will be consumed within
how long ( in years)?
1 2 .7035 .3219 .185
3 2.3269 .3465 .000 4 1.0397 .016 .3351
2.3583 .000 1 -.7035 .185 .3219 1.6234 .3417 .000 4 .3302
5 1.6548 .000
5 .3269 2 3
.3362 .847 .3219
3 1 -2.3269 .3465 .000 2 .3417 .000 -1.6234 4 -1.2872 .3542 .003 5 3.143E-02 .3465 1.000 4 1 -1.0397 .3351 .016 2 -.3362 .3302 .847 3 1.2872 .3542 .003 5 1.3186 .3351 .001 5 1 -2.3583 .3269 .000
2 -1.6548 .3219 .000 3 -3.1434E-02 .3465 1.000 4 -1.3186 .3351 .001
* The mean difference is significant at the .05 level.
164
Bibliography
Allen, M., 2002, “Spirits in a can bubble over”, The Weekend Australian Magazine, 5 – 6 January, 2002, p. 31
Berger, N., Anderson, K. & Stringer, R. (1998) Trends in the World Wine Market,
1961–1996. A Statistical Compendium. Centre for International Economic Studies (CIES), University of Adelaide.
Hall, J. & Lockshin, L. S., 1999, Understanding Wine Purchasing - It’s not the consumer, it’s the occasion, Wine Industry Journal, Vol. 14, No. 3, 69 – 78
Jaworski, B.J., & Kohli, J.C., 1993, Market Orientation: Antecedents and Consequences.
Journal of Marketing, Vol. 57, (July 1993), pp.53 – 70.
Bruwer, J., Li, E. & Reid, M., 2001, Wine – Related lifestyle Segmentation of the Australian Domestic Wine Market, The Australian & New Zealand Wine Industry Journal, Vol 16 (2), 104 – 108
Dubow, J. S., 1992, Occasion – Based vs User – Based Benefit Segmentation: A Case
Study, Journal of Advertising Research, March/April 1992, 11 – 18
Garson, G. D., 2001, Factor Analysis, URL: http://www2.chass.ncsu.edu/garson/pa765/factor.htm
Grunert, K. G., Brunso, K. & Bisp, S., Food – related life style: Development of a cross-
culturally valid instrument for market surveillance, MAPP working paper No. 12, October 1993, ISSN 0907 2101
Hall, J. & Winchester, M., 2000, What’s Really Driving Wine Consumers? The Australian
& New Zealand Wine Industry Journal, The First International Wine Marketing Supplement, Vol. 15 (4), 68 – 72, July/August 2000
Heath, R. P., 1995, Psychographics Q’est-Ce Que C’est, Marketing Tools,
November/December 1995, pp. 74 – 81
Jennings, D. &Wood, C., 1994, Wine: Achieving Competitive Advantage Through Design, International Journal of Wine Marketing, Vol. 6, no.1, pp. 49 – 61
Batt, P. J. & Dean, A., 2000, Factors Influencing the Consumer’s Decision, The Australian & New Zealand Wine Industry Journal, The First International Wine Marketing Supplement, Vol. 15 (4), 34 – 41, July/August 2000
Hall, J. & Winchester, M., 1999, An Empirical Confirmation of Segments in the Australian Wine Market, International Journal of Wine Marketing, Vol. 11 (1), 19 – 35
165

Johnson, L. W., Ringham, L., & Jurd. K., 1991, Behavioural Segmentation in the Australian Wine Market Using Conjoint Choice Analysis, International Journal of Wine Marketing, Vol. 3(1), 26 – 31
Judica, F & Perkins, W. S., 1992, A Means-End Approach to the Market for Sparkling
Wines, International Journal of Wine Marketing, Volume 4, No.1, pp. 10 – 18
Kamakura, W. A. & Wedel, M., 1995, Life-Style Segmentation with Tailored Interviewing, Journal of Marketing Research, August 1995, Volume 32, Issue 3, p. 308
Kotler, P., Armstrong, G., Brown, L., Adam, S., & Chandler, P., 2001, Marketing 5th edn, Prentice Hall Australia, Sydney.
Lockshin, L. S., 1999, Wine Marketing: Science or science fiction? Wine Industry Journal,
Vol. 14, No.1, 65 – 67 Lockshin, L. & Kahrimanis, P., 1998, Consumer Evaluation of Retail Wine Stores, Journal
of Wine Research, Vol. 9 (3), 173 – 184
McKinna, D., 1986, Attitudes, Behaviours, Perceptions and Knowledge with Respect to
South Australian Wine, A Report on a Qualitative and Quantitative Research Program, David McKinna et al. Pty. Ltd., Unit 15, Albert Square, 37 Albert Road, Melbourne, 3004.
Macintosh, G. & Lockshin, L. S., 1997, Retail relationships and store loyalty: A multi –
level perspective, International Journal of Research in Marketing, Vol. 14, 487 – 497
Mitchell, V. W. & Greatorex, M., 1989, Risk Reducing Strategies Used in the Purchase of
Wine in the UK, International Journal of Marketing, Vol. 1 (2), 31 – 46
Monash University Faculty of Business and Economics, URL: http://www.buseco.monash.edu.au/Subjects/MKT/MTPonline/segment.html
Narver, J.C., & Slater, S.F., 1990, The Effect of Market Orientation on Business
Profitability, Journal of Marketing, Vol. 54 (October 1990), pp.20 – 35.
nd
Pallant, J., 2001, SPSS Survival Manual A step by step guide to data analysis using SPSS for Windows (Version 10), Allen & Unwin, Australia
Rabobank International (1999), The World Wine Business Report, Rabobank
International, Food and Agribusinesss Research: The Netherlands
Lockshin, L. S., Spawton, A. W. & Macintosh, G., 1997, Using product, brand and purchasing involvement for retail segmentation, Journal of Retailing and Consumer Services, Vol. 4, No. 3. 171 – 183
Neal, C., Quester, P. & Hawkins, D., 1999, Consumer Behaviour, Implications for Marketing Strategy, 2 Edition, McGraw – Hill, Australia
166
167
Sanchez, M. & Gil, J. M., 1998, Consumer preferences for Wine Attributes in Different Retail Stores: A Conjoint Approach, International Journal of Wine Marketing, Vol. 10(1), 25 – 38
Schiffman, L., Bednall, D., Cowley, E., O’Cass, A., Watson, J. & Kanuk, L., 2001, Consumer Behaviour, 2nd Edition, Prentice Hall International
Sharp, B., 1991, Marketing Orientation: More Than Just Customer Focus, International
Journal of Wine Marketing, Volume 3, No. 1, pp. 20 – 25 Slater, S.F., & Narver, J.C., 1995, Market orientation and the learning organization
Journal of Marketing, Vol. 59 (July 1995), pp.63 – 74. Spahni, P., 1999, “World Wine Developments in the 1990’s: An Update on Trade”, CIES
Discussion Paper No. 99/10, University of Adelaide, Adelaide, SA 5005, Australia
Spahni, P., 2000 The International Wine Trade (2nd edition), Woodhead Publishing
Limited: Cambridge, UK
Spawton, A. L., 1991a, Grapes and Wine Seminar – Prospering in the 1990s: Changing Your View of the Consumer, International Journal of Wine Marketing, Vol. 3(1), 32 – 41
Spawton, A. L., 1991b, Of Wine and Live Asses: An Introduction to the Wine Economy
and State of Marketing, European Journal of Wine Marketing, 25(3), 1 – 48
Sweeney, J. C., Soutar, G. N. & Johnson, L. W., 1999, The Role of Perceived Risk in the Quality – Value Relationship: A study in a Retail Environment, Journal of Retailing, Spring 1999, Vol. 75 i1 p. 77(2)
The Marketing Decade Setting the Australian Wine Marketing Agenda 2000 – 2010,
Winemakers’ Federation of Australia, Australian Wine and Brandy Corporation, 2000
Wedel, M. & Kamakura, W., 2000, Market Segmentation Conceptual and Methodological Foundations, 2nd Edition, Kluwer Academic Publishers
Winetitles, 2001, The Australian and New Zealand Wine Industry Directory, 19th Annual Edition, Winetitles, Adelaide, Australia
Wyner, G., 1992, Segmentation Design, Marketing Research, Volume 4 (December 1992),
Issue 4, pp 38 – 42 Wyner, G., 1995, Segmentation Analysis, then and now, Marketing Research, Winter 95,
Vol. 7 (1), pp. 40 – 42