LifeMode Group: Hometown 12D Modest Income...
4
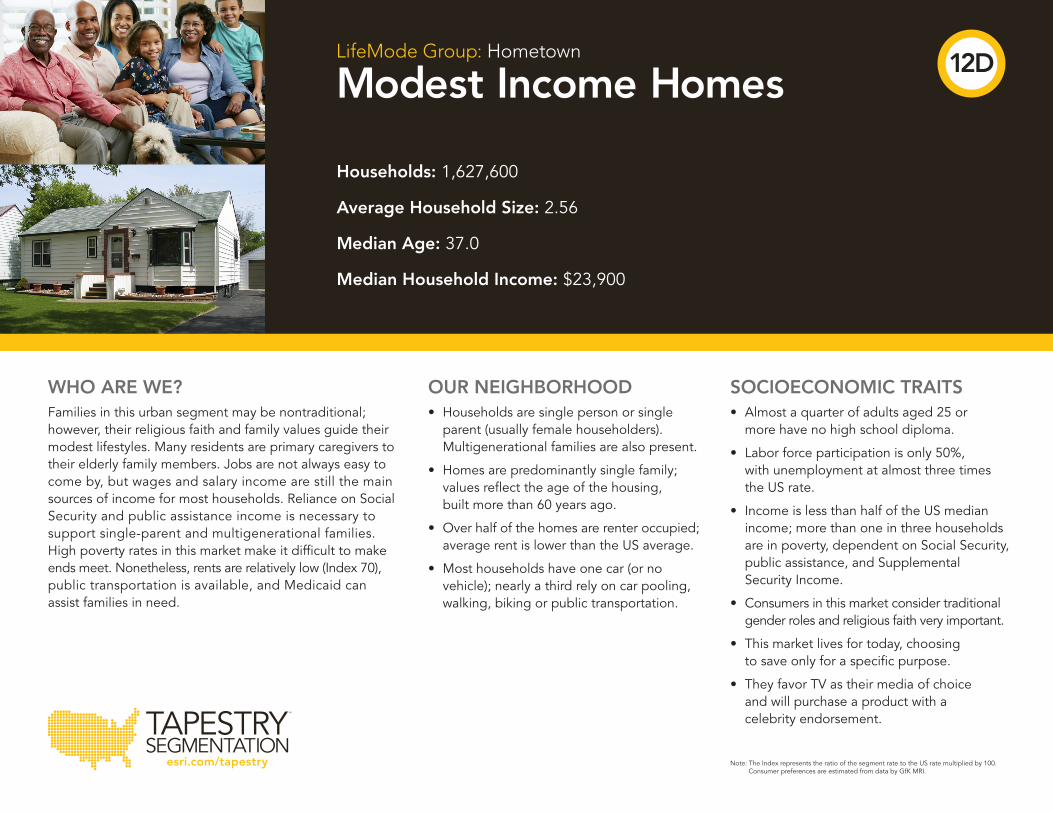
TAPESTRY SEGMENTATION TM esri.com/tapestry Households: 1,627,600 Average Household Size: 2.56 Median Age: 37.0 Median Household Income: $23,900 LifeMode Group: Hometown Modest Income Homes WHO ARE WE? Families in this urban segment may be nontraditional; however, their religious faith and family values guide their modest lifestyles. Many residents are primary caregivers to their elderly family members. Jobs are not always easy to come by, but wages and salary income are still the main sources of income for most households. Reliance on Social Security and public assistance income is necessary to support single-parent and multigenerational families. High poverty rates in this market make it difficult to make ends meet. Nonetheless, rents are relatively low (Index 70), public transportation is available, and Medicaid can assist families in need. OUR NEIGHBORHOOD • Households are single person or single parent (usually female householders). Multigenerational families are also present. • Homes are predominantly single family; values reflect the age of the housing, built more than 60 years ago. • Over half of the homes are renter occupied; average rent is lower than the US average. • Most households have one car (or no vehicle); nearly a third rely on car pooling, walking, biking or public transportation. SOCIOECONOMIC TRAITS • Almost a quarter of adults aged 25 or more have no high school diploma. • Labor force participation is only 50%, with unemployment at almost three times the US rate. • Income is less than half of the US median income; more than one in three households are in poverty, dependent on Social Security, public assistance, and Supplemental Security Income. • Consumers in this market consider traditional gender roles and religious faith very important. • This market lives for today, choosing to save only for a specific purpose. • They favor TV as their media of choice and will purchase a product with a celebrity endorsement. Note: The Index represents the ratio of the segment rate to the US rate multiplied by 100. Consumer preferences are estimated from data by GfK MRI. 12D
Transcript of LifeMode Group: Hometown 12D Modest Income...
TAPESTRYSEGMENTATION
TM
esri.com/tapestry
Households: 1,627,600
Average Household Size: 2.56
Median Age: 37.0
Median Household Income: $23,900
LifeMode Group: Hometown
Modest Income Homes
WHO ARE WE?Families in this urban segment may be nontraditional; however, their religious faith and family values guide their modest lifestyles. Many residents are primary caregivers to their elderly family members. Jobs are not always easy to come by, but wages and salary income are still the main sources of income for most households. Reliance on Social Security and public assistance income is necessary to support single-parent and multigenerational families. High poverty rates in this market make it difficult to make ends meet. Nonetheless, rents are relatively low (Index 70), public transportation is available, and Medicaid can assist families in need.
OUR NEIGHBORHOOD• Households are single person or single parent (usually female householders). Multigenerational families are also present.
• Homes are predominantly single family; values reflect the age of the housing, built more than 60 years ago.
• Over half of the homes are renter occupied; average rent is lower than the US average.
• Most households have one car (or no vehicle); nearly a third rely on car pooling, walking, biking or public transportation.
SOCIOECONOMIC TRAITS• Almost a quarter of adults aged 25 or more have no high school diploma.
• Labor force participation is only 50%, with unemployment at almost three times the US rate.
• Income is less than half of the US median income; more than one in three households are in poverty, dependent on Social Security, public assistance, and Supplemental Security Income.
• Consumers in this market consider traditional gender roles and religious faith very important.
• This market lives for today, choosing to save only for a specific purpose.
• They favor TV as their media of choice and will purchase a product with a celebrity endorsement.
Note: The Index represents the ratio of the segment rate to the US rate multiplied by 100. Consumer preferences are estimated from data by GfK MRI.
12D
TAPESTRYSEGMENTATION
TM
esri.com/tapestry
LifeMode Group: Hometown
Modest Income Homes12D
85+80–8475–7970–7465–6960–6455–5950–5445–4940–4435–3930–3425–2920–2415–1910–14
5–9<5
8% 4% 0 4% 8%
Male Female
Median Household Income
Median Net Worth
$56,100
$93,300
$23,900
$12,400
$0 $100,000 $200,000 $300,000 $400,000 $500,000 $600,000
EsriMedianHHIncome
EsriMedianNetWorth
Series2 Series1
$56,100
$93,300
$23,900
$12,400
$0 $100,000 $200,000 $300,000 $400,000 $500,000 $600,000
EsriMedianHHIncome
EsriMedianNetWorth
Series2 Series1
Housing
Food
Apparel & Services
Transportation
Health Care
Entertainment & Recreation
Education
Pensions & Social Security
Other
0.0% 0.5% 1.0% 1.5% 2.0% 2.5% 3.0% 3.5% 4.0%
MaleAge0-4
MaleAge5-9
MaleAge10-14
MaleAge15-19
MaleAge20-24
MaleAge25-29
MaleAge30-34
MaleAge35-39
MaleAge40-44
MaleAge45-49
MaleAge50-54
MaleAge55-59
MaleAge60-64
MaleAge65-69
MaleAge70-74
MaleAge75-79
MaleAge80-84
MaleAge85+
AgebySex- Male
Series2 Series1
0.0% 0.5% 1.0% 1.5% 2.0% 2.5% 3.0% 3.5% 4.0%
FemaleAge0-4
FemaleAge5-9
FemaleAge10-14
FemaleAge15-19
FemaleAge20-24
FemaleAge25-29
FemaleAge30-34
FemaleAge35-39
FemaleAge40-44
FemaleAge45-49
FemaleAge50-54
FemaleAge55-59
FemaleAge60-64
FemaleAge65-69
FemaleAge70-74
FemaleAge75-79
FemaleAge80-84
FemaleAge85+
ChartTitle
Series2 Series1
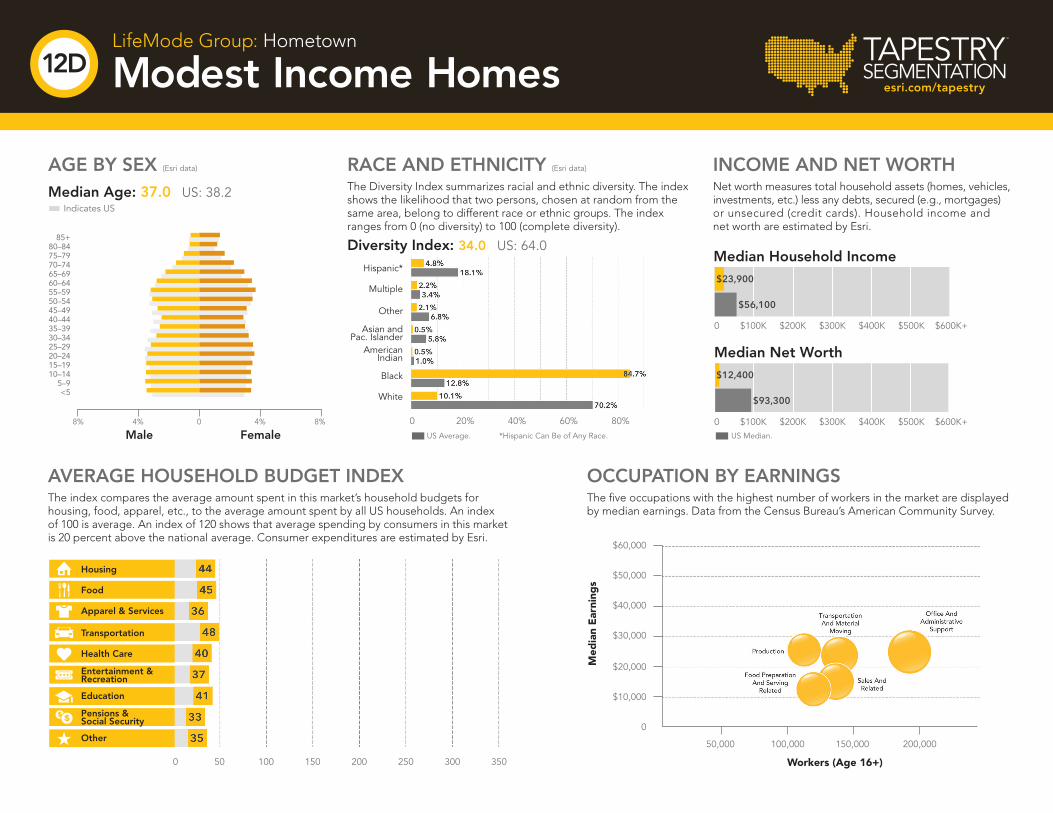
INCOME AND NET WORTHNet worth measures total household assets (homes, vehicles, investments, etc.) less any debts, secured (e.g., mortgages) or unsecured (credit cards). Household income and net worth are estimated by Esri.
OCCUPATION BY EARNINGSThe five occupations with the highest number of workers in the market are displayed by median earnings. Data from the Census Bureau’s American Community Survey.
AVERAGE HOUSEHOLD BUDGET INDEXThe index compares the average amount spent in this market’s household budgets for housing, food, apparel, etc., to the average amount spent by all US households. An index of 100 is average. An index of 120 shows that average spending by consumers in this market is 20 percent above the national average. Consumer expenditures are estimated by Esri.
AGE BY SEX (Esri data)
Median Age: 37.0 US: 38.2 Indicates US
RACE AND ETHNICITY (Esri data)
The Diversity Index summarizes racial and ethnic diversity. The index shows the likelihood that two persons, chosen at random from the same area, belong to different race or ethnic groups. The index ranges from 0 (no diversity) to 100 (complete diversity).
Diversity Index: 34.0 US: 64.0
Hispanic*
Multiple
Other
Asian and Pac. Islander
American Indian
Black
White
$60,000
$50,000
$40,000
$30,000
$20,000
$10,000
0
50,000 100,000 150,000 200,000
*Hispanic Can Be of Any Race.
0 20% 40% 60% 80%
0 50 100 150 200 250 300 350
0 $100K $200K $300K $400K $500K $600K+
0 $100K $200K $300K $400K $500K $600K+US Average. US Median.
Med
ian
Ear
ning
s
Workers (Age 16+)
Own44.7%
Rent55.3%
ChartTitle
Own Rent
Population
Population Growth (Annual %)
Population Density (Persons per sq. mile)
350
350
350
0
0
0
900,000
-0.5%
0
11,000,000
3.0%
25,000
4,299,900
-0.2%
1000
Wealth Index
Socioeconomic Status Index
Housing Affordability Index
56
28
157742
HomeOwnershipUS Percentage:
62.7% Own 37.3% Rent
TAPESTRYSEGMENTATION
TM
esri.com/tapestry
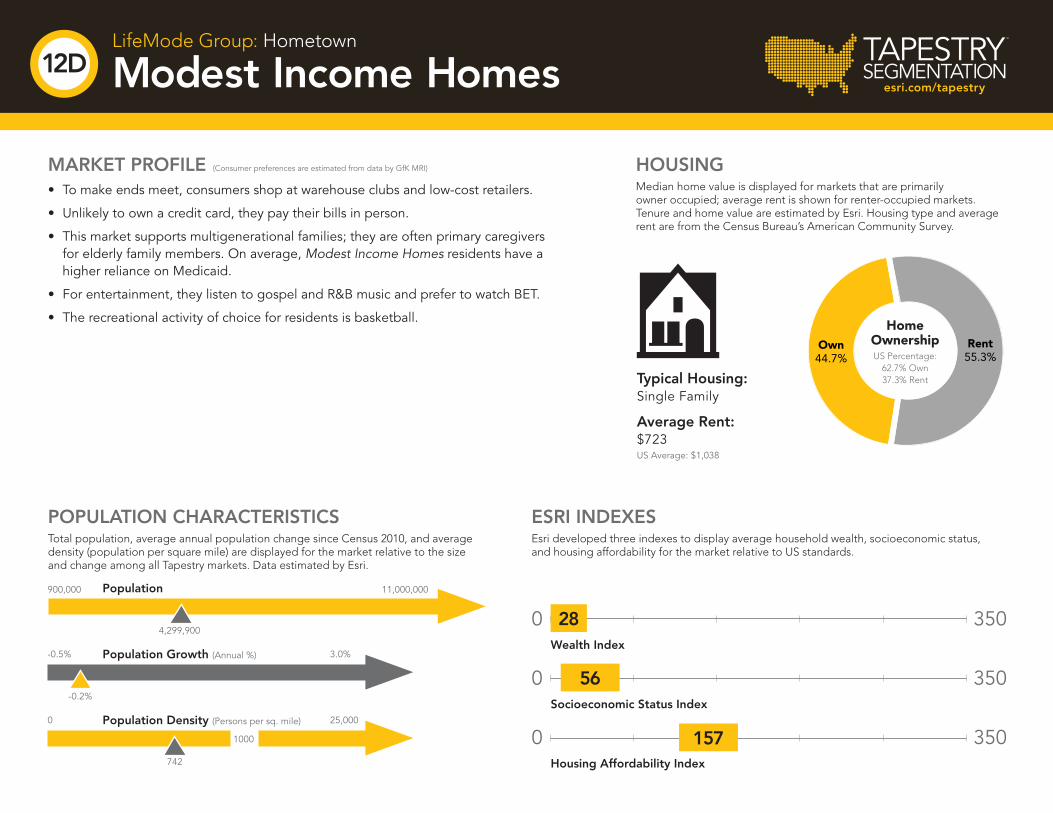
MARKET PROFILE (Consumer preferences are estimated from data by GfK MRI)
• To make ends meet, consumers shop at warehouse clubs and low-cost retailers.
• Unlikely to own a credit card, they pay their bills in person.
• This market supports multigenerational families; they are often primary caregivers for elderly family members. On average, Modest Income Homes residents have a higher reliance on Medicaid.
• For entertainment, they listen to gospel and R&B music and prefer to watch BET.
• The recreational activity of choice for residents is basketball.
ESRI INDEXESEsri developed three indexes to display average household wealth, socioeconomic status, and housing affordability for the market relative to US standards.
POPULATION CHARACTERISTICSTotal population, average annual population change since Census 2010, and average density (population per square mile) are displayed for the market relative to the size and change among all Tapestry markets. Data estimated by Esri.
LifeMode Group: Hometown
Modest Income Homes12D
HOUSINGMedian home value is displayed for markets that are primarily owner occupied; average rent is shown for renter-occupied markets. Tenure and home value are estimated by Esri. Housing type and average rent are from the Census Bureau’s American Community Survey.
Typical Housing:Single Family
Average Rent:$723US Average: $1,038

High
Low
TAPESTRYSEGMENTATION
TM
esri.com/tapestry
SEGMENT DENSITYThis map illustrates the density and distribution of the Modest Income Homes Tapestry Segment by households.
LifeMode Group: Hometown
Modest Income Homes12D
For more information1-800-447-9778
Copyright © 2018 Esri. All rights reserved. Esri, the Esri globe logo, Tapestry, @esri.com, and esri.com are trademarks, service marks, or registered marks of Esri in the United States, the European Community, or certain other jurisdictions. Other companies and products or services mentioned herein may be trademarks, service marks, or registered marks of their respective mark owners.
G79488