LifeMode Group: GenXurban 5D Rustbelt...
4
TAPESTRY SEGMENTATION TM esri.com/tapestry Households: 2,716,800 Average Household Size: 2.47 Median Age: 39.0 Median Household Income: $51,800 LifeMode Group: GenXurban Rustbelt Traditions WHO ARE WE? The backbone of older industrial cities in states surrounding the Great Lakes, Rustbelt Traditions residents are a mix of married-couple families and singles living in older developments of single-family homes. While varied, the work force is primarily white collar, with a higher concentration of skilled workers in manufacturing, retail trade, and health care. Rustbelt Traditions represents a large market of stable, hard-working consumers with modest incomes but an average net worth of nearly $400,000. Family oriented, they value time spent at home. Most have lived, worked, and played in the same area for years. OUR NEIGHBORHOOD • Almost half (46%) of the households are married-couple families, similar to the US (48%), most without children (also similar to the US); the slightly higher proportion of singles (Index 105) reflects the aging of the population. • Average household size is slightly lower at 2.47. • They are movers, slightly more mobile than the US population (Index 109), but over 70 percent of house holders moved into their current homes before 2010. • Most residents live in modest, single-family homes in older neighborhoods built in the 1950s (Index 224). • Nearly three quarters own their homes; nearly half of households have mortgages. • A large and growing market, Rustbelt Traditions residents are located in the dense urban fringe of metropolitan areas throughout the Midwest and South. • Most households have 1 to 2 vehicles available. SOCIOECONOMIC TRAITS • Most have graduated from high school or spent some time at a college or university. • Unemployment below the US at 5.2%; labor force participation slightly higher than the US at 67%. • While most income derived from wages and salaries, nearly 31% of households collecting Social Security and nearly 20% drawing income from retirement accounts. • Family-oriented consumers who value time spent at home. • Most lived, worked, and played in the same area for years. • Budget aware shoppers that favor American-made products. • Read newspapers, especially the Sunday editions. Note: The Index represents the ratio of the segment rate to the US rate multiplied by 100. Consumer preferences are estimated from data by GfK MRI. 5D
Transcript of LifeMode Group: GenXurban 5D Rustbelt...
TAPESTRYSEGMENTATION
TM
esri.com/tapestry
Households: 2,716,800
Average Household Size: 2.47
Median Age: 39.0
Median Household Income: $51,800
LifeMode Group: GenXurban
Rustbelt Traditions
WHO ARE WE?The backbone of older industrial cities in states surrounding the Great Lakes, Rustbelt Traditions residents are a mix of married-couple families and singles living in older developments of single-family homes. While varied, the work force is primarily white collar, with a higher concentration of skilled workers in manufacturing, retail trade, and health care. Rustbelt Traditions represents a large market of stable, hard-working consumers with modest incomes but an average net worth of nearly $400,000. Family oriented, they value time spent at home. Most have lived, worked, and played in the same area for years.
OUR NEIGHBORHOOD• Almost half (46%) of the households are married-couple families, similar to the US (48%), most without children (also similar to the US); the slightly higher proportion of singles (Index 105) reflects the aging of the population.
• Average household size is slightly lower at 2.47.
• They are movers, slightly more mobile than the US population (Index 109), but over 70 percent of house holders moved into their current homes before 2010.
• Most residents live in modest, single-family homes in older neighborhoods built in the 1950s (Index 224).
• Nearly three quarters own their homes; nearly half of households have mortgages.
• A large and growing market, Rustbelt Traditions residents are located in the dense urban fringe of metropolitan areas throughout the Midwest and South.
• Most households have 1 to 2 vehicles available.
SOCIOECONOMIC TRAITS• Most have graduated from high school or spent some time at a college or university.
• Unemployment below the US at 5.2%; labor force participation slightly higher than the US at 67%.
• While most income derived from wages and salaries, nearly 31% of households collecting Social Security and nearly 20% drawing income from retirement accounts.
• Family-oriented consumers who value time spent at home.
• Most lived, worked, and played in the same area for years.
• Budget aware shoppers that favor American-made products.
• Read newspapers, especially the Sunday editions.
Note: The Index represents the ratio of the segment rate to the US rate multiplied by 100. Consumer preferences are estimated from data by GfK MRI.
5D
TAPESTRYSEGMENTATION
TM
esri.com/tapestry
LifeMode Group: GenXurban
Rustbelt Traditions5D
85+80–8475–7970–7465–6960–6455–5950–5445–4940–4435–3930–3425–2920–2415–1910–14
5–9<5
8% 4% 0 4% 8%
Male Female
Median Household Income
Median Net Worth
$56,100
$93,300
$51,800
$98,100
$0 $100,000 $200,000 $300,000 $400,000 $500,000 $600,000
EsriMedianHHIncome
EsriMedianNetWorth
Series2 Series1
$56,100
$93,300
$51,800
$98,100
$0 $100,000 $200,000 $300,000 $400,000 $500,000 $600,000
EsriMedianHHIncome
EsriMedianNetWorth
Series2 Series1
Housing
Food
Apparel & Services
Transportation
Health Care
Entertainment & Recreation
Education
Pensions & Social Security
Other
!"!# $!"%# $&"!# $&"%#$'"!# $'"%# $("!# $("%# $)"!# $
!"#$%&'$%()*
!"#$%&'$%+),
!"#$%&'$%-()-*
!"#$%&'$%-+)-, $
!"#$%&'$%.().*
!"#$%&'$%.+)., $
!"#$%&'$%/()/*$
!"#$%&'$%/+)/, $
!"#$%&'$%*()**$
!"#$%&'$%*+)*, $
!"#$%&'$%+()+*$
!"#$%&'$%++)+, $
!"#$%&'$%0()0*$
!"#$%&'$%0+)0, $
!"#$%&'$%1()1*$
!"#$%&'$%1+)1, $
!"#$%&'$%2()2*$
!"#$%&'$%2+3
&'$%45%6$7%) !"#$
6$89$:. 6$89$:-
!"!# $ !"%# $ &"!# $ &"%#$ '"!# $ '"%# $ ("!# $ ("%# $ )"!# $
!"#$%"&'("&)*+
!"#$%"&'("&,*-
!"#$%"&'("&.) *.+
!"#$%"&'("&., *.-
!"#$%"&'("&/) */+
!"#$%"&'("&/, */-
!"#$%"&'("&0)*0+
!"#$%"&'("&0,*0-
!"#$%"&'("&+)*++
!"#$%"&'("&+,*+-
!"#$%"&'("&,) *,+
!"#$%"&'("&,, *,-
!"#$%"&'("&1)*1+
!"#$%"&'("&1,*1-
!"#$%"&'("&2)*2+
!"#$%"&'("&2,*2-
!"#$%"&'("&3)*3+
!"#$%"&'("&3,4
56$78&9:8%"
;"7:"</ ;"7:"<.
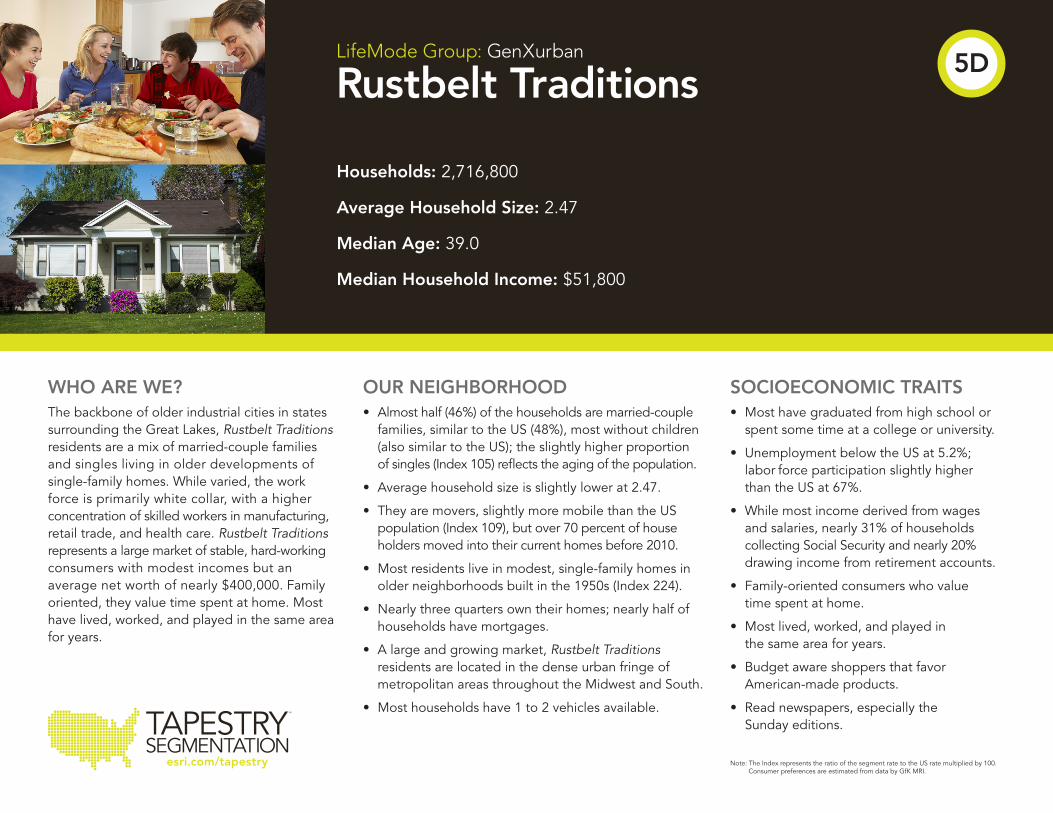
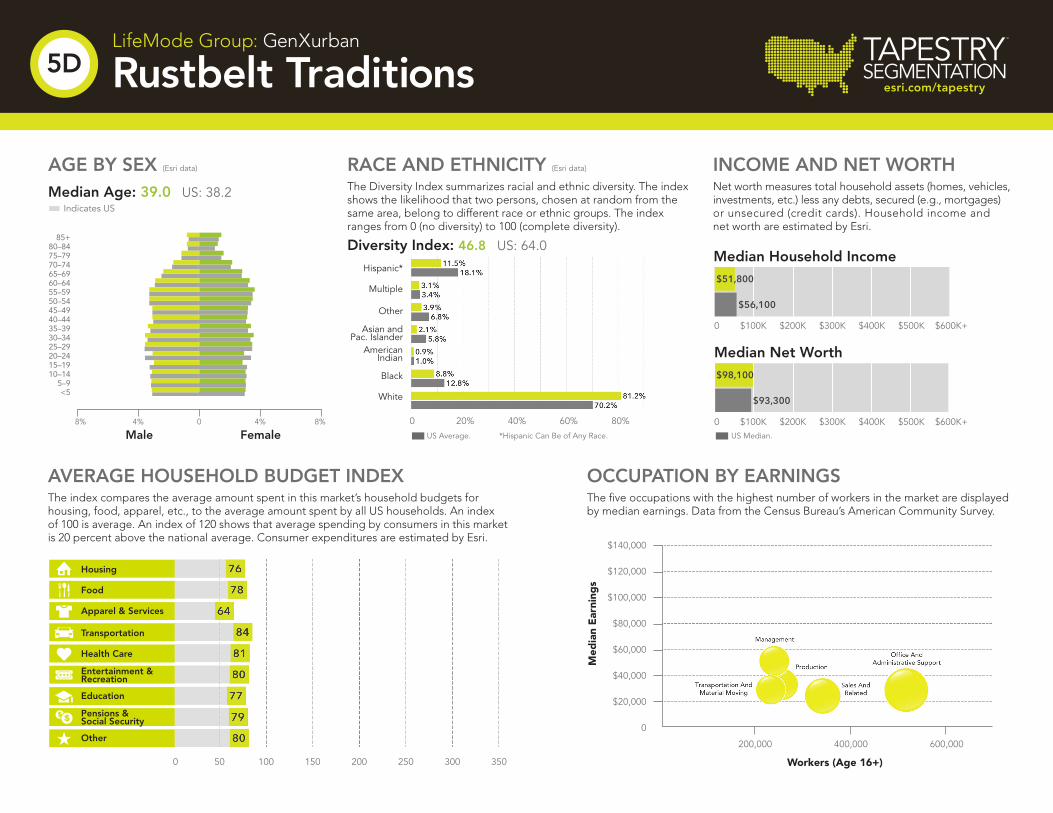
INCOME AND NET WORTHNet worth measures total household assets (homes, vehicles, investments, etc.) less any debts, secured (e.g., mortgages) or unsecured (credit cards). Household income and net worth are estimated by Esri.
OCCUPATION BY EARNINGSThe five occupations with the highest number of workers in the market are displayed by median earnings. Data from the Census Bureau’s American Community Survey.
AVERAGE HOUSEHOLD BUDGET INDEXThe index compares the average amount spent in this market’s household budgets for housing, food, apparel, etc., to the average amount spent by all US households. An index of 100 is average. An index of 120 shows that average spending by consumers in this market is 20 percent above the national average. Consumer expenditures are estimated by Esri.
AGE BY SEX (Esri data)
Median Age: 39.0 US: 38.2 Indicates US
RACE AND ETHNICITY (Esri data)
The Diversity Index summarizes racial and ethnic diversity. The index shows the likelihood that two persons, chosen at random from the same area, belong to different race or ethnic groups. The index ranges from 0 (no diversity) to 100 (complete diversity).
Diversity Index: 46.8 US: 64.0
Hispanic*
Multiple
Other
Asian and Pac. Islander
American Indian
Black
White
$140,000
$120,000
$100,000
$80,000
$60,000
$40,000
$20,000
0
200,000 20 400,000 6 600,000
*Hispanic Can Be of Any Race.
0 20% 40% 60% 80%
0 50 100 150 200 250 300 350
0 $100K $200K $300K $400K $500K $600K+
0 $100K $200K $300K $400K $500K $600K+US Average. US Median.
Med
ian
Ear
ning
s
Workers (Age 16+)
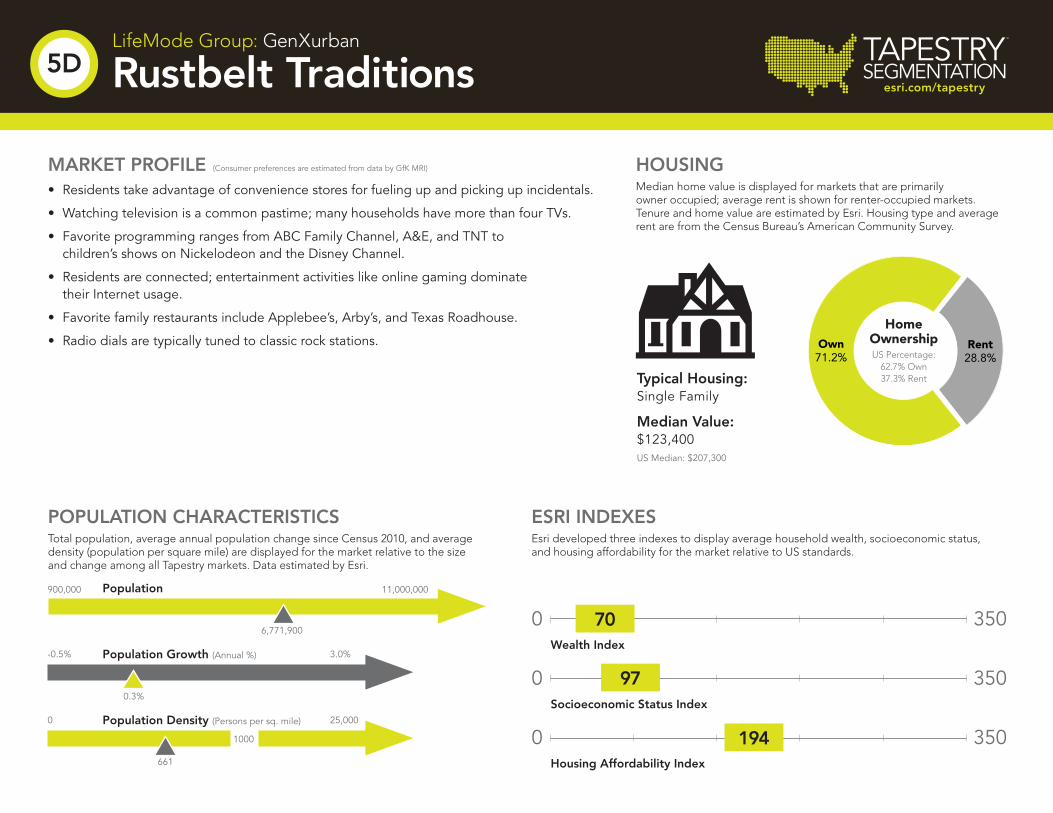
Own71.2%
Rent28.8%
ChartTitle
Own Rent
HomeOwnershipUS Percentage:
62.7% Own 37.3% Rent
Population
Population Growth (Annual %)
Population Density (Persons per sq. mile)
350
350
350
0
0
0
900,000
-0.5%
0
11,000,000
3.0%
25,000
6,771,900
0.3%
661
1000
Wealth Index
Socioeconomic Status Index
Housing Affordability Index
70
97
194
TAPESTRYSEGMENTATION
TM
esri.com/tapestry
MARKET PROFILE (Consumer preferences are estimated from data by GfK MRI)
• Residents take advantage of convenience stores for fueling up and picking up incidentals.
• Watching television is a common pastime; many households have more than four TVs.
• Favorite programming ranges from ABC Family Channel, A&E, and TNT to children’s shows on Nickelodeon and the Disney Channel.
• Residents are connected; entertainment activities like online gaming dominate their Internet usage.
• Favorite family restaurants include Applebee’s, Arby’s, and Texas Roadhouse.
• Radio dials are typically tuned to classic rock stations.
ESRI INDEXESEsri developed three indexes to display average household wealth, socioeconomic status, and housing affordability for the market relative to US standards.
POPULATION CHARACTERISTICSTotal population, average annual population change since Census 2010, and average density (population per square mile) are displayed for the market relative to the size and change among all Tapestry markets. Data estimated by Esri.
LifeMode Group: GenXurban
Rustbelt Traditions5D
HOUSINGMedian home value is displayed for markets that are primarily owner occupied; average rent is shown for renter-occupied markets. Tenure and home value are estimated by Esri. Housing type and average rent are from the Census Bureau’s American Community Survey.
Typical Housing:Single Family
Median Value:$123,400US Median: $207,300
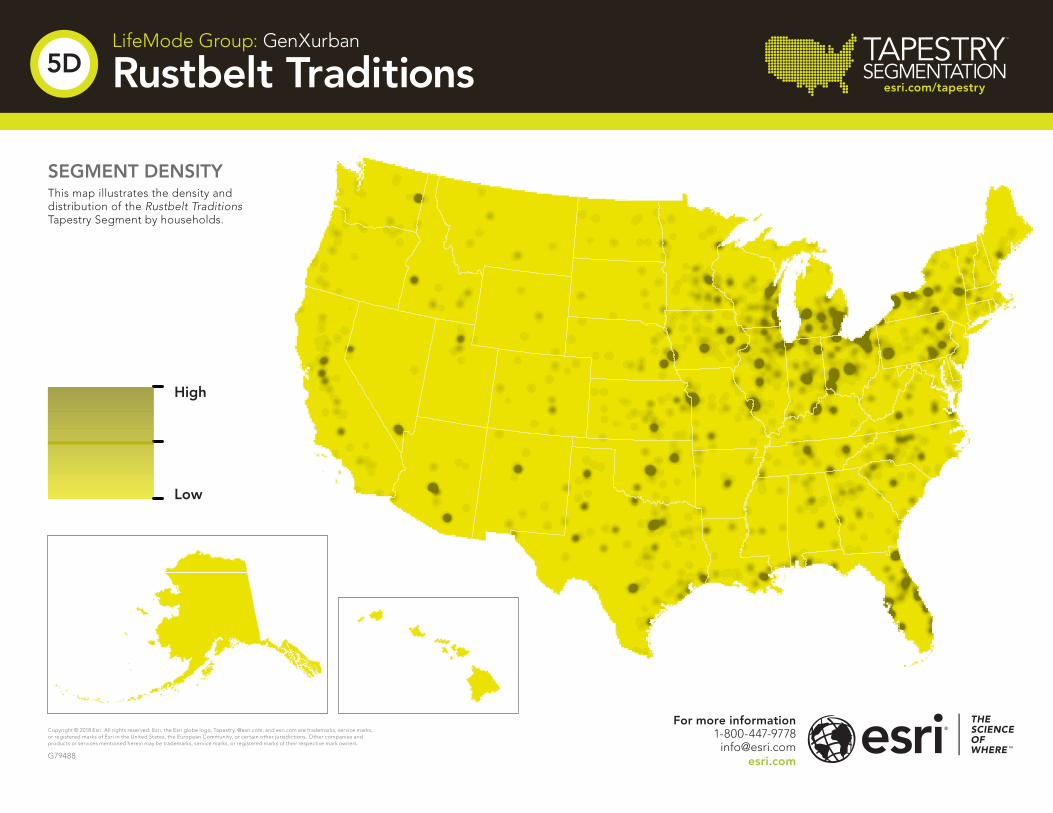
High
Low
TAPESTRYSEGMENTATION
TM
esri.com/tapestry
SEGMENT DENSITYThis map illustrates the density and distribution of the Rustbelt Traditions Tapestry Segment by households.
LifeMode Group: GenXurban
Rustbelt Traditions5D
For more information1-800-447-9778
Copyright © 2018 Esri. All rights reserved. Esri, the Esri globe logo, Tapestry, @esri.com, and esri.com are trademarks, service marks, or registered marks of Esri in the United States, the European Community, or certain other jurisdictions. Other companies and products or services mentioned herein may be trademarks, service marks, or registered marks of their respective mark owners.
G79488