Lifecycle Analysis of CO 2 - Equivalent Greenhouse-Gas Emissions from Biofuels Mark A. Delucchi...
19
Lifecycle Analysis of CO 2 -Equivalent Greenhouse-Gas Emissions from Biofuels Mark A. Delucchi Institute of Transportation Studies University of California, Davis www.its.ucdavis.edu/people/faculty/delucchi ITS Seminar Feb 2, 2007
-
Upload
lewis-montgomery -
Category
Documents
-
view
217 -
download
1
Transcript of Lifecycle Analysis of CO 2 - Equivalent Greenhouse-Gas Emissions from Biofuels Mark A. Delucchi...

Lifecycle Analysis of CO2-Equivalent Greenhouse-Gas
Emissions from Biofuels
Mark A. DelucchiInstitute of Transportation Studies
University of California, Davis
www.its.ucdavis.edu/people/faculty/delucchi
ITS Seminar
Feb 2, 2007

Outline
• Overview of LCA of CO2-equivalent GHGs from biofuels
– Ethanol from corn, ethanol from grass or wood, biodiesel from soy
• Important issues in biofuel LCAs
– Focus on land-use changes
– Focus on CO2-equivalency factors
• Comparison of results from some LCAs
– UCD Lifecycle Emissions Model (LEM) vs. others
• Findings and conclusions

Take-home message:
• Changes in land use, the nitrogen cycle, CO2-equivalency factors, the economic effects of policies, omitted kinds of climate impacts, and other factors are important in LCAs of GHGs from biofuels, but are treated poorly or (more often) not at all in most analyses. This means that nobody has, yet, a clear understanding of the impact of biofuel policies on climate.

What is the purpose (and shortcoming) of most LCAs of GHGs?
• Ideally, the purpose of LCA of GHGs from biofuels is to determine the difference in some measure of climate change between a “baseline” world and the world given some proposed action (generally a policy action). In principle, this requires a careful specification of the action and then an analysis of how the world changes as a result of the action. To do this, one needs integrated engineering-economic-environment models.
• In practice, however, most LCAs do not specify or analyze a policy, or consider any economic effects, but just assume (implicitly) that one simple and narrowly defined set of activities replaces another, and then use a simple engineering I-O model to estimate impacts.
• This discrepancy between what should be done and what is done make the results of most LCAs difficult to interpret.
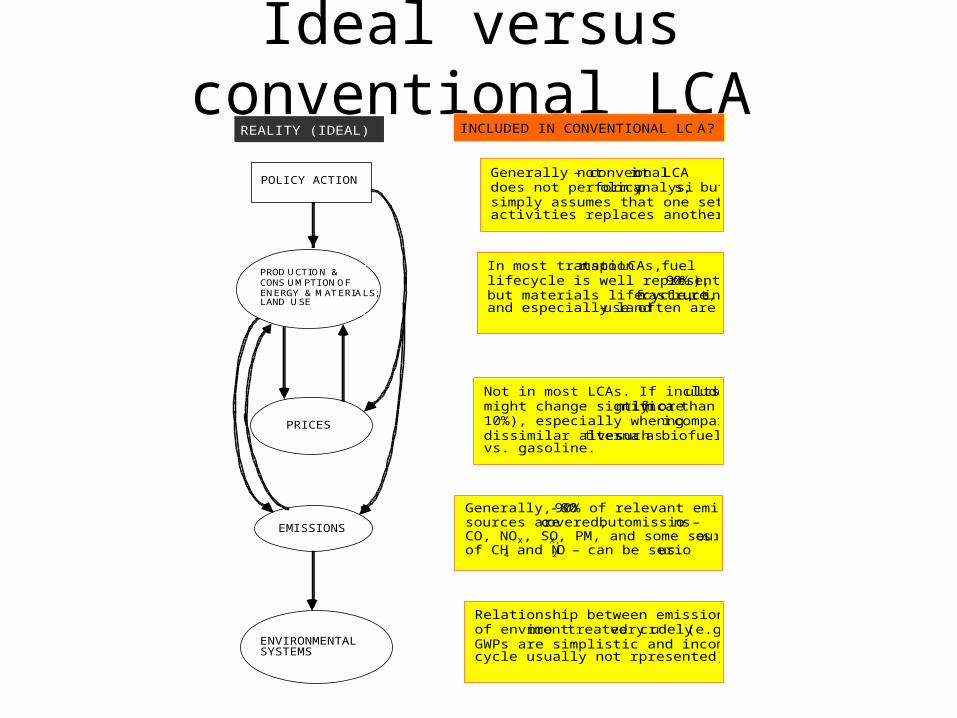
Ideal versus conventional LCA
INCLUDED IN CONVENTIONAL LCA?
Generally not – conventional LCA does not perform policy analysis, but simply assumes that one set of activities replaces another.
In most transportation LCAs, fuel lifecycle is well represented (~90%), but materials lifecycle, infrastructure, and especially land-use often are not.
Not in most LCAs. If included, results might change significantly (more than 10%), especially when comparing dissimilar alternatives such as biofuels vs. gasoline.
Generally, 80 -90% of relevant emission sources are covered, but omissio ns – CO, NO X, SOX,, PM, and some sourc es of CH 4 and N 2O – can be serio us. .
Relationship between emissions and state of environment treated very crudely (e.g., GWPs are simplistic and incomplete; N cycle usually not rpresented).
REALITY (IDEAL)
PRODUCTION & CONSUMPTION OF ENERGY & MATERIALS; LAND USE
ENVIRONMENTAL SYSTEMS
POLICY ACTION
PRICES
EMISSIONS

Issues in GHG LCA of biofuels, and their treatment in the LEM and in other studies
• Land-use changes and cultivation– LEM: Present-value, time-discounted (with declining discount rate), life-cycle analysis of
changes in carbon sequestration in soils and carbon by crop type and displaced ecosystem, accounting for reversion of land at end of program.
– Other studies: Not included in other biofuel LCAs.
• N inputs– LEM: Complete N input-output balance calculation, accounting for residue, fertilizer, N
fixation, manure, deposition, gaseous losses, crop output, runoff, N transfer betweeen co-rotated crops, and more, with explicit changes over time (e.g., reduced run-off losses).
– Other studies: Not included in other biofuel LCAs.
• Climate impacts of NOX and NH3 emissions– LEM: Full accounting for multiple fates of N (particulate matter, N2, NOX, N2O, NH3 etc.),
with global N-deposition, N transfer, and N transformation. – Other studies: Not included in other biofuel LCAs.
• Climate impacts of CO, PM (BC, OC, and dust), SOX other gases– LEM: Comprehensive, detailed, long-term (~1000-year) accounting of direct and indirect,
time-discounted, climate-related damages. – Other studies: Not included in other biofuel LCAs.

Issues in GHG LCA of biofuels, and their treatment in the LEM and in other studies
• Material inputs– LEM: Full, detailed LCA of all major materials for vehicles, with conceptually correct,
detailed treatment of manufacturing recycling and post-consumer recycling.
– Other studies: Not in other biofuel LCAs, or at least not in detail.
• “Indirect” energy embodied in machinery– LEM: Simple representation of energy inputs to manufacture, maintenance, repair of
farm equipment; more detailed analysis underway.
– Other studies: Several simple but not definitive analyses in the literature.
• Treatment of “coproducts”– LEM: Explicit estimation of emission changes in co-product markets (only coherent
method, nothing else makes any sense!); with crude accounting for impacts of co-products on prices and final consumption.
– Other studies: There are good partial treatments of this in other studies.
• Trends in energy use, farming, emissions, and so on– LEM: Projections of all important energy-use parameters, farming variables, emission
factors, and so on, based on historical data, regulations, and professional judgment.
– Other studies: Traditional area of focus in LCA, so this is in all models.

Issues in GHG LCA of biofuels, and their treatment in the LEM and in other studies
• Representation of petroleum lifecycles for comparison– LEM: Specific energy-use and emission factors for oil production, oil refining, and
transport, for every major oil-producing region, with changes over time. Includes explicit regional treatment of heavy oil, NG venting and flaring emissions, and so on.
– Other studies: Not as much spatial and temporal detail.
• CH4 from plants, albedo changes, hydrodynamics, agricultural dust– LEM: Not included.
– Other studies: Not included.
• Economic/price effects (policy prices output/use emissions )– LEM: A few quasi-elasticities, but no systematic, integrated treatment.
– Other studies: Not included.
– Big deficiency in all models!

Vehicle fuels and feedstocks in the LEM(Biofuel pathways in blue)
Fuel -->Feedstock
Gasoline Diesel Methanol Ethanol CNG, LNG
LPG CH2, LH2
Electric
Petroleum ICEV, FCV
ICEV ICEV BPEV
CoalICEV ICEV ICEV, FCV FCV BPEV
Natural gasICEV ICEV, FCV ICEV ICEV
ICEV, FCV
BPEV
Wood, grassICEV, FCV
ICEV, FCV
ICEV FCV BPEV
SoybeansICEV
CornICEV
Solar ICEV, FCV
BPEV
Nuclear ICEV, FCV
BPEV
ICEV = internal combustion engine vehicle; BPEV = battery electric vehicle; FCV - fuel cell electric vehicle

Corn-to-ethanol fuel pathway
emissions
Corn cultivationRail transport
emissions
Refueling stationVehicle operationEthanol plantTruck distribution
emissions
Corn production
emissionsemissionsemissions
⇓ Land-use impacts
Material and chemical inputs to all stages

Carbon history of replacing forest with crops
Time, years
Carbon
content of
ecosystem,
tons
Baseline,
mature
forest
Lost carbon
Forest soil
Trees Trees
Forest
cleared
crops
abandoned
and trees
replanted
0
Carbon content of crop system
Crop system
Forest system
Forest-plus-
crop system
Trees in forest
Forest soil
Carbon content of
forest system
Carbon content of forest-
plus-crop system
Carbon history of replacing forest with crops

The history of C in plant and fuel product in a biomass energy system
C C C
B B B
E E
CARBON
TIME
D
E A
D
A
D
A
CB*
CB
A = beginning of planting; B = harvest (maximum plant biomass); C = beginning of oxidation of fuel and other products; D = end of oxidation of fuel and other products; E = end of oxidation of non-marketed products.

Sensitivity of lifecycle GHG emissions to the length of the biofuels program
CORN-ETHANOL 20 yrs 35 yrs 50 yrs 75 yrs 100 yrs 150 yrs
Land us e chang e s and cultivation (g/mi) 263. 0 202. 0 176. 8 155. 6 143. 4 127. 4
Emis s. displace d by coprodu cts (g/mi) (118 .0) (99. 5) (91. 9) (85. 5) (81. 8) (76. 9)
% change s (fue lcycle) 29.1% 19.1% 14.9% 11.5% 9.4% 6.8%
SOY-BIODIES EL
Land us e chang e s and cultivation (g/mi) 14,510.6 11,075.0 9,63 1.0 8,39 2.3 7,65 7.2 6,68 4.8
% change s (fuelcycle) 296.1% 202.4% 163.0% 129.2% 109.2% 82.7%
CELLULOS IC-ETHANOL
Land us e chang e s and cultivation (g/mi) 147. 6 114. 0 100. 3 89. 0 82. 5 74. 3
% change s (fuelcycle) -28.2% -36.2% -39.4% -42.1% -43.6% -45.6%
Note: length of time is from beginning of planting of first crop to abandonment the specific biofuel program (i.e, to beginning of reversion to original land uses).

The NOx CO2-equivalency factor
Effect on tropospheric O3 16.3
Effect of NOX on lifetime of ambient CH4 -17.2
Effect of deposition on CH4 emissions 0.06
Effect of deposition, leaching on N2O emissions 2.4
Effect of deposition on C sequestration -6.9
Effect of particulate nitrate -53.6
Effect of acidification on C sequestration 0.0
Note: these values are still a work-in-progress

Breakdown of lifecycle CO2-equivalent emissons by pollutant (U. S. year 2010)
General fuel --> RFG Ethano l Ethano l Methano l Natural gas Bio die s el
Fue l speci fication --> crude oil E90 (corn) E90 (grass) M85 (wood) CNG (wo od) SD10 0 (soy)
Net CO2 from ve hicle s 60% 8% 8% 15% 0% 0%
Lifecycle CO 2 93% 82% 44% 44% 22% 124%
CH4 4% 5% 3% 3% 5% 8%
N2O 3% 19% 10% 4% 4% 76%
CO 3% 3% 3% 3% 4% 5%
NMOC 1% 1% 1% 1% 0% 1%
NO2 -4% -13% -8% -5% -4% -74%
SO 2 -4% -5% -3% -3% -3% -6%
P M (BC+OM) 2% 4% 4% 4% 3% 17%
P M (du s t) -0% -0% -0% -0% -0% -0%
H2 0% 0% 0% 0% 0% 0%
SF 6 0% 0% -0% 0% 0% 1%
HFC -134a 2% 2% 2% 2% 2% 0%

Approximate overall results of biofuel GHG LCAs
Source Ethanol from corn
Ethan ol from cel lulos e (gras s)
Biodie se l from s oy
GREE T (se e va rious papers by Wang an d GM et a l.) GHGenius (s ee web site ), Kim an d Dale , De Oliveira , LBS T (GM et al. 2002a ), CONCAWE et al. , Sp a ta ri e t al. (2005), Fa rrell et al. ( 2006), an d othe rs
- 50% to -10% -100% to -40% - 80% to -40%
LEM est imates -25% to + 20% -75% to -40% -20% to + 50%

Contribution of key factors to total lifecycle emissions (% of vehicle+fuel
lifecycle CO2-equivalent emissions
Factor Ethanol/corn Ethanol/grass Biodiesel/soy Source of estimate
NO2 and NH3 emissions -10% to -15% -10% -70% LEM estimates.
N2O emissions 20% 10% to 15% 70% to 80% LEM estimates.
Land-use changes 20% to 25% -20% to 10% 50% to 100% LEM estimates.
Co-product markets -10% to -20% -10% to -20% -60% to -90% LEM estimates.
Changes in albedo, evapotranspiration
significant in some places?
significant in some places?
significant in some places?
Studies of tropical deforestation. (Not in
the LEM.)
CH4 from plants, ag. dust
? ? ?
Price changes affect production and consumption
potentially large? potentially large? potentially large?
My judgment. (Not in the LEM.)

Findings• The largest sources of emissions in the upstream lifecycle of biofuels are land-use changes and
cultivation (impacts on wetlands especially important!), fuel production, feedstock recovery, fertilizer manufacture, and emissions displaced by co-products.
• In contrast to many other studies, this analysis finds that corn ethanol does not not have significantly lower GHG emissions than does gasoline, and that cellulosic ethanol from grass has only about 50% lower emissions. The main reasons for this difference are that we estimate relatively high emissions from feedstock and fertilizer production, from land use and cultivation, and from emissions of non-CO2 GHGs from vehicles.
• This analysis finds that soy biodiesel has higher lifecycle GHG emissions than does conventional diesel. This is because of the large (and usually overlooked) N2O emissions from soyfields, and the large (and again usually overlooked) emissions of carbon due to changes in land use.
• Many often overlooked questions may be important: how long are energy crop programs? What are CO emissions from tractors? Does the high cost of seeds mean high energy use in seed production? What is the appropriate discount rate time-path? What is the time-history of the crop-fuel-use cycle? What about dust emissions, changes in albedo…?
• Failure to adequately consider economic/price effects in all lifecycles may by itself render current LCAs of biofuels almost useless.
• Note on other environmental impacts: Recent analyses by Jacobson at Stanford indicates that ethanol ICEs may slighly worsen air quality, partially on account of high acetaldehyde formation. Biofuel programs may have adverse impacts on water quality if soil erosion and N runoff are high.
• Note #2: these findings do not apply in full force to fuels derived from agricultural wastes.

Important things to research• Incorporate price-dynamic economic effects of transportation policies
on use of (and hence emissions from) vehicles and fuels.
• Develop more detailed treatment of byproducts and coproducts.
• Improve estimates of changes in land use due to production of biofuel
crops.
• Finish revisions of estimates of CO2-equivalency factors (preliminary
analyses completed).
• Finish analyses of energy embodied in seeds, tractors, and equipment
in biofuel LCAs.
• Add agricultural dust emissions.
• CH4 from plants, changes in albedo and evapotranspiration due to
changes in land use?
• Add new vehicle/energy pathways (e.g., ethanol from corn stover and
sugar cane, biodiesel from waste oil)