Life Sciences Licensing — Trends and Issues
41
Life Sciences Licensing 2015 – Trends and Issues October 7, 2015 Paul Armitage*, Partner *Law Corporation
-
Upload
this-account-is-closed -
Category
Law
-
view
9.548 -
download
6
Transcript of Life Sciences Licensing — Trends and Issues

Life Sciences Licensing
2015 – Trends and Issues
October 7, 2015
Paul Armitage*, Partner *Law Corporation

2
Financial terms
Financial components of licenses - % of deals*
• Upfront payment: 75%
• Technology access fee: 5%
• Equity investment: 22%
• R&D funding: 33%
• Development milestones: 68%
• Sales milestones: 52%
*LES, Global “Life Sciences” Royalty Rates & Deal Terms Survey 2014 (for years 2012-2014)

Financial terms
Royalty rate structure - % of deals*
• Flat royalty: 64%
• Reflects overall trend of early stage of licensing (see
later) - flat royalty most common for preclinical deals
• Tiered royalties: 17%
• No royalty: 19%
* LES, Global “Life Sciences” Royalty Rates & Deal Terms Survey 2014 (for years 2012-2014)
3

Financial terms
Tiered royalties*
• Usually 3 tiers (2 or 5 tiers next most common)
• Tiered royalties more likely to be used with greater
peak sales potential
• $0-100m: 80% of deals are flat royalty
• >$100m: approx. 50% of deals are tiered royalties
Tiered royalties: associated with more complex
payment designs (biobucks, equity, funding,
etc.)
* LES, Global “Life Sciences” Royalty Rates & Deal Terms Survey 2014 (for surveys 2008, 2009,
2012, 2014)
4

Financial terms
What are royalties paid-on? - % of deals*
• Net sales: 76%
• Gross sales: 13%
• Units: 3%
* LES, Global “Life Sciences” Royalty Rates & Deal Terms Survey 2014 (for years 2012-2014)
5

Financial terms
Profit-sharing / co-promotion - % of deals*
• Profit-sharing component: 29%
• No profit-sharing component: 71%
• Co-promotion: 7%; additional 3% with opt-in
• Lack of profit-sharing and lack of co-promotion go hand-
in-hand
* LES, Global “Life Sciences” Royalty Rates & Deal Terms Survey 2014 (for years 2012-2014)
6

Financial terms
Average flat royalty by stage of development*
* LES, Global “Life Sciences” Royalty Rates & Deal Terms Survey 2014 (for surveys 2008, 2009,
2012, 2014)
7
Preclinical through IND-filed: 4.6%
Phase I enrolling through Phase II enrolling: 5%
Phase II completed through Phase III completed:
i.e., royalties double with proof of concept established
10.2%
NDA submitted through to launched:
12.5%
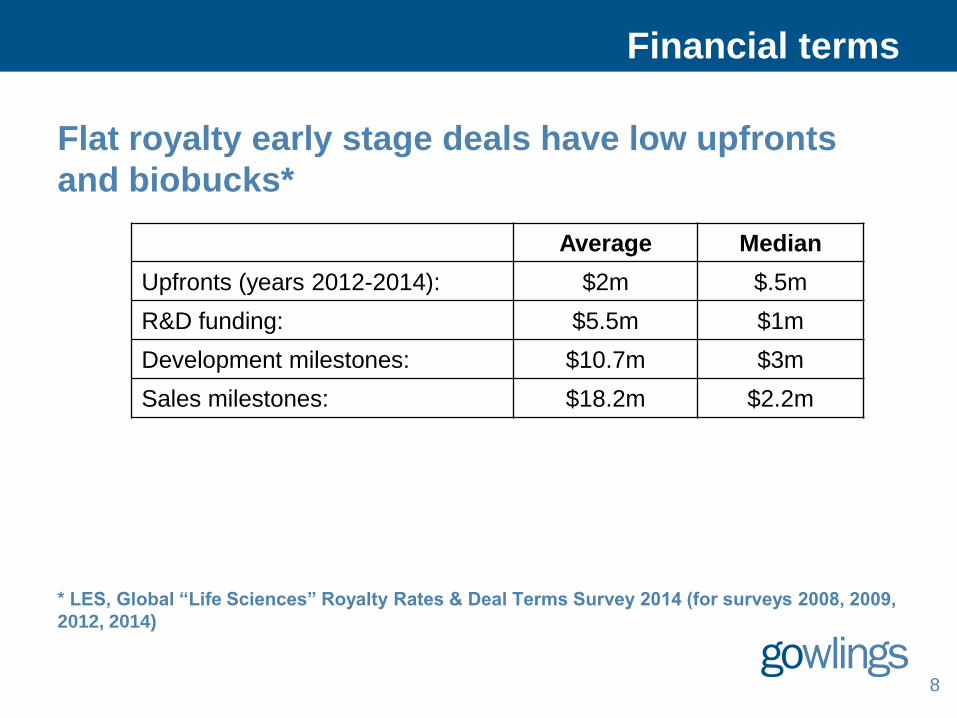
Financial terms
Flat royalty early stage deals have low upfronts
and biobucks*
* LES, Global “Life Sciences” Royalty Rates & Deal Terms Survey 2014 (for surveys 2008, 2009,
2012, 2014)
8
Average Median
Upfronts (years 2012-2014): $2m $.5m
R&D funding: $5.5m $1m
Development milestones: $10.7m $3m
Sales milestones: $18.2m $2.2m

Financial terms
Tiered royalty rates increase with stage of
development*
* LES, Global “Life Sciences” Royalty Rates & Deal Terms Survey 2014 (for surveys 2008, 2009,
2012, 2014)
9
Preclinical through IND-filed: 6% through 8% tiers
Phase I enrolling through Phase II enrolling: 10% through 14% tiers
Phase II completed through Phase III
completed:
11% through 15% tiers

Tiered royalty deals have greatest biobucks
immediately pre-proof of concept*
This shows that pre-proof of concept, the licensor
shoulders more risk
* LES, Global “Life Sciences” Royalty Rates & Deal Terms Survey 2014 (for surveys 2008, 2009,
2012, 2014)
Financial terms
Upfronts
Development
Milestones
Sales
Milestones
Preclinical through IND-filed $2m $30m $35m
Phase I enrolling through
Phase II enrolling $4m $125m $135m
Phase II completed through
Phase III completed $5m $12m $42m
10

Financial terms
Deal terms – diagnostics*
• Typical deal - % of deals
• Small upfront payment: 46%
• Royalty: main component
• 75% based on net sales; 10.3% based on gross sales, 6.9%
based on units
• 50% of deals had royalty rate of <5%
• 25% of deals had a royalty rate equal to or greater than 11%
• R&D funding: 17%
• Development milestones: 20%
• Sales milestones: 17%
* LES, Global “Life Sciences” Royalty Rates & Deal Terms Survey 2014 (for surveys 2008, 2009,
2012, 2014)
11
Valuations
Licensees financially model deals more often than
licensors - % of deals*
• Licensees: 89%
• Licensors: 59%
* LES, Global “Life Sciences” Royalty Rates & Deal Terms Survey 2014 (for years 2012-2014)
12

Valuations
Operating companies with >250m in revenue are
more likely to model deals - % of deals*
• >250m in revenue: 92%
• <250m in revenue: 71%
* LES, Global “Life Sciences” Royalty Rates & Deal Terms Survey 2014 (for years 2012-2014)
13

Valuations
Modeling more likely as stage of development
advances - % of deals*
* LES, Global “Life Sciences” Royalty Rates & Deal Terms Survey 2014 (for years 2012-2014)
14
Preclinical through IND-filed: 63%
Phase I enrolling through Phase II enrolling: 67%
Phase II completed through Phase III completed: 100%
NDA submitted through to launched: 100%

Valuations
How do companies financially model deals? All
models used*
• NPV: 65%
• Comparables: 53%
• Peak revenue: 41%
• IRR: 31%
• rNPV: 29%
• Multiples: 7%
• Other: 5%
* LES, Global “Life Sciences” Royalty Rates & Deal Terms Survey 2014 (for years 2012-2014)
15

Valuations
How do companies financially model deals?
Primary model used*
• NPV: 31%
• Comparables: 31%
• rNPV: 14%
• IRR: 10%
• Peak revenue: 9%
* LES, Global “Life Sciences” Royalty Rates & Deal Terms Survey 2014 (for years 2012-2014)
16

Valuations
How do companies financially model deals?*
• Early stage deals are more likely to look at
comparables
• Later stage deals are more likely to include other
valuation techniques
* LES, Global “Life Sciences” Royalty Rates & Deal Terms Survey 2014
17

Valuations
Does modeling make a difference?*
• Financially modeled deals have higher fixed royalties
• Modeled deals: 9% royalty
• Not modeled deals: 6.7% royalty
• Final deal structure reflected pre-negotiation valuation
66% of the time for compounds
* LES, Global “Life Sciences” Royalty Rates & Deal Terms Survey 2014 (for years 2012-2014)
18

The continuing saga of the patent cliff
• 2015: pharma industry will replace by nearly
x4 lost sales due to patent expiries*
• This trend will continue to 2020 (x5 sales replacement
forecast)
• Compare to 2011: new sales replacement roughly
equalled sales lost due to patent expiries
• Top line sales bolstered by growing proportion of drug
sales comprised of biologics
• 2014: 40% of new drugs approved by U.S.
FDA were new biologics (1 biosimilar to
date)**
* Pharma & Biotech 2015 Preview, EvaluatePharma
** World Preview 2015, Outlook to 2020, EvaluatePharma
19

The continuing saga of the patent cliff
• 2014*:
• U.S. FDA: 41 novel medicines approved (2nd highest all-
time next to 53 in 1996)
• 40% are specialty drugs for rare diseases (typically
have easier regulatory pathway and lower clinical trial
costs)
• EMA: 82 new medicines (including generics), compared
to 79 in 2013 and 57 in 2012
• 2015**: U.S. FDA on track for up to 50 novel
medicines * “Pharma and biotech on a roll as drug approvals hit 18-year high,” Business News, January 5,
2015
** 2015 Pharma and Biotech Half-Year Review, Evaluate
20

The continuing saga of the patent cliff
• 2016 R&D spending in biopharmaceutical and
health care industries: $145b*
• 6% increase from 2013
• R&D increasing due to need to increase the number of
new drugs and replace lost sales due to patent
expiries
* “Quintiles projects increase in biopharma R&D spending,” Triangle Business Journal,
February 20, 2014
21
The continuing saga of the patent cliff
U.S. more aggressive in trade negotiations to expand
protection of U.S. pharma industry* – TPP and data
exclusivity
• Canada’s hot button issue is dairy, Japan’s is rice, U.S.’ is
pharmaceuticals**
• 12 TPP countries: 5,600 medicines in development in total, of
which 3,372 are in the U.S. including >900 biologics. Pharma
industry contributes $800b to U.S. economy each year
• U.S.: pushed for 12 years of data exclusivity for biologics (matching
current U.S. domestic law); other countries wanted 8 years or fewer
(Australia, with nationalized health that covers drugs, wanted 5)
• Compromise is hybrid solution of 8 or 5 years, plus up to 3 more
years * “With protections set to lapse on advanced drugs, U.S. presses strict rules overseas,” The
Washington Post, March 17, 2014
** “Patent Protection for Drugs Puts Pressure on U.S. in Trade Talks”, New York Times, July 30,
2015
22

“More payer pressure, more commercialization risk”
Question: what’s the biggest deduction from Net
Sales calculations?
“Net Sales” means the gross amount invoiced by
Licensee, its affiliates and sublicensees for products
sold, less the following deductions:
(i) trade, quantity and cash discounts;
(ii) refunds, returns, recalls;
(iii) rebates;
(iv) tariffs, duties, taxes; and
(v) freight and insurance.
23

“More payer pressure, more commercialization risk”
Discounts/rebates are now the largest
commercial cost to pharma*
• Average discounts/rebates
• 2007 (all branded drugs): 17%
• 2013 (all branded drugs): 29%
• 2015 (HCV): 45%
* RealEndpoints 2015
24

“More payer pressure, more commercialization risk”
New, expensive specialty drugs are driving
growth in health costs*
• Growth in spending 2014:
• Traditional drugs: up 6%
• Speciality drugs: up 30%
* RealEndpoints 2015
25

“More payer pressure, more commercialization risk”
Responses by payers (government, private
insurers, employers)*
• Stricter management of drug benefits
• e.g., patient co-pay, prior authorization, quantity limits
• Notice from B.C. government: “Effective January 1,
2015. BC PharmaCare is limiting the number of
blood glucose strips it covers for a patient each
calendar year...”
* RealEndpoints 2015
26

“More payer pressure, more commercialization risk”
Responses by payers (government, private
insurers, employers)*
• Purchasing pressure*
• Relative value - cost-benefit analysis: does the
(incremental) benefit justify the (higher) cost?
• Traditional drugs (established drugs in older product
categories where competition has long existed) will face
less price pressure; BUT new entrants where there are
traditional drugs will face strong price pressure
* RealEndpoints 2015
27

“More payer pressure, more commercialization risk”
Responses by payers (government, private
insurers, employers)
• Purchasing pressure*
• Payers pit suppliers against each other to drive
discounts/rebates: payers will look to add competitive
products on formulary and require discounts from all
suppliers in order to be listed
• Prices fall in competitive classes:
• HCV 2013 (1 treatment, Sovaldi): $90+G
• HCV 2019 projected (5 treatments): $35G
* RealEndpoints 2015
28

“More payer pressure, more commercialization risk”
Responses by payers (government, private
insurers, employers)
• Purchasing pressure*
• Payers may restrict access until competitive products
appear
• Biosimilars will also have a role in creating competition in
specialty drugs and therefore controlling biologics spending
(although biosimilars are typically only 20-30% cheaper
than branded biologics, compared with generics being 80-
90% cheaper)
• First-in-class entrants therefore may be less valuable as
payers seek to delay widespread adoption until
competitive products emerge
* RealEndpoints 2015
29

Licensing as a commercialization strategy
No. of licenses and JVs continues to rise*
2012: 528
2013: 690
2014: 739
2015 Q1: 213
* Allicense 2015
30

Licensing as a commercialization strategy
Early stage licensing continues to dominate*
• 2014:
• Discovery/lead, preclinical (2/3s discovery): 66%
• Clinical/approved: 34%
• Fairly consistent over last 5 years, with discovery stage
licensing intensifying
* Allicense 2015
31

Licensing as a commercialization strategy
Early stage licensing continues to dominate*
• Discovery/pre-IND: 66%
• IND-filed/approved: 34%
* LES, Global “Life Sciences” Royalty Rates & Deal Terms Survey 2014 (for years 2012-2014)
32

Licensing as a commercialization strategy
Worldwide rights deals: almost 70%*
• Total number of regional deals (ex-U.S.) is increasing**
• 2007 – 2010 EU, Japan/Asia, other: average of 51 per year
• 2011 – 2014 EU, Japan/Asia, other: average of 95 per year
* LES, Global “Life Sciences” Royalty Rates & Deal Terms Survey 2014 (for years 2012-2014)
** Allicense 2015
33

Licensing as a commercialization strategy
2014 life sciences dealmaking*
• Deal volume (no. of deals):
• Licenses, JVs: 25%
• M&A, asset purchase: 19%
• Deal dollars:
• Licenses, JVs: 5%
• M&A, asset purchases: 92%
* Allicense 2015
34

Licensing as a commercialization strategy
2015 Q1 life sciences dealmaking*
• Deal volume (no. of deals):
• Licenses, JVs: 27%
• M&A, asset purchase: 9%
• Deal dollars:
• Licenses, JVs: 15%
• M&A, asset purchases: 83%
* Allicense 2015
35
Licensing as a commercialization strategy
Takeaways:
• Most value extracted from technology by M&A and asset
purchases
• Licensing is a source of funding to (often smaller,
biotech) licensors, particularly when accessing capital
markets is difficult
• Licensing and related structures (options) provide access
to outside R&D and technology by pharma to stoke
product pipelines – increase pharma’s “shots on goal”
and allows pharma to “ring-post assets”
• In-licensing and options limit exposure/capital
requirements of pharma since can advance and “kill”
programs if necessary without acquiring the licensor
36

Licensing as a commercialization strategy
• Licensing/partnering early stage, non-core assets
while maintaining rights to lead programs can be a
viable strategy*
• Allows company to focus on lead programs, which are
left unencumbered
• Provides non-dilutive capital to allow for further
development of lead programs
• Validates platform
• Regional licensing allows for similar strategies
* Locust Walk Partners 2015
37

Academic to industry licensing
Typical deal*
• Stage of deal: 65% are for preclinical through IND filed
assets
• Stage of licensee: 44% have a pre-commercial
licensee
* LES, Global “Life Sciences” Royalty Rates & Deal Terms Survey 2014
38

Academic to industry licensing
Deal terms*
• Academic licensor to pre-commercial licensee: 70%
use flat royalties
• Valuation technique typically used is comparable deals
• Pre-commercial sub-licensor to large company
licensee: 60% use tiered royalties
• Use of tiered royalties reflects later stage licensing: as
expected product revenue increases, tiered royalty
structures are used more often
* LES, Global “Life Sciences” Royalty Rates & Deal Terms Survey 2014
39

Academic to industry licensing
Who creates and captures value in academic to
industry licensing?*
• Small companies that in-license preclinical through IND-
filed assets from academic institutions create and then
capture substantial value from the asset if they advance
the assets to Phase I
• rNPV royalty/biobucks to academic licensor: $3.5m
• rNPV royalty/biobucks to small company sub-licensor: $26.7m
* LES, Global “Life Sciences” Royalty Rates & Deal Terms Survey 2014
40

Thank You
montréal ottawa toronto hamilton waterloo region calgary vancouver beijing moscow london
Paul Armitage
Tel: 604-891-2779
Email: [email protected]