Life Science Journal 2014;11(9) ... · PDF fileorganization report in 2010 showed that, ......
7
Life Science Journal 2014;11(9) http://www.lifesciencesite.com 269 The epidemiology of Road Traffic Accident (RTA) in Ghana from 2001-2011. Thompson Amo, Serik Meirmanov Ritsumeikan Asia Pacific University/Public Health Management, Beppu, Japan Correspondence: Serik Meirmanov, MD, Phd b [email protected] Associate Professor, Department of Public Health Management, Ritsumeikan Asia Pacific University/Public Health Management, Beppu, Japan Abstract: Background: This research discusses the epidemiology of road traffic accidents which occurred in Ghana between 2001 and 2011. The purpose of this research is to provide a snapshot of road traffic accident cases which would inform the authorities on the need to ensure sanity on the roads. Methods: A descriptive and cross- sectional study was adopted to explore the incidence of RTA in Ghana from 2001 to 2011. Secondary data were obtained from the Building and Road Research Institute. Results: A total of 125,681 RTA involving 150,949 victims analysed. There were 96,888 (64.19%) passengers and 40975 (35.81%) pedestrian. There were 21,283 (14.14%) fatality cases and 129,666 (87.95%) suffered various degrees of injuries. The percentage share of lives lost is 38.50% (8194) while pedestrians were 61.50% (13,089). The findings also show that only three types of vehicles such as car (46.43%), bus (15.48%) and heavy duty vehicle (13.18%) contribute 75.09% of RTA. The evidence shows that males have 1.5 times higher risk of RTA than females. Findings produced a satisfactory proof that the ages between 1 and 40 contribute 65.16% of RTA. It was also shown that the second half of the year produces a higher accident rate and at a peak in December. Conclusion: RTA is a treat to lives and properties and every effort must be made to salvage the situation. [Thompson Amo, Serik Meirmanov. The epidemiology of Road Traffic Accident (RTA) in Ghana from 2001- 2011. Life Sci J 2014;11(9):269-275]. (ISSN:1097-8135). http://www.lifesciencesite.com . 37 Key words: epidemiology, road traffic accident, death, injuries, Ghana Introduction Road traffic accident (RTA) has become an important public health concern over the past decades as an estimated Global figure of 1.3 million people loses their lives in every year. It is believed that almost 3,400 lives are lost every day and millions of people suffer various degrees of injuries and disabilities as a result of RTA. These injuries and deaths, according to the World Health Organization (WHO) have immense influence on victims' families, employment and communities they belong, whose lives are often changed irreversibly by these calamities. Currently, road traffic casualties rank 9 th in the “Global Burden of Diseases” but expected to become the 3 rd leading cause of death and disability by the year 2020 except fresh, effective and efficient safety actions are engaged (WHO, 2013) [1] . Lower and middle-come countries have higher rates of RTA as they account for about 90% of the total fatalities. This is very disturbing since 60% of these deaths are persons between 15-44 years old, who are the majority of the working force for most nations. However, there are differences among road traffic death in respect of WHO Regions. The African Region continues to be the highest with an average population at risk of 24.1 deaths per 100,000 population (WHO, 2013) [1] . The World Bank estimated that by the year 2020, an annual road traffic fatalities will increase by 80% in developing countries and therefore, it is important to develop strict measures that can help reverse the Bank’s deadly prediction [2 ]. The road traffic accident is among the highest causes of death in Ghana, after malaria, diarrhoeal and respiratory diseases. The world health organization country fact sheet 2006 ranked road traffic accident as the 9 th cause of death in Ghana killing about 5000 (3.00%) of total deaths [3 ]. Again, the world health ranking puts estimated that 5,032 (2.68%) deaths was caused by traffic accident with age adjusted death rate of 28.11 per 100,000 ranking the country at 41 in the world [4 ]. The WHO in 2009 estimated that the average population at risk is 7.9 per 100,000 population. Ghana according to the world health organization report in 2010 showed that, road traffic fatalities were 1986 of which 76% were men and 24% being women with an estimated Gross Domestic Product (GDP) lost due to road crashes was 1.6% valued at $419 million [5] . Other shocking Figures on Road Accidents by the National Road Safety Commission (NRSC) proclaimed that there were 19 fatalities per 10,000 vehicles in 2010.The statistics showed that 43% of the fatalities involved pedestrians while 53% involved occupants of vehicles. Outrageously 23% of all pedestrian fatalities involved children under the age of 16 years old. In 2011, there were 2,330 road accidents bringing it to an average of 7 accidents per day across the country. In 2012, by the
-
Upload
vuonghuong -
Category
Documents
-
view
219 -
download
4
Transcript of Life Science Journal 2014;11(9) ... · PDF fileorganization report in 2010 showed that, ......

Life Science Journal 2014;11(9) http://www.lifesciencesite.com
269
The epidemiology of Road Traffic Accident (RTA) in Ghana from 2001-2011.
Thompson Amo, Serik Meirmanov
Ritsumeikan Asia Pacific University/Public Health Management, Beppu, Japan Correspondence: Serik Meirmanov, MD, Phdb [email protected]
Associate Professor, Department of Public Health Management, Ritsumeikan Asia Pacific University/Public Health Management, Beppu, Japan
Abstract: Background: This research discusses the epidemiology of road traffic accidents which occurred in Ghana between 2001 and 2011. The purpose of this research is to provide a snapshot of road traffic accident cases which would inform the authorities on the need to ensure sanity on the roads. Methods: A descriptive and cross-sectional study was adopted to explore the incidence of RTA in Ghana from 2001 to 2011. Secondary data were obtained from the Building and Road Research Institute. Results: A total of 125,681 RTA involving 150,949 victims analysed. There were 96,888 (64.19%) passengers and 40975 (35.81%) pedestrian. There were 21,283 (14.14%) fatality cases and 129,666 (87.95%) suffered various degrees of injuries. The percentage share of lives lost is 38.50% (8194) while pedestrians were 61.50% (13,089). The findings also show that only three types of vehicles such as car (46.43%), bus (15.48%) and heavy duty vehicle (13.18%) contribute 75.09% of RTA. The evidence shows that males have 1.5 times higher risk of RTA than females. Findings produced a satisfactory proof that the ages between 1 and 40 contribute 65.16% of RTA. It was also shown that the second half of the year produces a higher accident rate and at a peak in December. Conclusion: RTA is a treat to lives and properties and every effort must be made to salvage the situation. [Thompson Amo, Serik Meirmanov. The epidemiology of Road Traffic Accident (RTA) in Ghana from 2001-2011. Life Sci J 2014;11(9):269-275]. (ISSN:1097-8135). http://www.lifesciencesite.com. 37 Key words: epidemiology, road traffic accident, death, injuries, Ghana Introduction
Road traffic accident (RTA) has become an important public health concern over the past decades as an estimated Global figure of 1.3 million people loses their lives in every year. It is believed that almost 3,400 lives are lost every day and millions of people suffer various degrees of injuries and disabilities as a result of RTA. These injuries and deaths, according to the World Health Organization (WHO) have immense influence on victims' families, employment and communities they belong, whose lives are often changed irreversibly by these calamities. Currently, road traffic casualties rank 9th in the “Global Burden of Diseases” but expected to become the 3rd leading cause of death and disability by the year 2020 except fresh, effective and efficient safety actions are engaged (WHO, 2013) [1].
Lower and middle-come countries have higher rates of RTA as they account for about 90% of the total fatalities. This is very disturbing since 60% of these deaths are persons between 15-44 years old, who are the majority of the working force for most nations. However, there are differences among road traffic death in respect of WHO Regions. The African Region continues to be the highest with an average population at risk of 24.1 deaths per 100,000 population (WHO, 2013) [1]. The World Bank estimated that by the year 2020, an annual road traffic fatalities will increase by 80% in developing countries
and therefore, it is important to develop strict measures that can help reverse the Bank’s deadly prediction [2].
The road traffic accident is among the highest causes of death in Ghana, after malaria, diarrhoeal and respiratory diseases. The world health organization country fact sheet 2006 ranked road traffic accident as the 9th cause of death in Ghana killing about 5000 (3.00%) of total deaths [3]. Again, the world health ranking puts estimated that 5,032 (2.68%) deaths was caused by traffic accident with age adjusted death rate of 28.11 per 100,000 ranking the country at 41 in the world [4]. The WHO in 2009 estimated that the average population at risk is 7.9 per 100,000 population. Ghana according to the world health organization report in 2010 showed that, road traffic fatalities were 1986 of which 76% were men and 24% being women with an estimated Gross Domestic Product (GDP) lost due to road crashes was 1.6% valued at $419 million [5]. Other shocking Figures on Road Accidents by the National Road Safety Commission (NRSC) proclaimed that there were 19 fatalities per 10,000 vehicles in 2010.The statistics showed that 43% of the fatalities involved pedestrians while 53% involved occupants of vehicles. Outrageously 23% of all pedestrian fatalities involved children under the age of 16 years old. In 2011, there were 2,330 road accidents bringing it to an average of 7 accidents per day across the country. In 2012, by the
Life Science Journal 2014;11(9) http://www.lifesciencesite.com
270
end of November, 13,535 crashes have been recorded occasioning over 2,069 deaths across the country. In December, 2012 alone, there were 246 deaths and 1,260 injuries in vehicular accidents. According to the Commission, the major cause of road accidents in Ghana is due to over speeding which accounts for 60% of total crashes in the country. It is essential that the country does not lose sight in the fight against preventable diseases, maternal and infant mortality rate due to the sheer pressure of accident emergencies. A very immediate and drastic measures must be carried on to safe many lives and properties
The objective of this research is to analyse the epidemiological data of road traffic accident which occurred in Ghana between 1st January 2001 to 31st December, 2011. The analysis will specifically focus on mortality, age, gender, monthly incidence and types of vehicles involved in causing this havoc. This research is very unique and the first of its kind to be conducted in the country which is intended to add additional knowledge and draw attention of the authorities about the dangers on the road. It is our firm belief that the results would aid the policy and decision makers offer a better solution in ensuring that sanity is guaranteed for the users of the roads. Materials and Methods
The precise plan adopted in this study is a descriptive and a cross-sectional method to explore the incidence of RTA in the country. The Building and Road Research Institute (BRRI) under Council for Scientific and Industrial Research (CSIR) in collaboration with the Motto Traffic and Transport Unit (MTTU) of the Ghana Police Service keep data of all reported cases of road traffic accidents across the country. It should be noted that the WHO and other international bodies who needed information on traffic accidents fall on this source. The Analysis was based on data obtained from BRRI from 1st January 2001 to 31st December, 2011. Selected parameters were all deaths, injuries, vehicles involved, gender, age and months of traffic accidents were analysed and presented in figures using Microsoft excel 2010. Results
The year trends within which these accidents occurred, the total number of injuries within this period and persons who lost their lives is presented in figure 1. It can be observed that there has been a significant increase in the number of fatalities from 2001 to 2011. In 2001, a total of 14,833 people were involved in RTA, which resulted in 1,660 deaths; 989 were pedestrians and 671 of the deaths were passengers. In respect of 2011, 16,219 crashes occurred which resulted 2,199 deaths and 14,020 suffered various degrees of injury. Out of this figure, 1,519 pedestrians and 680 passengers lost their lives.
This shows an increase of 4.46% between 2001 and 2011.
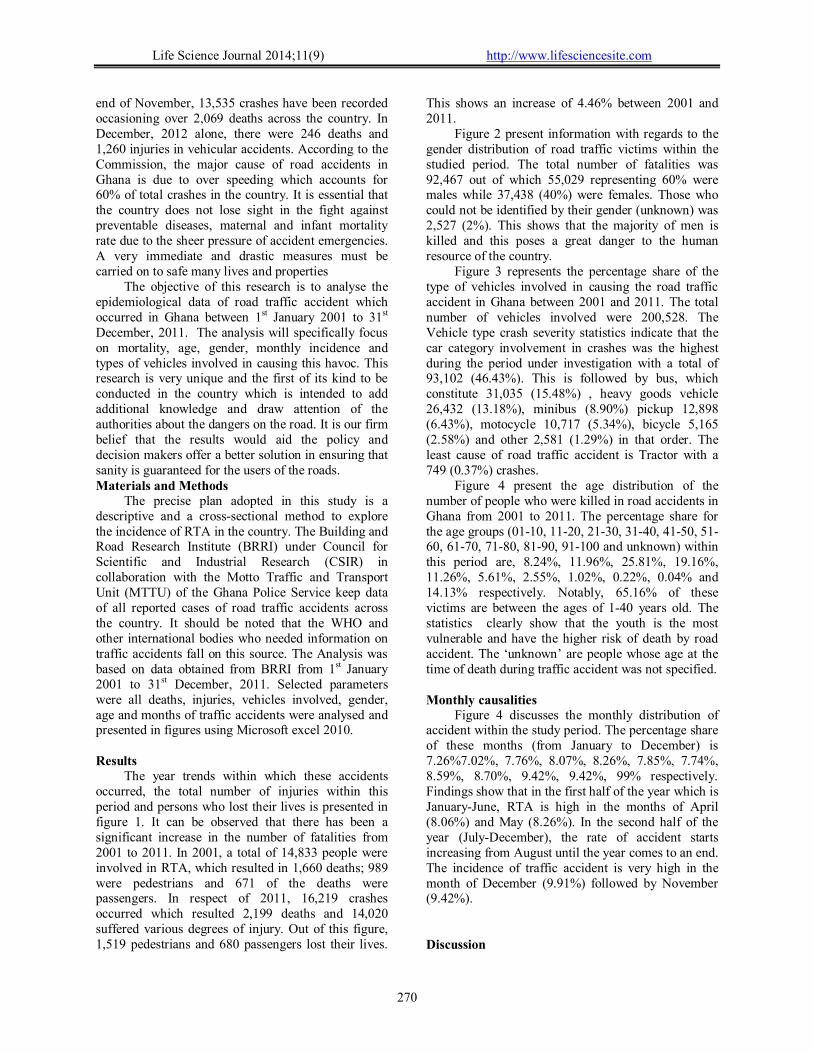
Figure 2 present information with regards to the gender distribution of road traffic victims within the studied period. The total number of fatalities was 92,467 out of which 55,029 representing 60% were males while 37,438 (40%) were females. Those who could not be identified by their gender (unknown) was 2,527 (2%). This shows that the majority of men is killed and this poses a great danger to the human resource of the country.
Figure 3 represents the percentage share of the type of vehicles involved in causing the road traffic accident in Ghana between 2001 and 2011. The total number of vehicles involved were 200,528. The Vehicle type crash severity statistics indicate that the car category involvement in crashes was the highest during the period under investigation with a total of 93,102 (46.43%). This is followed by bus, which constitute 31,035 (15.48%) , heavy goods vehicle 26,432 (13.18%), minibus (8.90%) pickup 12,898 (6.43%), motocycle 10,717 (5.34%), bicycle 5,165 (2.58%) and other 2,581 (1.29%) in that order. The least cause of road traffic accident is Tractor with a 749 (0.37%) crashes.
Figure 4 present the age distribution of the number of people who were killed in road accidents in Ghana from 2001 to 2011. The percentage share for the age groups (01-10, 11-20, 21-30, 31-40, 41-50, 51-60, 61-70, 71-80, 81-90, 91-100 and unknown) within this period are, 8.24%, 11.96%, 25.81%, 19.16%, 11.26%, 5.61%, 2.55%, 1.02%, 0.22%, 0.04% and 14.13% respectively. Notably, 65.16% of these victims are between the ages of 1-40 years old. The statistics clearly show that the youth is the most vulnerable and have the higher risk of death by road accident. The ‘unknown’ are people whose age at the time of death during traffic accident was not specified. Monthly causalities
Figure 4 discusses the monthly distribution of accident within the study period. The percentage share of these months (from January to December) is 7.26%7.02%, 7.76%, 8.07%, 8.26%, 7.85%, 7.74%, 8.59%, 8.70%, 9.42%, 9.42%, 99% respectively. Findings show that in the first half of the year which is January-June, RTA is high in the months of April (8.06%) and May (8.26%). In the second half of the year (July-December), the rate of accident starts increasing from August until the year comes to an end. The incidence of traffic accident is very high in the month of December (9.91%) followed by November (9.42%).
Discussion

Life Science Journal 2014;11(9) http://www.lifesciencesite.com
271
This study analysed the epidemiology of road traffic accident that has occurred in Ghana between 1st January, 2001 to 31st December, 2011. The analysis takes into consideration the total accidents, fatalities, injuries, vehicles involved, gender, age and months within which these tragedies occurred. It is evident that RTA remains cumbersome and a treat to both lives and properties. The total number of deaths per 100,000 population as mention earlier is 7.9 which is higher compared to neighbouring countries like Burkina Faso (4.19%) and Togo (7.1) (WHO, 2009) [5]. The analyses show that indeed a lot of people lose their lives and suffered various degrees of injuries during a traffic accident. There is an indication that pedestrians are very vulnerable and stands the high risk of death when RTA occurs. A total of 125,681 RTA involving 150,949 was recorded within this period. There were 96,888 (64.19%) passengers and 54,061 (35.81%) pedestrian. Those who lost their lives was 21,283 (14.14%) and 129,666 (85.86%) sustained various degrees of injuries. This shows an average of 1,934 deaths with the corresponding population at risk of 8.05 per 100,000 population in a year. The percentage share of lives lost for car occupants is 38.50% (8,194) while pedestrians were 61.50% (13,283). It appears that pedestrians are less involved but at a higher risk of death in a traffic accident. This confirms the NRSC report in 2010 which says that between 2002-2008, an average of 1,883 perished each year but contradict the WHO Global Status Report on Road Safety 2013, which identified that pedestrians alone constitutes 37% of total deaths under the vulnerable road users. It must be noted that in the year 2004 and 2009 there was a sharp increase in the traffic accident rate. The NRSC indicated that the increase in 2004 could be linked to political activities since similar incident occurred in 2000 [6]. However, the reason for the increased in 2009 was yet to be discovered.
The results also showed that males have a higher
risk of death in RTA than women as presented in figure 2. The results show that males have 1.5 times higher rate of accident than females. A similar results was obtained by Nilambar et al 2004 [7] and Mondal et al 2011[8], which says that males have 4.9 times higher incidence than female and an average of 84.9% males died in road traffic accident over females with 15.1% respectively. This could be associated with the fact that car, minibuses and other commercial vehicles which contribute much in the RTA have male drivers. It is also believed that social lifestyle of men could contribute immensely and makes them very vulnerable to this canker. This situation if not prevented is likely to produce single parent and women who loses their husbands may find it difficult to look after their
children. Also, some survivors and their families sometimes go through painful and series of consequences such a disability, injury and rehabilitation, costs of care and funeral expenses which serves as a tool to push them into abject poverty (WHO, 2004) [9].
The findings also show that only three types of vehicles such as car (46.43%), bus (15.48%) and heavy goods vehicles (13.18%) contribute 75.09% of RTA. This could be linked to the growing number of annual vehicle population trend in the country. It is estimated that between 1991 and 2000, the total number of vehicles was 43,825 but increased to 61,427 between 2001 and 2010 showing a 42 % increase in the annual growth rate of vehicle population (NRSC, 2010). An increase in population growth with corresponding increase in vehicles and urbanization are among factors considered to be increasing traffic accidents in the country. Kopits and Cropper (2003) [10] identified that an increased in motor vehicles in low-income nations, with the determination of boosting economic growth usually brings an increase in road traffic accidents. Besides this, the causalities could also be attributed to the higher number of used cars imported which has been kept unused in other developed nations. Chalfin, 2008 [11] estimated that 80% of imported vehicles were used cars. Some of these cars are kept unused by some developed nations for various reasons, but are allowed to be brought and apply on the road. It is important that the quality of used car imported must be checked properly and stakeholders such as the National Road Safety Commission (NRSC), the Driver and Vehicle Licensing Authority (DVLA), the Mottor Transport and Traffic Unit (MTTU), the Ghana Highway Authority (GHA), the Department of Urban Roads and the Department of Feeder Roads among others fashioned a comprehensive structure adopted by United Nation (UN) for road safety with the view to reverting the rising tendencies and misfortunes in the country.
Age specific patterns of RTA in the country were analysed to identify which age group is more prone and likely to be affected by this tragic event. Findings produced a satisfactory proof that the ages between 1 and 40 contribute 65.16% of RTA which occurred within 2001-2011. It was observed that as people grow older, their risk of RTA diminishes. This could be linked to the fact that people begin to value and more careful about their lives when they grow older coupled with additional responsibilities. The possible reason could also be that in general the population of the country is very young with 38.3% under 15 years, 57% between 15 and 64 years and 65 years and over constituting 4.7% of the population (GSS, 2010). It is shown that age category of 26-30

Life Science Journal 2014;11(9) http://www.lifesciencesite.com
272
(14.26%) stands a high risk of RTA. This is in line with WHO, 2013 which suggest that about 60% of traffic deaths are between the ages of 15-44 years old. Nilambar et al, 2004 [8] & Mondal et al, 2011 [7] , made a similar observation that 22.3% and 35.05% of crash death are between 30-39 and 30-44 years old respectively . This has serious economic consequences because they are the most productive age group which is needed in the nation's development agenda.
The monthly distribution shows that the rate of accident is low (46.22%) in the first half of the year (January-June) compared to the last six months that is July-December (53.78%). Generally, There are two rainy seasons in the country. The heaviest rain in the south is from April until June, and a lighter rain is during September and October and in the northern part, it usually starts from April until October every year. Therefore, an increase in RTA could be attributed to heavy rains with a wet condition of some of the roads. Similar finding was observed by Nilambar et al 2003 which says that there was an increase in RTA in October which could be linked to rainy season with associated bad condition of the road network. In this study, a traffic accident is very high in December (9.91%). The sharp increase in the RTA at the last quarter of the year, especially in December could be attributed to the Christmas festivity by Christians. Available statistics by the Ghana Statistical Service (GSS) in 2010 showed that Christians are the majority with 71.2% of the population. There are lots of business activities and social gathering in December. In the same vain, people travel to spend this occasion with families and friends in different parts of the country which could be a recipe to this cancer.
The NRSC in the 2010 annual report admitted that the road traffic agencies’ performance in general was unsatisfactory estimated to be in the range of 2-3% of the projected output. This does not give a good picture about an agency responsible for road safety. Conclusion
Evidence from the results shows that, pedestrians are the most vulnerable road users as they stands the high risk of death when RTA occurs. Males have a higher incidence of death during a traffic accident as compared to their female counterparts. It was also discovered that, three types of vehicles such as car, heavy goods vehicles and bus contribute a high accident rate in the country. The most affected in terms of age when RTA occurs are those between 21-30 years old. RTA is very high in the last quarter of the year (October, November and December) but at its peak in December.
RTA can be reduced if the existing laws are properly enforced by the authorities. It is recommended that the stakeholder agencies intensify the safety measures such as road safety audit, emergency response services, safety education to drivers and the general public, the first aid post, speed radar guns and alcometers among others to reduce the incidence. A stiffer punishment should be imposed on a person or group of persons whose action or inaction contribute to this unfortunate incidence. It is important that the road safety agencies develop strategies and vigorously ensure the implementation of policies that could bring these disturbing rising trends of RTA under control.
Figure 1. Year trend, total affected people, injury, passengers and pedestrians killed by RTA in Ghana from 2001-2011
0
1000
2000
3000
4000
5000
6000
7000
2001 2002 2003 2004 2005 2006 2007 2008 2009 2010 2011
Total
Pedestrians killed
Injury
Passengers Killed
Years
Life Science Journal 2014;11(9) http://www.lifesciencesite.com
273
Figure 2. The gender distribution of victims of road traffic accident in Ghana from 2001-2011
Figure 3. The type of vehicles involved in the RTA in Ghana from 2001-2011
Figure 4. Age Distribution of fatalities of road accidents in Ghana from 2001-2011
59%
39%
2%
Male
Female
Unknown Sex
Gender
46.43%
13.18%
0.37%
15.48%
8.90%5.34% 6.43%
2.58% 1.29%
Vehicle type
11345
16474
35541
26382
15502
7723
35131403 300 65
19451
Age Distribution

Life Science Journal 2014;11(9) http://www.lifesciencesite.com
274
Figure 5. Monthly distribution of RTA in Ghana from 2001-2011
Competing interests:
The authors declare that they have no competing interests Author’s contribution
Amo Thompson: Analysis and interpretation of data
Serik Meirmanov, MD, Phd: Revising the work and approved it for publication Acknowledgement
Many thanks to Dr. Ing. Eugene Atiemo, Director of BRRI and his staff for making the data available for the analysis.
To Ritsumeikan Asia Pacific University for supporting of this research. References 1. Abdul Ghaffar, Adnan A. Hyder, Tayyeb I.
Masud: The burden of road traffic injuries in developing countries: the 1st national injury survey of Pakistan: JRIPH 118: 211-217 (2004)
2. Arvind Kumar MD, Sanjeev Lalwani MD, Deepak Agrawal m CH, Ravi Rautji MD TD Dogra MD: Fatal road traffic accidents and their relationship with head injury: an epidemiological survey of five years: IJNT Vol. 5, No. 2, pp. 63-67 (2008)
3. Baker, Therese L.: Doing social research 3rd edition. MacGrawhill Companies Inc. (1999).
4. B. Mishra: Epidemiological study of road traffic accident cases from western Nepal: IJCM Vol-35: pp. 115-121 (2010).
5. Chalfin, Brenda: Cars, the Customs Service, and Sumptuary Rule in Neoliberal Ghana. Comparative Studies in Society and History, 50 (2), 424-453 (2008)
6. Charles N mock, Samuel n Forjuoh, Frederick P Rivara: Epidemiology of transport-related injuries in Ghana: AA&P 31 pp. 359-370 (1999)
7. Elizabeth Kopits and Maureen Cropper: The World Bank, Development Research Group, Infrastructure and Environment. A working paper (2003). Available on: http://www-wds.worldbank.org/servlet/WDSContentServer/WDSP/IB/2003/05/23/000094946_03051404103341/Rendered/PDF/multi0page.pdf
8. Ghana statistical service: The population and housing census (2010)
9. Jha N.: Epidemiological study of road traffic accident cases: A study from eastern Nepal: Reginal health forum WHO South-East Asia region; vol.8 (2004)
10. National Road Safety Commission Annual Report, Accra, Ghana. (2010)
11. Nilamber J, D.K. Srinivasa, Gautam R. Jagdish S.: Epidemiological study of road traffic cases: a study from south India. IJCM Jan-Mar; xxi(20-24) (2004)
12. Khare N, Gupta SK, Varshney A, Athavale AV.: Epidemiological study of road traffic accident cases attending tertiary care hospital, in Bhopal Madhya Pradesh. Natl Community Med; 3 (3): 395-9 (2012).
13. P. Mondal, Abhishek Kumar, U.D. Bhangale and Dinesh Tyagi (2011). A silent tsunami on India: a
0.00%
2.00%
4.00%
6.00%
8.00%
10.00%
12.00%
Months (%)
Months

Life Science Journal 2014;11(9) http://www.lifesciencesite.com
275
comprehensive analysis of epidemiological aspects of road traffic accidents: BJMMR 1(1): pp 14-23
14. Pedan M, Scrurfield R.: The World report on road traffic injury prevention. WHO, Geneva. (2004).
15. Performance audit report of the Auditor-General on Road Safety. Accra, Ghana. (2007). Available at: http://www.ghaudit.org/reports/NATIONAL_ROAD_SAFETY.pdf
16. Raimundas lunevicius, Hadley K. Herbert, Adnan A Hyder: The epidemiology of road traffic
injuries in the republic of Lithuania, 1998-2007. EJPH, Vol. 20, No. 6, 702–706 (2010).
17. United Nations: Global plan for decade of action for road safety 2001-2020 (2011).
18. World bank (2013). The Challenge of Noncommunicable Diseases and Road Traffic injuries in Sub-Saharan Africa. An overview
19. World Health Organization (2004 update) the global burden of diseases.
20. World Health Organization (2013). Global status report on road safety: supporting a decade of action.
5/23/2014