Life, Physical, and Social Science Occupations
21
1 Life, Physical, and Social Science Occupations in Allegheny County 2015-2025
Transcript of Life, Physical, and Social Science Occupations

1
Life, Physical, and Social Science Occupations
in Allegheny County 2015-2025

2
Life, Physical, and Social Science Occupations Regions
Code Description
42003 Allegheny County, PA Timeframe 2015 - 2025 Datarun 2016.1 – QCEW Employees

3
Occupation Summary for Life, Physical, and Social Science Occupations
7,513 8.7% $29.36/hr Jobs (2015) % Change (2015-2025) Median Hourly Earnings
27% above National average Nation: 12.2% Nation: $31.80/hr

4
Growth
7,513 8,164 651 8.7% 2015 Jobs 2025 Jobs Change (2015-2025) % Change (2015-2025)
Occupation 2015 Jobs 2025 Jobs Change % Change
Animal Scientists (19-1011) 4 5 1 25%
Food Scientists and Technologists (19-1012) 30 41 11 37%
Soil and Plant Scientists (19-1013) 44 52 8 18%
Biochemists and Biophysicists (19-1021) 151 199 48 32%
Microbiologists (19-1022) 194 211 17 9%
Zoologists and Wildlife Biologists (19-1023) 18 23 5 28%
Biological Scientists, All Other (19-1029) 78 89 11 14%
Conservation Scientists (19-1031) 54 56 2 4%
Foresters (19-1032) 36 37 1 3%
Epidemiologists (19-1041) 18 19 1 6%
Medical Scientists, Except Epidemiologists (19-1042) 1,298 1,468 170 13%
Life Scientists, All Other (19-1099) 25 29 4 16%
Astronomers (19-2011) 7 8 1 14%
Physicists (19-2012) 37 49 12 32%

5
Occupation 2015 Jobs 2025 Jobs Change % Change
Atmospheric and Space Scientists (19-2021) 31 37 6 19%
Chemists (19-2031) 765 783 18 2%
Materials Scientists (19-2032) 75 80 5 7%
Environmental Scientists and Specialists, Including Health (19-2041)
504 538 34 7%
Geoscientists, Except Hydrologists and Geographers (19-2042)
221 266 45 20%
Hydrologists (19-2043) 24 27 3 13%
Physical Scientists, All Other (19-2099) 88 98 10 11%
Economists (19-3011) 60 62 2 3%
Survey Researchers (19-3022) 152 136 -16 -11%
Clinical, Counseling, and School Psychologists (19-3031)
424 454 30 7%
Industrial-Organizational Psychologists (19-3032) 10 10 0 0%
Psychologists, All Other (19-3039) 80 87 7 9%
Sociologists (19-3041) 34 23 -11 -32%
Urban and Regional Planners (19-3051) 183 188 5 3%
Anthropologists and Archeologists (19-3091) 7 11 4 57%
Geographers (19-3092) 3 4 1 33%
Historians (19-3093) 10 10 0 0%
Political Scientists (19-3094) 5 7 2 40%
Social Scientists and Related Workers, All Other (19-3099)
54 57 3 6%
Agricultural and Food Science Technicians (19-4011)
55 60 5 9%
6
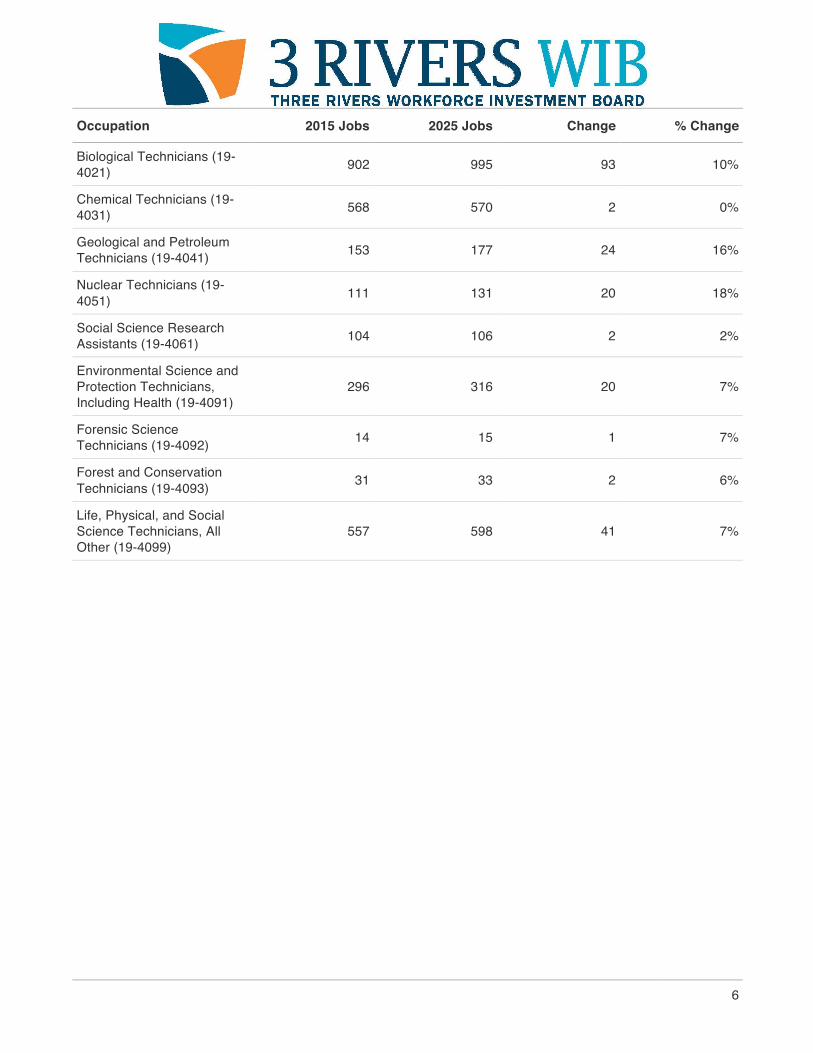
Occupation 2015 Jobs 2025 Jobs Change % Change
Biological Technicians (19-4021) 902 995 93 10%
Chemical Technicians (19-4031) 568 570 2 0%
Geological and Petroleum Technicians (19-4041) 153 177 24 16%
Nuclear Technicians (19-4051) 111 131 20 18%
Social Science Research Assistants (19-4061) 104 106 2 2%
Environmental Science and Protection Technicians, Including Health (19-4091)
296 316 20 7%
Forensic Science Technicians (19-4092) 14 15 1 7%
Forest and Conservation Technicians (19-4093) 31 33 2 6%
Life, Physical, and Social Science Technicians, All Other (19-4099)
557 598 41 7%

7
Percentile Earnings
$22.64/hr $29.36/hr $38.09/hr 25th Percentile Earnings Median Earnings 75th Percentile Earnings
Occupation 25th Percentile Earnings Median Earnings 75th Percentile
Earnings
Animal Scientists (19-1011) $28.40 $28.40 $28.40
Food Scientists and Technologists (19-1012) $19.55 $27.50 $36.87
Soil and Plant Scientists (19-1013) $18.48 $24.85 $30.37
Biochemists and Biophysicists (19-1021) $31.16 $37.83 $45.59
Microbiologists (19-1022) $22.31 $28.87 $47.11
Zoologists and Wildlife Biologists (19-1023) $18.99 $23.51 $27.76
Biological Scientists, All Other (19-1029) $27.69 $32.70 $38.09
Conservation Scientists (19-1031) $29.24 $36.78 $66.08
Foresters (19-1032) $26.06 $31.30 $35.62
Epidemiologists (19-1041) $28.97 $36.85 $45.75
Medical Scientists, Except Epidemiologists (19-1042) $27.66 $34.43 $43.45
Life Scientists, All Other (19-1099) $22.90 $27.95 $34.69
Astronomers (19-2011) $27.51 $43.18 $56.29
Physicists (19-2012) $45.22 $60.15 $76.05
Atmospheric and Space Scientists (19-2021) $34.49 $45.33 $51.73

8
Occupation 25th Percentile Earnings Median Earnings 75th Percentile
Earnings
Chemists (19-2031) $24.47 $31.07 $42.40
Materials Scientists (19-2032) $34.06 $46.36 $64.21
Environmental Scientists and Specialists, Including Health (19-2041)
$26.91 $37.82 $47.92
Geoscientists, Except Hydrologists and Geographers (19-2042)
$26.31 $39.78 $54.53
Hydrologists (19-2043) $35.47 $49.96 $55.28
Physical Scientists, All Other (19-2099) $39.04 $47.81 $54.86
Economists (19-3011) $25.55 $42.25 $62.73
Survey Researchers (19-3022) $14.58 $20.03 $30.39
Clinical, Counseling, and School Psychologists (19-3031) $21.95 $29.00 $37.26
Industrial-Organizational Psychologists (19-3032) $32.62 $40.18 $60.80
Psychologists, All Other (19-3039) $29.49 $42.89 $46.88
Sociologists (19-3041) $40.82 $53.24 $66.73
Urban and Regional Planners (19-3051) $21.78 $28.42 $39.67
Anthropologists and Archeologists (19-3091) $25.18 $32.70 $39.61
Geographers (19-3092) $30.17 $38.94 $43.39
Historians (19-3093) $21.12 $28.44 $35.28
Political Scientists (19-3094) $38.33 $53.09 $65.56
Social Scientists and Related Workers, All Other (19-3099) $28.94 $35.20 $40.47
Agricultural and Food Science Technicians (19-4011) $15.20 $18.93 $22.01
Biological Technicians (19-4021) $15.06 $18.49 $22.86
Chemical Technicians (19-4031) $16.90 $21.35 $26.80
Geological and Petroleum Technicians (19-4041) $21.35 $32.09 $37.98

9
Occupation 25th Percentile Earnings Median Earnings 75th Percentile
Earnings
Nuclear Technicians (19-4051) $31.24 $35.58 $41.38
Social Science Research Assistants (19-4061) $13.99 $20.20 $28.66
Environmental Science and Protection Technicians, Including Health (19-4091)
$16.96 $21.40 $28.58
Forensic Science Technicians (19-4092) $21.52 $26.20 $31.14
Forest and Conservation Technicians (19-4093) $17.52 $23.13 $29.28
Life, Physical, and Social Science Technicians, All Other (19-4099) $15.37 $20.72 $28.62
10
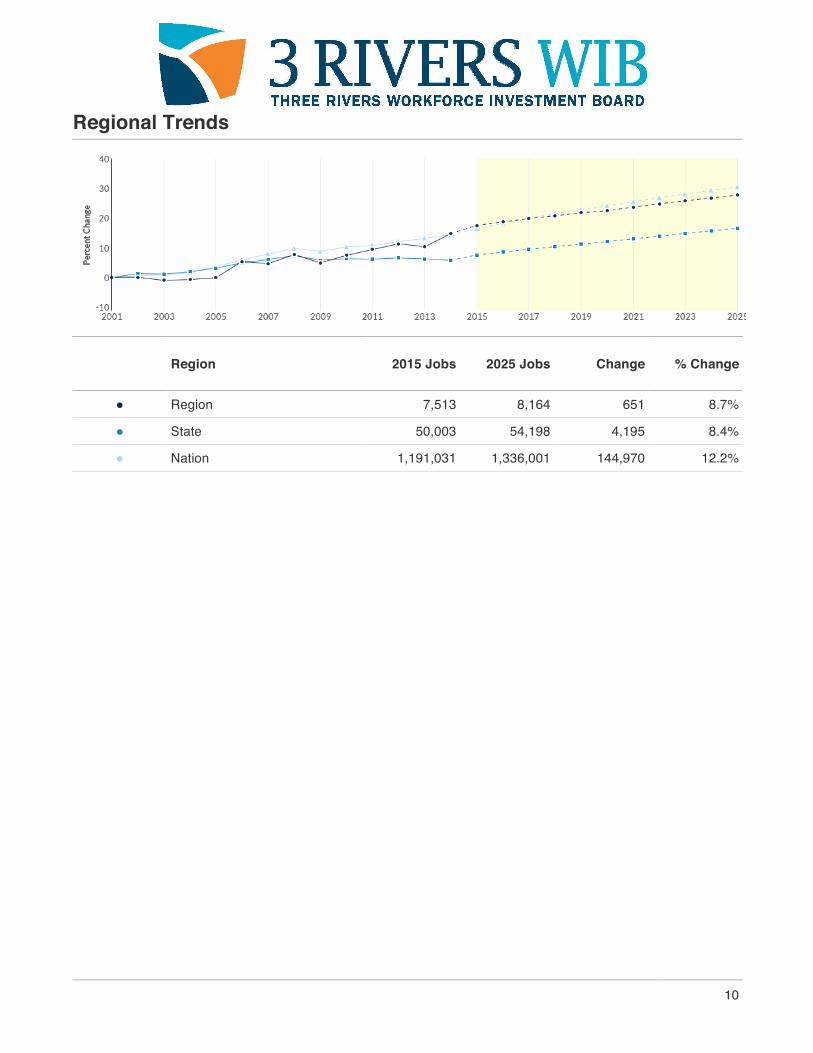
Regional Trends
Region 2015 Jobs 2025 Jobs Change % Change
! Region 7,513 8,164 651 8.7%
! State 50,003 54,198 4,195 8.4%
! Nation 1,191,031 1,336,001 144,970 12.2%

11
Regional Breakdown
* Highlighted areas show counties that contain the selected zip codes
ZIP 2025 Jobs
West Mifflin, PA 15122 (in Allegheny county) 1,071
Pittsburgh, PA 15222 (in Allegheny county) 750
Pittsburgh, PA 15219 (in Allegheny county) 617
Pittsburgh, PA 15213 (in Allegheny county) 471
Pittsburgh, PA 15238 (in Allegheny county) 377

12
Job Postings Summary
438 3 : 1 Unique Postings (Mar 2016) Posting Intensity (Mar 2016)
1,373 Total Postings Regional Average: 7 : 1
There were 1,373 total job postings for 43 Occupations in March 2016, of which 438 were unique. These numbers give us a Posting Intensity of 3-to-1, meaning that for every 3 postings there is 1 unique job posting.This is lower than the Posting Intensity for all other occupations and companies in the region (7-to-1), indicating that companies may not be trying as hard to hire this position.

13
Occupation Gender Breakdown
Gender 2015 Jobs 2015 Percent
! Males 4,619 61.5% ! Females 2,894 38.5%

14
Occupation Age Breakdown
Age 2015 Jobs 2015 Percent
! 14-18 24 0.3% ! 19-24 488 6.5% ! 25-34 1,972 26.2% ! 35-44 1,604 21.4% ! 45-54 1,693 22.5% ! 55-64 1,452 19.3% ! 65+ 280 3.7%

15
Occupation Race/Ethnicity Breakdown
Race/Ethnicity 2015 Jobs 2015 Percent
! White 6,599 87.8% ! Asian 456 6.1% ! Black or African American 290 3.9% ! Hispanic or Latino 111 1.5% ! Two or More Races 48 0.6% ! American Indian or Alaska Native 6 0.1% ! Native Hawaiian or Other Pacific Islander 3 0.0%

16
Occupational Programs
90 4,351 402 Programs (2014) Completions (2014) Openings (2014)
CIP Code Program Completions (2014)
42.0101 Psychology, General 746
26.0101 Biology/Biological Sciences, General 478
51.2314 Rehabilitation Science 289
45.1001 Political Science and Government, General 236
54.0101 History, General 233

17
Industries Employing Life, Physical, and Social Science Occupations
Industry Occupation Group Jobs in Industry
(2015)
% of Occupation
Group in Industry
(2015)
% of Total Jobs in
Industry (2015)
Research and Development in the Physical, Engineering, and Life Sciences (except Biotechnology) 1,970 26.2% 31.6%
Colleges, Universities, and Professional Schools 809 10.8% 3.5%
Federal Government, Civilian, Excluding Postal Service 504 6.7% 5.9%
Engineering Services 403 5.4% 3.9%
Testing Laboratories 376 5.0% 37.3%

18
Appendix A - Occupations
Code Description
19-1011 Animal Scientists
19-1012 Food Scientists and Technologists
19-1013 Soil and Plant Scientists
19-1021 Biochemists and Biophysicists
19-1022 Microbiologists
19-1023 Zoologists and Wildlife Biologists
19-1029 Biological Scientists, All Other
19-1031 Conservation Scientists
19-1032 Foresters
19-1041 Epidemiologists
19-1042 Medical Scientists, Except Epidemiologists
19-1099 Life Scientists, All Other
19-2011 Astronomers
19-2012 Physicists
19-2021 Atmospheric and Space Scientists
19-2031 Chemists
19-2032 Materials Scientists
19-2041 Environmental Scientists and Specialists, Including Health
19-2042 Geoscientists, Except Hydrologists and Geographers
19-2043 Hydrologists
19-2099 Physical Scientists, All Other
19-3011 Economists
19-3022 Survey Researchers
19-3031 Clinical, Counseling, and School Psychologists
19-3032 Industrial-Organizational Psychologists
19-3039 Psychologists, All Other
19-3041 Sociologists
19-3051 Urban and Regional Planners

19
Code Description
19-3091 Anthropologists and Archeologists
19-3092 Geographers
19-3093 Historians
19-3094 Political Scientists
19-3099 Social Scientists and Related Workers, All Other
19-4011 Agricultural and Food Science Technicians
19-4021 Biological Technicians
19-4031 Chemical Technicians
19-4041 Geological and Petroleum Technicians
19-4051 Nuclear Technicians
19-4061 Social Science Research Assistants
19-4091 Environmental Science and Protection Technicians, Including Health
19-4092 Forensic Science Technicians
19-4093 Forest and Conservation Technicians
19-4099 Life, Physical, and Social Science Technicians, All Other

20
Appendix B - Data Sources and Calculations Location Quotient Location quotient (LQ) is a way of quantifying how concentrated a particular industry, cluster, occupation, or demographic group is in a region as compared to the nation. It can reveal what makes a particular region unique in comparison to the national average. Occupation Data EMSI occupation employment data are based on final EMSI industry data and final EMSI staffing patterns. Wage estimates are based on Occupational Employment Statistics (QCEW and Non-QCEW Employees classes of worker) and the American Community Survey (Self-Employed and Extended Proprietors). Occupational wage estimates also affected by county-level EMSI earnings by industry. Completers Data The completers data in this report is taken directly from the national IPEDS database published by the U.S. Department of Education's National Center for Education Statistics. Institution Data The institution data in this report is taken directly from the national IPEDS database published by the U.S. Department of Education's National Center for Education Statistics. Industry Data EMSI industry data have various sources depending on the class of worker. (1) For QCEW Employees, EMSI primarily uses the QCEW (Quarterly Census of Employment and Wages), with supplemental estimates from County Business Patterns and Current Employment Statistics. (2) Non-QCEW employees data are based on a number of sources including QCEW, Current Employment Statistics, County Business Patterns, BEA State and Local Personal Income reports, the National Industry-Occupation Employment Matrix (NIOEM), the American Community Survey, and Railroad Retirement Board statistics. (3) Self-Employed and Extended Proprietor classes of worker data are primarily based on the American Community Survey, Nonemployer Statistics, and BEA State and Local Personal Income Reports. Projections for QCEW and Non-QCEW Employees are informed by NIOEM and long-term industry projections published by individual states.

21
Staffing Patterns Data The staffing pattern data in this report are compiled from several sources using a specialized process. For QCEW and Non-QCEW Employees classes of worker, sources include Occupational Employment Statistics, the National Industry-Occupation Employment Matrix, and the American Community Survey. For the Self-Employed and Extended Proprietors classes of worker, the primary source is the American Community Survey, with a small amount of information from Occupational Employment Statistics. State Data Sources This report uses state data from the following agencies: Pennsylvania Department of Labor and Industry, Center for Workforce Information and Analysis