Life Insurance: Stats and Facts
21
Life Insurance: Stats and Facts September 2015
-
Upload
gen-re -
Category
Healthcare
-
view
2.091 -
download
0
Transcript of Life Insurance: Stats and Facts
Life Insurance: Stats and FactsSeptember 2015
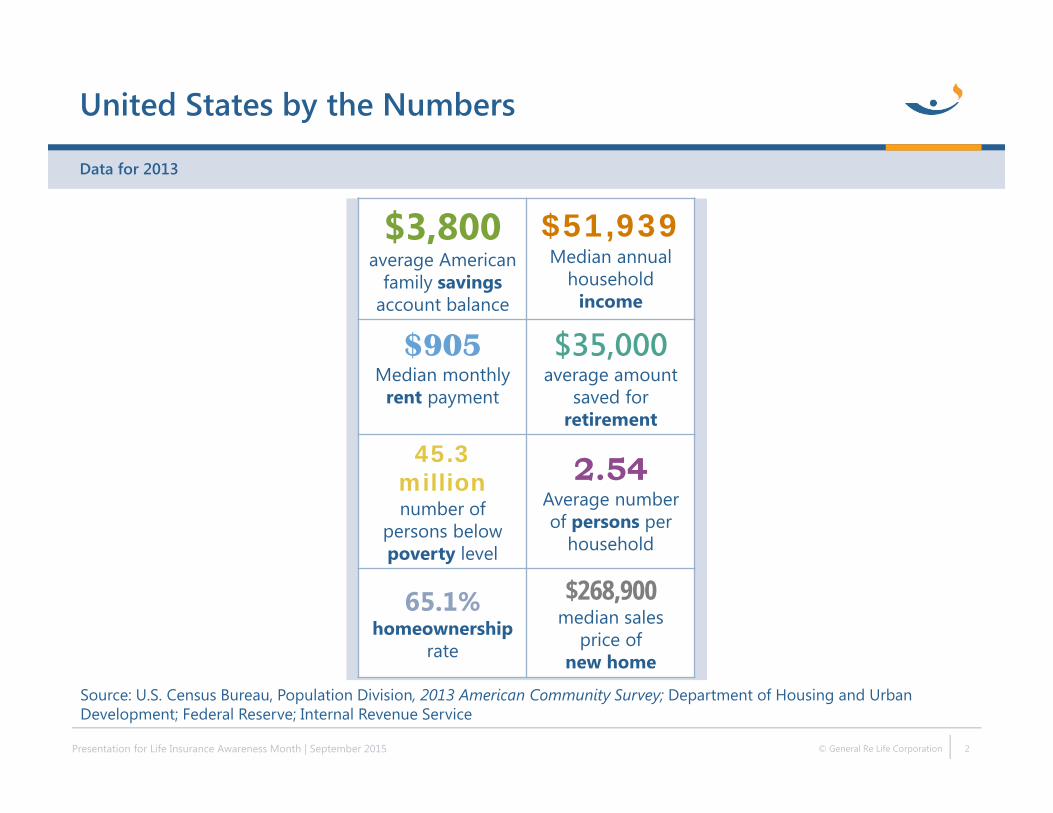
United States by the Numbers
Presentation for Life Insurance Awareness Month | September 2015 © General Re Life Corporation 2
$3,800average American
family savings account balance
$51,939Median annual
household income
$905Median monthly
rent payment
$35,000average amount
saved for retirement
45.3 million number of
persons below poverty level
2.54Average number of persons per
household
65.1% homeownership
rate
$268,900median sales
price of new home
Source: U.S. Census Bureau, Population Division, 2013 American Community Survey; Department of Housing and Urban Development; Federal Reserve; Internal Revenue Service
Data for 2013
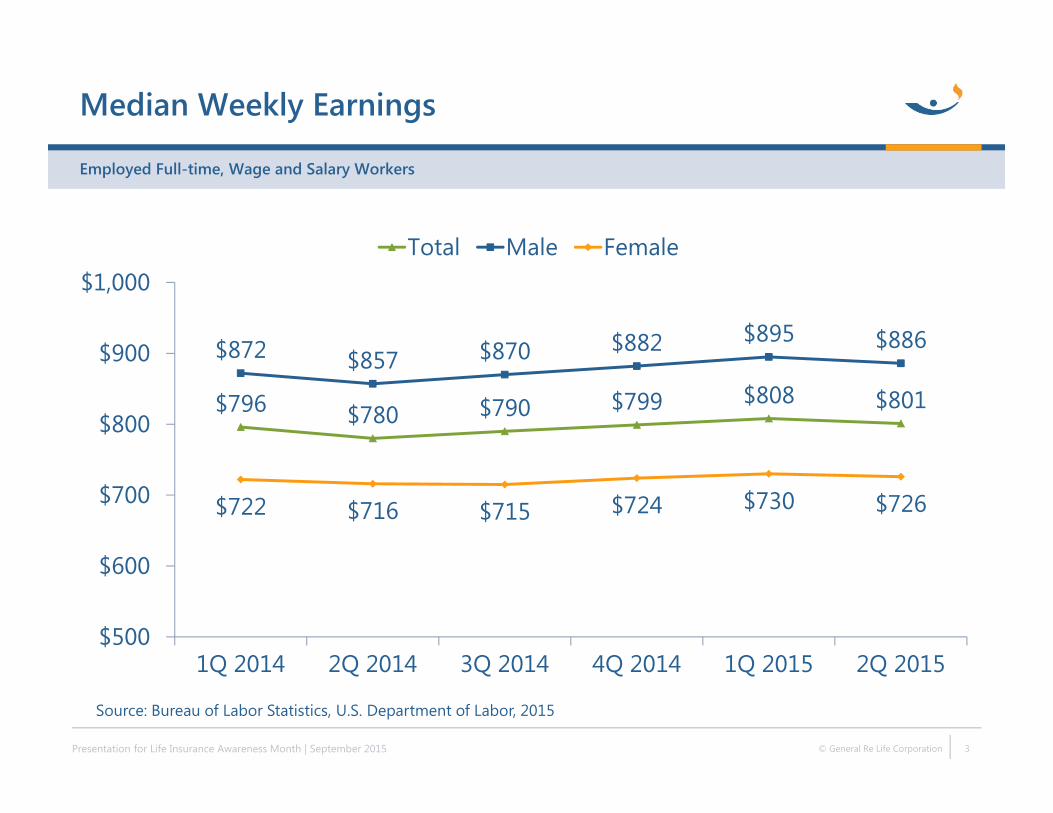
$796 $780 $790 $799 $808 $801
$872 $857 $870 $882 $895 $886
$722 $716 $715 $724 $730 $726
$500
$600
$700
$800
$900
$1,000
1Q 2014 2Q 2014 3Q 2014 4Q 2014 1Q 2015 2Q 2015
Total Male Female
Median Weekly Earnings
Employed Full-time, Wage and Salary Workers
Presentation for Life Insurance Awareness Month | September 2015 © General Re Life Corporation 3
Source: Bureau of Labor Statistics, U.S. Department of Labor, 2015
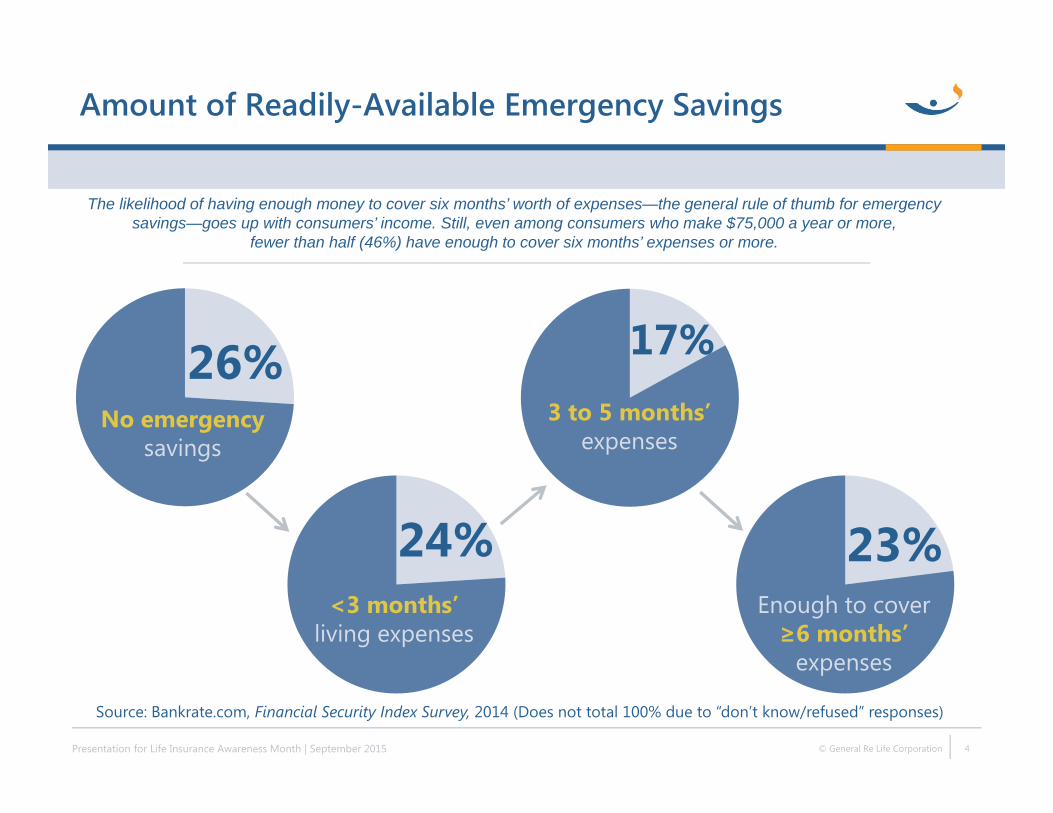
Amount of Readily-Available Emergency Savings
Presentation for Life Insurance Awareness Month | September 2015 © General Re Life Corporation 4
26%No emergency
savings
24%<3 months’
living expenses
17%3 to 5 months’
expenses
23%Enough to cover ≥6 months’
expenses
Source: Bankrate.com, Financial Security Index Survey, 2014 (Does not total 100% due to “don’t know/refused” responses)
The likelihood of having enough money to cover six months’ worth of expenses—the general rule of thumb for emergency savings—goes up with consumers’ income. Still, even among consumers who make $75,000 a year or more,
fewer than half (46%) have enough to cover six months’ expenses or more.
Life Expectancy by Age and Gender
Data for 2013
Presentation for Life Insurance Awareness Month | September 2015 © General Re Life Corporation 5
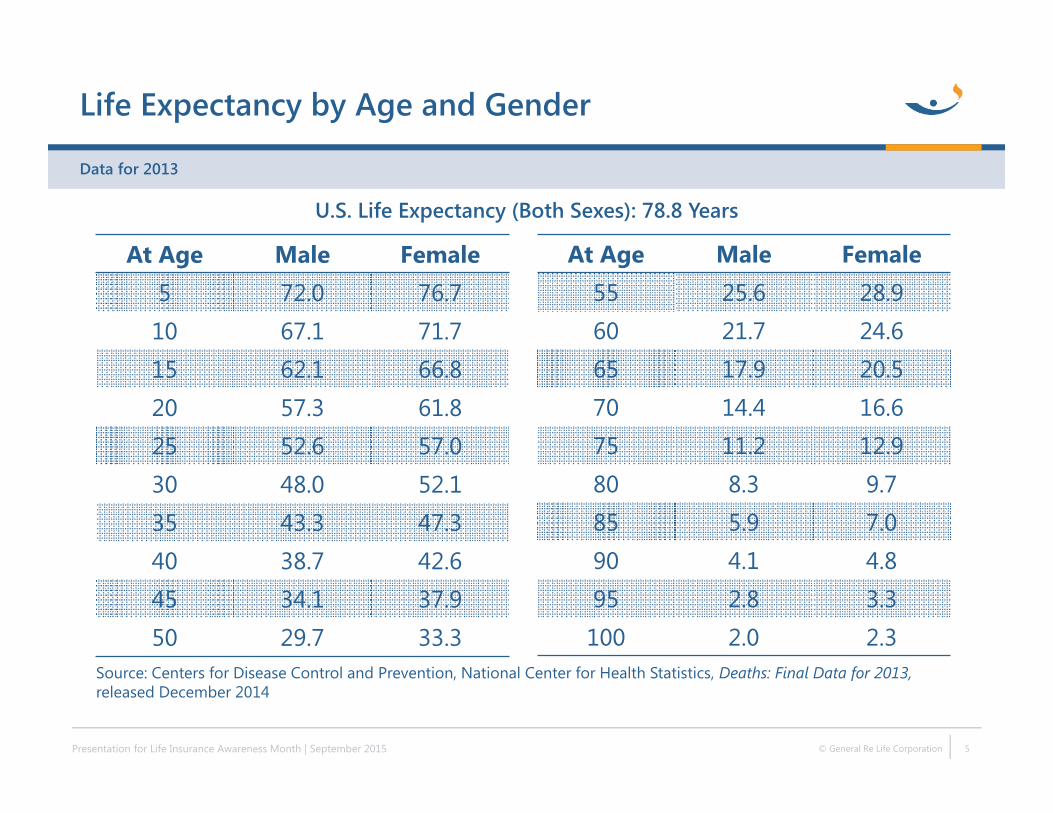
At Age Male Female5 72.0 76.710 67.1 71.715 62.1 66.820 57.3 61.825 52.6 57.030 48.0 52.135 43.3 47.340 38.7 42.645 34.1 37.950 29.7 33.3
At Age Male Female55 25.6 28.960 21.7 24.665 17.9 20.570 14.4 16.675 11.2 12.980 8.3 9.785 5.9 7.090 4.1 4.895 2.8 3.3100 2.0 2.3
Source: Centers for Disease Control and Prevention, National Center for Health Statistics, Deaths: Final Data for 2013, released December 2014
U.S. Life Expectancy (Both Sexes): 78.8 Years
States With the Highest and Lowest Death Rates
Data for 2013; Age-Adjusted
Presentation for Life Insurance Awareness Month | September 2015 © General Re Life Corporation 6
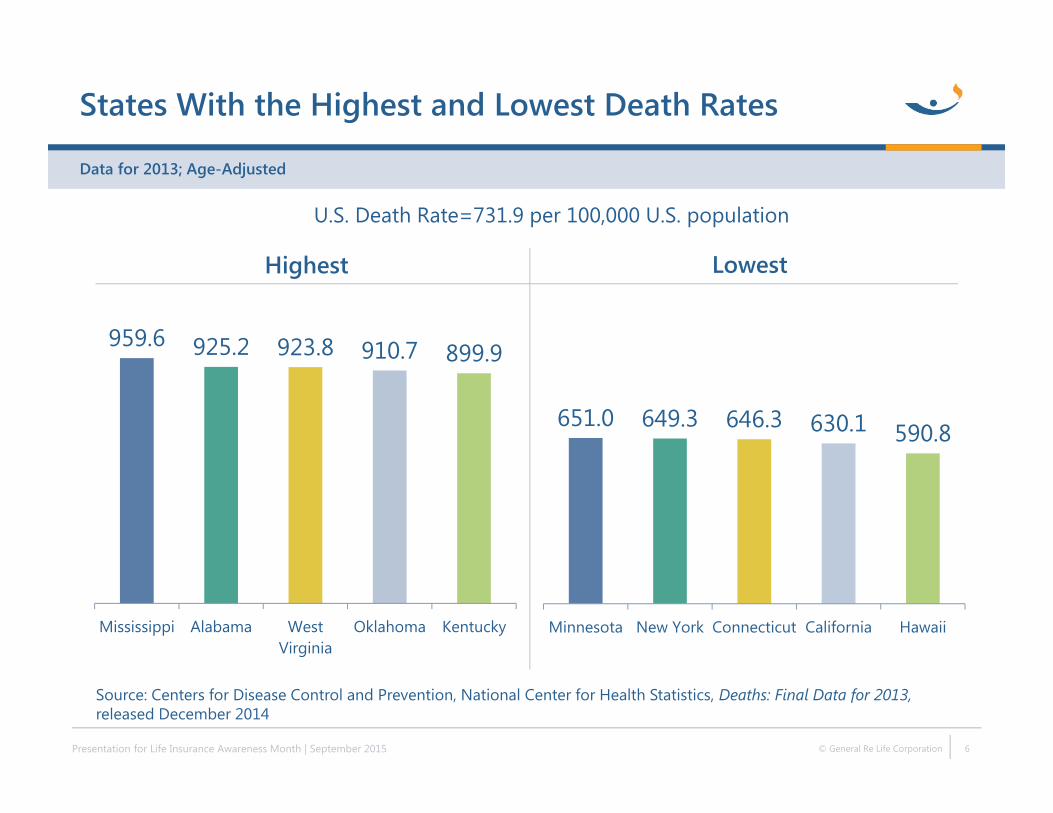
651.0 649.3 646.3 630.1 590.8
Minnesota New York Connecticut California Hawaii
959.6 925.2 923.8 910.7 899.9
Mississippi Alabama WestVirginia
Oklahoma Kentucky
Highest Lowest
Source: Centers for Disease Control and Prevention, National Center for Health Statistics, Deaths: Final Data for 2013, released December 2014
U.S. Death Rate=731.9 per 100,000 U.S. population
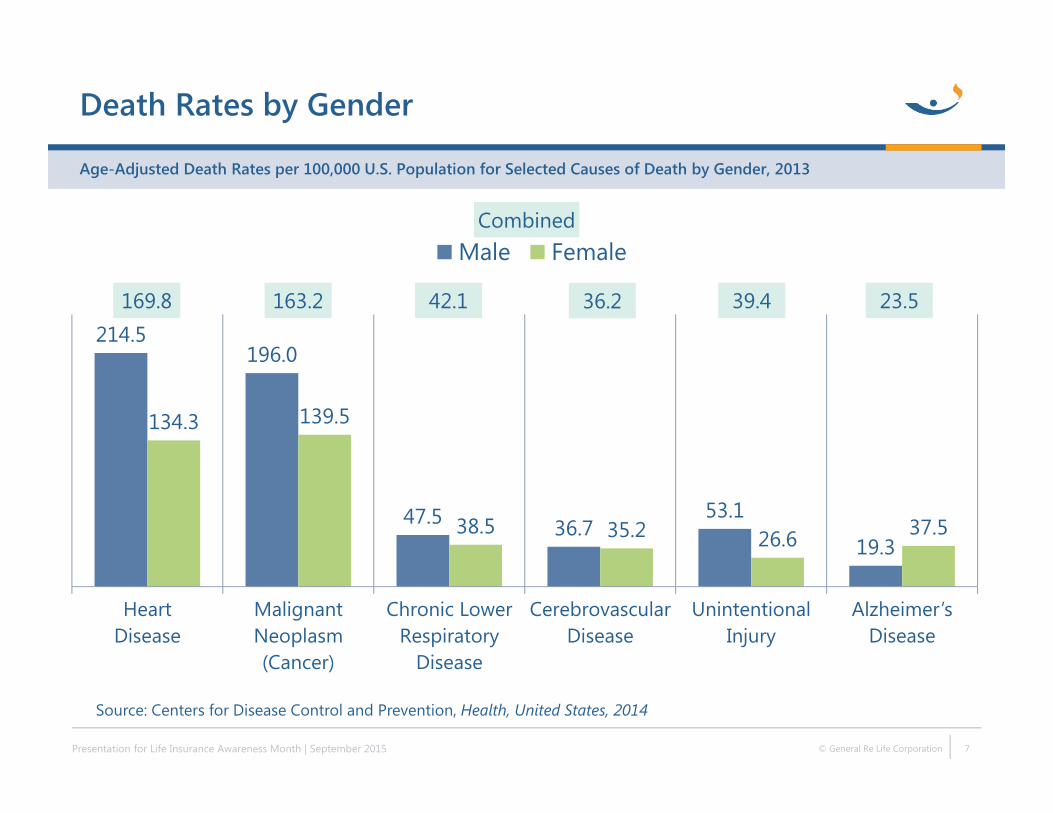
214.5196.0
47.5 36.753.1
19.3
134.3 139.5
38.5 35.2 26.6 37.5
HeartDisease
MalignantNeoplasm(Cancer)
Chronic LowerRespiratory
Disease
CerebrovascularDisease
UnintentionalInjury
Alzheimer’s Disease
Male Female
Death Rates by Gender
Age-Adjusted Death Rates per 100,000 U.S. Population for Selected Causes of Death by Gender, 2013
Presentation for Life Insurance Awareness Month | September 2015 © General Re Life Corporation 7
163.2
Combined
169.8 23.539.442.1 36.2
Source: Centers for Disease Control and Prevention, Health, United States, 2014
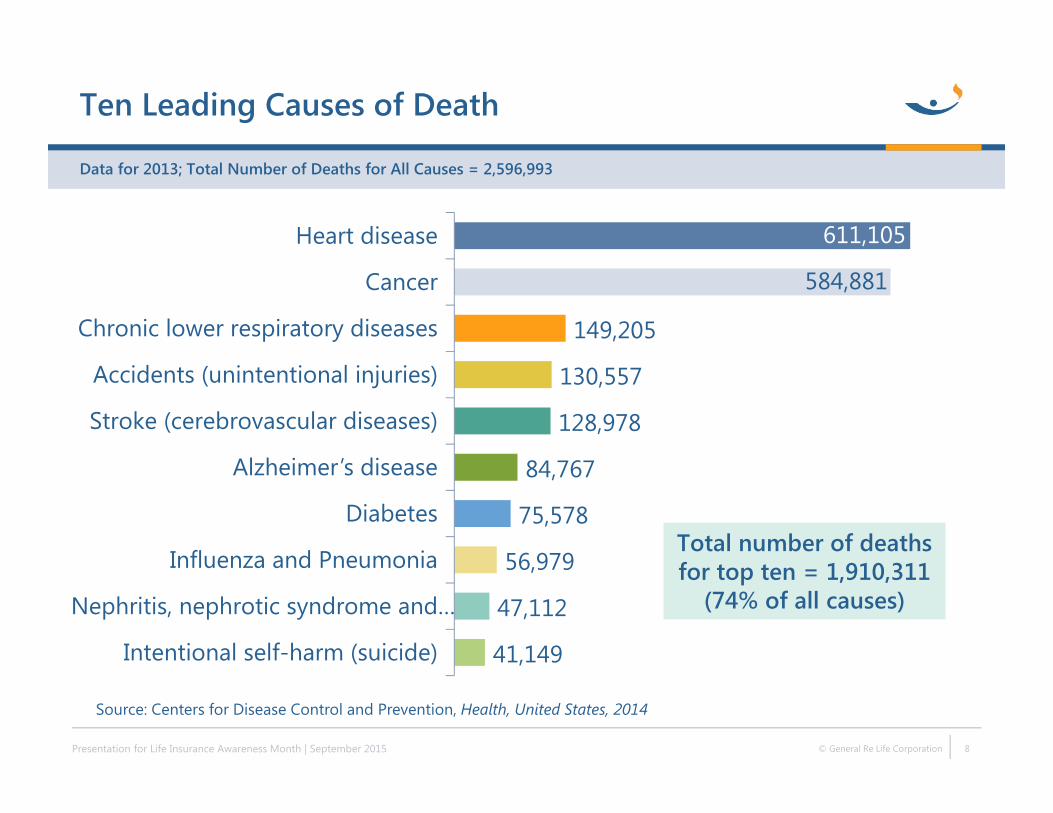
Ten Leading Causes of Death
Data for 2013; Total Number of Deaths for All Causes = 2,596,993
Presentation for Life Insurance Awareness Month | September 2015 © General Re Life Corporation 8
41,149
47,112
56,979
75,578
84,767
128,978
130,557
149,205
584,881
611,105
Intentional self-harm (suicide)
Nephritis, nephrotic syndrome and…
Influenza and Pneumonia
Diabetes
Alzheimer’s disease
Stroke (cerebrovascular diseases)
Accidents (unintentional injuries)
Chronic lower respiratory diseases
Cancer
Heart disease
Total number of deaths for top ten = 1,910,311
(74% of all causes)
Source: Centers for Disease Control and Prevention, Health, United States, 2014
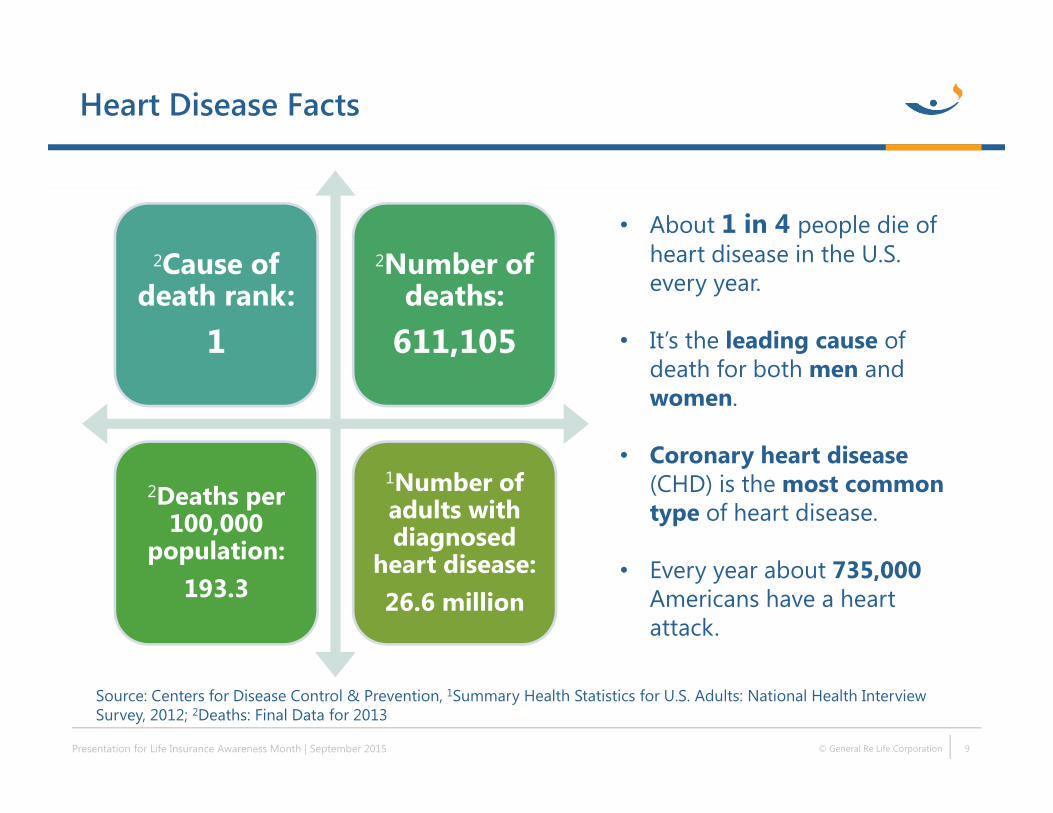
2Cause of death rank:
1
2Number of deaths:
611,105
2Deaths per 100,000
population:193.3
1Number of adults with diagnosed
heart disease:26.6 million
Heart Disease Facts
Presentation for Life Insurance Awareness Month | September 2015 © General Re Life Corporation 9
Source: Centers for Disease Control & Prevention, 1Summary Health Statistics for U.S. Adults: National Health Interview Survey, 2012; 2Deaths: Final Data for 2013
• About 1 in 4 people die of heart disease in the U.S. every year.
• It’s the leading cause of death for both men and women.
• Coronary heart disease (CHD) is the most common type of heart disease.
• Every year about 735,000Americans have a heart attack.
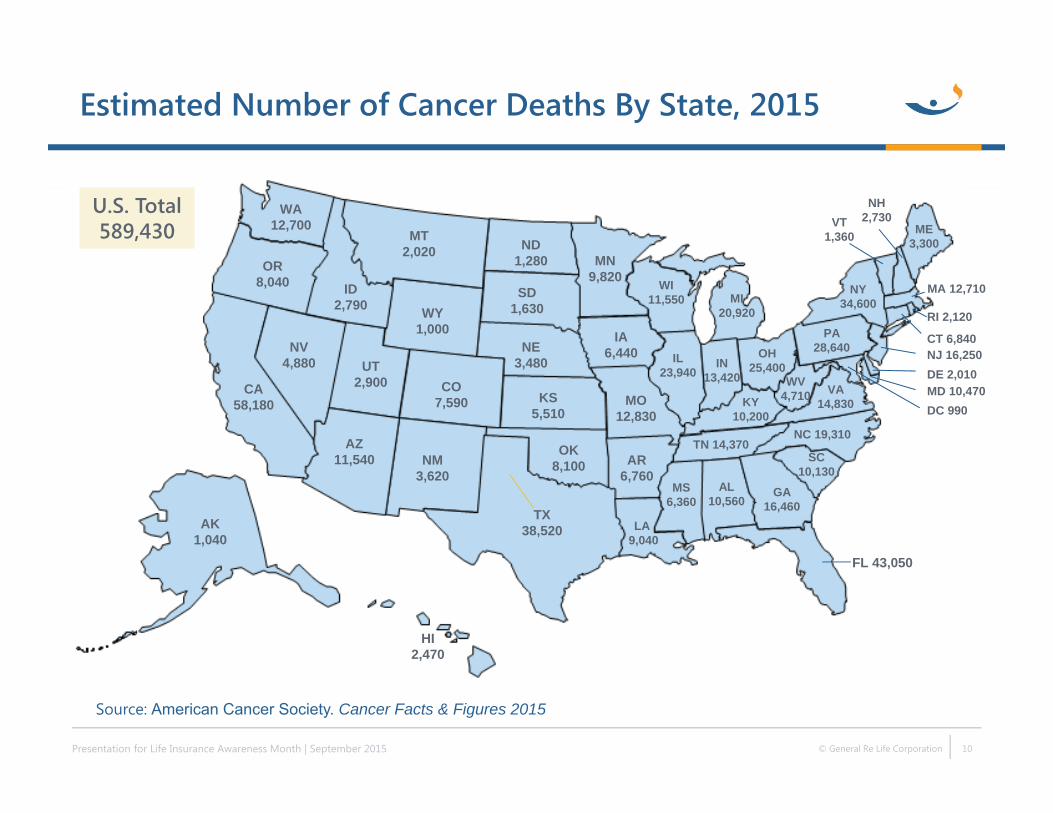
Estimated Number of Cancer Deaths By State, 2015
Presentation for Life Insurance Awareness Month | September 2015 © General Re Life Corporation 10
Source: American Cancer Society. Cancer Facts & Figures 2015
HI2,470
WA12,700
OR8,040
CA58,180
NV4,880
HI2,470
MT2,020
ID2,790
UT2,900
TX38,520
NM3,620
AZ11,540
CO7,590
ND1,280
SD1,630WY
1,000NE
3,480
KS5,510
OK8,100
MN9,820
IA6,440
MO12,830
WI11,550 MI
20,920
IL23,940
KY 10,200
AR6,760
LA9,040
TN 14,370
OH25,400IN
13,420
NC 19,310
FL 43,050
GA 16,460
AL10,560
MS6,360
SC10,130
ME3,300
NY34,600
PA28,640
VA14,830
WV 4,710
MA 12,710
RI 2,120
DE 2,010MD 10,470DC 990
NH2,730VT
1,360
U.S. Total589,430
NJ 16,250CT 6,840
AK1,040
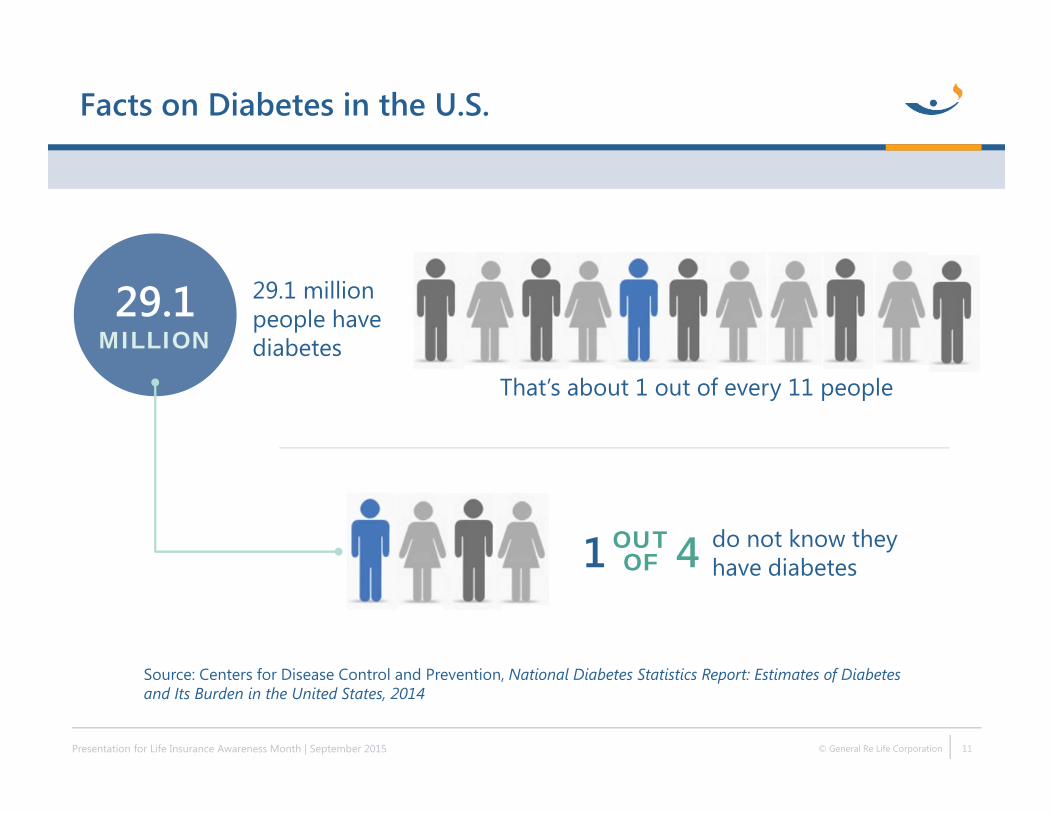
Facts on Diabetes in the U.S.
Presentation for Life Insurance Awareness Month | September 2015 © General Re Life Corporation 11
Source: Centers for Disease Control and Prevention, National Diabetes Statistics Report: Estimates of Diabetes and Its Burden in the United States, 2014
That’s about 1 out of every 11 people
29.1MILLION
29.1 million people have diabetes
1 4OUTOF
do not know they have diabetes
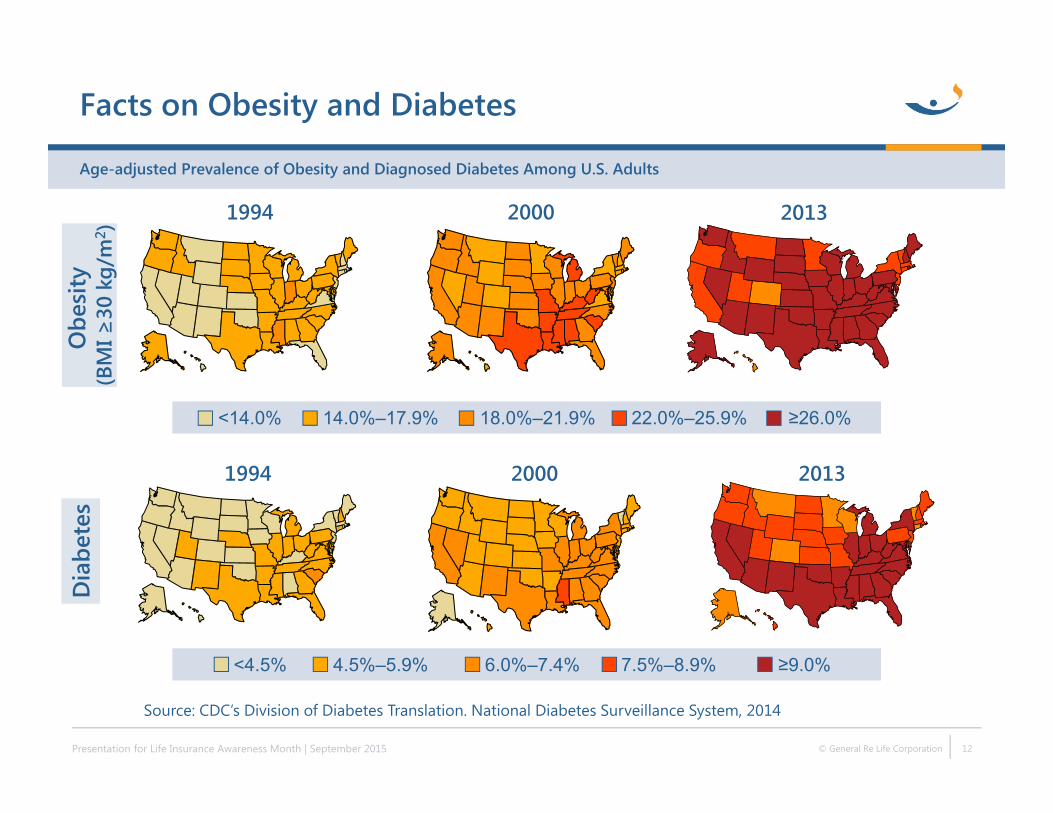
Facts on Obesity and Diabetes
Age-adjusted Prevalence of Obesity and Diagnosed Diabetes Among U.S. Adults
Presentation for Life Insurance Awareness Month | September 2015 © General Re Life Corporation 12
Obe
sity
(BM
I ≥30
kg/
m2 )
1994 2000
<14.0% 14.0%–17.9% 18.0%–21.9% 22.0%–25.9% ≥26.0%
2013
Dia
bete
s
1994 2000
<4.5% 4.5%–5.9% 6.0%–7.4% 7.5%–8.9% ≥9.0%
2013
Source: CDC’s Division of Diabetes Translation. National Diabetes Surveillance System, 2014
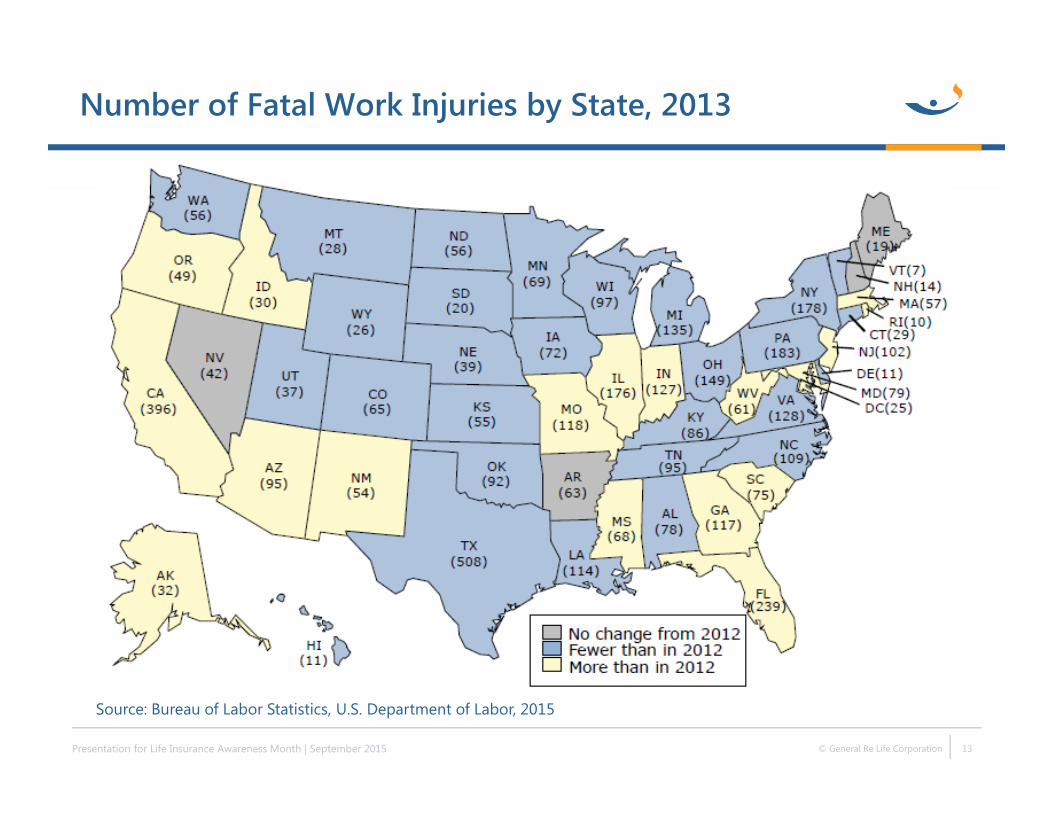
Number of Fatal Work Injuries by State, 2013
Presentation for Life Insurance Awareness Month | September 2015 © General Re Life Corporation 13
Source: Bureau of Labor Statistics, U.S. Department of Labor, 2015
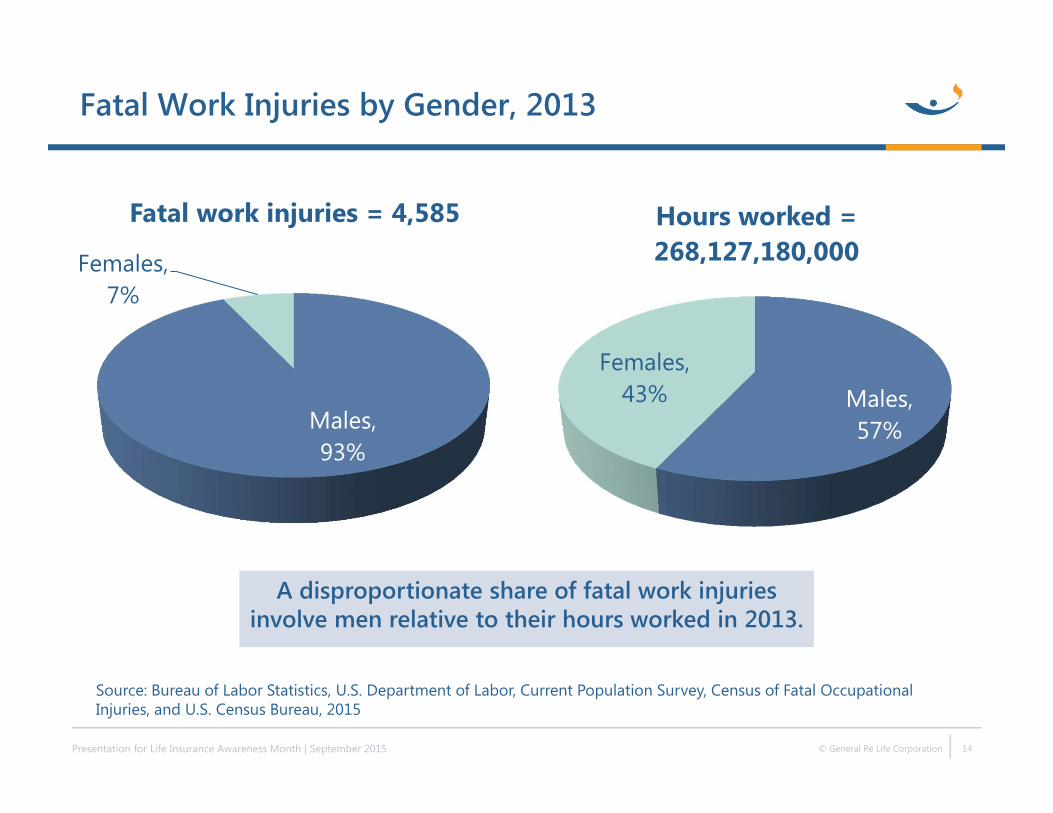
Fatal Work Injuries by Gender, 2013
Presentation for Life Insurance Awareness Month | September 2015 © General Re Life Corporation 14
Source: Bureau of Labor Statistics, U.S. Department of Labor, Current Population Survey, Census of Fatal Occupational Injuries, and U.S. Census Bureau, 2015
Males, 93%
Females, 7%
Fatal work injuries = 4,585
Males, 57%
Females, 43%
Hours worked = 268,127,180,000
A disproportionate share of fatal work injuries involve men relative to their hours worked in 2013.
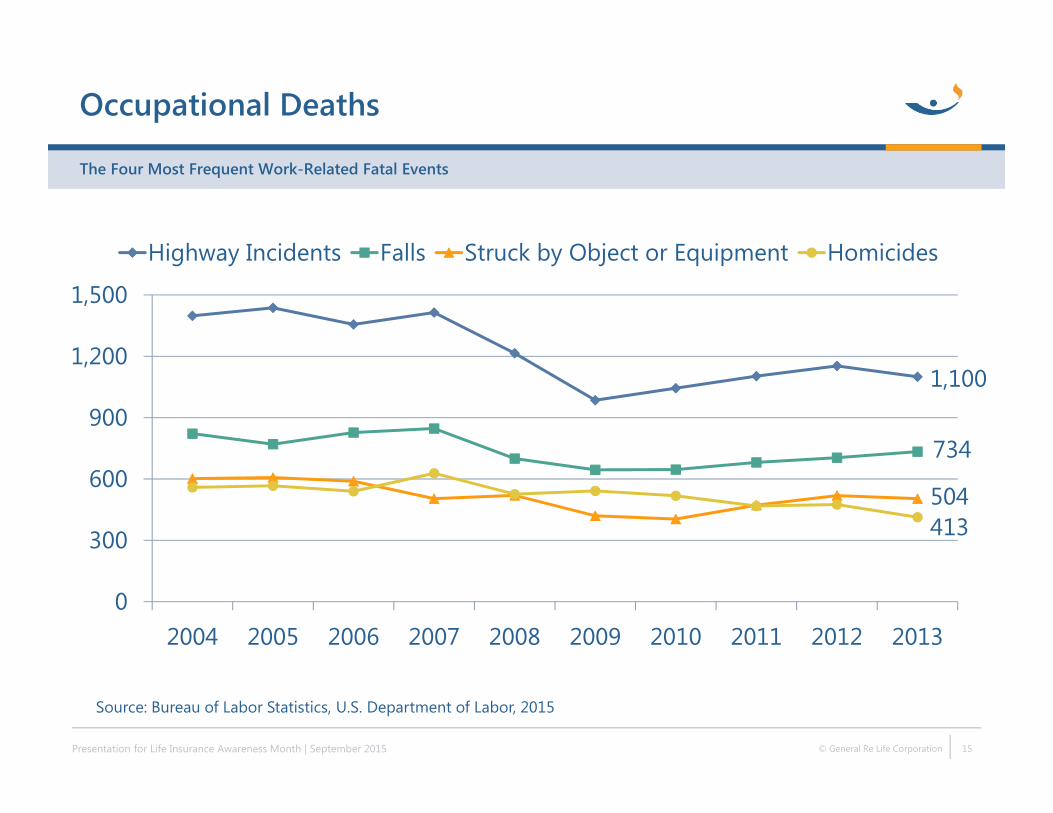
Occupational Deaths
The Four Most Frequent Work-Related Fatal Events
Presentation for Life Insurance Awareness Month | September 2015 © General Re Life Corporation 15
1,100
734
504413
0
300
600
900
1,200
1,500
2004 2005 2006 2007 2008 2009 2010 2011 2012 2013
Highway Incidents Falls Struck by Object or Equipment Homicides
Source: Bureau of Labor Statistics, U.S. Department of Labor, 2015
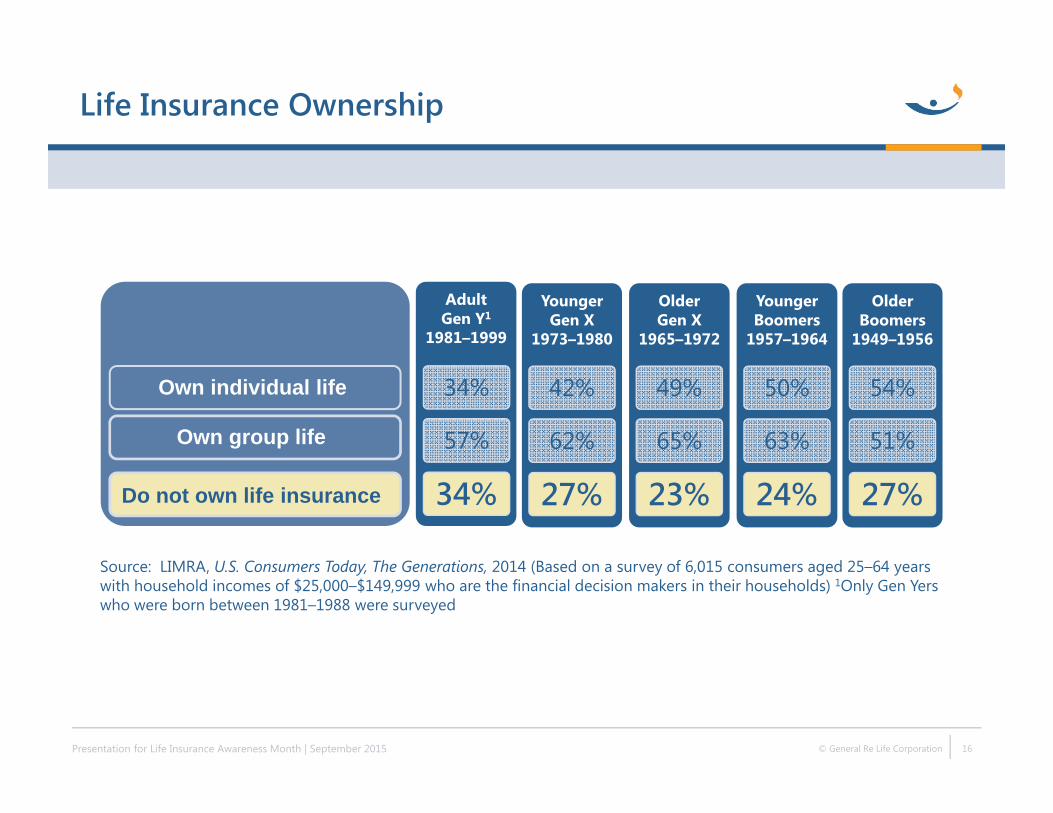
Life Insurance Ownership
Presentation for Life Insurance Awareness Month | September 2015 © General Re Life Corporation 16
Adult Gen Y1
1981–1999
34%
57%
34%
Younger Gen X
1973–1980
42%
62%
27%
Older Gen X
1965–1972
49%
65%
23%
Younger Boomers
1957–1964
50%
63%
24%
Older Boomers
1949–1956
54%
51%
27%
Own individual life
Own group life
Do not own life insurance
Source: LIMRA, U.S. Consumers Today, The Generations, 2014 (Based on a survey of 6,015 consumers aged 25–64 years with household incomes of $25,000–$149,999 who are the financial decision makers in their households) 1Only Gen Yers who were born between 1981–1988 were surveyed
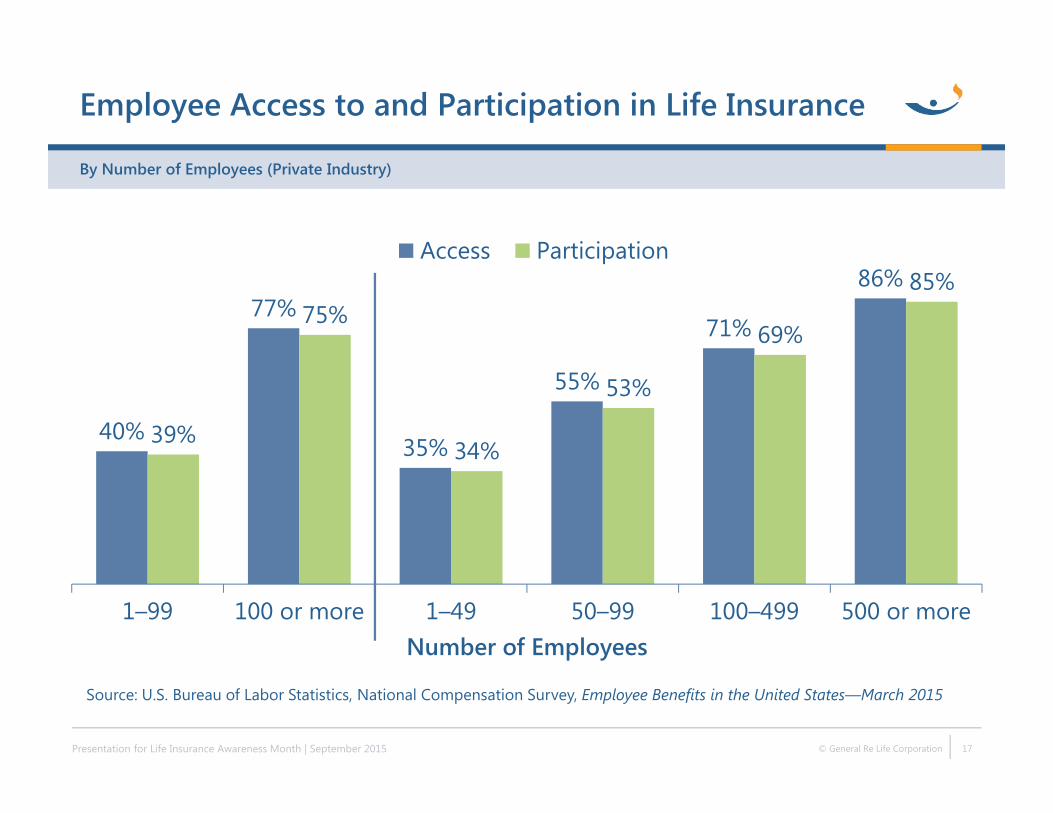
40%
77%
35%
55%
71%
86%
39%
75%
34%
53%
69%
85%
1–99 100 or more 1–49 50–99 100–499 500 or moreNumber of Employees
Access Participation
Employee Access to and Participation in Life Insurance
Presentation for Life Insurance Awareness Month | September 2015 © General Re Life Corporation 17
By Number of Employees (Private Industry)
Source: U.S. Bureau of Labor Statistics, National Compensation Survey, Employee Benefits in the United States—March 2015
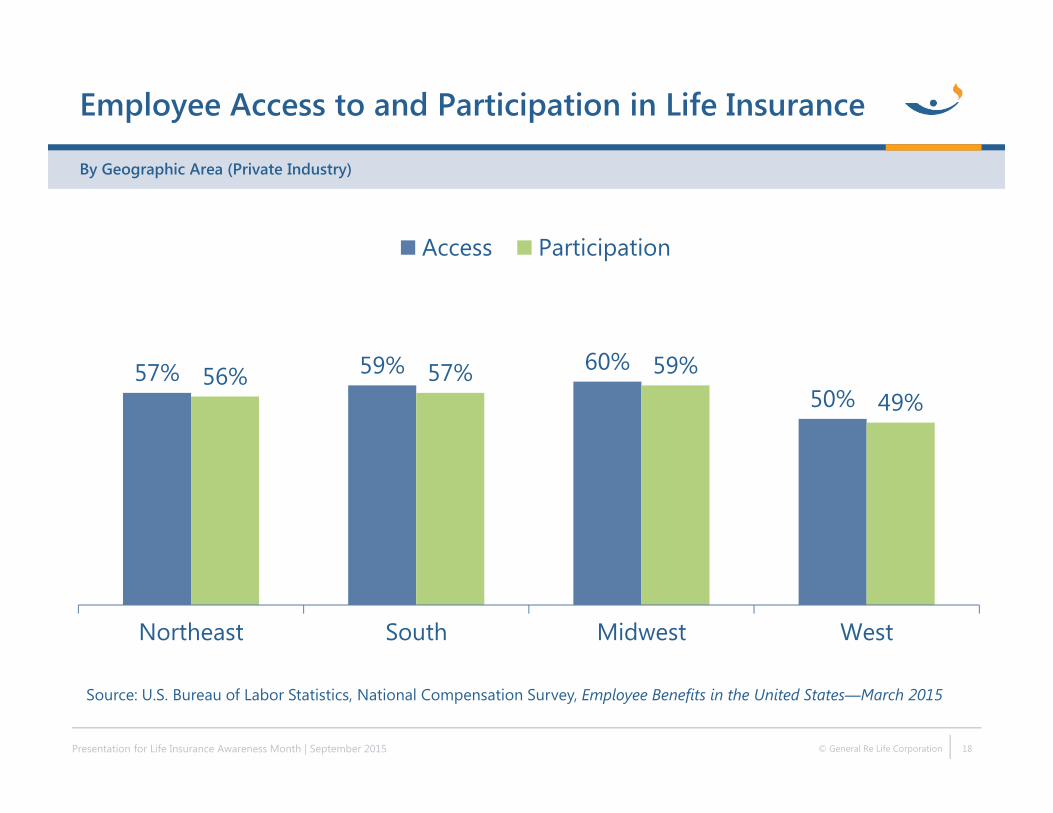
57% 59% 60%50%
56% 57% 59%49%
Northeast South Midwest West
Access Participation
Employee Access to and Participation in Life Insurance
Presentation for Life Insurance Awareness Month | September 2015 © General Re Life Corporation 18
By Geographic Area (Private Industry)
Source: U.S. Bureau of Labor Statistics, National Compensation Survey, Employee Benefits in the United States—March 2015
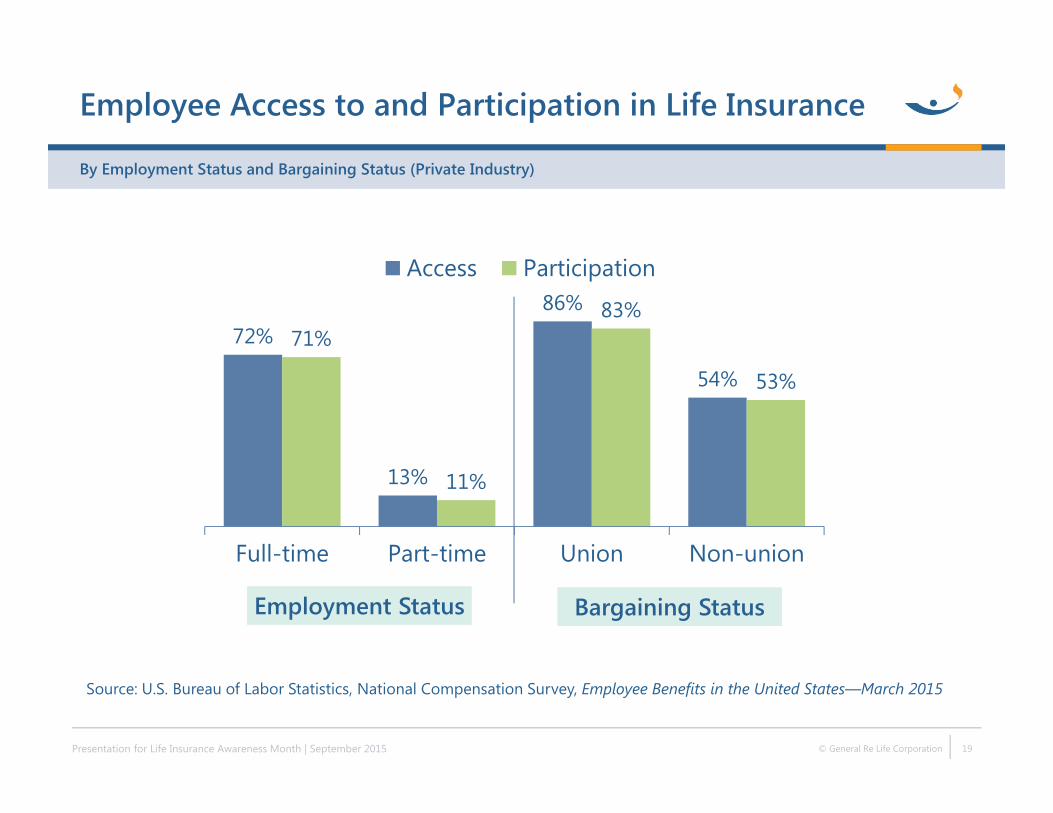
72%
13%
86%
54%
71%
11%
83%
53%
Full-time Part-time Union Non-union
Access Participation
Employee Access to and Participation in Life Insurance
Presentation for Life Insurance Awareness Month | September 2015 © General Re Life Corporation 19
By Employment Status and Bargaining Status (Private Industry)
Source: U.S. Bureau of Labor Statistics, National Compensation Survey, Employee Benefits in the United States—March 2015
Employment Status Bargaining Status
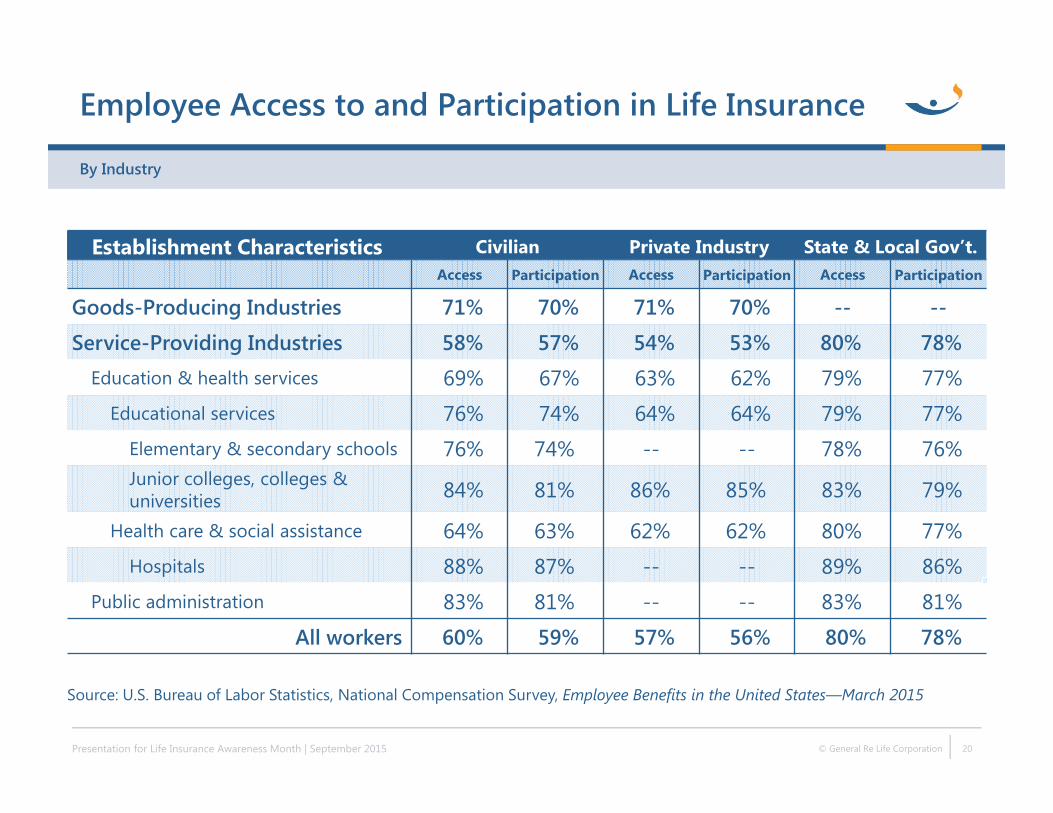
Establishment Characteristics Civilian Private Industry State & Local Gov’t.Access Participation Access Participation Access Participation
Goods-Producing Industries 71% 70% 71% 70% -- --
Service-Providing Industries 58% 57% 54% 53% 80% 78%Education & health services 69% 67% 63% 62% 79% 77%
Educational services 76% 74% 64% 64% 79% 77%Elementary & secondary schools 76% 74% -- -- 78% 76%Junior colleges, colleges & universities 84% 81% 86% 85% 83% 79%
Health care & social assistance 64% 63% 62% 62% 80% 77%Hospitals 88% 87% -- -- 89% 86%
Public administration 83% 81% -- -- 83% 81%
All workers 60% 59% 57% 56% 80% 78%
Employee Access to and Participation in Life Insurance
By Industry
Presentation for Life Insurance Awareness Month | September 2015 © General Re Life Corporation 20
Source: U.S. Bureau of Labor Statistics, National Compensation Survey, Employee Benefits in the United States—March 2015
Proprietary Notice
The material contained in this presentation has been prepared solely for informational purposes by Gen Re. The material is based on sources believed to be reliable and/or from proprietary data developed by Gen Re, but we do not represent as to its accuracy or its completeness. The content of this presentation is intended to provide a general guide to the subject matter. Specialist advice should be sought about your specific circumstances.
Presentation for Life Insurance Awareness Month | September 2015 © General Re Life Corporation 21


![Cancer Insurance Facts & Stats 42 who filed had insurance ... · Facts & Stats Enrollment period: [DATE-DATE]. To learn more and enroll, visit [] or call [1 800 GET-MET 8] What you](https://static.fdocuments.us/doc/165x107/5fd54474df50d14c6862030d/cancer-insurance-facts-stats-42-who-filed-had-insurance-facts-stats.jpg)