Life cycle study on returnable glass bottles in the South ...
91
Life cycle study on returnable glass bottles in the South African beer and cider industry A Kellerman orcid.org 0000-0002-4077-062X Mini-dissertation submitted in partial fulfilment of the requirements for the degree Master of Business Administration at the North-West University Supervisor: Mr JA Jordaan Graduation: July 2019 Student number: 21311056
Transcript of Life cycle study on returnable glass bottles in the South ...
Life cycle study on returnable glass bottles in the South African beer and
cider industry
A Kellerman
orcid.org 0000-0002-4077-062X
Mini-dissertation submitted in partial fulfilment of the requirements for the degree Master of Business Administration
at the North-West University
Supervisor: Mr JA Jordaan
Graduation: July 2019
Student number: 21311056
i
PLAGIARISM DECLARATION
I declare that this dissertation is my own work. References are listed to reference inputs
from literature, acknowledging other parties’ work that has been conducted on the
relevant topics. It is being submitted as a mini-dissertation for the degree Master’s in
Business Administration at the North-West University’s Business School. The research
has not been submitted at any other university for any other qualification.
_______________________________________
Andre Kellerman
MBA Student
_______________________________________
Date
ii
ACKNOWLEDGEMENTS
This study would not have been possible without the support I have received from various
stakeholders. Personally and professionally I have been assisted and encouraged and
will forever remain thankful.
Firstly, to my wonderful wife - thank you for the continuous support over the past
two years. You have been my rock during these challenging times.
To Mr JA Jordaan for taking over as my study leader and providing the necessary
guidance.
To Eugene Keyser from Heineken who provided the research topic and continuous
assistance throughout the process. Your efforts are highly appreciated.
Lastly, I would like to extend my gratitude to all interviewees for going beyond
expectations in providing time and assistance. Thami, Quinton, Leonard, Eugene,
Neo, KB, Dirk, Alessandro, Nonhlanhla, Jo-Ann, Thabang I am thankful for your
contribution and conduct during our engagements.
iii
ABSTRACT
South Africa is ranked as one of the higher beer and cider consumption per capita
countries in the world. The internal demand coupled with the growth of emerging markets
makes South Africa an attractive investment for international and local brewing
companies. In recent years, Heineken N.V, Distell Ltd. and SAB InBev have deployed
substantial investments into new plant and equipment to increase their footprint within the
country.
The market is made up of premium and mass-market products. The sales of mass-market
products far outweigh premium products and is thus a strong focal point for alcoholic
beverage producers. Mass-market products utilize returnable packaging materials to
transport the goods sold. These returnable bottles, kegs, pallets and crates remain assets
of the producers and return is incentivized by a deposit system. To maximize profits,
producers aim to increase the lifecycle of these returnable packaging materials.
The lifecycle of the returnable packaging is dependent on several factors found in the
producer's micro-, external- and macro environments. This is further governed by
legislation and guided by international best practices and standards, which directly and
indirectly impact the lifecycle of the returnable packaging materials.
This mini-dissertation will focus on investigating factors associated with the lifecycle of
returnable glass bottles used by producers for packaging their finished goods. A research
methodology will outline the approach followed in obtaining information which will be used
as arguments to support the primary research objectives.
A review of current literature will be conducted to determine national and international
approaches towards the operational aspects of returnable bottle’s lifecycle. The literature
review will form the basis of the discussion points during qualitative data collection with
experts operating in the South African returnable bottle market.
The study will be concluded through analyzing and comparing findings with existing
literature elements. Recommendations for will be provided to highlight areas identified for
further research. Additionally, recommendations are provided to the industry for
consideration in an attempt to increase returnable bottle lifecycles.
Keywords: Returnable Packaging Material, Returnable Bottles, Beer, Cider, Glass
iv
TABLE OF CONTENTS
PLAGIARISM DECLARATION ....................................................................................... i
ACKNOWLEDGEMENTS .............................................................................................. ii
ABSTRACT ................................................................................................................... iii
LIST OF FIGURES ....................................................................................................... vii
LIST OF TABLES ....................................................................................................... viii
ABBREVIATIONS ......................................................................................................... ix
NOMENCLATURE ........................................................................................................ xi
CHAPTER 1 – NATURE AND SCOPE OF THE STUDY ............................................... 1
1.1 Introduction ................................................................................................ 1
1.2 Problem statement .................................................................................... 3
1.2.1 Supply of returnable bottles ....................................................................... 4
1.2.2 High circulation times ................................................................................ 4
1.2.3 High inventory requirements ...................................................................... 5
1.2.4 Market and site losses ............................................................................... 5
1.3 Core research question ............................................................................. 6
1.4 Objectives of the study .............................................................................. 6
1.4.1 Primary objective ....................................................................................... 6
1.4.2 Secondary objectives ................................................................................ 8
1.5 Research methodology .............................................................................. 8
1.5.1 Research process...................................................................................... 9
1.5.2 Empirical study ........................................................................................ 11
1.5.3 Sampling ................................................................................................. 13
1.5.4 Data collection ......................................................................................... 15
1.5.5 Data analysis ........................................................................................... 16
1.5.6 Quality and rigour of the research design ................................................ 17
1.5.7 Research ethics ....................................................................................... 18
1.6 Limitation and scope of the study ............................................................ 20
1.7 Assumptions ............................................................................................ 20
1.8 Layout of the study .................................................................................. 21
1.9 Conclusion ............................................................................................... 21
1.10 Chapter summary .................................................................................... 22
v
CHAPTER 2 – LITERATURE REVIEW ....................................................................... 23
2.1 Introduction .............................................................................................. 23
2.2 Returnable strategies .............................................................................. 25
2.2.1 Deposit system strategy .......................................................................... 28
2.3 The returnable bottle life cycle overview .................................................. 29
2.3.1 Micro-environment ................................................................................... 30
2.3.2 External environment ............................................................................... 34
2.3.3 Macro-environment .................................................................................. 38
2.4 Returnable bottle externalities ................................................................. 40
2.4.1 Pollution ................................................................................................... 41
2.4.2 Job creation ............................................................................................. 41
2.4.3 Alcohol abuse .......................................................................................... 41
2.5 Alternative bottling methods .................................................................... 42
2.6 Conclusion ............................................................................................... 43
2.7 Chapter summary .................................................................................... 44
CHAPTER 3 – RESULTS AND DISCUSSIONS .......................................................... 45
3.1 Introduction .............................................................................................. 45
3.2 Demographic information of the study population ................................... 46
3.3 Study findings .......................................................................................... 47
3.3.1 Supplier segment findings ....................................................................... 47
3.3.2 Producer segment findings ...................................................................... 50
3.3.3 Customer segment findings ..................................................................... 54
3.3.4 Finding summary ..................................................................................... 57
3.4 Conclusion ............................................................................................... 61
3.5 Chapter summary .................................................................................... 61
CHAPTER 4 – CONCLUSIONS AND RECOMMENDATIONS .................................... 62
4.1 Introduction .............................................................................................. 62
4.2 Industry recommendations ...................................................................... 62
4.2.1 Improved communication ........................................................................ 62
4.2.2 Ensuring regular pick-ups ........................................................................ 63
4.2.3 Automated sorting ................................................................................... 63
4.2.4 Unique bottle identification ...................................................................... 63
4.3 Achievement of the objectives of the study ............................................. 63
4.4 Recommendations for future research .................................................... 64

vi
4.5 Conclusion ............................................................................................... 64
4.6 Research summary ................................................................................. 66
ANNEXURE A – BIBLIOGRAPHY .............................................................................. 67
ANNEXURE B – QUESTIONNAIRE ............................................................................ 76
ANNEXURE C – INFORMED CONSET FORMS ......................................................... 79
vii
LIST OF FIGURES
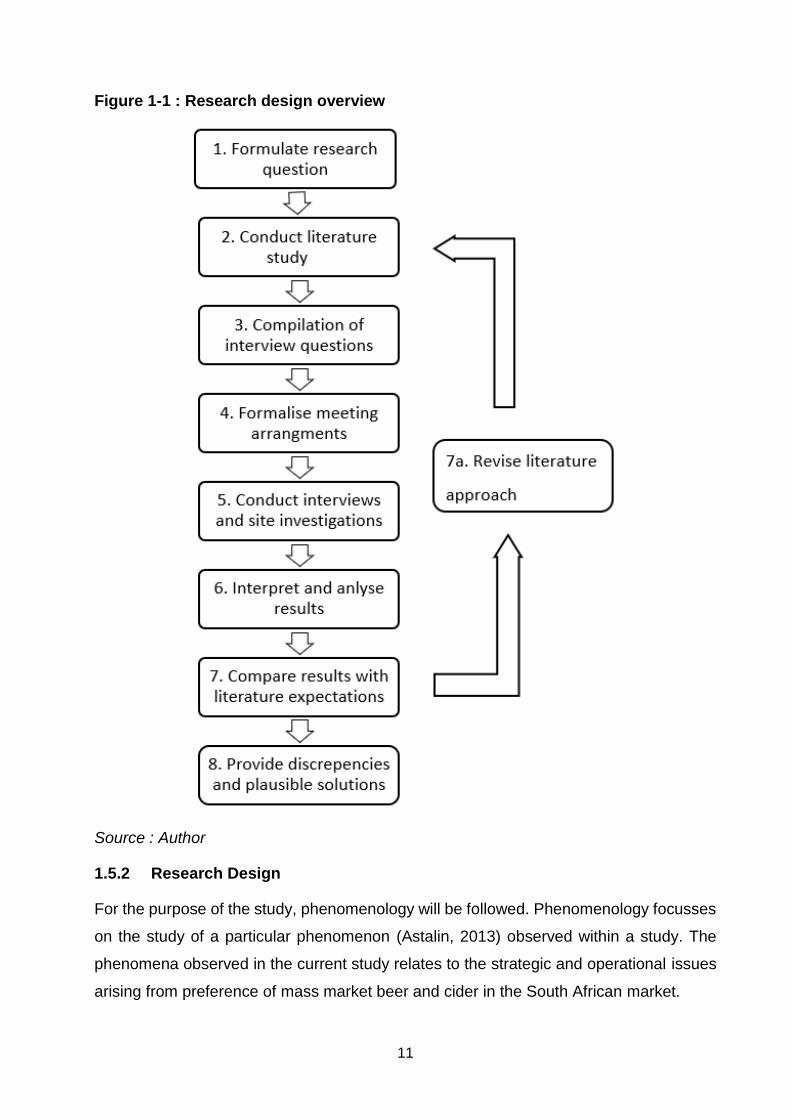
Figure 1-1 : Research design overview ........................................................................ 11
Figure 2-1 : Bottling strategy decision classification ..................................................... 25
Figure 2-2 : Generic returnable strategies .................................................................... 27
Figure 2-3 : Overview of the returnable bottle lifecycle ................................................. 29
Figure 2-4 : Geographic locations of producers ............................................................ 30
Figure 2-5 : Geographic locations of suppliers ............................................................. 34
Figure 2-6 : Market description ..................................................................................... 35
Figure 2-7 : Population density of South Africa............................................................. 36
Figure 2-8 : Typical RB circulation time graph .............................................................. 37
Figure 2-9 : Control over RB's ...................................................................................... 43
Figure 3-1 : Suppliers internal RB manufacturing process ........................................... 48
Figure 3-2 : producer internal RB processes ................................................................ 52
Figure 3-3 : Tier 1 customer internal RB process ......................................................... 56

viii
LIST OF TABLES
Table 1-1 : Population sample size ............................................................................... 14
Table 2-1 : Returnable products by producers .............................................................. 31
Table 3-1 : Summary of qualitative participants ............................................................ 46
Table 3-2 : Summary of primary and secondary objective findings .............................. 58
ix
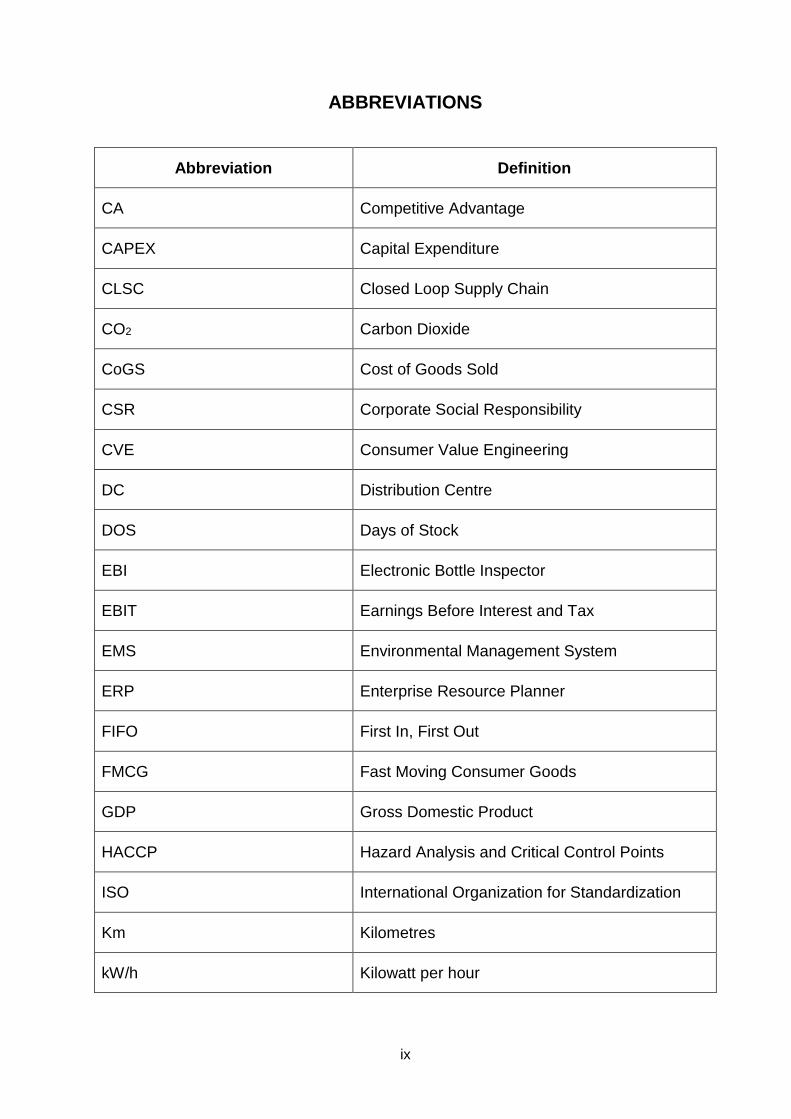
ABBREVIATIONS
Abbreviation Definition
CA Competitive Advantage
CAPEX Capital Expenditure
CLSC Closed Loop Supply Chain
CO2 Carbon Dioxide
CoGS Cost of Goods Sold
CSR Corporate Social Responsibility
CVE Consumer Value Engineering
DC Distribution Centre
DOS Days of Stock
EBI Electronic Bottle Inspector
EBIT Earnings Before Interest and Tax
EMS Environmental Management System
ERP Enterprise Resource Planner
FIFO First In, First Out
FMCG Fast Moving Consumer Goods
GDP Gross Domestic Product
HACCP Hazard Analysis and Critical Control Points
ISO International Organization for Standardization
Km Kilometres
kW/h Kilowatt per hour
x
LSP Logistics Service Provider
Ltd. Limited Liability
MBA Master of Business Administration
MBFU Missing, Broken, Foreign and Unwashable
ml Millilitres
MRP Materials Resource Planner
N.V. Naamloze Vennootschap
NDD Nominated Delivery Date
NRB Non-return Bottle
NWU North West University
OPEX Operating Expenditure (Cost)
PET Polyethylene Terephthalate
Pty Proprietary Company
R South African Rand
RB Returnable Bottles
RC Returnable Crates
RK Returnable Kegs
RONA Return on Net Assets
RPM Returnable Packaging Material
SAB InBev South African Breweries Anheuser-Busch
SAP Systems, Applications and Products
USD United States Dollars
UV Ultra Violet
xi
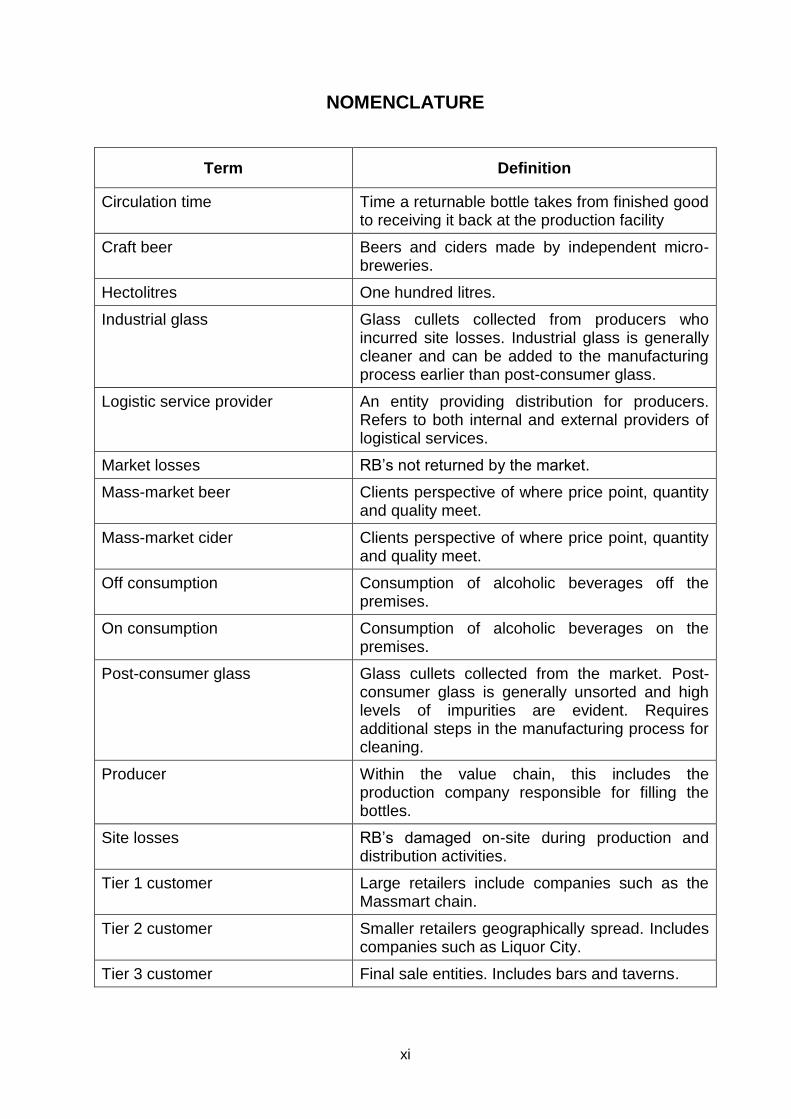
NOMENCLATURE
Term Definition
Circulation time Time a returnable bottle takes from finished good to receiving it back at the production facility
Craft beer Beers and ciders made by independent micro-breweries.
Hectolitres One hundred litres.
Industrial glass Glass cullets collected from producers who incurred site losses. Industrial glass is generally cleaner and can be added to the manufacturing process earlier than post-consumer glass.
Logistic service provider An entity providing distribution for producers. Refers to both internal and external providers of logistical services.
Market losses RB’s not returned by the market.
Mass-market beer Clients perspective of where price point, quantity and quality meet.
Mass-market cider Clients perspective of where price point, quantity and quality meet.
Off consumption Consumption of alcoholic beverages off the premises.
On consumption Consumption of alcoholic beverages on the premises.
Post-consumer glass Glass cullets collected from the market. Post-consumer glass is generally unsorted and high levels of impurities are evident. Requires additional steps in the manufacturing process for cleaning.
Producer Within the value chain, this includes the production company responsible for filling the bottles.
Site losses RB’s damaged on-site during production and distribution activities.
Tier 1 customer Large retailers include companies such as the Massmart chain.
Tier 2 customer Smaller retailers geographically spread. Includes companies such as Liquor City.
Tier 3 customer Final sale entities. Includes bars and taverns.
1
CHAPTER 1 – NATURE AND SCOPE OF THE STUDY
1.1 Introduction
The beer and cider industry in South Africa has seen tremendous growth over the past
years, despite economic headwinds. A growth rate of 4.9% has been recorded, almost
double the Gross Domestic Product (GDP) growth for the period 2011 to 2015 (Trading
Economics, 2018). In 2015, the South African beer and cider market reached a production
volume of 33 900 000 hectolitres and is projected to reach 38 850 000 by 2020
(Marketline, 2016). The industry has developed to a major player in the economy, with
upstream and downstream activities creating employment opportunities and additional
government tax revenue (Fieldgate et al., 2013).
Beer is the alcoholic beverage of choice, totalling 54.6% of the all liquor sold in South
Africa (Holtzkampf, 2015). In 2015, South Africans spent more than R100bn purchasing
beer and consumed around 60l per capita per annum (Kew, 2016). The strong growth
rate and appealing future projections thereof has led to global interest and large-scale
capital investments into new breweries.
Although South African’s have recently adopted a strong “craft beer” culture, the market
is still dominated by the brewing giants SAB InBev, Heineken South Africa Pty. Ltd. and
Distell Group Ltd. These companies control market shares of 80.4%, 13% and 5%,
respectively (Marketline, 2016). The degree of rivalry in the South African alcoholic
beverage sector is high due to the relatively consolidated market and requires agility in
marketing, value offering and variety. In response, these companies target a wide range
of market segments by offering products ranging from premium beers and ciders to more
affordable, value-driven products, termed “mass-market products”. Mass-market beers
and ciders make up a substantial amount of the sales of the three market leaders,
contributing around 60% to their total sales revenue.
The mass-market beverages are offered at a lower price per millilitre without
compromising quality and thus appeals to the mass-market. Although premium beers are
seen to be coupled with personal identities (Eaves, 2014) and are considered more
luxurious (Whyle, 2016), mass-market beers and ciders are strongly competitive on
pricing. Thus, producers seek various ways of reducing mass-market beer and cider
prices.
2
Returnable Packaging Material (RPM) enables producers to cost-effectively package and
transport both premium and mass-market products. RPM consists of Returnable Bottles
(RB’s), Returnable Kegs (RK’s) and Returnable Crates (RC’s). These three RPM’s follow
different processes, and for this study, the focus was solely be based on RB.
These glass bottles can theoretically be re-used around 30 times (Whyle, 2016) based
on their condition when returned. However, the amount of re-use is variable and is based
on the producers’ quality standards required and the sensitivity of their Electronic Bottle
Inspector (EBI) to discard broken or foreign materials.
In addition to reducing externalities through minimizing waste, the use of RB significantly
lowers the Cost of Goods Sold (CoGS). The reduction is CoGS enables the producer to
offer the beverages at a lower price (Shaw, 2018). The reduction in sales price lowers the
risk of the producer losing market share due to substitute products and is vital to
producers to maintain their competitive advantage (Huebsch, 2018).
In contrast to Non-Return Bottles (NRB’s), RB’s require substantial infrastructure
investment and complex reverse logistics procedures to be in place. In addition to the
standard NRB logistics process flow, the RB is required to travel from Tier 3 to Tier 1
customers, sorted, inspected, washed and re-labelled before re-use. With the exception
of SAB InBev, the transportation of the RB’s poses a risk of possible breakage as the
majority of the logistics services is contracted out to third-party providers. Thus, quality
can only be controlled contractually and not through internal quality control processes.
The return of the RB’s is incentivized by a refundable deposit included in the sale price
when the beer is purchased and the RB can be used as a deposit against the next
purchase from most Tier 1 and Tier 2 customers. The deposit obtained by the customer
for returning the RB’s is between R1 to R3, and between R8 and R11 for the packaging
crate. However, the number of bottles returned to Tier 1 customers vary and the time
frame is unpredictable, due to several factors.
This variability on the returns of the RB’s leads to operational issues arising on the
producer’s side, as a sufficient supply of packaging is required to the meet continuous
market demand. Generally, high levels of Days of Stock (DOS) are required to create a
safety buffer of supply, which incurs additional cost to the producer. The variability of RB
returned further induces issues relating to Material Resource Planning (MRP), as
production scheduling relies heavily on accurate packaging stock level information.

3
The purpose of this study is to gain insight and critically assess the factors influencing the
lifecycle of RB’s in the mass beer and cider market. This included factors both internal
and external to producers. These factors were analyzed in accordance with RPM
strategies and policies relating to RB’s of the largest players in the South African liquor
producing sector. The assessment was compared to best practices around the world,
given the specific South African macro environment and might not be applicable to all
producers in general.
The envisaged benefit of conducting this study was to improve strategic elements and
operational decisions around improving the lifecycle of RB’s. Areas of improvement were
identified and analyzed in the study. This would lead to increased profits by producers,
less glass filling up landfills and less CO2 emissions from the production of these bottles.
An investigation was done into the operation of bottle merchants, and how policy on
operational transparency around RB’s could benefit their business model.
1.2 Problem statement
In a fast-growing and highly competitive market, South African beer and cider producers
need to focus on several fronts to remain the brand of choice. Due to the rising prices of
energy and raw packaging materials producers are working towards minimizing input and
distribution costs. Lower CoGS enables producers to obtain increased market share, due
to their ability to offer products at a more affordable price. Furthermore, by lowering
CoGS, an increase Return on Net Assets (RONA) enables producers to expand their
production capabilities by attracting investments for Capital Expenditure (CAPEX)
projects.
To lower the CoGS, it requires effective management throughout the production, storage
and logistical elements of the supply chain. High levels of accuracy in planning, low-price
sourcing, lean production and effective distribution are required to realize effectiveness
(Lewis, 2013). The potential for savings in the FMCG industry is relatively low in
comparison to large-scale manufactured goods (Oliver Wyman, 2014) and is thus of
utmost importance for producers to continue to eliminate any wasteful expenditure.
The variability of RB’s collected for re-use places a burden on all of these crucial
segments, as mass-market beers make up a substantial volume of total sales. The initial
disturbance introduced by incorrect RB quantities is propagated through the mass-market
supply chain and results in loss of revenue and loss of market share. This can be
4
contributed to the general lack of RB transparency, as inaccurate information affects the
producers’ ability to make efficient, proactive decisions (Kettering University, 2015).
Supply of returnable RB’s, high circulation times, high DOS and losses mainly contribute
to the problems experienced in the RB supply chain. These areas of concern impact all
aspects of planning, supply and logistics in the RB industry is listed and described in more
detail in the sections below:
1.2.1 Supply of returnable bottles
RB’s in the South African beer cider mass-market are mainly manufactured by Nampak
Ltd. and Consol Glass Pty. Ltd. These manufacturers have limited production capacities
in terms of the number of required units and bottle colour. Sourcing of RB’s thus requires
scheduling to be in line with both the producers’ requirements and suppliers’ capabilities.
When a short supply of bottles manifests, producers have difficulty in meeting their
demand and incur revenue loss as they forego sales. Further, short supply induces the
risk of losing market share through substitute products. With mass-market beer and cider,
switching costs are low and further emphasizes the requirement of maintaining sufficient
stock levels.
When short supplied, the supplier can be pushed to deliver RB’s in a shorter timeframe,
increases the risk of breakages or substandard quality. The lack of RB’s creates a
shortage of circulation in the market and can directly affect the return patterns and
logistics as some customers might have internal business processes only allowing the
release of RB’s once a specific quantity is met.
When an oversupply is of RB’s is present, the producer has purchased packaging
materials which are not used and thus incurs over-capitalisation of bottles due to
excessive RB purchases. Simultaneously, the producer is required to store the unused
RB’s in the production plant. If the storage area is not protected from sunlight and rain
ingress, the RB’s requires to be washed before re-use and increases Operating
Expenditure (OPEX).
1.2.2 High circulation times
Planning and forecasting can be affected by high circulation times of the RB’s in the
market. RB’s remains assets of the producers and is re-used until the RB quality is not
up to standard or if it reaches end of life. Depending on the producer, RB’s have an
5
amortization period of 4-7 years, and producers have the highest RONA if the RB can be
used to its maximum theoretical limit before or before the quality starts to degrade.
High circulation time places a risk on the maximum utilization per bottle. When circulation
times goes from high to extreme, it creates the possibility that the bottle will reach end of
life before maximum RONA. This results in additional expenditure required to replace
RB’s and negatively impacts producers’ revenue.
If the RB is retained in the market longer than anticipated, it creates operational issues
due to the incorrect RB pool size available for bottling. Pool sizes are determined based
on projected market demand and inflow of RB’s from previous purchases. The inaccurate
estimation of pool sizes leads to higher required DOS and the effects thereof is discussed
in paragraph 1.2.3.
1.2.3 High inventory requirements
If RB’s are returned sporadically, producers are forced to maintain high levels of
completed products and empty RB’s at hand. The inventory held is described in terms of
as DOS, a buffer which producers create to mitigate the risk of running out of stock.
Generally, mass-market beer and cider are stockpiled and the First In, First Out (FIFO)
principle is used, as pallets of finished beer and cider are stockpiled to ensure that
warehouse maturing is mitigated. Different batches cannot be stacked in the same bin to
minimize floor space requirements, and thus leads to excessive floor space usage.
Returned RB’s are inspected once returned to determine batch numbers. This feeds into
the calculation to determine circulation time. The issue is that a sample of one bottle is
inspected per crate upon return. Limited sampling leads to the inaccuracy of data
collected and can skew the circulation time calculations and force producers to maintain
higher DOS levels.
1.2.4 Market and site losses
Market and site losses occur when RB’s are damaged during handling. This mainly occurs
when the RB’s are transported from the warehouse floor to the distribution trucks or when
these trucks are unloaded at the customers.
As indicated previously, the RB’s are company assets with a theoretical re-use limit.
Damage to the RB’s result in them being discarded instantly and removes any future
potential of RONA. Although crates are designed to protect RB’s from any form of
6
damage, they are limited to only when the RB’s are transported and not when they are
removed. New RB’s are then ordered to replenish the RB pool size in accordance with
planning and scheduling requirements.
Another key factor in market losses is the South African “throw away” culture (World
Wildlife Foundation, 2017). Although the return of these RB’s is incentivized, they are
often simply thrown away as the effort of returning them is perceived to be too high. The
need for market education is necessary as mass participation and strategy adoption is
crucial to collecting RB’s, increasing RONA and minimizing externalities due to the
production of these bottles.
1.3 Core research question
Based on the problems in the mass-market beer and cider industry defined in paragraph
1.1, the core research question and purpose of this study can, therefore, be termed as
the following:
What changes can be made both internally and externally to maximize Return on
Net Assets (RONA) of Returnable Bottles (RB’s)?
The core research question will be the ultimate measure of how accurately the primary
objectives in the following section can be identified and addressed in the South African
environment,
1.4 Objectives of the study
1.4.1 Primary objective
The primary objective of this study is to investigate to which extent related factors
influence the lifecycle of RB’s. In a paper presented by Venkatesh (2015), the factors
below were highlighted as areas of concern in operations at an Indian brewery. These
primary objectives were utilized as a guideline for the research conducted within the
specific South African environment. These objectives will be compartmentalised into
three separate focus areas namely micro-, external- and macro environments.
1.4.1.1 Micro-environment
Returnable strategy
o Focus on what the strategic decisions are relating to the supply, bottling and
distribution of RB’s
Limited forecasting
7
o How the influence of market share growth and market invariability affect
lifecycle of the returnable bottles.
Lack of information flow
o Relates to the methods of how accurately returns are captured
Transportation capacity utilization
o Includes the optimal utilization of truck capacity
Unskilled labour
o How the effect of unskilled labour influecnces decisions around the handling
of RB’s
Responsiveness
o Evaluation of how responsive producers are to variations in demand and
the ability of suppliers to provide RB’s
Variation of packs
o How the variation of pack types affects upstream components such as
transportation capacity utilization and producer specific requirements
1.4.1.2 External-environment
Customer behaviour (charge of deposit)
o How the incentivised returns affect the culture around the returning of empty
RB’s
Consumer behaviour
o How the incentivised returns affect the culture around the returning of
empty RB’s
Bottle merchant roles
o The effect of how much value addition bottle merchants can make to
increasing the lifecycle of RB’s
1.4.1.3 Macro-environment
Standards and legislation
o Focus on how forces shape the liquor and transportation industries in
general, such as liquor laws and carbon tax.
1.4.1.4 Externalities
Additionally, externalities of RB’s were investigated to determine the secondary effects of
utilizing RB’s. These included the following:
8
Although the purpose of the research is to assess strategic, operational and
financial issues around the RB beer and cider mass-market, it cannot be ignored
that recycling has an impact on the environment (Slater, 2017).
These externality factors include the other two elements of the triple bottom line,
namely people and planet (Hammer & Pivo, 2016). Secondary objectives will
include pollution in the manufacturing process (Mavuso, 2015) and assessing the
impact returnable has on communities, such as job creation (Whyle, 2016) and
alcohol abuse.
1.4.2 Secondary objectives
Secondary objectives as presented below Secondary objectives relating to the study
includes the following:
To use a literature study to define potential factors that could affect the lifecycle of
RB’s.
To interview industry experts operating in the RB industry and obtain a practical
view on current.
To determine which of these potential factors are most prevalent in the South
African RB value chain.
To propose measures to the industry to address the key contributing factors
affecting the lifecycle of the RB’s.
1.5 Research methodology
The research followed the procedure as indicated in Figure 1-1. The method has been
chosen as it allows a comprehensive understanding of the elements influencing the
primary research question to be in place first prior to conducting qualitative interviews.
Through an understanding of best practices implemented globally and our specific socio-
economic milieu, deductive interviews (Gilgun, 2013) can be constructed in such a way
to obtain the most feasible results. This will form the basis of the input into constructing
the interviews.
Based on the exclusivity of the field of study, convenience sampling methods within the
RB industry was used. This will form the basis of interview selections to evaluate the
cultural and operational impacts on the lifecycle of a RB in the beer and cider market.
9
Participants were sourced from the pool made available through interaction management
from the various producers. A select amount of Tier 1 customers were interviewed to
determine a more holistic view of the interaction between producers and the market.
Data obtained from the iterative interview process was analyzed and compared with
examples from the literature study. Based on the outcome of the results, this allowed the
formation of concepts negatively impacting the lifecycle of RB’s through a gap analysis of
the mass-market of beer and cider in South Africa.
1.5.1 Research process
The research follows a qualitative approach, where the primary data collection method is
interviews with representatives of all the stages in the RB value chain. A literature survey
was conducted to determine and the captured perspectives on the South African mass-
market beet and cider industry.
Figure 1-1 represents the flow of the research design process. The process allows for
fine-tuning of the interview questions based on the results received. This is crucial as the
interviews have the possibility to lead to new discoveries which may be more critical in
answering the core research question than initially defined.
The research process is as follows:
1. Formulate research question
The formulation of the core research question is crucial and sets the requirements for the
research design process. The core research question is available in paragraph 1.3.
2. Conduct a literature survey
The literature survey was aimed towards the understanding of the process producing,
selling and transporting of RB’s globally. This will form the basis of preparing the
conceptual foundation and the hypothesis for the study (Kundu, 2017). Furthermore, it
focussed on the market and the recycle culture of South Africans and the effect it has on
the lifecycle of RB’s.
3. Compilation of interview questions
Based on the literature study conducted, semi-structured interview questions were set up
based on the understanding of the critical factors influencing the primary research
question.
10
4. Formalizing meeting arrangements
As with any interview process, it is of crucial importance to maintain professionalism and
etiquette (Brandman University, 2017). This includes respecting the time of the
participants by timeously setting up appointments and sticking to the schedule. Meeting
times were arranged at the choosing and convenience of the participant.
5. Conduct interviews and site investigations
During this step of the research process, contact was made with the various identified
participants and semi-structured interviews were conducted. Site visits at each of the
segments were requested in advance of meetings. During the visits, investigations were
done in order to maintain an understanding of the physical process flow in the various
sectors.
6. Interpret and analyze results
Interview results, including site investigation findings, was analyzed. A narrative - and
partially deductive - approach was used to capture the individual perspectives in light of
the existing understanding of RB’s. The analysis was conducted in accordance with the
primary research objectives.
7. Compare analysis with literature expectation
The comparison process was deductive of nature (Rucker, 2016). Based on the
understanding of existing literature around RB processes, the pre-existing theories and
hypothesis were tested.
During this stage the possibility to conduct further research in newly discovered topics
exists, which will feed into an amendment of the interview questions.
8. Table discrepancies and provide plausible solutions
This section of the research process included the write up of results and possible
solutions to maximizing the lifecycle of the RB’s. Results and recommendations were
provided for each of the individual segments participating in the study. A comparison of
factors identified internationally and within South Africa was provided.
Recommendations regarding areas identified for further research were identified. This
was based on the gap analysis and areas identified during this research which can further
contribute to increasing the lifecycle of RB’s within South Africa.
11
Figure 1-1 : Research design overview
Source : Author
1.5.2 Research Design
For the purpose of the study, phenomenology will be followed. Phenomenology focusses
on the study of a particular phenomenon (Astalin, 2013) observed within a study. The
phenomena observed in the current study relates to the strategic and operational issues
arising from preference of mass market beer and cider in the South African market.
12
The phenomena will be defined as far possible from current literature sources and will
provide awareness and insights on key areas of concern affecting the lifecycle of RB’s
within the country.
1.5.3 Empirical study
A qualitative approach was followed. The reason behind the selection of a qualitative
approach include the following:
The study is associated with human behaviour. The lifecycle of the RB’s is directly
proportionate on the perception and culture of the customers purchasing mass-
market beer and cider. Qualitative research enables capturing the various
viewpoints on the recycling culture.
The cultural concepts which were analyzed were emergent from interview data
regarding the return of the RB’s. Due to the size of the existing mass-market,
qualitative analysis has been rejected and qualitative analysis has been chosen to
concentrate on common contact points.
Flexibility within the investigation process is made available through the qualitative
method (Brymen et al., 2016:51). This is achieved through the selection of industry
experts within the RB field.
This empirical study the aim is to collect accurate data from several key people in
the value chain by means of interviews. Therefore, the social environment was
studied as a paradigm that consists of different opinions, views and expectations.
Amongst other areas, the study is associated with operations management at
producers’ bottling facilities. Decisions made by senior staff has a direct impact on
the processes followed enforcing quality and has a substantial impact on the
lifecycle of the RB’s. The qualitative method aims to capture the decision-making
factors and orientations of these staff.
Open-ended equations will form part of the interview to allow for the probability of
capturing elements which could have previously been missed.
The empirical study was based on the interview participants’ viewpoint. The
viewpoint, if compared to others, can provide significant insight into potential
misconceptions of members operating the RB value chain.
13
1.5.4 Sampling
For the purpose of this study, theoretical sampling was used. This will include sampling
until saturation of the key concern areas retrieved from the literature occurs. This will
allow saturation to occur on data rather than the statistical adequacy of the interview
samples (Brymen et al., 2016:185).
1.5.4.1 Participant considerations
Participant selection was based on accessibility and the participants’ knowledge of the
specific field of study. They were selected from individuals with from all stages in the RB
supply chain. The aim of the sampling method is to collect information as diversely as
possible from producers, suppliers and Tier 1 customers.
It is important to select participants based on their experience within the RB market. To
achieve this, a list of typic characteristics has been set up (Koenig, 2018). Typical
characteristics of the participants shall include:
Expertise in the RB beer and cider market
Understands internal policies of RB’s
Understands the internal procedures of the RB’s
Accessibility
Interest in the study
The selection of the participants was such that they can be accessed easily based on
their availability. Thus, participant selection is required to can accommodate personal
interviews based on the availability of the participant. Predominantly, most of the producer
and supplier headquarters are located within a 50 km range from Johannesburg. This
advantage was utilized to minimize the time and cost employed by the researcher due to
similar geographical location. In addition, most suppliers, producers and customers have
facilities within the proposed range and were sufficient in providing a holistic view of the
industry.
1.5.4.2 Population sample size
Practical considerations coupled with the sample size is the availability of time and
financial resources. As stated in paragraph 1.5.4.1, participants were selected to minimize
the impact of both.

14
However, another key consideration is to determine the adequate sample size to support
the reduction in resource deployment while still ensuring saturation. Thus, with the focus
mainly being on the producers’ perspective of the RB market, an envisaged total of 10
participants was identified to be interviewed.
Table 1-1 below provides the prospected minimum participants which were originally
included in the study to acquire the most holistic view of the RB beer and cider market.
Table 1-1 : Population sample size
Company Area of operation
Expertise Sample size
Consol Glass Supplier
Glass manufacturing 1
Nampak Ltd. Packaging solutions 1
Heineken
Producer
Beer and cider production 2
SAB InBev Beer and cider production, distribution
2
Distell Group Ltd. Cider production 2
Makro Customer
Tier 1 customer 1
UD Group Tier 2 customer 1
Total 10
1.5.4.3 Alternative unit of analysis
Alternative unit of analysis considered in this study is the following:
International producers and suppliers
Due to the uniqueness of the South African economic and political climate, qualitative
data from international producers and suppliers will not be considered within the study.
However, the qualitative results were reviewed against practices deployed to identify
possible shortcomings and improvement opportunities if feasibility within the South
African context exists.
End level customers
End level customers, mainly taverns, are not viable for answering the core research as
provided in paragraph 1.3. This is due to the vast distribution of these entities across the
country, and the general difficulty and security issues regarding access. Most of these
taverns are operating without proper business documentation, thus cannot be identified
15
easily from an outsiders’ perspective. The general lack of technology utilization also
poses a threat of hampering the collection of feasible qualitative data.
Bottle merchants
Bottle merchants’ qualitative data will not be feasible to the study. This is mainly attributed
to the fact that these entities are under development and have not yet formalized
agreements with the relative producers. Thus, the inclusion of this population will pose a
significant risk to the study as data might distort data received from knowledgeable
participants.
1.5.5 Data collection
1.5.5.1 Data collection procedure
Individual, semi-structured interviews were conducted at the main data collection
instrument. These interviews were scheduled based on if consent to conduct the research
has been given and the availability of the participants.
The data collected was voice recorded and transcribed with the participant's permission.
The transcribed data will be returned to the participant for approval, from where it will be
used to identify key shortcomings in the RB industry.
1.5.5.2 Criteria Requirements for Qualitative Interviews
The following criteria were adhered to when conducting interviews (Waters, 2017):
Interview structure
o Arrange an appropriate time and setting
o Introduction of the researcher
o Introduction to the topic and its applicability
o Description of the interview structure
o Discussion of data sensitivity and applicability
o Interview questions and general discussions
o Conclude
o Follow up for approving minutes of the meeting
Interview conduct
o Be on time
o Ensure the interview data collection is applicable to the core research
question
16
o Ensure that interview is as brief possible
o Remain unbiased
o Be attentive to non-verbal communication
o Remain attentive to interview question answers
o Remain enthusiastic
o Encourage participant response
1.5.6 Data analysis
The purpose of the data analysis is to interpret captured data and identify themes to
correlate responses with the core research question and the discovery of new patterns
(EvaSys, 2018). The data analysis exercise was concurrent throughout the research, as
new concepts and patterns might provide new insight into answering the core research
question. The following six steps was used during data analysis (Pell Institute, 2018):
Immediate recording of data
Immediate recording of data is necessary to maintain the highest level of accuracy.
Begin data analysis as soon as data is collected
By analyzing data as it is being collected, it creates the possibility to direct focus to
particular areas influencing the core research question.
Data reduction
Data reduction is the process of transforming raw data into a more meaningful state. This
step is not to be confused with the data analysis in the second step, as it refers to overall
data reduction.
Identification of patterns and themes
Identification of key patterns and themes is the core of the qualitative analysis. This
section was done by means of thematic analysis, which entails the grouping of the data
into specific themes. These themes were directly related to the areas identified during the
literature study which has a substantial effect on the core research question.
Data display
This step includes the physical display of the analyzed data in terms of tabular or textual
format.
Conclusion and verification
17
This step is subdivided into three steps, including:
o Taking a step back and evaluate what the findings show
o Determination of how the findings influence the answering of the core
research question
o Drawing up implications from the findings
1.5.7 Quality and rigour of the research design
The qualitative research method has the risk of being viewed as biased due to the
interpretation of data by the researcher. In order to ensure an objective approach, the
following factors were considered during the research (CIRT, 2018):
Reliability
Reliability refers to the extent which the findings can be consistently duplicated (Devault,
2018). Thus, in order to achieve reliability, all research findings were thoroughly
documented. This included documentation of interview questions and responses,
literature review documentation and the documentation of the final recommendations and
write up. Reliability is supported by the proposed research methodology within this
research report.
Validity
The validity of the research method proposed is supported by the selection of participants
to the study. A consideration of the various population groups has strengthened the
envisaged validity of data collected. The groups are distributed through various value
chains of suppliers, producers and customers. The qualitative data collected will form a
true holistic representation of the RB beer and cider industry in South Africa.
Triangulation was deployed as another measure in assuring validity. Triangulation refers
to viewing the research from various perspectives on the same phenomena (Kulkarni,
2013). Triangulation was supported through using qualitative methods and physical
observation of the processes at each of the sample categories. In the proposed research,
the various perspectives were that of:
o Suppliers
o Producers
o Customers
18
Leveraging these perspectives will give a good indication as to how the various segments
of the RB market view the upstream or downstream operation pertaining to their business.
Transferability
Transferability relates to the degree which the research can be used outside the bounds
of the study. This study includes investigation of the RB landscape within the South
African context.
The research carries managerial implications to suppliers, producers and customers of
RB products. Successful investigation and implementation of the research carries
tremendous financial and operational benefits.
This study will provide insight to all stakeholders in the RB market, and was made
available to entities participating in the research.
Credibility
Credibility relates to the trustworthiness of findings during the research. This was ensured
by circulating the minutes of the meetings with participants for approval. This will ensure
that data has accurately been captured during the interview process and that the
participant is aware of the information given to the researcher.
Conformability
In order to obtain privileged data from producers, non-disclosure agreements have been
drawn up. These not disclosure agreements entail the distribution of the findings once
research has been completed.
By distributing the completed research participants will not only have an opportunity to
verify that sensitive data has been treated correctly but also ensure that the research has
been conducted in a subjective manner not harming or promoting any specific company.
In further support of conformability, the researcher will evaluate data subjectively which
is in support of the core research question. The core research question is in itself
subjective as it focusses on no specific producer but prolonging the life of RB’s throughout
the market.
1.5.8 Research ethics
Research ethics refers to ethical conduct throughout the collection, analysis, reporting
and publishing of the research subject (Hajimia, 2014). This includes adhering to all the
19
ethical requirements stipulated by the North West University’s Business School (NWU
Business School, 2018).
Informed consent forms providing the necessary information regarding the sensitivity of
information gathered during qualitative interviews is provided in Annexure C. This
informed consent letter is focussed on the key areas of the study, namely the mass-
market beer and cider producers.
In addition, general best practices of ethical conduct were maintained throughout the
entirety of the study. The following was adhered to as part of the ethical conduct in this
research study (Sagepub, 2018:54-58):
Do no harm
Companies and individuals in this study were assured that they will not be harmed in any
way. Due to the nature of this study, harm specifically relates to reputational damage.
Instead, as per the core research question, the study was beneficial to all participants.
Privacy and anonymity
Any company or individual participating in the study was granted complete anonymity.
This will include the removal of company names from any information received and
referenced to as “a producer in the RB industry” or alternative pseudonyms.
Confidentiality
As mentioned in the privacy and anonymity section above, confidentiality was ensured by
keeping sensitive information confidential. Information received will primarily be used to
draw up conclusions and recommendations during the study. The privacy and anonymity
of data were verified by company representatives reviewing the outcomes of the study
before submission.
Informed consent
This will include informing the participants of the nature of the study and the proposed
use of the interview results. The informed consent form is available in Annexure C. The
informed consent includes the right to withdraw whenever a participant becomes
uncomfortable or is unwilling to share proprietary information.
Rapport and friendship

20
The researcher will do his utmost best in providing participants with a friendly and
trustworthy environment in order to obtain most honest decisions.
Intrusiveness
During the study, the availability and level to which entities participate were respected at
all times. If an entity chose to not participate, their decision was respected and alternate
sources for data acquisition was investigated.
Inappropriate behaviour
Inappropriate behaviour includes defining the lines between the researcher and the
participant.
Further, inappropriate behaviour includes being subjective towards participants based on
previously collected data. In order to evade this, the researcher will remain objective at
all times during interviews and data analysis.
Data interpretation
Data interpretation closely relates to credibility as defined in paragraph 1.5.7. Thus, the
interpreted data was distributed to all stakeholders which participated in the study in order
to ensure unbiased data interpretation.
1.6 Limitation and scope of the study
The scope of the primary objectives of the study will lie within the bounds of the following
elements:
The South African alcoholic beverage industry
Within 50 km range from Johannesburg, Gauteng, South Africa
RPM strategies and policies
Legislative requirements
Beer and cider market
750 ml, 660 ml and 330 ml RB’s
Most predominant suppliers, producers and Tier 1 customers
1.7 Assumptions
Given the unexpected changes in economic development of South Africa, the following
assumptions are made with regards to the proposed study:
21
The current logistical models of producers remain constant.
The current manufacturing processes of suppliers remain constant.
No significant policy changes take regarding the consumption and advertisement
of alcoholic beverages.
No significant policy changes were implemented regarding the incentivization of
RB’s.
No new RB products will enter the market.
1.8 Layout of the study
The layout of this mini-dissertation will contain the following chapters:
Chapter 1 – Nature and Scope of the Study
Chapter 2 – Literature study
Chapter 3 – Empirical Analysis
Chapter 4 – Results and Discussions
Chapter 5 – Conclusion
1.9 Conclusion
South Africa has a high level of RB usage during the consumption of beer and cider. Due
to the nature of the customer and consumer segments, suppliers of these products
experience several difficulties as a result of the use of RB’s.
The preceding chapter discussed the problem statement in detail. The problem statement
was converged into a core research question related to increasing the lifecycle of the
RB’s. To answer the core research question, primary and secondary objectives were
provided, breaking it down into several areas identified for investigation.
A research process was provided and summarized in Figure 1-1. The research process
indicates logically sequenced steps to be taken in answering the core research question
through addressing the several primary and secondary objectives.
Limitations of the study were provided demarcating the boundaries of the study within a
predetermined portion of the RB value chain. The limitations were chosen based on the
level of impact decisions and processes have within the specifically identified segment.
Lastly, assumptions were provided for the study. These assumptions indicate the
expectations that the norms within the industry will remain constant for the duration of the
study.

22
1.10 Chapter summary
The following key elements were discussed during this chapter:
South African beer and cider industry
Problem statement of the RB industry
Objectives of the study
Research methodology
23
CHAPTER 2 – LITERATURE REVIEW
2.1 Introduction
This chapter will provide a comprehensive overview of research that has previously been
conducted in the field of RB’s. It will provide a theoretical context of the field of study and
form the basis of knowledge on the strategy and operation regarding RB’s and the
handling thereof within the South African mass beer and cider market. Although elements
of the RB lifecycle are well documented individually, little to no overlapping occurs for
South African specific conditions and will be addressed during the empirical study.
Although little literature has been published on the beer and cider industry, the principles
of RPM packaging materials remain relatively constant across various fields of
application. Commonalities between the two will be utilized to support the foundation of a
theoretical base. The literature study will be aimed at identifying gaps in the current
strategies, handling and implementation of RPM systems with specific reference to RB’s
in the South African mass-market beer and cider industry.
The literature review layout will be ordered logically according to the progression in the
strategic and operational requirements of RB’s. The literature study, in conjunction with
the qualitative interviews, covers areas of investigation as per the primary objectives as
in paragraph 1.4.1. The relationship between these factors will form the basis of
addressing the core research question as listed in paragraph 1.3.
Firstly, the returnable strategy will be discussed. The returnable strategy lays the
foundation for the operational process. This is contributed to the fact that that the strategy
directs the operational requirements, and subsequent supply chain considerations are
done to achieve the strategic goals. Although several returnable strategies exist, only the
strategy currently implemented by producers will be presented. The strategy presented
is considered the industry norm within the RB market includes the following elements:
Returnable strategies decision drivers
Deposit system strategy
Secondly, the lifecycle of the RB’s within its specific micro-, macro and external
environmental milieu’s will be discussed. This will include the operational aspects of the
production, processing and transportation of RB’s. The operational aspects discussed will
be derived from the RB strategy as per paragraph 2.2.
24
The following key elements are applicable to RB operations:
Overview of the lifecycle of RB’s
o Supply of RB’s
o Production of beer and cider
o Forward and reverse logistics
o Consumer behaviour
o Recycling of RB’s
o Market and site losses of RB’s
Further, the literature study will cover macroeconomic factors outside the physical domain
of the RB’s. These factors will cover the underlying drivers of a RB strategy, namely
customer psychology and regulation requirements, including the following:
International best practice standards
South African recycling culture
Legislative frameworks
Thirdly, the externality effects of the use of RB’s will be briefly discussed. These
externalities are effects that are not directly associated with the use of RB’s, and will
include the following:
Pollution
Alcohol abuse
Job creation
Lastly, a study will be conducted regarding alternative packaging materials that could be
utilized in RB’s. The benefits will be compared with the possible detrimental effects it
might have on the quality of the final product.
Understanding the strategic/process flow of the RB lifecycle and the external factors
imposing limitations to the optimal handling of the RB’s will lay the foundation for the
qualitative study. The critical areas of concern identified from the literature study will be
discussed with experts within the South African mass beer and cider RB market. Gaps
identified during the literature study will be encapsulated in the empirical interview
questions. Suggestions on possible improvements in the industry will be based on the
gap analysis through a theoretically supported literature study and insights gained from
the various selected participants.
25
2.2 Returnable strategies
Due to globalization with little product differentiation, producers are required to achieve
exceptional operational efficiency to maintain their Competitive Advantage (CA). A means
of achieving this is through a hybrid strategy (dos Santos, 2017) of utilizing both NRB’s
and RB’s with reverse logistics for different segments of the market. A key consideration
in the hybrid strategy is to reduce input costs. To achieve this, producers focus on
reducing costs associated with packaging.
Mass-market beer and cider products are consumed throughout South Africa. Producers
have to evaluate the benefits of RB and NRB to deliver the most cost-effective solution,
specifically looking at CAPEX investments for the RB’s and the OPEX spent on
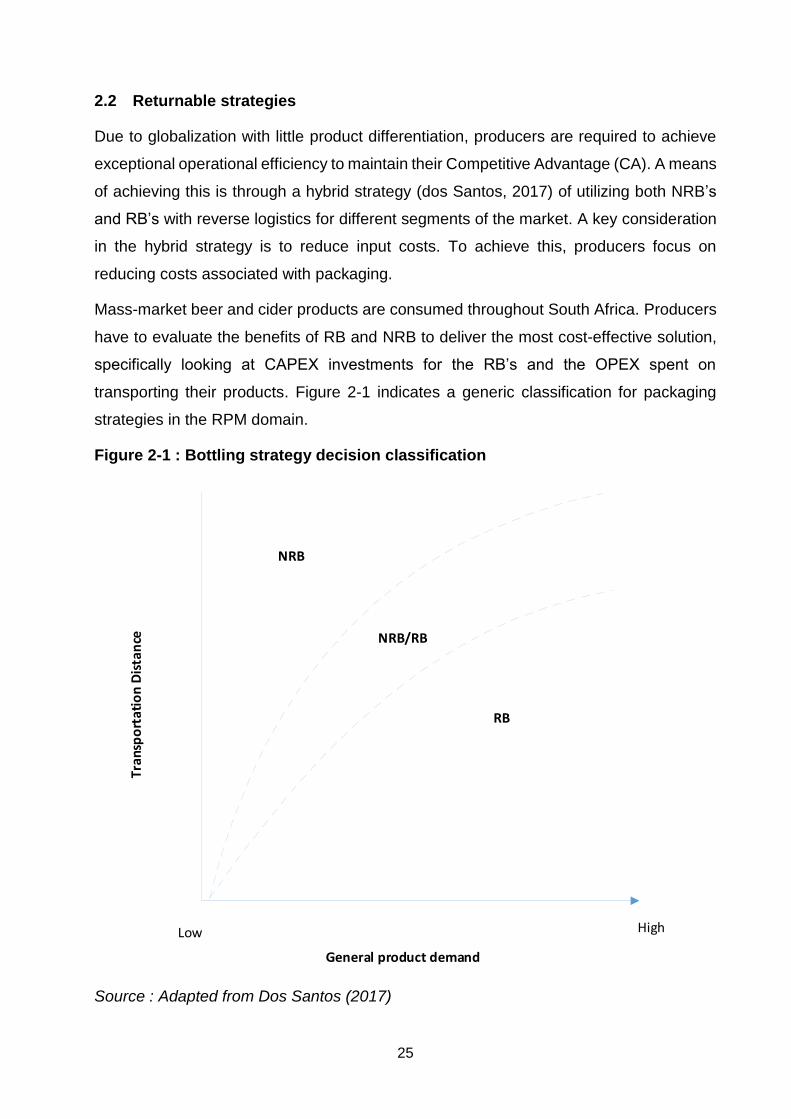
transporting their products. Figure 2-1 indicates a generic classification for packaging
strategies in the RPM domain.
Figure 2-1 : Bottling strategy decision classification
General product demand
Low High
Tran
spo
rtat
ion
Dis
tan
ce
RB
NRB/RB
NRB
Source : Adapted from Dos Santos (2017)
26
In the alcoholic beverage industry, the demand for mass-market beer and cider products
are seen to be extremely high, as defined in paragraph 1.1. The high demand can be
contributed to the fact that returnable products offer more value to the end consumer, as
price per millilitre is lower than NRB products (Motsoeneng et al., 2018). The high demand
tends to increase the favourability of RB’s over NRB, and as a result requires producers
to have extensive reverse logistics system in place for producers to ensure collection of
their assets.
Due to the South African been and cider market being continuously dominated by three
major players, comprehensive logistical infrastructure already exists for product
transportation (Arthur, 2016). Some producers own, operate and maintain their own
distribution networks whereas other producers make use of contracted LSP’s for handling
distribution on their behalf.
Through proper planning and utilization of the current logistical infrastructure, producers
generally implement a Closed Loop Supply Chain (CLSC) strategy (Kumar & Kumar,
2013). CLSC makes use of the same logistical infrastructure to recuperate initial value
added by allowing empty containers to be transported back to the producer's site (Louca
& Kokkinaki, 2012).
To ensure the producers keep input costs minimal, it is important that LSP’s footprint and
logistical capability justifies CLSC implementation. According to an article by Deloitte
Consulting, producers need to optimize forward logistics first as it will directly reduce the
impact of implementing reverse logistic processes (Deloitte, 2014:9).
In CLSC systems structure follows strategy, resulting in the formation of departments,
processes and technology to assist in meeting objectives (Spacey, 2016). These
additional facilities are set up to reduce financial and operational impact of collecting
returnable products from the market (Deen, 2017). Despite the additional resources
deployed, reverse logistics still remains the most cost-effective solution (FlashGlobal,
2017).
In the alcoholic beverage industry, strategies are deployed based on the producer’s
internal capability and business model selection. These are reliant on the demographic
footprint of producers coupled with their logistical capabilities in serving the market. Three
generic strategic approaches (dos Santos, 2017) to returnable products exist as indicated
in Figure 2-2.
27
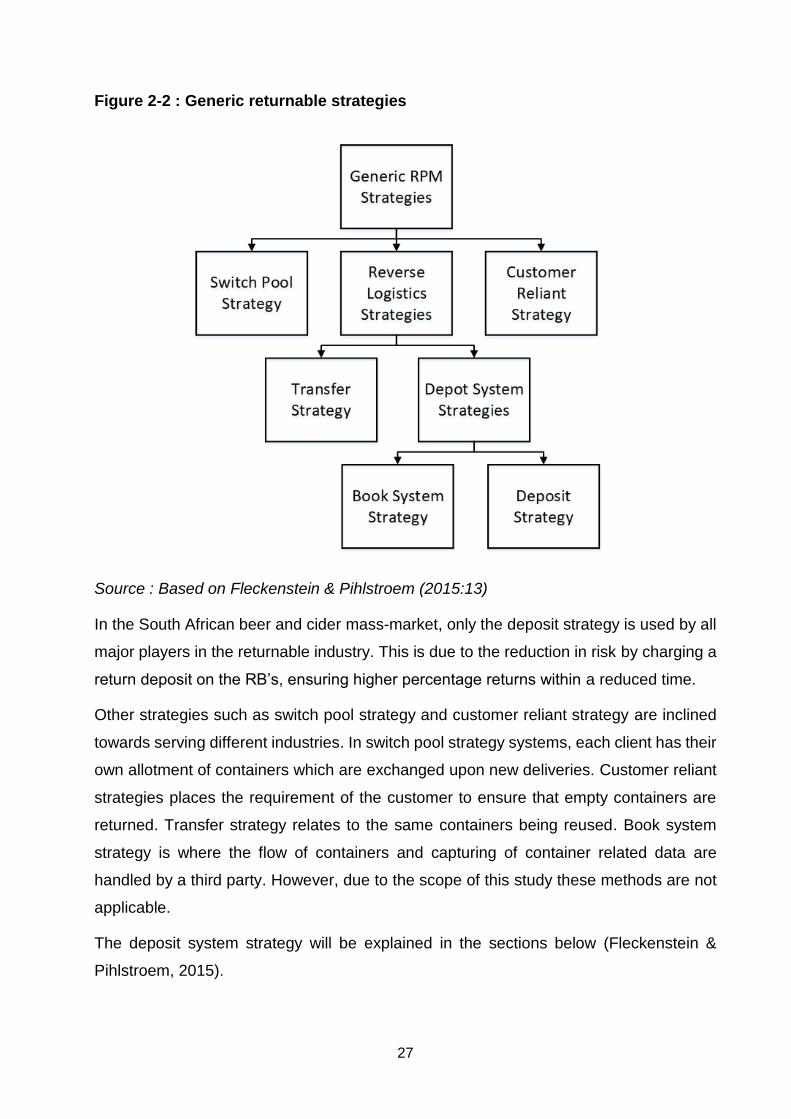
Figure 2-2 : Generic returnable strategies
Source : Based on Fleckenstein & Pihlstroem (2015:13)
In the South African beer and cider mass-market, only the deposit strategy is used by all
major players in the returnable industry. This is due to the reduction in risk by charging a
return deposit on the RB’s, ensuring higher percentage returns within a reduced time.
Other strategies such as switch pool strategy and customer reliant strategy are inclined
towards serving different industries. In switch pool strategy systems, each client has their
own allotment of containers which are exchanged upon new deliveries. Customer reliant
strategies places the requirement of the customer to ensure that empty containers are
returned. Transfer strategy relates to the same containers being reused. Book system
strategy is where the flow of containers and capturing of container related data are
handled by a third party. However, due to the scope of this study these methods are not
applicable.
The deposit system strategy will be explained in the sections below (Fleckenstein &
Pihlstroem, 2015).
28
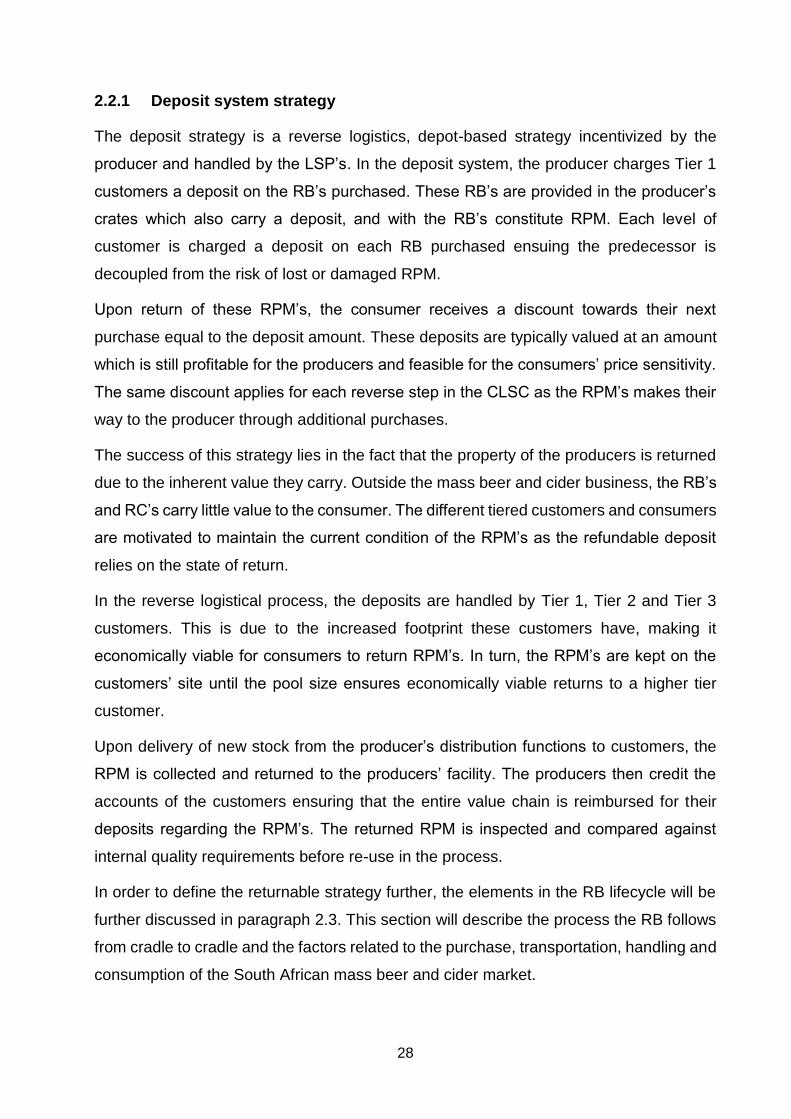
2.2.1 Deposit system strategy
The deposit strategy is a reverse logistics, depot-based strategy incentivized by the
producer and handled by the LSP’s. In the deposit system, the producer charges Tier 1
customers a deposit on the RB’s purchased. These RB’s are provided in the producer’s
crates which also carry a deposit, and with the RB’s constitute RPM. Each level of
customer is charged a deposit on each RB purchased ensuing the predecessor is
decoupled from the risk of lost or damaged RPM.
Upon return of these RPM’s, the consumer receives a discount towards their next
purchase equal to the deposit amount. These deposits are typically valued at an amount
which is still profitable for the producers and feasible for the consumers’ price sensitivity.
The same discount applies for each reverse step in the CLSC as the RPM’s makes their
way to the producer through additional purchases.
The success of this strategy lies in the fact that the property of the producers is returned
due to the inherent value they carry. Outside the mass beer and cider business, the RB’s
and RC’s carry little value to the consumer. The different tiered customers and consumers
are motivated to maintain the current condition of the RPM’s as the refundable deposit
relies on the state of return.
In the reverse logistical process, the deposits are handled by Tier 1, Tier 2 and Tier 3
customers. This is due to the increased footprint these customers have, making it
economically viable for consumers to return RPM’s. In turn, the RPM’s are kept on the
customers’ site until the pool size ensures economically viable returns to a higher tier
customer.
Upon delivery of new stock from the producer’s distribution functions to customers, the
RPM is collected and returned to the producers’ facility. The producers then credit the
accounts of the customers ensuring that the entire value chain is reimbursed for their
deposits regarding the RPM’s. The returned RPM is inspected and compared against
internal quality requirements before re-use in the process.
In order to define the returnable strategy further, the elements in the RB lifecycle will be
further discussed in paragraph 2.3. This section will describe the process the RB follows
from cradle to cradle and the factors related to the purchase, transportation, handling and
consumption of the South African mass beer and cider market.
29
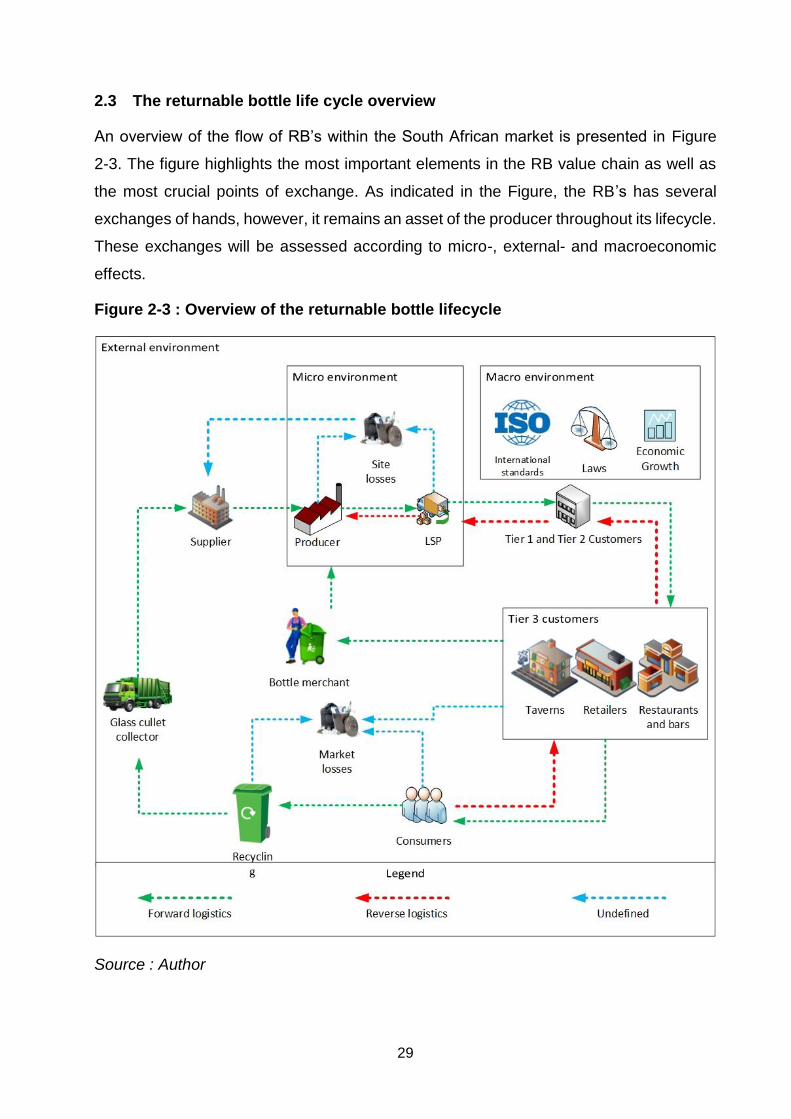
2.3 The returnable bottle life cycle overview
An overview of the flow of RB’s within the South African market is presented in Figure
2-3. The figure highlights the most important elements in the RB value chain as well as
the most crucial points of exchange. As indicated in the Figure, the RB’s has several
exchanges of hands, however, it remains an asset of the producer throughout its lifecycle.
These exchanges will be assessed according to micro-, external- and macroeconomic
effects.
Figure 2-3 : Overview of the returnable bottle lifecycle
Source : Author
30
During the RB lifecycle, the key exchange areas are of concern. Each key area has a
direct impact on the lifecycle of the RB’s due to the effect it can have on timeous returns.
The overview is segmented into three strategical environments with similar focus as with
a SWOT, Porter and PESTEL analysis. Each of these areas as indicated in Figure 2-3
will be discussed in more detail in the sections that follow:
2.3.1 Micro-environment
The microenvironment, as per Figure 2-3, indicates internal resources which the
producers have considerable control. This relates directly to managing capabilities and
operational efficiency within the production plant. Micro-environment from the producers’
perspective includes the production facility and distribution. In some instances,
distribution is managed by third-party LSP contractors.
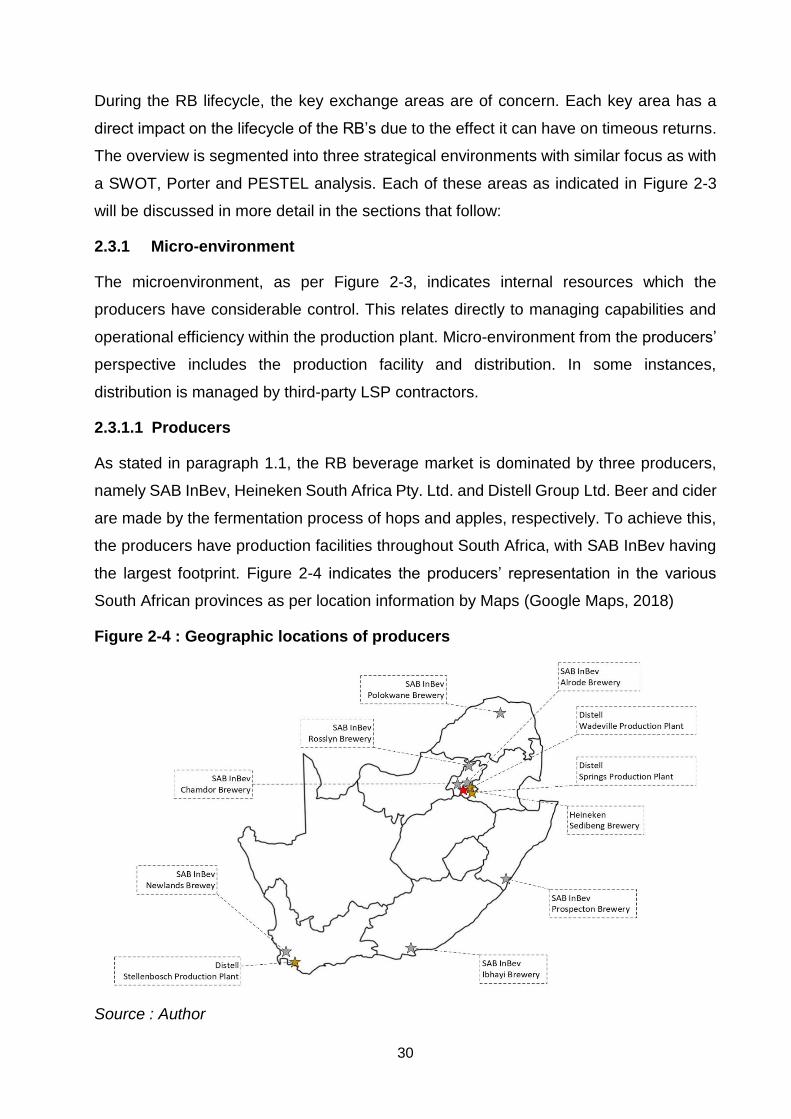
2.3.1.1 Producers
As stated in paragraph 1.1, the RB beverage market is dominated by three producers,
namely SAB InBev, Heineken South Africa Pty. Ltd. and Distell Group Ltd. Beer and cider
are made by the fermentation process of hops and apples, respectively. To achieve this,
the producers have production facilities throughout South Africa, with SAB InBev having
the largest footprint. Figure 2-4 indicates the producers’ representation in the various
South African provinces as per location information by Maps (Google Maps, 2018)
Figure 2-4 : Geographic locations of producers
Source : Author
31
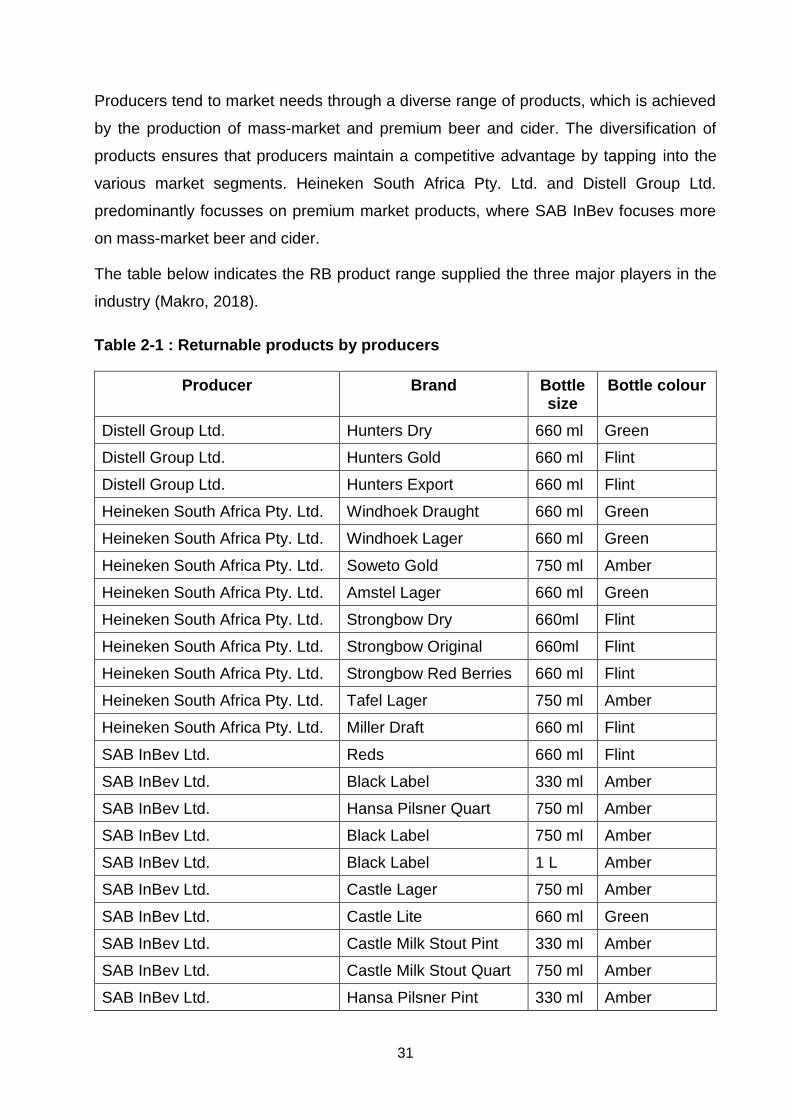
Producers tend to market needs through a diverse range of products, which is achieved
by the production of mass-market and premium beer and cider. The diversification of
products ensures that producers maintain a competitive advantage by tapping into the
various market segments. Heineken South Africa Pty. Ltd. and Distell Group Ltd.
predominantly focusses on premium market products, where SAB InBev focuses more
on mass-market beer and cider.
The table below indicates the RB product range supplied the three major players in the
industry (Makro, 2018).
Table 2-1 : Returnable products by producers
Producer Brand Bottle size
Bottle colour
Distell Group Ltd. Hunters Dry 660 ml Green
Distell Group Ltd. Hunters Gold 660 ml Flint
Distell Group Ltd. Hunters Export 660 ml Flint
Heineken South Africa Pty. Ltd. Windhoek Draught 660 ml Green
Heineken South Africa Pty. Ltd. Windhoek Lager 660 ml Green
Heineken South Africa Pty. Ltd. Soweto Gold 750 ml Amber
Heineken South Africa Pty. Ltd. Amstel Lager 660 ml Green
Heineken South Africa Pty. Ltd. Strongbow Dry 660ml Flint
Heineken South Africa Pty. Ltd. Strongbow Original 660ml Flint
Heineken South Africa Pty. Ltd. Strongbow Red Berries 660 ml Flint
Heineken South Africa Pty. Ltd. Tafel Lager 750 ml Amber
Heineken South Africa Pty. Ltd. Miller Draft 660 ml Flint
SAB InBev Ltd. Reds 660 ml Flint
SAB InBev Ltd. Black Label 330 ml Amber
SAB InBev Ltd. Hansa Pilsner Quart 750 ml Amber
SAB InBev Ltd. Black Label 750 ml Amber
SAB InBev Ltd. Black Label 1 L Amber
SAB InBev Ltd. Castle Lager 750 ml Amber
SAB InBev Ltd. Castle Lite 660 ml Green
SAB InBev Ltd. Castle Milk Stout Pint 330 ml Amber
SAB InBev Ltd. Castle Milk Stout Quart 750 ml Amber
SAB InBev Ltd. Hansa Pilsner Pint 330 ml Amber
32
The RB’s shipped from the supplier is used as containers for transportation medium of
beverage products from the producers. These RB’s are stored in covered or uncovered
areas on the production plant until required for filling.
Bottles are then filled based on current and calculated market demand. The inventory is
stored within vendor-specific crates which protect the bottles from breakage or scuffing.
A specific DOS level is retained on the producers’ premises in order to create a buffer for
the unpredictability of RB returns and market demand and handed over to the LSP for
distribution.
2.3.1.2 Site losses
Site losses relate to the proportion of RB’s at the production locations (including LSP’s)
which is broken, discarded or lost. Site losses are not always captured correctly or
accounted for and will not become available again and distorts accurate forecasting.
In order to capture accurate site loss figures, producers need to measure as far as
possible. However, the lack of information both internally and with the appointed LSP’s
results in misrepresented statistics.
When site losses occur, employees are required to file incident reports for each site loss
incident, however, it is not the case. This is due to the possible disciplinary procedure
which could follow as a result of the employee’s mistake. Site losses due to process
machinery malfunction is better captured due to the blame not necessarily being placed
on the employee and the recording being done automatically.
Site losses lead to additional CAPEX deployment required to buffer possible site losses
by acquiring an estimate of RB’s which will be damaged during their handling on site.
Significant site losses are returned to the supplier as cutlets for re-processing.
2.3.1.3 Logistics service provider
LSP’s ensure that the finished beverages are transported to the various customer
segments. In addition, LSP’s are used to collect and return RB’s to the production plant
upon new stock delivery. Both the forward and reverse logistics processes are handled
by the LSP’s through directive of the producer.
Depending on the producer, this function is either contracted out or run internally at a
cost-plus structure. In general, the costing model of LSP’s are dependent on the number
of crates of finished product being moved. Costs are calculated according to specific
33
routes taken. Regardless if NRB or RB products are transported, these crates take up a
set amount of space on the trucks, allowing LSP’s to plan accordingly.
The benefits of using LSP’s include amongst other scalability and flexibility (Wickstrom,
2015). Due to the contracting nature of their services, LSP’s can be remunerated for the
number of products moved. This negates the need for producers to invest in capital-
intensive logistical infrastructure. In addition, these LSP’s result in reduced operational
cost due to their substantial resource network and ongoing optimization.
However, the use of third-party LSP’s has a major disadvantage, namely loss of control
over shipments (Scolari, 2018). With customer satisfaction as a primary driver for
success, LSP’s play a vital role in ensuring deliveries are completed on time. Any issues
regarding deliveries negatively impact the producer’s image even though LSP were
responsible for the delays.
In the forward logistics segment, delivery date agreements exist between producers and
various customers. RB’s are shipped in crates of 12 bottles, which are standard across
all South African beer and cider mass-market producers. Producers in the industry who
utilizes third-party logistics have a set weekday for delivery, whereas producers with their
own logistics service can deliver on a more frequent basis.
The reverse logistics segment ensures that RB’s returned to any of the customers are
transported back to the producer for further cleaning and re-use. Reverse logistics
requires significantly more infrastructure in comparison with standard one-way products
(Forslund & Stolt, 2012). As stated, the return of these RB’s generally only happens on
each new delivery of finished products. Thus, transportation capacity utilization needs to
be accurately estimated (Venkatesh et al., 2015:4).
The effect of vertical integration has reduced turnaround time for RB’s where producers
distribute their own products. Quality control measures for both forward and reverse
logistics can also be better controlled due to the homogeneity of the producer and
supplier’s processes.
Thus, for producers utilizing third-party logistics company, a higher level of DOS is
required to mitigate the effect of less granular RB collection due to contracting constraints.
This can also be overcome by maintaining high levels of unfilled RB’s but adds to cost as
additional storage space is required.
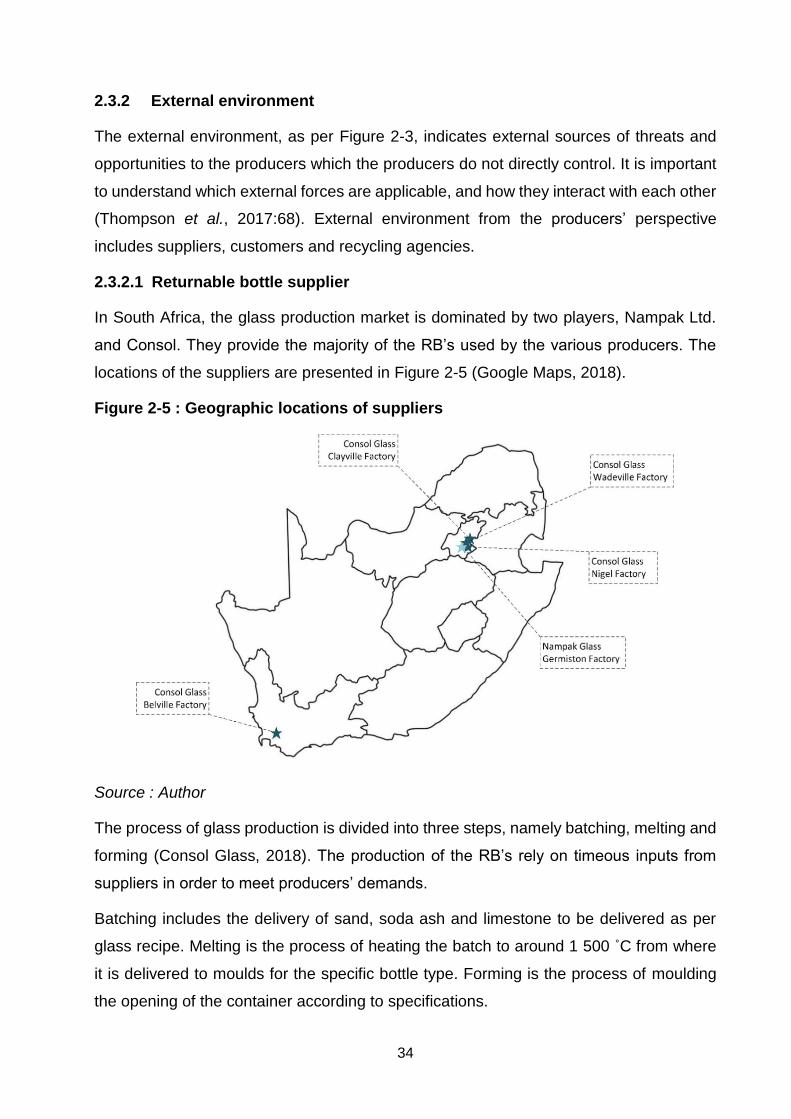
34
2.3.2 External environment
The external environment, as per Figure 2-3, indicates external sources of threats and
opportunities to the producers which the producers do not directly control. It is important
to understand which external forces are applicable, and how they interact with each other
(Thompson et al., 2017:68). External environment from the producers’ perspective
includes suppliers, customers and recycling agencies.
2.3.2.1 Returnable bottle supplier
In South Africa, the glass production market is dominated by two players, Nampak Ltd.
and Consol. They provide the majority of the RB’s used by the various producers. The
locations of the suppliers are presented in Figure 2-5 (Google Maps, 2018).
Figure 2-5 : Geographic locations of suppliers
Source : Author
The process of glass production is divided into three steps, namely batching, melting and
forming (Consol Glass, 2018). The production of the RB’s rely on timeous inputs from
suppliers in order to meet producers’ demands.
Batching includes the delivery of sand, soda ash and limestone to be delivered as per
glass recipe. Melting is the process of heating the batch to around 1 500 ˚C from where
it is delivered to moulds for the specific bottle type. Forming is the process of moulding
the opening of the container according to specifications.
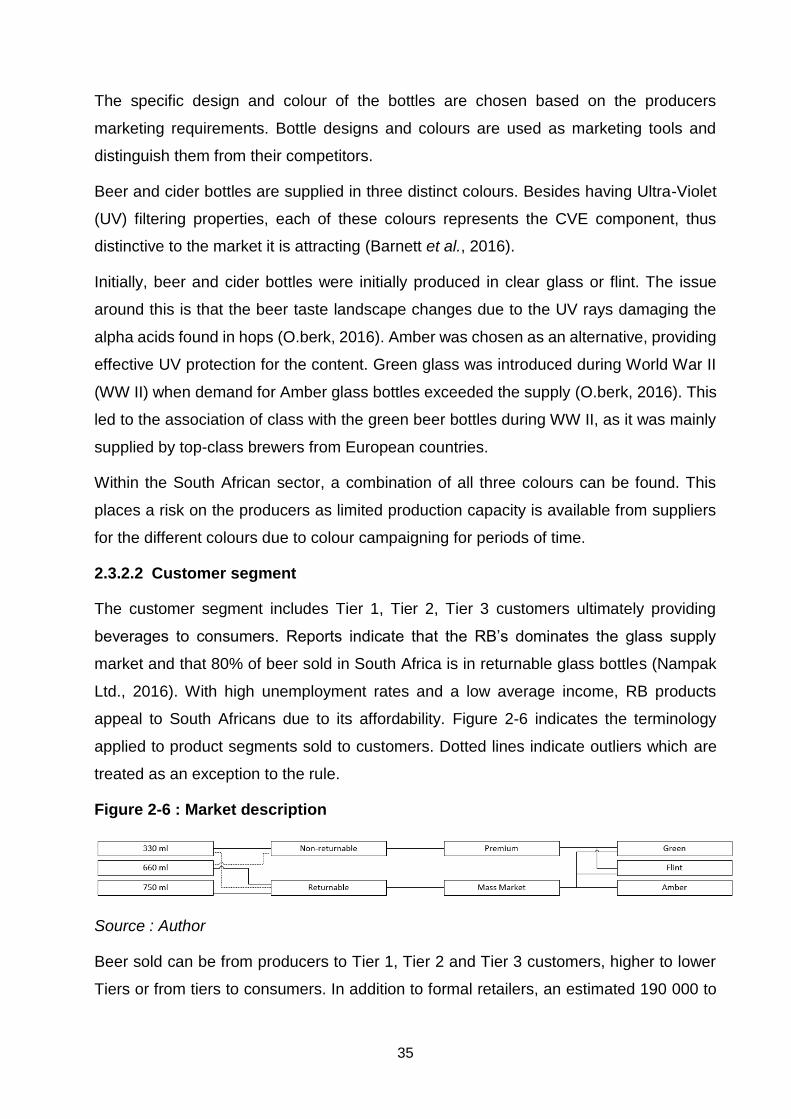
35
The specific design and colour of the bottles are chosen based on the producers
marketing requirements. Bottle designs and colours are used as marketing tools and
distinguish them from their competitors.
Beer and cider bottles are supplied in three distinct colours. Besides having Ultra-Violet
(UV) filtering properties, each of these colours represents the CVE component, thus
distinctive to the market it is attracting (Barnett et al., 2016).
Initially, beer and cider bottles were initially produced in clear glass or flint. The issue
around this is that the beer taste landscape changes due to the UV rays damaging the
alpha acids found in hops (O.berk, 2016). Amber was chosen as an alternative, providing
effective UV protection for the content. Green glass was introduced during World War II
(WW II) when demand for Amber glass bottles exceeded the supply (O.berk, 2016). This
led to the association of class with the green beer bottles during WW II, as it was mainly
supplied by top-class brewers from European countries.
Within the South African sector, a combination of all three colours can be found. This
places a risk on the producers as limited production capacity is available from suppliers
for the different colours due to colour campaigning for periods of time.
2.3.2.2 Customer segment
The customer segment includes Tier 1, Tier 2, Tier 3 customers ultimately providing
beverages to consumers. Reports indicate that the RB’s dominates the glass supply
market and that 80% of beer sold in South Africa is in returnable glass bottles (Nampak
Ltd., 2016). With high unemployment rates and a low average income, RB products
appeal to South Africans due to its affordability. Figure 2-6 indicates the terminology
applied to product segments sold to customers. Dotted lines indicate outliers which are
treated as an exception to the rule.
Figure 2-6 : Market description
Source : Author
Beer sold can be from producers to Tier 1, Tier 2 and Tier 3 customers, higher to lower
Tiers or from tiers to consumers. In addition to formal retailers, an estimated 190 000 to
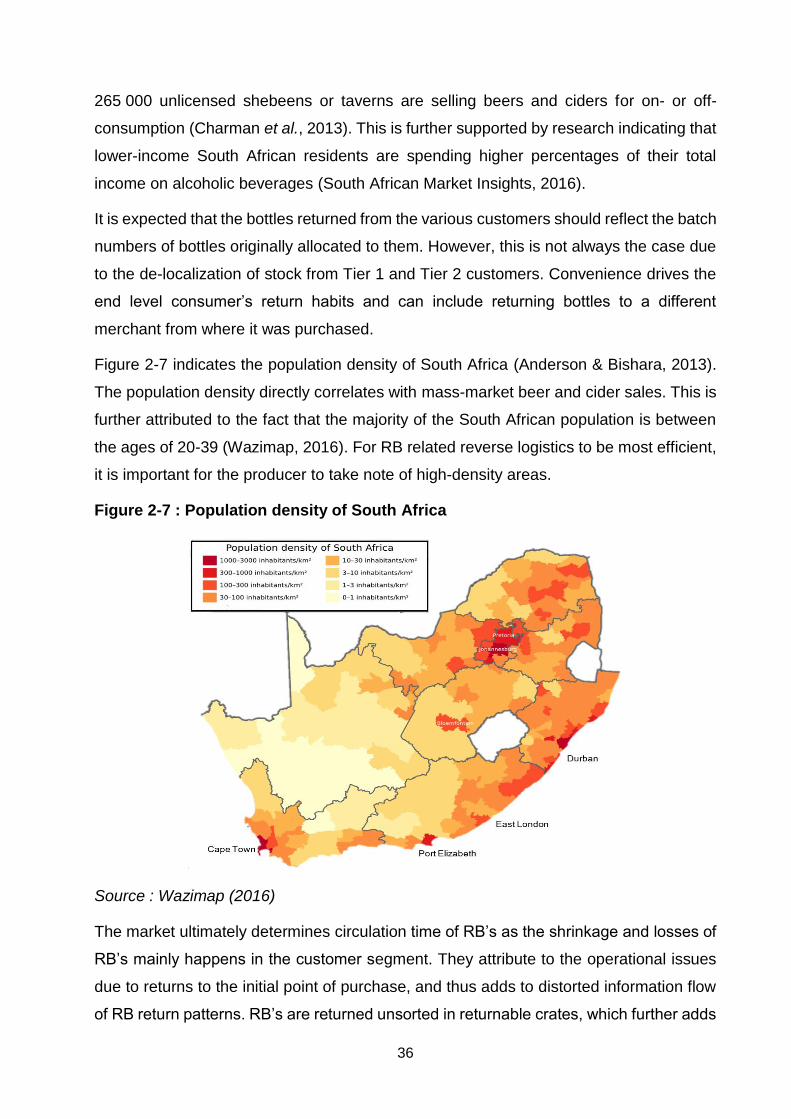
36
265 000 unlicensed shebeens or taverns are selling beers and ciders for on- or off-
consumption (Charman et al., 2013). This is further supported by research indicating that
lower-income South African residents are spending higher percentages of their total
income on alcoholic beverages (South African Market Insights, 2016).
It is expected that the bottles returned from the various customers should reflect the batch
numbers of bottles originally allocated to them. However, this is not always the case due
to the de-localization of stock from Tier 1 and Tier 2 customers. Convenience drives the
end level consumer’s return habits and can include returning bottles to a different
merchant from where it was purchased.
Figure 2-7 indicates the population density of South Africa (Anderson & Bishara, 2013).
The population density directly correlates with mass-market beer and cider sales. This is
further attributed to the fact that the majority of the South African population is between
the ages of 20-39 (Wazimap, 2016). For RB related reverse logistics to be most efficient,
it is important for the producer to take note of high-density areas.
Figure 2-7 : Population density of South Africa
Source : Wazimap (2016)
The market ultimately determines circulation time of RB’s as the shrinkage and losses of
RB’s mainly happens in the customer segment. They attribute to the operational issues
due to returns to the initial point of purchase, and thus adds to distorted information flow
of RB return patterns. RB’s are returned unsorted in returnable crates, which further adds
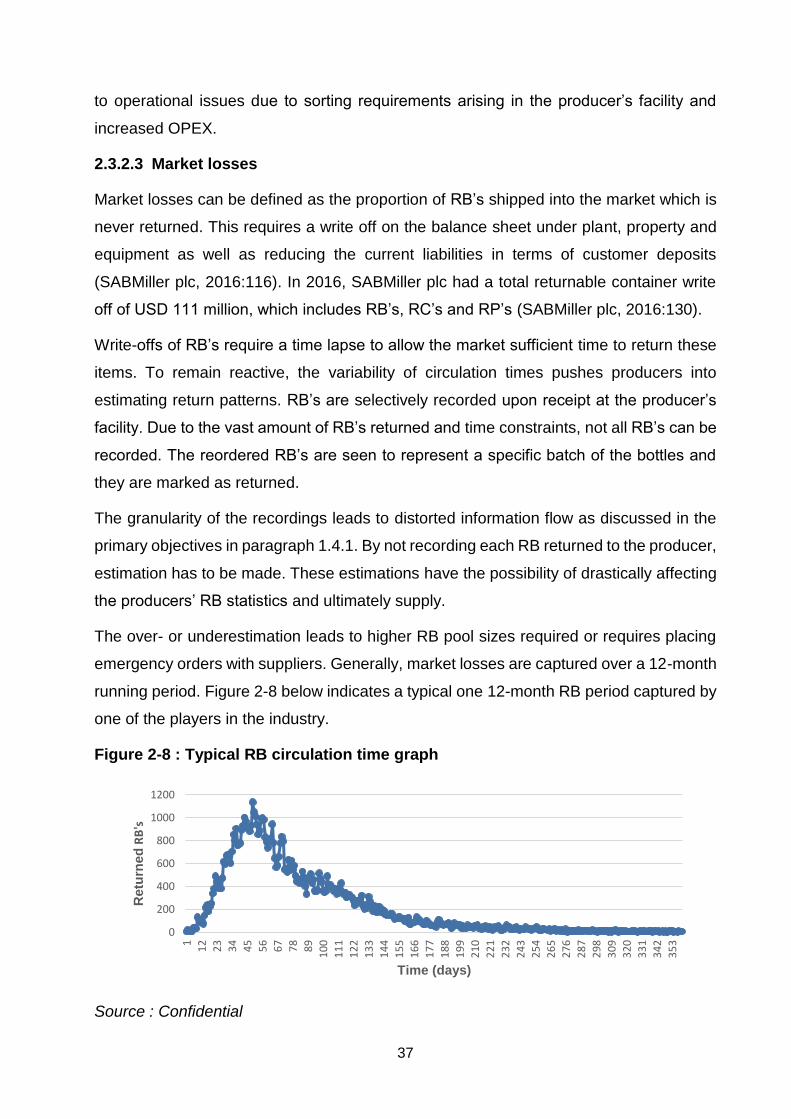
37
to operational issues due to sorting requirements arising in the producer’s facility and
increased OPEX.
2.3.2.3 Market losses
Market losses can be defined as the proportion of RB’s shipped into the market which is
never returned. This requires a write off on the balance sheet under plant, property and
equipment as well as reducing the current liabilities in terms of customer deposits
(SABMiller plc, 2016:116). In 2016, SABMiller plc had a total returnable container write
off of USD 111 million, which includes RB’s, RC’s and RP’s (SABMiller plc, 2016:130).
Write-offs of RB’s require a time lapse to allow the market sufficient time to return these
items. To remain reactive, the variability of circulation times pushes producers into
estimating return patterns. RB’s are selectively recorded upon receipt at the producer’s
facility. Due to the vast amount of RB’s returned and time constraints, not all RB’s can be
recorded. The reordered RB’s are seen to represent a specific batch of the bottles and
they are marked as returned.
The granularity of the recordings leads to distorted information flow as discussed in the
primary objectives in paragraph 1.4.1. By not recording each RB returned to the producer,
estimation has to be made. These estimations have the possibility of drastically affecting
the producers’ RB statistics and ultimately supply.
The over- or underestimation leads to higher RB pool sizes required or requires placing
emergency orders with suppliers. Generally, market losses are captured over a 12-month
running period. Figure 2-8 below indicates a typical one 12-month RB period captured by
one of the players in the industry.
Figure 2-8 : Typical RB circulation time graph
Source : Confidential
0
200
400
600
800
1000
1200
1
12
23
34
45
56
67
78
89
10
0
11
1
12
2
13
3
14
4
15
5
16
6
17
7
18
8
19
9
21
0
22
1
23
2
24
3
25
4
26
5
27
6
28
7
29
8
30
9
32
0
33
1
34
2
35
3
Retu
rned
RB
's
Time (days)
38
2.3.2.4 Glass collection and recycling
The disposal of broken glass cullets are used in the recycling process, where similar
coloured glass is melted and remoulded onto finished RB’s (Glass Packaging Institute,
2018). The recycling step generally bypasses the producers’ operation as glass collectors
sell cutlets directly to the suppliers. However, some glass collectors capitalize on
returning undamaged RB’s to the supplier (The Glass Recycling Company, 2016:16) and
receiving the refundable deposit in return.
Recycling has a tremendous impact on the economy as 50 000 income opportunities
were created (The Glass Recycling Company, 2016:2), either directly or indirectly within
the glass recycling industry. Included in this figure is the current uprising of bottle
merchants, who focusses primarily on returning sorted, undamaged RB’s to the correct
producers. Similar to market returns through Tiered customers, bottle merchants returns
are passed through the bottling washer plant before it re-enters the production stream.
However, with a market size held constant, the increase in revenues by glass recycling
companies indicate a decline in RB’s returned to the producer. This has negative impacts
on the EBIT as the decreased RB lifetime increases CoGS. Each addition in the recycling
and return value chain is indirectly placed on the producer’s account as the initial capital
has already been laid out with an expected amortization period.
2.3.3 Macro-environment
The macro environment, as per Figure 2-3, indicates factors which have an effect on the
industry, even though it is found well beyond the bounds of the producers (Thompson et
al., 2017:68). It is important to understand which macro forces and trends are applicable,
and how they can possibly affect the RB requirements. The macro environment to RB
lifecycle includes laws, standards and general economic climate.
2.3.3.1 Legislative compliance affecting the liquor industry
Liquor Act 59 of 2003
The act regulates the production and distribution of liquor. All producers and Tier
customers have to comply fully with the act in order to sell alcohol within South Africa. A
key impact which the liquor act has on RB’s is that distribution of alcohol is only allowed
to take place between 09:00 and 18:00 (LC ltd., 2013). As stated earlier, RB’s are only
collected on delivery of new products, thus limits collection windows of RB’s.
39
Liquor Laws Amendment Bill
In early 2017, a new liquor bill has been circulated to political parties to receive inputs
(BusinessTech, 2017). The new liquor amendment bill will include set windows for
advertising, new legal drinking age changes to where liquor is allowed to be sold. If the
new bill is passed, it will have a negative effect on beer and cider sales thus reducing the
amount of RB’s required.
Consumer Protection Act
Under section 66 of the Consumer Protection Act (CPA) states that retailers are obliged
to pay back the RB deposit in terms of credit towards another purchase (Knowler, 2012).
The deposit should be paid back, even if they have not been purchased at the retailer
where the bottle is returned.
The deposit system strategy coupled with the CPA places strain on the reverse logistic
procedures, as the deposit has to be paid back regardless of the location. This leads to
increased difficulty in planning reverse logistics routes as collection quantities may vary
from delivery quantities.
Carbon Emissions Tax
A new draft carbon emissions tax indicating additional tax per at R 120 per tonne (South
African National Treasury, 2017:27-30). The bill is separated according to specific
industries, with glass production per tonne factorised by 0.2 and liquefied petroleum gas
by 0.43. Both of these will have a significant impact on the cost of suppliers manufacturing
costs and overall logistics costs associated with RB’s and the reverse logistics process.
2.3.3.2 Liquor sales and economic growth correlation
In 2010, SAB InBev Ltd. alone contributed 3.1% of the country’s GDP (BusinessReport,
2010). This excludes the contribution by Distell Ltd. and Heineken SA Ltd. The growing
beer and cider market contribute significantly towards economic growth in South Africa,
opening many needed job opportunities.
With beer, it has been found that sales are directly correlated with both income and
unemployment rate (Reed, 2018). However, this is only an initial effect, as constant rising
incomes lead to a reduction in beer sales (Swinnen & Colen, 2016). With more South
African families entering the middle-income level, the beer and cider market will see
growth and South Africa will reap the economic benefits.

40
2.3.3.3 Standards affecting the liquor industry
ISO 9001
International Organization for Standardization (ISO) 9001 relates to the quality system
management. Quality management includes all stakeholders from production to
consumption (Vrellas & Tsiotras, 2015:1), and allows increased customer satisfaction
through operational efficiency.
For the RB industry, this means producers commit to supplying customers with high-
quality products. This has a direct impact on the amortisation period and EBI inspection
sensitivity, thus can only negatively impact the lifecycle of RB’s. RB’s amortizes over a
predetermined period of time, decided by each of the individual producers.
ISO 14001
ISO 14001 relates to implementing efficient Environmental Management Systems (EMS).
The management system quantifies methods on analysing and reducing the impact on
the environment (International Organization for Standardization , 2018). Implementing an
efficient EMS requires additional capital outlay and increases prices of RB’s as suppliers
have to recuperate these costs.
ISO 22000
ISO 22000 relates to food safety management by evaluating three key elements (Anjoran,
2015):
o Personal hygiene
o Facility hygiene
o Premise hygiene
Assessing these three elements is generally done through conducting a Hazard Analysis
and Critical Control Points (HACCP) analysis (Soman & Raman, 2016). Through the
analysis, hygiene of the RB’s returned from the market can be identified as a critical point.
Further, by full adoption of this standard employees and contractors working at breweries
are encouraged to complete incident reports, increasing transparency of RB information.
2.4 Returnable bottle externalities
An externality is defined as the consequence unrelated third parties carry as a result of
economic activity (Investopedia, 2018). Although profitable if implemented correctly, the
41
RB value chain has effects on communities not directly linked to the process. These
effects typically include pollution, job creation and added alcohol abuse.
2.4.1 Pollution
Studies have indicated that for every 10% of recycled glass an energy usage of 2% to 3%
is recorded at suppliers (Express Recycling and Sanitation, 2013). In a statement by
Eskom SOC Ltd (Waste Recycling, 2018), they indicate that each recycled glass bottle
saves enough energy to power a 100-watt lamp for up to four hours.
Thus, if glass is reused, a further reduction in energy costs and will be evident. The
reduction in energy cost can be converted to energy usage which contains CO2 emissions
per generated kilowatt per hour (kW/h). Currently, it is estimated that for each one tonne
RB’s reused 610kg CO2 is saved (Vivier, 2018).
However, each reused RB requires cleaning and sterilization (Vivier, 2018). The nett
environmental effect should be weighed by including net water usage for cleaning of RB’s
and amount of CO2 saved from being released to the atmosphere by new RB production
(The Glass Recycling Company, 2016:26).
2.4.2 Job creation
The use of RB’s in the industry requires substantially more steps in the value chain.
Besides the +-R13bn addition to tax revenues from total liquor sales (van Walbeek &
Blecher, 2013:117), the steps in the RB value chain attribute to job creation in South
Africa as each of these are generally serviced manually.
The rise of bottle merchants is also a considerable factor on the positive externalities of
the RB industry. These bottle merchants collect RB’s from shebeens and taverns and
transports them back to the producers for compensation.
2.4.3 Alcohol abuse
The advantage of RB’s in the mass beer and cider market is that it is made affordable by
the reduction in packaging expenditure. However, this leads to higher rates of
consumption due to the reduction in alcohol price (Institute of Alcohol Studies, 2017).
Research has indicated that beer and cider sales have a relatively minor price elasticity
of roughly -0.5 in developing countries, indicating that sales will increase somewhat when
price decreases (Euromonitor International, 2014).
42
In 2010, the South African government had expenditures totalling close to R16bn which
was directly attributed to the misuse of alcohol (van Walbeek & Blecher, 2013:12). The
costs were R6.8bn, R5.8bn and R3.4bn for the Department of Health, Department for
Safety and Security and Department of Correctional Services, respectively. The
expenditure is covered through tax revenues collected from the South African public,
making it personal to the South African public (City Press, 2015).
The misuse of alcohol has led to 6% of global deaths, the majority being related to driving
under the influence. South Africa has been ranked as one of the worst affected by drunk
driving incidents in the world (Mokolobate, 2017). According to Collins (2016), around 139
million disability-adjusted life years have been lost worldwide due to alcohol abuse.
2.5 Alternative bottling methods
Alternative bottling methods have been successfully implemented in worldwide including
neighbouring countries such as Zimbabwe by using polyethene terephthalate (PET)
bottles. Amongst other factors, the success is attributed to the fact that recent research
has indicated that the premium image relies more on the colour of the packaging than on
the material of the bottle (Drew, 2016).
The use of alternatives can drastically lower bottling costs and the savings can be passed
on to the consumer. Further benefits of using PET bottles at large events specifically is
the decreased risk of injuries due to glass shards or the use of the bottles as a means of
a weapon (Kilroy, 2014).
However, beer packaged through alternative methods are seen to have a shorter shelf-
life than others. The reason being is that glass is superior at keeping oxygen out in
comparison with PET (Polymer Solutions News Team, 2016). The oxygen ingress leads
to beer and cider turning stale faster than in glass (Li et al., 2015:4).
In addition, the properties of the amber and green bottles are such that it keeps UV rays
out as discussed in paragraph 2.3.2.1. PET bottles must be coated with an additional
protective layer to increase UV protection (PETPower, 2018). The additional coating
changes the requirements of the recycling process of the PET.
Although PET bottling has been successful in many countries (Euromonitor International,
2015), the current South African bottling and recycling procedures from producers and
suppliers have been implemented to accommodate glass. With no change in legislation
regarding recycling, these processes will be kept as is.
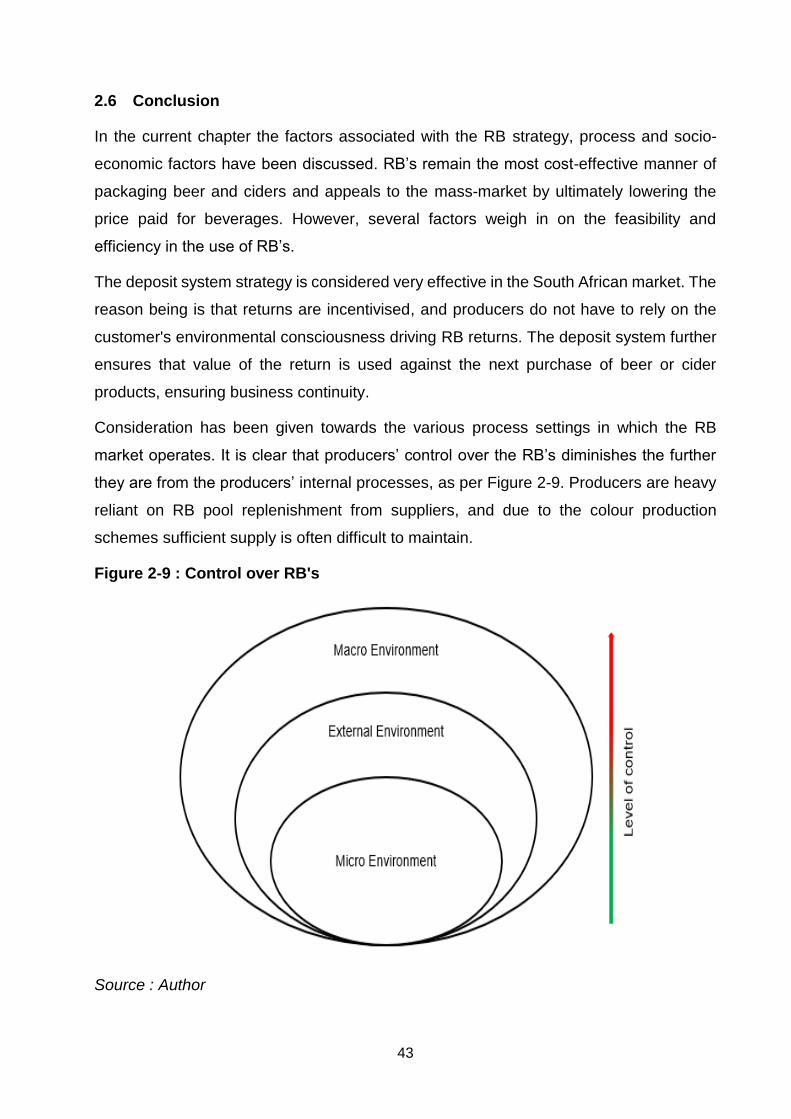
43
2.6 Conclusion
In the current chapter the factors associated with the RB strategy, process and socio-
economic factors have been discussed. RB’s remain the most cost-effective manner of
packaging beer and ciders and appeals to the mass-market by ultimately lowering the
price paid for beverages. However, several factors weigh in on the feasibility and
efficiency in the use of RB’s.
The deposit system strategy is considered very effective in the South African market. The
reason being is that returns are incentivised, and producers do not have to rely on the
customer's environmental consciousness driving RB returns. The deposit system further
ensures that value of the return is used against the next purchase of beer or cider
products, ensuring business continuity.
Consideration has been given towards the various process settings in which the RB
market operates. It is clear that producers’ control over the RB’s diminishes the further
they are from the producers’ internal processes, as per Figure 2-9. Producers are heavy
reliant on RB pool replenishment from suppliers, and due to the colour production
schemes sufficient supply is often difficult to maintain.
Figure 2-9 : Control over RB's
Source : Author
44
Regarding logistics, the control is passed on to LSP’s who handles the distribution and
collection. Although contractually obligated, LSP’s does not always report back on-site
losses that occurred by means of their wrongdoing. In addition, producers remain reliant
on consumers handling their assets with care and returning them within the shortest
possible timeframes. The return process is incentivised through the deployment of a
deposit obligation return strategy, ensuring that the consumers are reimbursed for the
returned RB.
From the literature study, it can be concluded that producers should focus on internal and
external factors affecting the RB industry, while still adhering to legislation and best
practise standards within the macro environment. Suppliers and producers are extremely
demographically localized (except for SAB InBev’s substantial footprint) and places an
additional bourdon on the magnitude of reverse logistics required due to physical
separation. However, the demographic locations of the suppliers and producers correlate
with population density, thus indicating that the majority of their customer base has
relatively low cost to serve.
The RB lifecycle cannot be seen as an independent phenomenon, and consideration
should be given to externalities, as internal and external efficiencies are directly impacted
by its consequences in a “catch 22” manner. Various externalities are attributed to the RB
lifecycle with both positive and negative side effects. Thus, a fine balance should be
maintained to increasing RB lifecycle, maximising profits and maintaining sound
Corporate Social Responsibilities (CSR).
2.7 Chapter summary
The following key elements were discussed during this chapter:
Overview of existing literature
Returnable strategies deployed in South Africa
Micro RB environment relating to the internal factors controlled by the producer
External RB environment to the external factors controlled by the industry
Macro RB environment to the external factors outside of the control of the producer
and the industry
RB externalities
Bottling methods other than glass

45
CHAPTER 3 – RESULTS AND DISCUSSIONS
3.1 Introduction
The results and discussion section will focus on the information gathered from the key
stakeholders in the RB lifecycle value chain. Furthermore, it will aim at critically discussing
the primary objectives and their influence on the core research question as listed in
paragraph 1.3.
Various interviews have been conducted with industry experts and role players as per
research design parameters listed in Table 1-1. The individuals that partook in the study
where interviewed through open-ended questions in order to converge to centralised
topics of concern within the RB industry. The anonymity of the respondents and their input
into the research investigations will be achieved through the use of pseudonyms such as
Supplier 1, Supplier 2, etc.
Questions were constructed with a specific focus on the various segments the
interviewees are operating in. As per Figure 2-3, these areas include the first three major
role players in the RB lifecycle, namely the supplier, producer and Tier 1 customers. The
sample selection was based on the fact that these three parties have the largest level of
involvement in controlling the RB lifecycles.
Questions were based on gaining an understanding regarding the life cycle process flow
of RB’s. More importantly, the process flow questions aim to achieve a general
understanding of the key areas of concern within RB manufacturing, production and
logistics sectors. Through successful identification of industries and elements reducing
the lifecycle of RB’s, successive intervention can be done through any role player seeking
to increase the lifecycle of the RB’s. Typically, this would be of most concern to producers
due to increased profits through increasing RONA on RB’s.
The results will be discussed in for each of the segments identified during the study.
Furthermore, the results will be summarized in paragraph 3.3.4 and evaluated against
the primary objectives of the study. The summary will provide an overview of the levels
of influence each of these constructs has on the RB lifecycle, including its externalities.
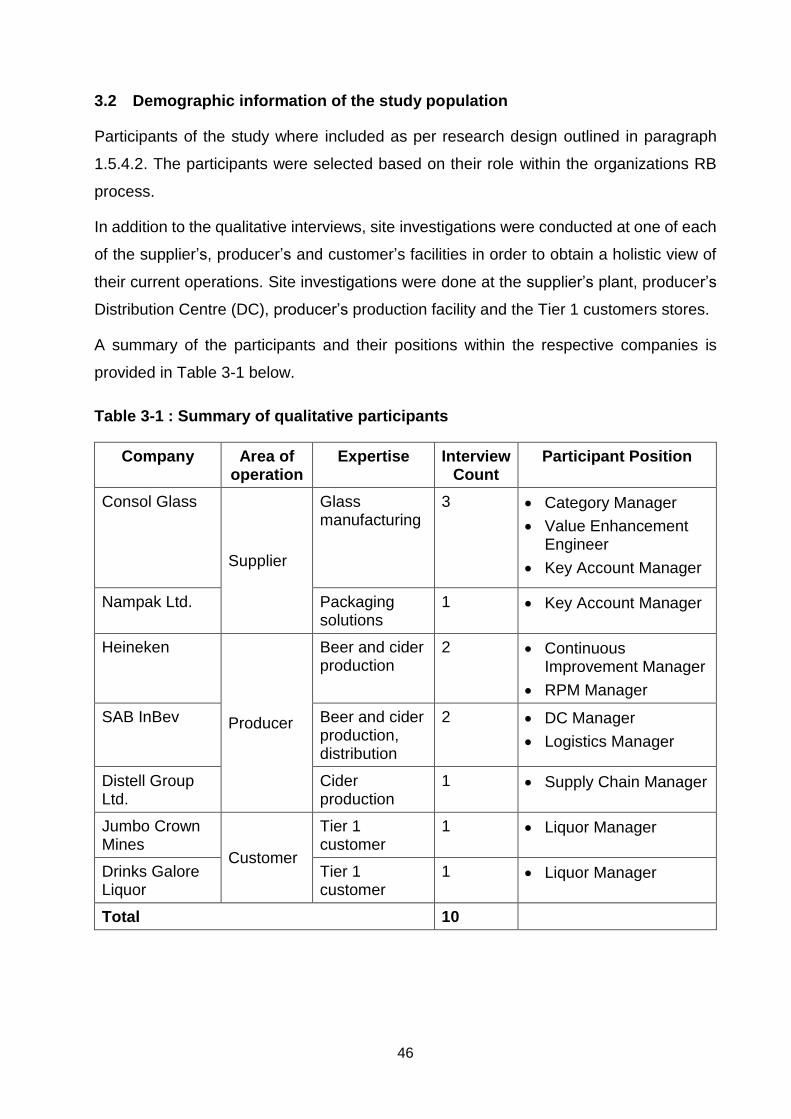
46
3.2 Demographic information of the study population
Participants of the study where included as per research design outlined in paragraph
1.5.4.2. The participants were selected based on their role within the organizations RB
process.
In addition to the qualitative interviews, site investigations were conducted at one of each
of the supplier’s, producer’s and customer’s facilities in order to obtain a holistic view of
their current operations. Site investigations were done at the supplier’s plant, producer’s
Distribution Centre (DC), producer’s production facility and the Tier 1 customers stores.
A summary of the participants and their positions within the respective companies is
provided in Table 3-1 below.
Table 3-1 : Summary of qualitative participants
Company Area of operation
Expertise Interview Count
Participant Position
Consol Glass
Supplier
Glass manufacturing
3 Category Manager
Value Enhancement Engineer
Key Account Manager
Nampak Ltd. Packaging solutions
1 Key Account Manager
Heineken
Producer
Beer and cider production
2 Continuous Improvement Manager
RPM Manager
SAB InBev Beer and cider production, distribution
2 DC Manager
Logistics Manager
Distell Group Ltd.
Cider production
1 Supply Chain Manager
Jumbo Crown Mines
Customer
Tier 1 customer
1 Liquor Manager
Drinks Galore Liquor
Tier 1 customer
1 Liquor Manager
Total 10
47
3.3 Study findings
The study findings will be presented in the sections listed below. The findings will be
discussed in light of the primary objectives listed in paragraph 1.4.1 with specific
reference towards the three main operational areas.
3.3.1 Supplier segment findings
This section discusses the operational findings of RB’s at the supplier segments.
Suppliers relate to the glass bottle manufacturers and supplies producers with empty
RB’s. However somewhat limited, the suppliers have the initial influence in the lifecycle
process of an RB. This influence can relate to the ability to timeously supply the market
with RB’s and the overall quality of the finalised product.
The internal process of manufacturing RB’s will be presented below. In conjunction with
the description below, it should be noted that manufacturing lines do not necessarily run
RB products only and can be manufactured in parallel with other NRB products of similar
colour. This is dependent on the manufacturer’s plant and equipment at the
manufacturing facility and the number of lines running from each furnace.
3.3.1.1 Internal manufacturing process
With regards to RB’s, producers compile an annual forecast for replenishing their
foreseen RB requirement, based on the collection from trade and the potential increase
in market demand. The forecasts form the basis of suppliers to plan production
campaigns specifically focussed on the selected colour requirements. Once a colour
campaign is selected, manufacturing is commenced based on the required volume.
The manufacturing of glass consists of silica, sand and soda ash. In addition, cullets of
the same colour scheme are recycled and added to the manufacturing process. The
cullets are generally acquired through suppliers tendering for broken glass from
producer’s facilities, termed industrial glass. Additionally, post-consumer glass cullets are
received from third party collection centres. The cullets are then cleaned, divided and
stored in staithes containing similar cullet colour.
The raw materials, including clean cullets, are then melted in a furnace at predefined
ratios. Typically, the furnaces are run on oil and gas in an attempt to mitigate the risk of
rising electricity costs. Emergency supplies of oil and gas located on the manufacturing
facilities site ensure that the furnaces run continuously.
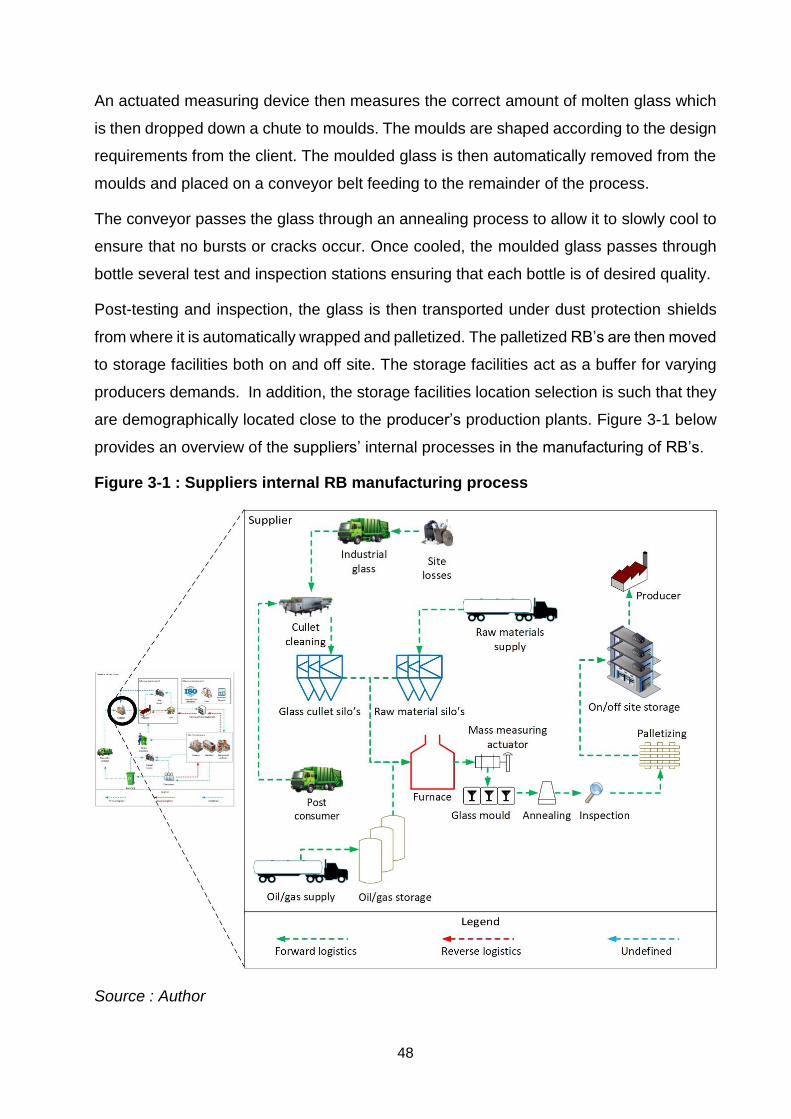
48
An actuated measuring device then measures the correct amount of molten glass which
is then dropped down a chute to moulds. The moulds are shaped according to the design
requirements from the client. The moulded glass is then automatically removed from the
moulds and placed on a conveyor belt feeding to the remainder of the process.
The conveyor passes the glass through an annealing process to allow it to slowly cool to
ensure that no bursts or cracks occur. Once cooled, the moulded glass passes through
bottle several test and inspection stations ensuring that each bottle is of desired quality.
Post-testing and inspection, the glass is then transported under dust protection shields
from where it is automatically wrapped and palletized. The palletized RB’s are then moved
to storage facilities both on and off site. The storage facilities act as a buffer for varying
producers demands. In addition, the storage facilities location selection is such that they
are demographically located close to the producer’s production plants. Figure 3-1 below
provides an overview of the suppliers’ internal processes in the manufacturing of RB’s.
Figure 3-1 : Suppliers internal RB manufacturing process
Source : Author
49
3.3.1.2 General supplier issues
The success of the RB process is subject to several upstream and downstream factors
affecting sufficient supply. Within the supplier segment, the following general issues have
been identified which places a bourdon on timeously delivering the market’s RB needs.
Producers forecasting is done annually, based on the allowed CAPEX budget
allocated for RB’s. However, more granular forecasting is required as the
manufacturing of RB’s is considered a long lead process.
Producer’s forecasting is not always accurate due to a disconnect between head
office goals and plant production capabilities. Marketing campaigns initialized see
to increased sales, regardless of the availability of both RB’s and production
capabilities.
The changeover of colour campaigns can take roughly eight days to complete.
This is attributed to the fact that the manufacturing of glass should be a concurrent
process.
Producer’s forecasting is not always accurate due to reliance from on RB
calculation based on returns from trade. This is somewhat out of the supplier and
producers’ control and deposit obligations are put in place to reduce the risk
RB’s have higher storage costs in relation to NRB’s due to the higher amount
required to be stored. This is due to NRB’s planning being much easier as it does
not rely on the RTI from trade.
Producers marketing campaigns result in demand shifting demand from one RB
product to another. This is due to the market finding more value in substitute sizes
and changing their purchasing habits.
RB trends are difficult to track from internal data only. Manufactures does not
necessarily have knowledge on the producer’s campaigns and can therefore only
participate reactively from the producer's forecast.
Post-consumer glass for recycling has to pass a rigorous separation and cleaning
process before reuse. Recycled glass cullets received back from the market
contain impurities which can affect the quality of newly produced RB’s.
RB’s are designed for much higher re-use rates that are currently achieved by
producers. Although not specifically an issue from the manufacturer's side, better
handling of the RB’s can result in much higher RONA.

50
Post high demand seasons RB’s are typically returned later than usual and
requires suppliers to provide additional capacity. If producers forecast
inaccurately, the replenishment required should be available from the
manufacturer’s depots.
RB’s are checked against the batch numbers upon return. Some suppliers can
produce around 400 000 bottles within a batch. The reduced information leads to
downstream planning efficiency negatively impacted based on low-resolution
assumptions on the exact bottles received back from trade.
3.3.2 Producer segment findings
This section discusses the operational findings of RB’s at the producer segments.
Producers purchase empty RB’s from the suppliers, fills them with their product and sells
them in the market. Producers are seen to play the most significant role in the RB lifecycle
due to their role as the strategy owner. As indicated in paragraph 2.3.1.1, RB’s remain
the property of producers, hence the requirement for effective control. Decisions on
purchasing of RB’s, sales campaigns, logistics and deposit obligation values all reside
within the producer’s internal processes.
3.3.2.1 Internal producer’s process
The main objective for producers is to ensure that sufficient RB’s are available for meeting
market demands. The three main drivers of ensuring a sufficient amount of RB’s is the
current stock on site, the market returns and the RB’s received back from trade.
Secondary objectives include increasing the RONA of RB’s. This is achieved by
maintaining the lowest possible circulation times by ensuring that the RB’s and their
logistical processes are handled timeously and with care.
Ensuring that sufficient amount of RB’s are available for production occurs through
analysing historical market data and providing forecasts annually. The analysis is based
on a projected amount of RB’s received back from trade. However, the amount varies
due to the limited control over end consumers and market fluctuations. Throughout the
year, RB’s can be replenished on shorter-term orders granted the suppliers can
manufacture within the required time.
The RB’s are received and stored on the producer’s facility. From the storage, it enters
the production process where it is filled with product and moved to a short-term finished
51
goods storage located on site. As soon as the finished product exits the production
process, circulation time is calculated.
From the short-term finished product storage, the goods can either be shipped to DC’s or
directly to Tier 1 customers. DC’s typically fulfil the role of having Nominated Delivery
Dates (NDD’s) where distribution can happen to all tiered customers. A similar 1:1
agreement exists where producers exchange the finished product for empty RB’s at the
DC’s. Due to the transport of NRB’s, additional capacity is created for utilization of
returning RB’s. In some instances, Tier 1 customers do a collection at the production
facility through their internal LSP’s. Typically, these LSP’s - which are external to the
producer - only has agreements for one-way delivery and do not take accountability in
returning empty RB’s.
The finished product is then sold through each of the various distribution channels. The
deposit obligation is paid to the producer at the same rate to which the customer charges
subsequent levels. Upon return of the RB’s, the consumers and customers are
reimbursed at the same rate at which they initially paid. The customer stores the empty
RB’s onsite until the next scheduled delivery date or until a next order is placed manually
and the exchange occurs, once again on the premise of a 1:1 ratio.
The empty RB’s are returned to the producer’s distribution centres though LSP’s or the
producer's internal logistics division. In addition to the exchange, a small percentage of
RB’s are received back from the market through the utilization of bottle merchants. These
bottle merchants collect RB’s within the rural areas and ensure transportation back to the
producers for a monetary remuneration.
After RB’s are collected from the market, decentralised sorting occurs at the DC’s
manually by dedicated sorting staff. Some producers utilized centralized sorting at the
production facility, however, this results in a large amount of additional storage required
which can alternatively be used for production. These producers are re-evaluating
decentralizing the sorting process. Foreign bottles are placed within the competitor’s
cases and stored until an exchange agreement is finalised between the various RB
producers.
From the sorting process, RB’s are required to be cleaned before entering production.
Only one producer makes use of offsite, third-party washing facilities. The other producers
contain washing facilities on site and forms part of the continuous production process.
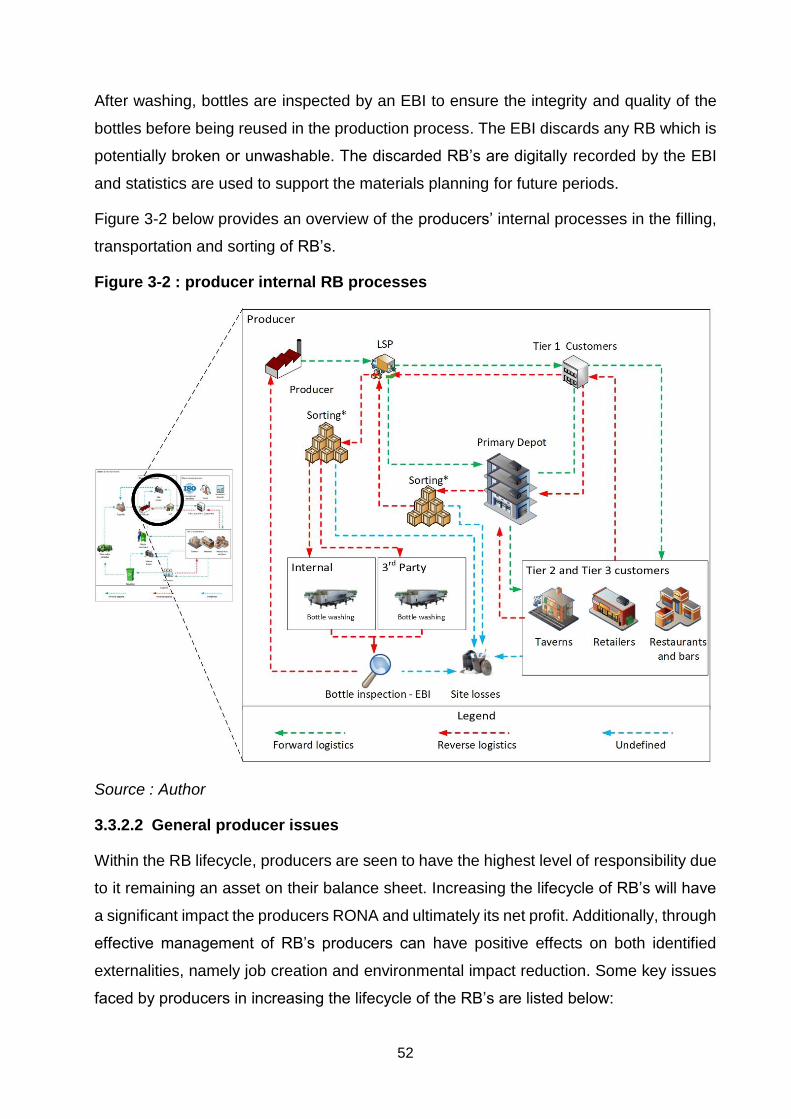
52
After washing, bottles are inspected by an EBI to ensure the integrity and quality of the
bottles before being reused in the production process. The EBI discards any RB which is
potentially broken or unwashable. The discarded RB’s are digitally recorded by the EBI
and statistics are used to support the materials planning for future periods.
Figure 3-2 below provides an overview of the producers’ internal processes in the filling,
transportation and sorting of RB’s.
Figure 3-2 : producer internal RB processes
Source : Author
3.3.2.2 General producer issues
Within the RB lifecycle, producers are seen to have the highest level of responsibility due
to it remaining an asset on their balance sheet. Increasing the lifecycle of RB’s will have
a significant impact the producers RONA and ultimately its net profit. Additionally, through
effective management of RB’s producers can have positive effects on both identified
externalities, namely job creation and environmental impact reduction. Some key issues
faced by producers in increasing the lifecycle of the RB’s are listed below:
53
Only one of the producers owns and operates their own logistical services. The
introduction of LSP’s adds another point of exchange outside the direct control of
the producer.
Third party LSP occasionally hide site losses. This is due to their obligation to
handle the RB’s with care and the possible risk to their service agreement with the
producer. Site losses are thus not recorded and contribute to inaccurate
forecasting.
Internal processes affect circulation time KPI’s of RB’s. This is due to the
circulation time being calculated from the moment the RB exists production. From
production, a delay of between 2-6 weeks can be induced due to finished product
travelling cross-country to reach the producers demographically spread depots.
In some instances, LSP’s create an additional delay on getting the product out to
the market. Although contractually obligated, internal issues arise prohibiting them
to meet their targets. This is due to their fleet of trucks being utilized for
transportation services outside of liquor delivery.
Producers forecast accuracy is around 65-75%. This leads to additional CAPEX
deployment requirements and supplier uncertainty.
Due to the vast amount of bottles returned to the producer, samples of returned
bottles are taken manually for batch inspection. Assumptions are made that all
bottles on the selected pallet are of the same batch originally sent to the customer.
This results in an accuracy of 1/924 bottles checked for the standard 12-bottle
crates.
Deposit prices range between 33%-50% of the replacement value of the RB’s.
Roughly 3% percentage of site losses occur through the EBI.
7%-11% of market losses occur. This has a significant financial impact due to high
levels of CAPEX spent on purchasing additional RB’s annually.
Exchange programmes are skewed between producers due to the imbalanced
market share. This results in high levels of RB’s being held between rival
producers. Additionally, agreements of reimbursing producers for the deposit
obligation paid towards the bottle are non-existent, placing an additional bourdon
on the successful exchange between suppliers.
High levels of rivalry exist between producers. This results in tremendous delays
and difficulties with exchange programs.
54
Deposit obligations differ between producers. Thus, higher values RB’s are
reimbursed at a lower rate by different producers. Additionally, customers are not
always aware of the correct deposit obligation required to be charged to
consumers.
RB’s stored in uncovered areas at either the DC’s or production facilities are
subject to mould. The RB’s has the potential to collect rainwater and are left
unattended for prolonged periods of time, increasing cleaning time with the
possibility of having the RB’s discarded.
Seasonality of the producer’s product results in higher level of empty RB’s required
which can be used in production. Seasonality can reach up to 160% of the
producer’s regular season demand.
Varying in market share results in RB circulation time calculation errors. Without
steady market conditions, RTI and circulation time becomes increasingly difficult
to track.
The RB market is currently declining. Potentially, this could be due to the high
levels of urbanization in South Africa and the increase in living standards for
ordinary South Africans. This can potentially result in higher levels of RB’s
existence as to the amount which is required for production.
3.3.3 Customer segment findings
This section discusses the operational findings of RB’s at the Tier 1 customer segments.
Tier 1 customers are the initial contact point between the producer’s internal operations
(inclusive of LSP) and the market. In general, Tier 1 customers supply Tier 2 and Tier 3
customers. In addition, they can supply the consumer directly, however, the cost benefit
of purchasing from Tier 1 customers are generally outweighed by the convenience of Tier
3 purchases due to the number of products purchased.
3.3.3.1 Internal returnable bottle process
Tier 1 customers purchase large amounts of finished product from the producers. Deposit
obligation is paid to the producers which are used as collateral against the CAPEX
investment the producers incurred. The deposit obligation is passed on to the customer’s
account at the same value charged by the producers and is generally charged inclusive
of both RB’s and RC’s.
55
The products are then transported to the various Tier 3 on-consumption sites where the
end consumer is once again charged the deposit obligation to provide collateral. In some
instances, higher values of deposit obligation is charged at these on consumption sites
in order to ensure higher rates of return on the RB’s. In contrast to account credit offered
by the producers and Tier 1 customers, the on-site consumer is reimbursed the deposit
obligation with cash.
The Tier 3 customer returns the empty RB’s to Tier 1 customers. In general, customers
follow a specific trend on returning RB’s which typically occurs on Mondays. This is
attributed to return batch consolidation efforts and the higher rate of sale achieved in
preparation for weekends. These RB’s are returned in the RC’s accompanying the sale
during the original purchase. The stock is then manually re-palletized and stored on the
Tier 1 customers site until a next RB collection takes place.
Typically, RB’s are collected after Tier 1 customers creates a new purchase order and
new stock is delivered. An ideal agreement between producers and Tier 1 customers exist
that a 1:1 ratio is maintained where the amount of RB’s returned equals the number of
new RB products purchased.
However, the 1:1 agreement is not always practical due to market losses incurred at each
of Tier 1 -, Tier 2 -, Tier 3 customers and the end consumer. In some instances, damaged
or foreign bottles are returned as RB’s which is ultimately reimbursed by the producer,
resulting in financial losses. These RB’s are sometimes deliberately hidden between other
bottles to receive higher deposit obligation payback. Tier 1 customers generally check if
crates are filled to their maximum capacity and with the correct RB’s as they increase
their risk of jeopardising their relationship with producers. However, not each crate can
be individually checked, and crates returned might only be partially or incorrectly filled.
In the customer's segment, sorting is not conducted at the Tier 1 customers site. However,
a culture of sorting at the source is implemented by some Tier 1 customers. This is
ensured by continuous checking and education of Tier 3 customs in terms of sorting
according to producer’s specific brands upon return. At the Tier 1 customers
implementing this technique, around 80% success rate is achieved.
Figure 3-3 below displays a summary of the process within the Tier 1 customer segment.
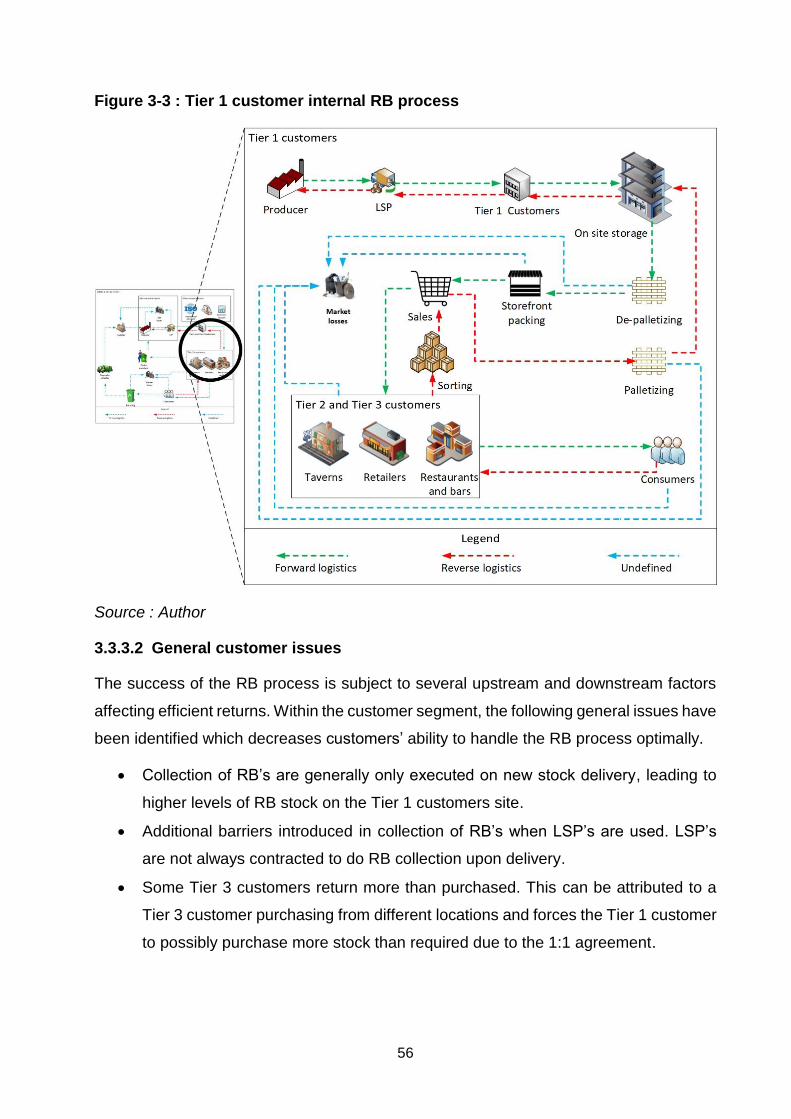
56
Figure 3-3 : Tier 1 customer internal RB process
Source : Author
3.3.3.2 General customer issues
The success of the RB process is subject to several upstream and downstream factors
affecting efficient returns. Within the customer segment, the following general issues have
been identified which decreases customers’ ability to handle the RB process optimally.
Collection of RB’s are generally only executed on new stock delivery, leading to
higher levels of RB stock on the Tier 1 customers site.
Additional barriers introduced in collection of RB’s when LSP’s are used. LSP’s
are not always contracted to do RB collection upon delivery.
Some Tier 3 customers return more than purchased. This can be attributed to a
Tier 3 customer purchasing from different locations and forces the Tier 1 customer
to possibly purchase more stock than required due to the 1:1 agreement.
57
Specific products have much lower return rates in comparison to others. This is
attributed to the fact that some of the Tier 3 consumers are unaware that the
product is in fact an RB and the deposit obligation have been paid upon purchase.
Higher income customers are seen to have a worse returning culture in relation to
tavern owners. This results in higher income customers stockpiling RB’s at their
site and not returning as frequently.
In some instances, empty trucks have to be sent by producers in order to
recuperate their RB assets if the 1:1 agreement fails. This can be due to
stockpiling or customers returning at different locations in relation to where the
RB’s were purchased.
Some producers have less frequent collection and delivery dates. This results in
higher levels of empty RB stock kept on the Tier 1 customers site. In addition, this
results in the producers RB pool size to be significantly larger to float the offset
introduced by less frequent collection.
Missing, Broken, Foreign and Unwashable (MBFU) bottles are accepted and
reimbursed to the customer resulting in financial losses incurred by the producer
Producers do not have policies in place to collect RB’s when the product expired.
The process would require an additional step to discard the product within the RB’s
to prevent brand damage within the market.
Producers can potentially hold stock back due to annual price increases being on
the horizon, resulting in additional levels of RB stockpiling at the Tier 1 customers
site.
At certain store chains, credit received by the consumer for the deposit obligation
is used to purchase items other than liquor.
3.3.4 Finding summary
The finding summary will aim to provide a weighting of importance to each of the supplier-
, producer- and customer segments interviewed during the study. The weightings will be
plotted against the primary objectives listed in paragraph 1.4.1. Additional areas of
concern are added to the summary where participants indicated its impact on the lifecycle
of the RB’s.
In determining operational areas requiring the largest amount of focus, the top three areas
identified in Table 3-2 will be identified per segment. These areas are depicted in red
based on the highest collective score of each of the objective’s constructs.
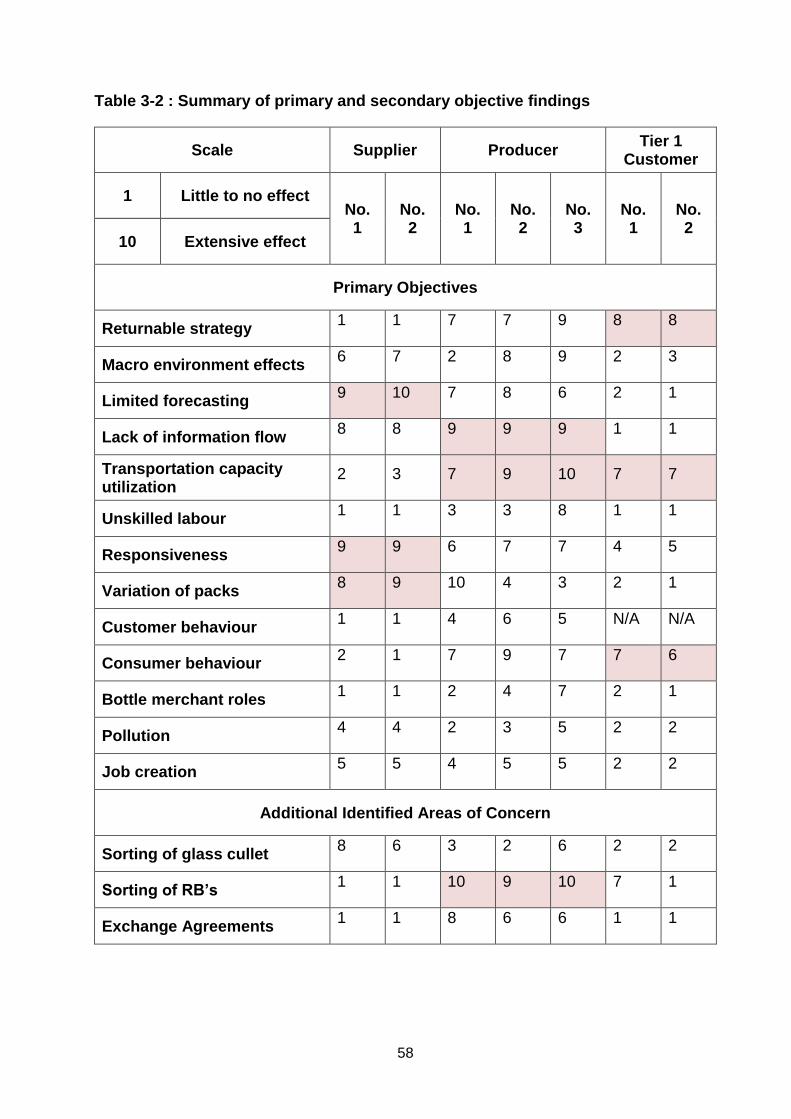
58
Table 3-2 : Summary of primary and secondary objective findings
Scale Supplier Producer Tier 1
Customer
1 Little to no effect No. 1
No. 2
No. 1
No. 2
No. 3
No. 1
No. 2
10 Extensive effect
Primary Objectives
Returnable strategy 1 1 7 7 9 8 8
Macro environment effects 6 7 2 8 9 2 3
Limited forecasting 9 10 7 8 6 2 1
Lack of information flow 8 8 9 9 9 1 1
Transportation capacity utilization
2 3 7 9 10 7 7
Unskilled labour 1 1 3 3 8 1 1
Responsiveness 9 9 6 7 7 4 5
Variation of packs 8 9 10 4 3 2 1
Customer behaviour 1 1 4 6 5 N/A N/A
Consumer behaviour 2 1 7 9 7 7 6
Bottle merchant roles 1 1 2 4 7 2 1
Pollution 4 4 2 3 5 2 2
Job creation 5 5 4 5 5 2 2
Additional Identified Areas of Concern
Sorting of glass cullet 8 6 3 2 6 2 2
Sorting of RB’s 1 1 10 9 10 7 1
Exchange Agreements 1 1 8 6 6 1 1
59
3.3.4.1 Supplier segment summary
The issues faced in the supplier segment are mainly related to communication between
producers and suppliers of RB’s. The three most predominant issues faced in the supplier
segment are the following:
Limited forecasting
Responsiveness
Variation of packs
Due to forecasting only done annually, manufacturing campaigns are planned out by
suppliers well in advance. As with any industry, the manufacturing plans seek to make
optimal use of plant assets. Any deviation in planning can have a tremendous effect on
the producer’s ability to acquire the additional amount of RB’s required. Changeovers of
colour campaigns on the supplier’s side can take upwards of eight days to complete and
affects their responsiveness to market demand.
The variation in packs can relate to either the mould of the RB or more significantly the
colour of the RB’s manufactured. As mentioned above, colour campaign changeovers
can take anything from eight days upward. Manufacturing of RB’s can be only be done
through a single colour scheme per furnace. Some modern furnaces have three output
lines able of producing three different designs through individual moulds.
3.3.4.2 Producer segment summary
Main issues within the producer segment of RB’s include three mutually exclusive
constructs. These include the lack of information flow regarding the granular identification
of RB’s received back from trade. Furthermore, the lack of transportation utilization plays
a significant effect on company revenues when the 1:1 agreement fails. Lastly, the sorting
of RB’s has a significant impact on the process due to time delays introduced and a large
amount of additional labour required.
Lack of information flow
Transportation capacity utilization
Sorting of RB’s
The lack of information flow can be attributed to the fact that only one bottle per pallet is
checked. As mentioned in paragraph 3.3.2, this result in a resolution of 1/924 of RB’s
collected from trade. Assumptions are made that the entire pallet contains the empty RB’s

60
sold with the original batch. Circulation time and annual CAPEX calculations are reliant
on the accuracy of the information of the RB’s returned.
The optimization of transportation capacity utilization will lead to fewer logistics cost
incurred by producers. However, the collection of the RB’s is dependent on how
frequently the market returns their RB’s as well as the percentage market losses incurred
by producers.
One of the key challenges in reducing circulation time is related to the sorting of the RB’s.
Currently, all RB’s are sorted manually, predominantly at decentralised locations. Manual
labour has the disadvantage of not performing well to problems of scale and is capped to
a certain amount of pallets per man hour. Additionally, some producers have seen
difficulties in striking staff with prolonged wage negotiation periods, having a further
negative impact on circulation times.
3.3.4.3 Customer segment summary
Within the customer segment, the three most significant factors influencing the process
of the RB lifecycle includes the following
Returnable strategy
Transportation capacity utilization
Consumer behaviour
The issues around transportation capacity utilization are attributed to some LSP’s are not
contracted to do pick-ups of empties. Ultimately, these results in cash flow issues due to
the customers not being able to claim the deposit obligation’s value captured in the
empties in their possession. Additionally, the infrequent pick up of empty RB’s results in
higher levels of empty stock needing to be stored on the customer's premises.
Consumer behaviour impacts customers due to the risk they undertake if RB’s received
back from the market is MBFU. In case of large discrepancies, the customers might be
short credited by producers on their next purchase. However not yet fully implemented
across the board, producers are starting to investigate the quality and amounts of their
bottles received back from the market. Investigation entails ensuring that the crates are
filled to capacity and within the correct producer’s crates.
The abovementioned relates strongly to the returnable strategy. This is due to the deposit
obligation ensuring that most of the RB’s are received back from trade and that the
61
amount reimbursed is spent at the same store again. Tavern owners, especially, have
high rates of return due to the value of the empty RB can have on their profits.
3.4 Conclusion
In the preceding chapter, findings relating to the RB lifecycle were discussed. The findings
were extracted through qualitative interviews with RB stakeholders and industry experts.
The aim of the open-ended questions was leading the participants to provide clarity on
the process and the influence the primary objectives of the study has on RB lifecycle.
The key findings for the supplier segment is related to limited forecasting. Due to the
required lead time for production, sporadic requests from producers have to be pooled
with the next campaign of similar colour. The most predominant findings in the producer
segment include the lack of information flow. This is attributed to low-resolution
information when assessing which bottles are received from trade due to no unique bottle
identification. Lastly, the most prevalent factor in the customer segment is the returnable
strategy. This relates to the deposit obligation paid by Tier 2 and Tier 3 customers as well
as the collection methods imposed by producers. The deposit strategy allows recurring
customers due to store credit being provided, rather than actual monetary reimbursement.
A summary of the findings was presented in Table 3-2. The summary includes a weighting
assigned to the level of influence each of the specific objective elements has on the
lifecycle of the RB. From the summary, the three most influential factors have been
chosen and discussed further. These areas are the focus points for addressing the core
research question as per paragraph 1.3. Through a KAIZEN like approach, addressing
these identified areas will contribute to increasing RONA on the use of RB’s.
The following chapter will discuss recommendations on improving the largest areas of
concern to ultimately increase the lifecycle of the RB through optimization physical and
business processes.
3.5 Chapter summary
The following key elements were discussed during this chapter:
Study findings of the supplier segment
Study findings of the producer segment
Study findings of the customer segment
Summarized findings evaluated against the primary research objectives
62
CHAPTER 4 – CONCLUSIONS AND RECOMMENDATIONS
4.1 Introduction
The following chapter will focus on discussing industry recommendations and highlighting
areas of future research. The industry recommendations will seek to bridge the gaps
experienced between supplier-, producer- and customer segments. The future research
section will highlight areas where research can be continued to further investigate
methods to ultimately increase the lifecycle of RB’s within the South African beer and
cider industry.
Furthermore, the study will be concluded by evaluating the achievement of the objectives
as in paragraph 1.3 and core research question as in paragraph 1.4.
Lastly, a summary of the research will be provided. This section will include a brief
overview of each of the chapters and the elements they contain. These will be discussed
in light of the problem statement as described in earlier in paragraph 1.2.
4.2 Industry recommendations
The study findings discussed in paragraph 3.3.4 highlights the current processes followed
by the various segments. Furthermore, it discusses the areas currently negatively
impacting the lifecycle of RB’s. The industry recommendations presented below are
suggestions to increase operational efficiency with regards to RB’s which can be
implemented in the short and medium term.
4.2.1 Improved communication
Improved communication’s impacts are mainly felt by the supplier segment. Due to them
planning their campaigns around producer’s forecasts it is of utmost importance that
these should be as accurate as possible. Both parties are required to increase
transparency regarding their communication to ensure sufficient supply of RB’s
throughout the year. This could include regular contact sessions or possibly allowing
Systems, Applications and Products (SAP) view nodes for suppliers. This will allow
suppliers to plan their colour campaigns more accurately, ultimately fulfilling the demands
of the producers and the market based on the information received from the Enterprise
Resource Planner (ERP) system.
63
4.2.2 Ensuring regular pick-ups
Ensuring more frequent pick-ups will benefit both the producer and customer segments.
Due to returns not always matching the customer's levels of purchase, an imbalance of
RB returns can increase. High levels of empty RB’s are being stored on customer’s
premises, placing a bourdon on operations. More frequent pick-ups can include sweeping
trucks collecting empties at depots or customers with known RB stock level issues.
Producers can benefit by decreasing circulation times thus increasing potential RONA. In
addition, exchange agreements between producers should be formalised to an extent
where all RB’s return to their original producers within the least amount of time without
affecting the deposit obligation paid by their rivals.
4.2.3 Automated sorting
Currently, sorting is being done manually at each of the depots or producers’ sites. This
places heavy reliance on manual labour efficiency and can lead to increased circulation
times. Automated bottle sorting is recommended. Automated sorting will increase the
production plants throughput and minimize site losses incurred from sorting activities. A
cost-benefit analysis is to be conducted to quantify the potential gains and the effect that
it would have on the employed labour force.
4.2.4 Unique bottle identification
Currently, bottles only contain batch identification as indicated in paragraph 3.3.1.2. Due
to the vast amount of RB’s manufactured within a batch, low levels of granular information
exist. By uniquely identifying each RB used in production, producers can increase current
levels of forecasting efficiency pinpoint problem customers. The unique identification will
greatly assist producers and suppliers in increasing forecasting accuracy and drastically
increase the producers’ control over their assets.
4.3 Achievement of the objectives of the study
Objectives of the study can be categorized into three separate sections, namely the core
research question, primary objectives and supporting secondary objectives. If achieved
and addressed, primary and supporting secondary objectives will ultimately answer the
core research question as stated in paragraph 1.3.
Through specifically orientating the literature study and qualitative interview questions, all
the above-mentioned areas were discussed within the report. Study findings have been
64
presented to highlighting the areas or concern in the RB lifecycle. Furthermore, industry
recommendations have been provided to potentially decrease the misalignment between
the various segments in the South African mass-market beer and cider industry.
4.4 Recommendations for future research
This mini-dissertation focussed on RB’s within the South African beer and cider industry.
Further expansion of the qualitative sample population to end consumers as well as
including other elements of RPM is recommended for future research.
The expansion of the qualitative sample population should aim to include end consumers,
specifically tavern customers. These end level consumers are responsible for over 80%
of RB sales within South Africa and is a significant stakeholder in the RB value chain.
Tavern owners are known to implement more stringent rules around RB’s in order to
ensure that high levels of return are achieved.
Furthermore, the inclusion of other RPM will further increase the understanding of the RB
trade. The inclusion of items such as RP’s and RC’s as a means of transporting RB
products will provide a deeper understanding of the entire returnable process.
4.5 Conclusion
South Africa has seen strong growth in the beer and cider industry over the preceding
years. The South African market, dominated by SAB InBev, Distell Ltd and Heineken N.V,
utilizes RB as a method to maintain the lowest possible production costs. Throughout its
lifecycle, RB’s remain the property of the producers. The use of RB’s ensures that
producers receive higher levels of RONA in comparison to NRB’s.
Although the RB market is seeing slower growth in relation to NRB’s it still makes up the
vast majority of beer and cider sales. The use of these RB’s requires extensive reverse
logistics infrastructure to ensure that producers receive their assets back from trade.
This study was aimed at investigating factors influencing the lifecycle of RB’s within the
South African beer and cider market. Four critical issues exist, namely the supply of RB’s,
high circulation times, high inventory requirements and high levels of site and market
losses. These issues were converged into a core research question, namely:
What changes can be made both internally and externally to maximise RONA of
RB’s?
65
The core research question was analyzed and diverged into several primary and
supporting secondary research objectives, partially supported by a RB study conducted
in India. The research objectives identified areas in need of investigation to ultimately
answer the core research question. A research methodology was constructed around the
specific requirements of the study. The research methodology was based on qualitative
data collection methods due to the nature of the study.
A literature survey was conducted to provide a basis of understanding of elements within
the RB trade. The literature survey was based on an investigation of the internal-,
external- and macro environments of producers. To understand the basis of operation,
an investigation on the RB strategy deployed by producers was conducted. Furthermore,
consideration was given to understand the process of RB supply, production, logistics
and customers to identify key areas affecting its lifecycle. Research around the
macroeconomic effects affecting the RB trade was added to form a holistic view of
elements which has an influence of the primary objectives.
Qualitative interviews were conducted with various industry experts. These interview
participants were selected to represent each of the major stakeholder segments within
the RB trade, namely the suppliers, producers and Tier 1 customers. The study findings
were presented with a specific focus on the issues experienced relating to the primary
objectives of the study. The issues were coded based on the perceived level of impact at
each key segment to identify the core problems affecting the lifecycle of RB’s in South
Africa. The key areas of concern can be summarized as follows:
Suppliers
o Limited forecasting
o Responsiveness
o Variation of packs
Producer
o Lack of information flow
o Transportation capacity utilization
o Sorting of RB’s
Tier 1 customers
o Returnable strategy
o Transportation capacity utilization
o Consumer behaviour
66
Lastly, the study was concluded by presenting recommendations to both the various
segments in the industry as well as recommendations for future academic research.
These recommendations were based on areas identified through both the literature
survey and qualitative interviews with industry experts.
In conclusion, the study was successfully conducted in terms of addressing the core
research question through the investigation and unpacking of the primary objectives. The
limited availability of literature was overcome through a series of informative qualitative
interviews with experts operating in the field. In summary, the use of RB’s remains the
most economically viable and environmentally friendly solution to beer and cider sales
within South Africa, regardless of the challenges faced.
4.6 Research summary
paragraphs were developed around addressing the core research question through
gaining an understanding of the effects of the primary objectives on the lifecycle of RB’s
within the South African beer and cider mass-market. The research summary is presented
below.
Chapter 1 – Introduction and an overview of the problem statement. The problem
statement was translated to a core research question coupled with research
objectives required to gain an understanding of factors influencing the RB trade.
Additionally, the section provided a research methodology approach.
Chapter 2 – Literature study on the internal, macro and external environment of
RB’s. Internal refers to producers’ control, external refers to organizations
supplying and using the RB’s and macro indicating the factors falls outside of the
control of any of the stakeholders.
Chapter 3 – Provided findings based on the qualitative data obtained from
interviewing participants. The data was analyzed and critical issues within the
industry have been derived in light of the primary research objectives.
Chapter 4 – Provided an overview and conclusion of the study conducted.
Additionally, the section provided industry recommendations and
recommendations for further areas requiring academic research. These areas
mainly included expanding research into the RPM supporting RB’s, such as RC’s
and RP’s.
67
ANNEXURE A – BIBLIOGRAPHY
5 Anderson, Jordan. & Bishara, Andrew. 2013. Economic incentives alter nutritional
patterns in South Africa. https://www.2minutemedicine.com/economic-incentives-
alter-nutritional-patterns-in-south-africa/ Date of access: 30 March. 2018.
Anjoran, Renaud. 2015. Food safety standards: ISO 22001, HACCP,
GMP. https://qualityinspection.org/china-iso22000-haccp-gmp/ Date of access: 30
March. 2018.
Arthur, Rachel. 2016. Africa: The fastest growing beer
market. https://www.beveragedaily.com/Article/2016/01/12/Africa-The-fastest-growing-
beer-market Date of access: 12 November. 2018.
Astalin, Prashant. 2013. Qualitative Research Designs: A Conceptual
Framework. International Journal of Social Science & Interdisciplinary
Research, 2(1):1.
Barnett, Andrew., Velasco, Carlos. & Spence, Charles. 2016. Bottled vs. Canned Beer:
Do They Really Taste Different? Beverages, 25(2):1-11.
Brandman University. 2017. Daily ways to uphold your professionalism and workplace
etiquette. https://www.brandman.edu/news-and-
events/news/2017/08/17/13/04/professionalism-and-workplace-etiquette Date of
access: 15 March. 2018.
Brymen, Alen., Bell, Emma., Hirschsohn, Phillip., Du Toit, Jacques., dos Santos,
Andeline., Masenge, Andries., van Aardt, Isa. & Wagner, Claire. 2016. Research
Methodology - Business and Management Contexts. Fifth ed. Oxford: Oxford University
Press.
BusinessReport. 2010. Liquor industry provides 4.4% of GDP -
study. https://www.iol.co.za/business-report/economy/liquor-industry-provides-44-of-
gdp-study-693600 Date of access: 8 August. 2018.
BusinessTech. 2017. 6 things you need to know about South Africa’s new drinking
laws. https://businesstech.co.za/news/lifestyle/153091/6-things-you-need-to-know-
about-south-africas-new-drinking-laws/ Date of access: 28 March. 2018.

68
Camea. 2018. Bottle Inspection. https://www.camea.cz/en/industry/bottle-
inspection/ Date of access: 12 November. 2018.
Charman, Andrew. JE., Petersen, Leif. M. & Piper, Laurence. 2013. Enforced
informalisation: the case of liquor retailers in South Africa. DEVELOPMENT
SOUTHERN AFRICA, 30(4-5):580-595.
CIRT. 2018. Establishing Validity in Qualitative
Research. https://cirt.gcu.edu/research/developmentresources/research_ready/qualitati
ve/validity Date of access: 25 March. 2018.
City Press. 2015. Alcohol abuse costs SA’s taxpayers R300bn or more a
year. https://www.news24.com/Archives/City-Press/Alcohol-abuse-costs-SAs-
taxpayers-R300bn-or-more-a-year-20150429 Date of access: 12 November. 2018.
Collins, Susan. E. 2016. Associations Between Socioeconomic Factors and Alcohol
Outcomes. Alchohol Research, 38(1):83-94.
Consol Glass. 2018. The Story of Glass. March Date of access: 27 March. 2018.
Deen, Andrew. 2017. An Introduction to Creating a Closed-Loop Supply
Chain. https://www.business2community.com/product-management/introduction-
creating-closed-loop-supply-chain-01764268 Date of access: 12 November. 2018.
Deloitte. 2014. The hidden value in Reverse Logistics Point of view. Belgium: PwC.
Devault, Gigi. 2018. Establishing Trustworthiness in Qualitative
Research. https://www.thebalancesmb.com/establishing-trustworthiness-in-qualitative-
research-2297042 Date of access: 12 November. 2018.
dos Santos, Maria Manuel Pires Afonso. 2017. Optimization of Returnable Packaging
Flows Planning. Porto: Faculdade De EngenharIa - Universidade Do Porto.
Drew, David. 2016. Promoting PET in the beer industry. Food Manufacturing
Africa:32.
Eaves, Ali. 2014. Mens Health. https://www.menshealth.com/guy-wisdom/what-your-
beer-says-about-you
Eskom SOC Ltd. 2018. Waste Recycling. Sunninghill: Eskom SOC Ltd.
Euromonitor International. 2014. Price Elasticities in Alcoholic Drinks. London:
Euromonitor International.
69
Euromonitor International. 2015. Global PET Bottles: Key Success Factors for
Beverages. England: Euromonitor International.
EvaSys. 2018. How to Effectively Carry Out a Qualitative Data
Analysis. https://www.achievability.co.uk/evasys/how-to-effectively-carry-out-a-
qualitative-data-analysis Date of access: 25 March. 2018.
Express Recycling and Sanitation. 2013. Glass Bottles — Reuse vs.
Recycling. http://expressrecyclingandsanitation.com/2013/10/09/glass-bottles-reuse-vs-
recycling/#sthash.BxOh0c2b.dpbs Date of access: 31 March. 2018.
Fieldgate, Ilse., Jeffrey, Rob., Madinane, Manqiba., Ebrahim, Yumna., Soobyah,
Luchelle. & Jotdaan, Johannes. 2013. Economic impact of advertisement ban on
alcoholic beverages for industry assosiation for responsible alcohol use. Johannesburg:
Econometrix PTY LTD.
FlashGlobal. 2017. 5 Cost-Saving Benefits of Working with Reverse Logistics
Companies. https://flashglobal.com/blog/5-cost-saving-benefits-working-reverse-
logistics-companies/ Date of access: 12 November. 2018.
Fleckenstein, Thomas. & Pihlstroem, Eirik. 2015. Returnable Packaging in the
Automotive Supply Chain From a supplier’s perspective. Jönköping: Jönköping
International Business School.
Forslund, Annelie. & Stolt, Frida. 2012. Mathematical optimization of a returnable
packaging system - minimizing the total cost of distribution using MILP. Gothenburg:
Chalmers University of Technology.
Gilgun. 2013. Coding in Deductive Qualitative
Analysis. https://www.slideshare.net/JaneGilgun/deductive-qualitative-analysis-theory-
testing Date of access: 15 March. 2018.
Glass Packaging Institute. 2018. Recycling. http://www.gpi.org/recycling/glass-
recycling-facts Date of access: 12 November. 2018.
Google Maps. 2018. Google
Maps. https://www.google.com/search?q=google+maps+brweires+in+south+africa&rlz
=1C1MSIM_enZA785ZA785&oq=google+maps+brweires+in+south+africa&aqs=chrome
.69i57j69i64l3.6263j0j4&sourceid=chrome&ie=UTF-8 Date of access: 1 Jan. 2018.
70
Google Maps. 2018. Maps. https://www.google.co.za/maps/search/consol+glass/@-
26.207477,27.9937837,11.12z Date of access: 1 Jan. 2018.
Hajimia, Hafiza. 2014. Research Method -
Sampling. https://www.slideshare.net/hafizahhajimia/research-method-sampling Date
of access: 12 November. 2018.
Hammer, Janet. & Pivo, Gary. 2016. The Triple Bottom Line and Sustainable
Economic Development Theory and Practice. Portland: Portland State University.
Holtzkampf,
Elias. 2015. SAWIS. http://www.sawis.co.za/info/download/Liquor_consumption_patte
rns_in_South_Africa_2015_eh_V1_-_final.pdf
Huebsch, Russell. 2018. Cost Leadership & Competitive
Advantage. https://smallbusiness.chron.com/cost-leadership-competitive-advantage-
35159.html Date of access: 12 November. 2018.
Institute of Alcohol Studies. 2017. How does the price of alcohol affect
consumption? http://www.ias.org.uk/Alcohol-knowledge-centre/Price/Factsheets/How-
does-the-price-of-alcohol-affect-consumption.aspx Date of access: 12 November.
2018.
International Organization for Standardization. 2018. ISO 14000 family - Environmental
management. https://www.iso.org/iso-14001-environmental-management.html Date of
access: 30 March. 2018.
Investopedia. 2018. Externality. https://www.investopedia.com/terms/e/externality.asp
Date of access: 31 March. 2018.
Kettering University. 2015. 10 common supply chain errors (and how to avoid
them). https://online.kettering.edu/news/2015/10/20/10-common-supply-chain-errors-
and-how-avoid-them Date of access: 4 March. 2018.
Kew, Janice. 2016. Beer wars: Heineken targets SAB. https://www.iol.co.za/business-
report/companies/beer-wars-heineken-targets-sab-2067898 Date of access: 25
February. 2018.
Kilroy, Dana. Sullivan. 2014. Advantages of glass bottles over plastic become
clear. http://www.chicagotribune.com/lifestyles/health/chi-glass-bottles-
advantage20140331-story.html Date of access: 8 August. 2018.
71
Knowler, Wendy. 2012. ‘Empties’ deposits and the Consumer Protection
Act. https://www.iol.co.za/dailynews/consumer/empties-deposits-and-the-consumer-
protection-act-1393089 Date of access: 12 November. 2018.
Koenig, David. 2018. How to Select Research Participants for Qualitative
Research. https://classroom.synonym.com/select-research-participants-qualitative-
research-7639438.html Date of access: 25 March. 2018.
Kulkarni, Prashant. 2013. What is triangulation of data in qualitative research? Is it a
method of validating the information collected through various
methods? https://www.researchgate.net/post/What_is_triangulation_of_data_in_qualitat
ive_research_Is_it_a_method_of_validating_the_information_collected_through_various
_methods Date of access: 9 November. 2018.
Kumar, N. Raj. & Kumar, R.M. Satheesh. 2013. Closed Loop Supply Chain
Management and Reverse Logistics -A Literature Review. International Journal of
Engineering Research and Technology, 6(4):455-468.
Kundu,
Subhash. 2017. Researchgate. https://www.researchgate.net/post/Is_literature_review
_a_qualitative_research_method Date of access: 15 March. 2018.
LC ltd. 2013. National
Laws. http://www.compliancetools.co.za/documents/contentdocuments/governmentgaz
ettewatchreports/016december2013/liquorchanges.docx Date of access: 30 March.
2018.
Lewis, Michael. 2013. 14 Ways to Reduce Materials & Cost of Goods Sold in Your
Business. https://www.moneycrashers.com/reduce-materials-cost-goods-sold/ Date of
access: 12 November. 2018.
Li, Hong., Liu, Fang., He, Xi., Cui, Yunqian. & Hao, Jianqin. 2015. A study on kinetics
of beer ageing anddevelopment of methods for predicting thetime to detection of flavour
changes in beer. J. Inst. Brew, 1(121):38-43.
Louca, Soulla. & Kokkinaki, Angelika. 2012. Closed-Loop Supply Chains in ICT: Best
Practices and Challenges in Cyprus. Journal of Green Engineering, 1(1):165-177.
Makro. 2018. Returnable Beer Bottles. https://www.makro.co.za/liquor/returnable-
beer-bottles-
72
LBF/pg1?CategoryBusinessKeys=LBF&Division=Liquor&Category4=Beer&Category3=
Returnable%20Beer%20Bottles Date of access: 27 March. 2018.
Marketline. 2016. Beer & Cider in South Africa. London: Marketline Industries.
Mavuso, Zandile. 2015. South Africa making big strides in raising glass-recycling
rate. http://www.engineeringnews.co.za/article/south-africa-making-big-strides-in-
raising-glass-recycling-rate-2015-06-12 Date of access: 3 March. 2018.
Mokolobate, Kealeboga. 2017. Effects of alcohol consumption in South Africa: From
the cradle to the grave. https://mg.co.za/article/2017-10-27-00-effects-of-alcohol-
consumption-in-south-africa-from-the-cradle-to-the-grave Date of access: 7 August.
2018.
Motsoeneng, Tiisetso., Blenkinsop, Philip. & Geller, Martinne. 2018. Beer maker AB
InBev pumps up the volume in
Africa. https://af.reuters.com/article/africaTech/idAFKCN1IN0RT-OZABS Date of
access: 12 November. 2018.
Nampak Ltd. 2016. Operational review – Glass. http://bastiongraphics.co.za/bastion-
ir/2016/Nampak-IR-2016/operational-review-glass.php Date of access: 28 March. 2018.
NWU Business School. 2018. NWU Business
School. http://www.nwu.ac.za/sites/www.nwu.ac.za/files/files/m-
faculties/School%20of%20Business/9.%20Ethical%20Clearance%20form.doc Date of
access: 12 November. 2018.
O.berk. 2016. Why are beer bottles brown? http://www.oberk.com/packaging-crash-
course/why-are-beer-bottles-brown Date of access: 27 March. 2018.
Oliver Wyman. 2014. Cutting COGS - Going beyond supplier negotiations. New York:
Oliver Wyman.
Pell Institute. 2018. Analyze Qualitative Data. http://toolkit.pellinstitute.org/evaluation-
guide/analyze/analyze-qualitative-data/ Date of access: 25 March. 2018.
PETPower. 2018. Barrier Additives for Your Bottles and
Jars. https://www.petpower.eu/en/products-materials/barrier-additives/ Date of access:
12 November. 2018.
73
Polymer Solutions News Team. 2016. Beer in Glass or Plastic? Science Solves One
Great Mystery of Our Age. https://www.polymersolutions.com/blog/why-is-beer-not-in-
plastic-bottles/ Date of access: 5 August. 2018.
Reed, Anton. 2018. Changing Alcohol
Demand. http://econ272.academic.wlu.edu/term-paper/changing-alcohol-
demand/ Date of access: 31 March. 2018.
Rucker, Mike. 2016. 3 Straighforward Methods for Anlysizing Qualitative Inerview
Data. https://unstick.me/3-straightforward-methods-for-analyzing-qualitative-interview-
data/ Date of access: 15 March. 2018.
SABMiller plc. 2016. Annual Report. Surrey: SAB.
Sagepub. 2018. Chapter 4 - Ethical Issues in Qualitative
Research. https://uk.sagepub.com/sites/default/files/upm-binaries/27011_4.pdf Date of
access: 25 March. 2018.
Scolari, Elizabeth. 2018. Pros & Cons of Third Party Logistics For
Manufacturers. https://www.handshake.com/blog/third-party-logistics/ Date of access:
7 August. 2018.
Shaw, Randy. 2018. Tapping the Cost & Sustainability Benefits of Reusable
Distribution Packaging. https://www.assemblies.com/reusable-packaging/ Date of
access: 12 November. 2018.
Slater, Dylan. 2017. Volume of recycled glass almost doubled in past financial
year. http://www.engineeringnews.co.za/article/volume-of-recycled-glass-almost-
doubles-in-past-financial-year-2017-08-04 Date of access: 3 March. 2018.
Soman, Rahul. & Raman, Meera. 2016. HACCP system - hazard analysis and
assessment, based on ISO. Food Control, 69(1):191-195.
South African Market Insights. 2016. South Africa's Consumers Spending
Patterns. https://www.southafricanmi.com/sa-consumer-spending-patterns.html Date
of access: 30 March. 2018.
South African National Treasury. 2017. Draft Carbon Tax Bill. Pretoria: South African
National Treasury.
74
Spacey, John. 2016. What is Structure Follows
Strategy? https://simplicable.com/new/structure-follows-strategy Date of access: 3
August. 2018.
Swinnen, Johan. & Colen, Liesbeth. 2016. Economic Growth, Globalisation and Beer
Consumption. Journal of Agricultural Economics, 67(1):186-267.
The Glass Recycling Company. 2016. Annual review 2015/16. Bryanston: The Glass
Recycling Company.
Thompson, Arthur. A., Sutton, Ciara., Peteraf, Margaret. A., Strickland III, A. J., Janes,
Alex. & Gamble, John. E. 2017. Crafting and Executing Stratgey. Second ed. London:
McGraw Hill.
Trading Economics. 2018. South Africa GDP Annual Growth
Rate. https://tradingeconomics.com/south-africa/gdp-growth-annual Date of access: 4
March. 2018.
van Walbeek, Corne. & Blecher, Evan. 2013. The Economics of Alcohol use, Misuse
and Policy in South Africa. Johannesburg: WHO.
Venkatesh, V.G., Punjabi, Lavesh., Gupta, Vikash., Patil, Sandeep. & Kadam,
Rakesh. 2015. Returnable Container Collection Process in Reverse Supply Chain
Operations: A Case Study of an Indian Distillery Company. Nashik: ReseachGate.
Vivier, Tyler. Leigh. 2018. 9 Facts you might not know about returnable glass bottles in
South Africa. https://www.goodthingsguy.com/environment/facts-returnable-
bottles/ Date of access: 6 August. 2018.
Vrellas, Charisis. G. & Tsiotras, George. D. 2015. Quality management in the global
brewing industry. International Journal of Quality & Reliability Management, 32(1):42-
52.
Waters, Dr. Janet. 2017. Interview Guideline. https://www.capilanou.ca/programs-
courses/psychology/student-resources/research-guidelines/Interview-Guidelines/ Date
of access: 25 March. 2018.
Wazimap. 2016. South Africa. https://wazimap.co.za/profiles/country-ZA-south-
africa/ Date of access: 30 March. 2018.
Whyle, Sebastian. 2016. Glass recycling and reuse of returnable bottles reduce glass
at landfill. http://www.engineeringnews.co.za/article/glass-recycling-and-reuse-of-
75
returnable-bottles-reduces-glass-in-landfill-2016-08-19/rep_id:4136 Date of access: 3
March. 2018.
Wickstrom, Rick. 2015. Advantages of Using a Third Party Logistics Provider
(3PL). https://www.linkedin.com/pulse/advantages-using-third-party-logistics-provider-
3pl-rick-wickstrom Date of access: 7 August. 2018.
World Wildlife Foundation. 2017. PC2017: Thinking differently and inspired action on
waste. http://www.wwf.org.za/?21801/LPC2017-Thinking-differently-and-inspired-
action-on-waste Date of access: 4 March. 2018.
Wyman, Oliver. 2014. Cutting COGS. https://www.oliverwyman.de/content/dam/oliver-
wyman/global/en/2014/jul/201408_OW_Cutting%20COGS_ENG.PDF Date of access:
12 November. 2018.
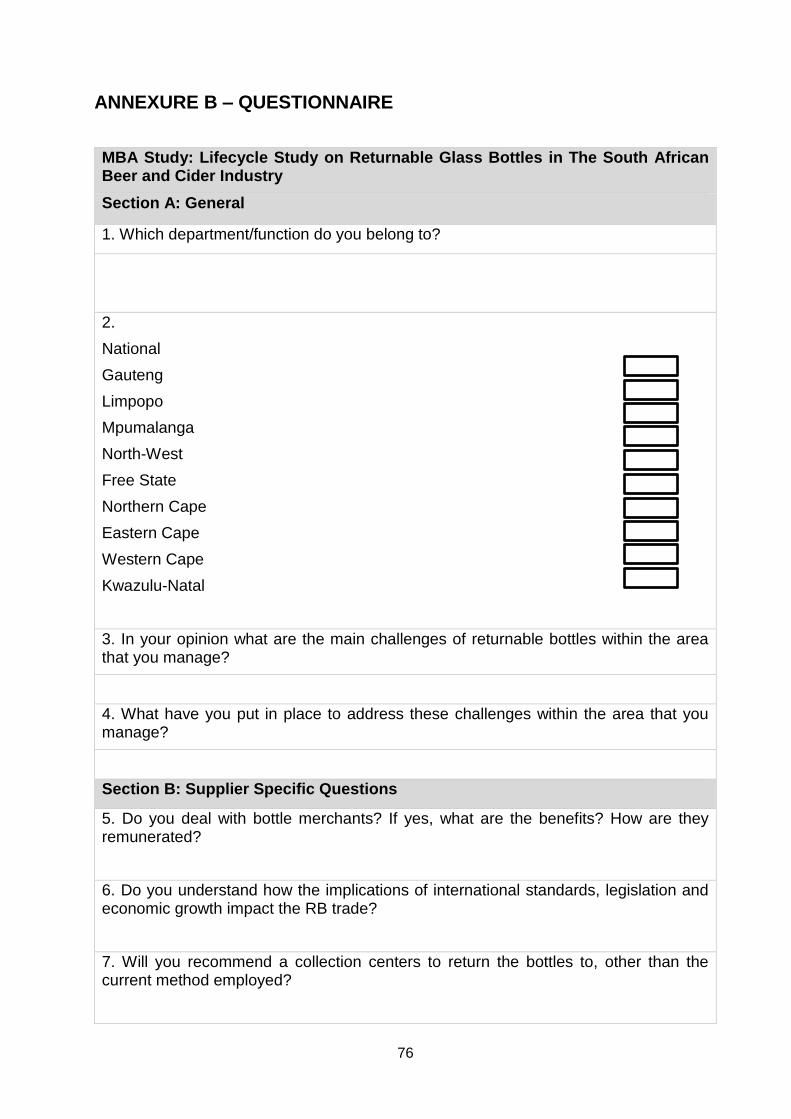
76
ANNEXURE B – QUESTIONNAIRE
MBA Study: Lifecycle Study on Returnable Glass Bottles in The South African Beer and Cider Industry
Section A: General
1. Which department/function do you belong to?
2.
National
Gauteng
Limpopo
Mpumalanga
North-West
Free State
Northern Cape
Eastern Cape
Western Cape
Kwazulu-Natal
3. In your opinion what are the main challenges of returnable bottles within the area that you manage?
4. What have you put in place to address these challenges within the area that you manage?
Section B: Supplier Specific Questions
5. Do you deal with bottle merchants? If yes, what are the benefits? How are they remunerated?
6. Do you understand how the implications of international standards, legislation and economic growth impact the RB trade?
7. Will you recommend a collection centers to return the bottles to, other than the current method employed?
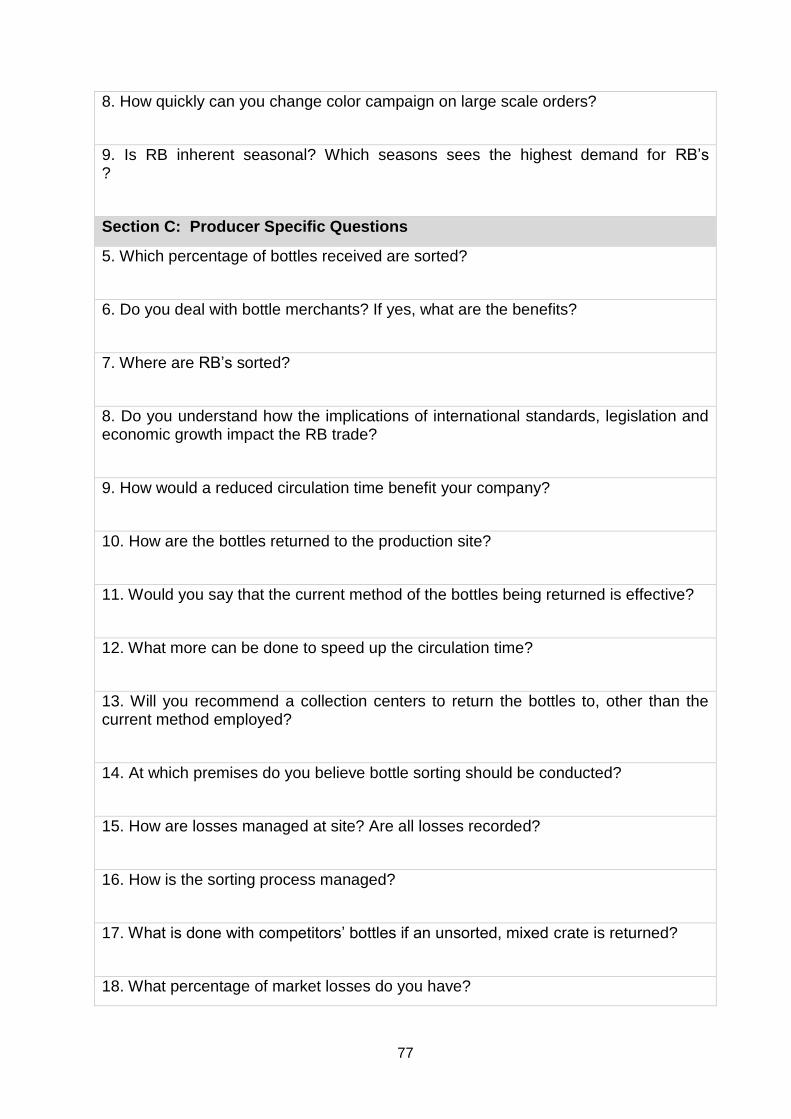
77
8. How quickly can you change color campaign on large scale orders?
9. Is RB inherent seasonal? Which seasons sees the highest demand for RB’s ?
Section C: Producer Specific Questions
5. Which percentage of bottles received are sorted?
6. Do you deal with bottle merchants? If yes, what are the benefits?
7. Where are RB’s sorted?
8. Do you understand how the implications of international standards, legislation and economic growth impact the RB trade?
9. How would a reduced circulation time benefit your company?
10. How are the bottles returned to the production site?
11. Would you say that the current method of the bottles being returned is effective?
12. What more can be done to speed up the circulation time?
13. Will you recommend a collection centers to return the bottles to, other than the current method employed?
14. At which premises do you believe bottle sorting should be conducted?
15. How are losses managed at site? Are all losses recorded?
16. How is the sorting process managed?
17. What is done with competitors’ bottles if an unsorted, mixed crate is returned?
18. What percentage of market losses do you have?
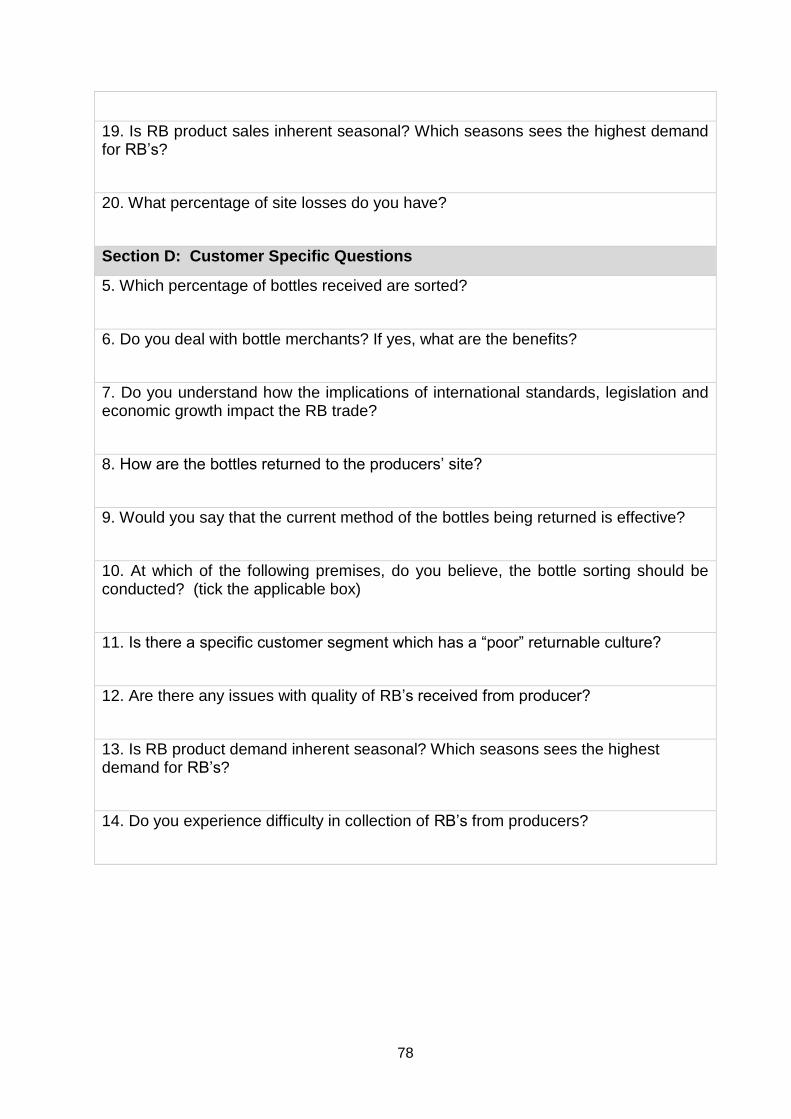
78
19. Is RB product sales inherent seasonal? Which seasons sees the highest demand for RB’s?
20. What percentage of site losses do you have?
Section D: Customer Specific Questions
5. Which percentage of bottles received are sorted?
6. Do you deal with bottle merchants? If yes, what are the benefits?
7. Do you understand how the implications of international standards, legislation and economic growth impact the RB trade?
8. How are the bottles returned to the producers’ site?
9. Would you say that the current method of the bottles being returned is effective?
10. At which of the following premises, do you believe, the bottle sorting should be conducted? (tick the applicable box)
11. Is there a specific customer segment which has a “poor” returnable culture?
12. Are there any issues with quality of RB’s received from producer?
13. Is RB product demand inherent seasonal? Which seasons sees the highest demand for RB’s?
14. Do you experience difficulty in collection of RB’s from producers?
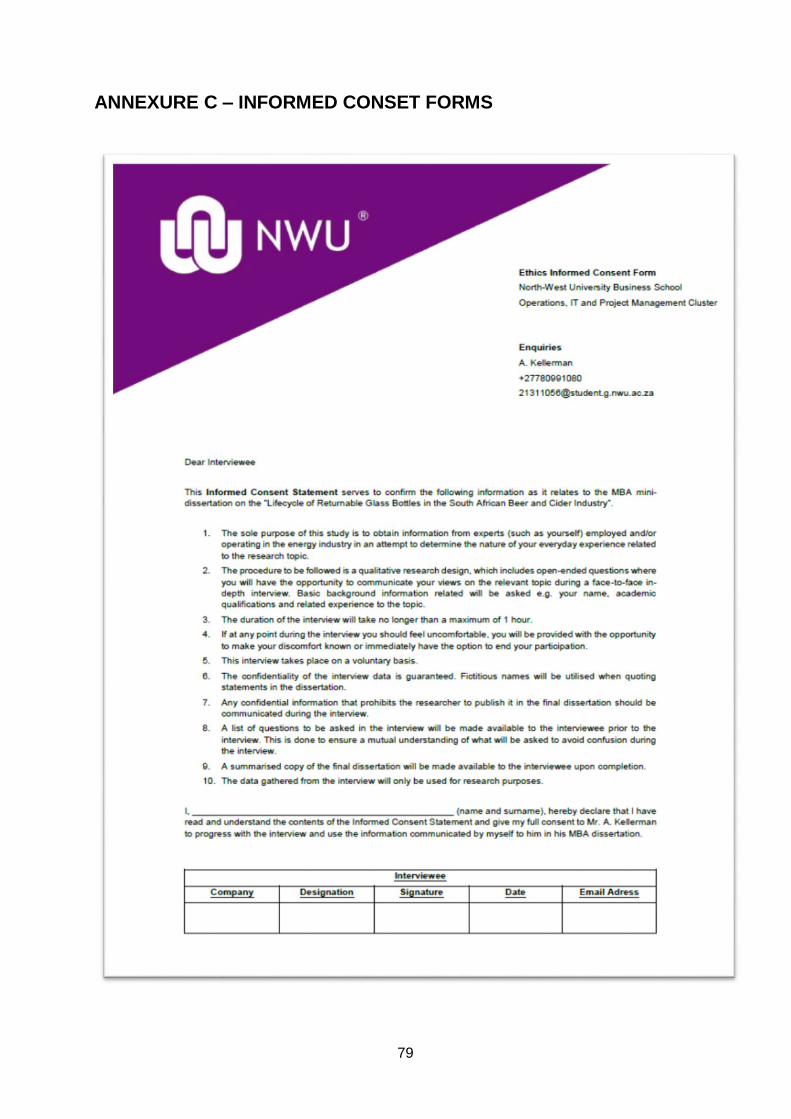
79
ANNEXURE C – INFORMED CONSET FORMS