LIFE CYCLE GREENHOUS E GAS PERSPECTIVE ON EXPORTING ... · • How does exported liquefied natural...
54
LIFE CYCLE GREENHOUSE GAS PERSPECTIVE ON EXPORTING LIQUEFIED NATURAL GAS FROM THE UNITED STATES: 2019 UPDATE SELINA ROMAN-WHITE, SRIJANA RAI, JAMES LITTLEFIELD, GREGORY COONEY, TIMOTHY J. SKONE, P.E. September 12, 2019 DOE/NETL-2019/2041
Transcript of LIFE CYCLE GREENHOUS E GAS PERSPECTIVE ON EXPORTING ... · • How does exported liquefied natural...

LIFE CYCLE GREENHOUSE GAS PERSPECTIVE ON EXPORTING LIQUEFIED NATURAL GAS FROM THE UNITED STATES: 2019 UPDATE SELINA ROMAN-WHITE, SRIJANA RAI, JAMES LITTLEFIELD, GREGORY COONEY, TIMOTHY J. SKONE, P.E.
September 12, 2019
DOE/NETL-2019/2041

Disclaimer This report was prepared as an account of work sponsored by an agency of the United States Government. Neither the United States Government nor any agency thereof, nor any of their employees, makes any warranty, express or implied, or assumes any legal liability or responsibility for the accuracy, completeness, or usefulness of any information, apparatus, product, or process disclosed, or represents that its use would not infringe privately owned rights. Reference therein to any specific commercial product, process, or service by trade name, trademark, manufacturer, or otherwise does not necessarily constitute or imply its endorsement, recommendation, or favoring by the United States Government or any agency thereof. The views and opinions of authors expressed therein do not necessarily state or reflect those of the United States Government or any agency thereof. All images in this report were created by NETL, unless otherwise noted.

Authors Selina Roman-White,1 Srijana Rai,1 James Littlefield,1 Gregory Cooney,1 Timothy J. Skone, P.E.2* 1KeyLogic, Mission Execution and Strategic Analysis (MESA)
2National Energy Technology Laboratory (NETL) *Corresponding contact: [email protected], 412-386-4495
Suggested Citation: S. Roman-White, S. Rai, J. Littlefield, G. Cooney, T. J. Skone, "Life Cycle Greenhouse Gas Perspective on Exporting Liquefied Natural Gas from the United States: 2019 Update," National Energy Technology Laboratory, Pittsburgh, September 12, 2019. Acknowledgements: The authors would like to thank Don Remson2 and Joe Marriott1 for their overall guidance and review of draft versions of this report. This report was prepared by Energy Sector Planning and Analysis (ESPA) for the United States Department of Energy (DOE), NETL, completed under DOE NETL Contract Number DE-FE0004001. This work was performed under ESPA Task 150.08.02. This report was updated by MESA for the U.S. DOE NETL, completed under DOE NETL Contract Number DE-FE0025912. This work was performed under MESA Activity 203.006.011.

This page intentionally left blank.

LIFE CYCLE GHG PERSPECTIVE ON EXPORTING LNG FROM THE U.S. 2019 UPDATE
i
TABLE OF CONTENTS List of Exhibits .................................................................................................................................. ii Acronyms and Abbreviations ..................................................................................................... iii 1 Introduction ............................................................................................................................ 1 2 LCA Approach ...................................................................................................................... 2 3 Natural Gas Modeling Approach ....................................................................................... 4 4 Coal Modeling Approach ................................................................................................... 6 5 Key Modeling Parameters ................................................................................................... 8
5.1 Upstream Natural Gas ................................................................................................... 8 5.2 LNG Supply Segment................................................................................................... 14 5.3 Coal Upstream ............................................................................................................. 18 5.4 Power Plant and Transmission & Distribution ............................................................ 19
6 Results ................................................................................................................................... 20 7 Summary and Study Limitations ........................................................................................ 32 8 References ........................................................................................................................... 33 Appendix A: Life Cycle Results …………………………...……………………………………… A-1 Appendix B: Unit Process Descriptions ………………………………………………………….. B-1
B. 1 Liquefaction …………………………………………………………………………….… B-1 B. 2 Loading and Unloading …………..………………………………………………….… B-1 B. 3 Ocean Transport …………..…………………………………………………………..… B-2 B. 4 Regasification …………..……………………………………………………..…………. B-3
Appendix C: Flow Diagrams ……………………………………………………………………... C-1 C. 1 U.S./Regional Liquefied Natural Gas ………………………………………………… C-1 C. 2 Russian Natural Gas …………………………………………………………………….. C-1 C. 3 Regional Coal ……………………………………………………………………………. C-2
Appendix D: References ……………………………………………………………………......... D-1

LIFE CYCLE GHG PERSPECTIVE ON EXPORTING LNG FROM THE U.S. 2019 UPDATE
ii
LIST OF EXHIBITS Exhibit 2-1. IPCC AR5 GWPs ......................................................................................................... 3 Exhibit 5-1. Key Parameters for Natural Gas Production ....................................................... 10 Exhibit 5-2. Key Parameters for Natural Gas Gathering and Boosting* .............................. 11 Exhibit 5-3. Key Parameters for Natural Gas Processing ........................................................ 12 Exhibit 5-4. Key Parameters for Natural Gas Transmission, Storage, and Transmission
Pipelines .................................................................................................................... 12 Exhibit 5-5. Stage Scaling Parameters ..................................................................................... 13 Exhibit 5-6. Key Modeling Parameters for Natural Gas Export – Russian Cases ................. 14 Exhibit 5-7. Key Modeling Parameters for Liquefaction ........................................................ 16 Exhibit 5-8. Key Modeling Parameters for Loading/Unloading ............................................ 16 Exhibit 5-9. Key Modeling Parameters for Ocean Transport ................................................. 17 Exhibit 5-10. Ocean Transport Distances – LNG scenarios .................................................... 18 Exhibit 5-11. Key Modeling Parameters for Regasification.................................................... 18 Exhibit 5-12. Key Modeling Parameters for Coal Upstream .................................................. 19 Exhibit 5-13. Key Modeling Parameters for Power Plant and Transmission & Distribution
(All Scenarios) ......................................................................................................... 19 Exhibit 6-1. Life Cycle GHG Emissions for Natural Gas and Coal Power in Europe ........... 20 Exhibit 6-2. Life Cycle GHG Emissions for Natural Gas and Coal Power in Asia ................. 21 Exhibit 6-3. Speciated Life Cycle GHG Emissions of Natural Gas Power – U.S. LNG to
Rotterdam Scenario ............................................................................................... 23 Exhibit 6-4. Speciated Life Cycle GHG Emissions of Natural Gas Power – Russian NG to
Rotterdam Scenario ............................................................................................... 23 Exhibit 6-5. Speciated Life Cycle GHG Emissions of Coal Power ......................................... 24 Exhibit 6-6. 100-yr GWP Comparison of Coal and Natural Gas Power in Europe and Asia
................................................................................................................................... 25 Exhibit 6-7. 20-yr GWP Comparison of Coal and Natural Gas Power in Europe and Asia 25 Exhibit 6-8. Coal and Natural Gas Breakeven for U.S. LNG and Russian Natural Gas
Scenarios .................................................................................................................. 27 Exhibit 6-9. Coal and Natural Gas Breakeven for U.S. LNG and Russian Natural Gas
Scenarios (100-yr GWP) .......................................................................................... 28 Exhibit 6-10. Coal and Natural Gas Breakeven for U.S. LNG and Russian Natural Gas
Scenarios (20-yr GWP) ......................................................................................... 28 Exhibit 6-11. Uncertainty Tornado LNG – U.S. LNG (New Orleans) to Rotterdam,
Netherlands ............................................................................................................ 29 Exhibit 6-12. Uncertainty Tornado LNG – Oran, Algeria to Rotterdam, Netherlands ........ 30 Exhibit 6-13. Uncertainty Tornado LNG – U.S. LNG (New Orleans) to Shanghai, China .... 30 Exhibit 6-14. Uncertainty Tornado LNG – Darwin, Australia to Shanghai, China ................ 30 Exhibit 6-15. Uncertainty Tornado Russian NG – Yamal, Russia to Rotterdam, Netherlands
.................................................................................................................................. 31 Exhibit 6-16. Uncertainty Tornado Russian NG – Yamal, Russia to Shanghai, China ......... 31 Exhibit 6-17. Uncertainty Tornado Coal – Europe and Asia Regional Production ............. 31

LIFE CYCLE GHG PERSPECTIVE ON EXPORTING LNG FROM THE U.S. 2019 UPDATE
iii
ACRONYMS AND ABBREVIATIONS AGR Acid gas removal AR5 Fifth assessment report AU Australia BOG Boil-off gas BOR Boil-off rate Btu British thermal unit C3MR Propane pre-cooled mixed
refrigerant CH4 Methane CN China CO2 Carbon dioxide CO2e Carbon dioxide equivalent DOE Department of Energy DZ Algeria ECF Energy conversion facility EIA Energy Information
Administration EPA Environmental Protection
Agency EU End use GHG Greenhouse gas GHGI Inventory of U.S. greenhouse
gas emissions and sinks GHGRP Greenhouse Gas Reporting
Program GWP Global warming potential H2S Hydrogen sulfide HHC Heavy hydrocarbon removal HRSG Heat recovery steam
generator I-6 Illinois No. 6 IPCC Intergovernmental Panel on
Climate Change kg Kilogram kJ Kilojoule kW Kilowatt
km Kilometer kWh Kilowatt hour lb Pound LC Life cycle LCA Life cycle analysis LNG Liquefied natural gas m3 Cubic meter Mcf Thousand cubic feet MESA Mission Execution and Strategic
Analysis MJ Megajoule MPa Megapascal MWh Megawatt-hour N2O Nitrous oxide NETL National Energy Technology
Laboratory NG Natural gas NL Netherlands ORV Open rack vaporization ppmv Parts per million volume PRB Powder River Basin psig Pounds per square inch of
gauge pressure PT Product transport RMA Raw material acquisition RMT Raw material transport RU Russia scf Standard cubic foot SF6 Sulfur hexafluoride T&D Transport and distribution Tcf Trillion cubic feet U.S. United States ULSD Ultra low sulfur diesel UP Unit process yr Year

This page intentionally left blank.

LIFE CYCLE GHG PERSPECTIVE ON EXPORTING LNG FROM THE U.S. 2019 UPDATE
1
1 INTRODUCTION This analysis calculates the life cycle greenhouse gas (GHG) emissions from imported natural gas and regional coal power in Europe and Asia. The primary research questions are as follows:
• How does exported liquefied natural gas (LNG) from the United States (U.S.) compare with regional coal (or other LNG sources) for electric power generation in European and Asian markets from a life cycle GHG perspective?
• How do those results compare with natural gas from Russia that is delivered via pipeline to the same European and Asian markets?
The National Energy Technology Laboratory (NETL) employed its characterization of an upstream natural gas production life cycle analysis (LCA) model to represent unconventional natural gas production and transportation to a Gulf Coast (New Orleans) liquefaction facility (NETL, 2019). An updated LCA model of the remaining LNG supply chain was used to represent the liquefaction, transport, and regasification of LNG exported to terminals in Rotterdam, Netherlands (European market representation) and Shanghai, China (Asian market representation). LNG from Oran, Algeria was modeled to represent an alternative regional source of LNG for European markets. LNG from Darwin, Australia was modeled to represent an alternative regional source of LNG for Asian markets. Conventional natural gas extracted from the Yamal region of Siberia in Russia was modeled as the regional pipeline gas alternative for both European and Asian markets. Regional coal production and consumption (e.g., Germany and China) was also modeled. Scenarios were handled using a parametric model that accounted for variability in supply chain characteristics and power plant efficiencies.
This analysis is based on data developed to represent U.S. natural gas production and LNG export and European/Asian import. The NETL natural gas and coal LCA models were adapted to represent the upstream portions of this study (NETL, 2010b; NETL, 2010c; NETL, 2012; NETL, 2019). U.S. natural gas production and average U.S. coal production were modeled as representative of foreign natural gas and coal production. No ocean transport of coal was included to represent the most conservative coal profile (regionally sourced or imported). The specific LNG export/import locations used in this study were chosen to represent an estimate for a region. The specific locations were required to allow for the estimation of LNG transport distances and do not imply the likelihood that LNG export or import will occur from that exact location. The same assumptions hold true for the Russian natural gas cases.
This analysis is an update of the 2014 LNG report (NETL, 2014b). Some aspects of the analysis structure remained the same, though the following updates were made to the prior analysis:
• Incorporation of the updated NETL characterization of upstream natural gas production (NETL, 2019)
• Updated unit processes for liquefaction, ocean transport, and regasification characterization
• Updated 100-year global warming potential for methane to reflect current IPCC, AR5 100-year time period

LIFE CYCLE GHG PERSPECTIVE ON EXPORTING LNG FROM THE U.S. 2019 UPDATE
2
2 LCA APPROACH This analysis is a cradle-to-grave LCA that begins with extraction of natural gas or coal and ends with electricity delivered to the consumer. NETL uses five life cycle (LC) stages, beginning with the acquisition of raw materials and ending with energy consumption. These five life cycle stages are listed below:
• LC Stage 1: Raw Material Acquisition (RMA) includes extraction of a natural resource and any necessary processing steps that prepare it for transport. The raw materials of this analysis are natural gas and coal.
• LC Stage 2: Raw Material Transport (RMT) includes the transport of a raw material between the extraction site and power plant. Natural gas is transported by pipeline and ocean tanker for the LNG cases and pipeline only for the Russian natural gas cases; coal is transported by rail.
• LC Stage 3: Energy Conversion Facility (ECF) includes the operation of a power plant that converts fuel to energy. The power plants of this analysis convert natural gas or coal to electricity. The handling and disposal of coal waste products are outside of the boundary of this analysis and are assumed to have minimal GHG emissions relative to the other processes considered in this analysis.
• LC Stage 4: Product Transport (PT) moves the product from the ECF to the consumer. In this analysis, electricity is transported over a national electricity grid.
• LC Stage 5: End Use (EU) represents the final consumption of a product. This stage serves to anchor the supply chain to the functional unit of 1 MWh of electricity. For the purpose of this study, this stage has no emissions associated with it.
Four scenarios are modeled in this analysis for two different geographies (Europe and Asia)1:
• Scenario 1: Natural gas is extracted in the United States from Appalachian Shale, transported by pipeline to an LNG facility where it is compressed and loaded onto an LNG tanker, transported to an LNG port in the receiving country (Rotterdam for Europe, Shanghai for Asia) where it is regasified, and then transported to a natural gas power plant. It was assumed that the power plant is located near the LNG import site.
• Scenario 2: Same supply chain as Scenario 1, but the source of natural gas is regional relative to the destination (Algeria for Europe, Australia for Asia). It was assumed that the regional gas is produced using conventional extraction methods. The LNG tanker transport distance is adjusted accordingly.
• Scenario 3: Natural gas is produced in the Siberian region of Russia utilizing conventional extraction methods and is transported by pipeline to a power plant in Europe or Asia.
• Scenario 4: Coal is extracted in the region of study (Europe or Asia) and transported by rail to a domestic coal-fired power plant in China or Germany. This analysis models both
1 The goal of this analysis is to model plausible (medium and long-distance) export scenarios while also considering regional fuel alternatives. The purpose of the medium and long-distance scenarios is to establish low and high bounds for likely results.

LIFE CYCLE GHG PERSPECTIVE ON EXPORTING LNG FROM THE U.S. 2019 UPDATE
3
surface sub-bituminous and underground bituminous coals based on U.S. extraction data.
In all four scenarios, electricity is delivered to end users via existing electricity transmission and distribution infrastructure. The functional unit, which serves as a basis for comparison, is 1 megawatt-hour (MWh) of electricity delivered to a consumer. The results of this analysis include only GHG emissions. GHGs in this inventory are reported on the common mass basis of carbon dioxide equivalents (CO2e) using the global warming potentials (GWPs) of each gas from the 2013 Intergovernmental Panel on Climate Change (IPCC) Fifth Assessment Report (AR5) (IPCC, 2013)2. The 100-yr GWP is the default timeframe used, though some exhibits display the 20-year timeframe as well. Exhibit 2-1 shows the GWPs used for the GHGs inventoried in this study (IPCC, 2013).
Exhibit 2-1. IPCC AR5 GWPs
GHG
AR5 (IPCC, 2013)
20-yr 100-yr
(Default)
CO2 1 1
CH4 87 36
N2O 268 298
SF6 17,500 23,500
2 Table 8.7 in IPCC AR5 gives the GWPs on a 20 and 100-year time frame that includes climate-carbon feedback, but in the case of methane it does not include CO2 from methane oxidation and mentions that values for fossil methane are higher by 1 and 2 for 20 and 100-year metrics respectively, hence the values of 87 and 36 are used in this report.

LIFE CYCLE GHG PERSPECTIVE ON EXPORTING LNG FROM THE U.S. 2019 UPDATE
4
3 NATURAL GAS MODELING APPROACH NETL’s natural gas model uses a comprehensive set of parameters within a flexible network of unit processes, allowing the modeling of different sources of natural gas. Key variables include lifetime well production rates, emission factors for episodic emissions (e.g., completions and workovers), flaring rates at extraction and processing, workover and liquid unloading frequency, and pipeline distance. The model is run with 30 scenarios, including 27 onshore scenarios that span 14 production basins. Five types of extraction technologies are considered: conventional, coalbed methane, shale, tight, and associated gas. For additional details on the natural gas model, refer to the Life Cycle Analysis of Natural Gas Extraction and Power Generation (NETL, 2019). For Scenario 1 of this analysis, natural gas is modeled as unconventional gas from the Appalachian Shale (one of the 30 upstream natural gas scenarios found in the NETL 2019 work). For the purposes of this analysis, Appalachian Shale gas was used as a proxy for new unconventional natural gas production. Additionally, U.S. onshore conventional gas serves as a proxy for the regional LNG supply options (Algeria for Europe and Australia for Asia) and extraction in Siberia for pipeline transport to the demand centers. U.S. onshore conventional gas is represented by a U.S. conventional production-weighted average of the 9 upstream conventional scenarios (out of the 30 total upstream scenarios found in the NETL 2019 work).
In all three natural gas scenarios for this analysis, the extracted and processed natural gas is transported via pipeline, either to an LNG terminal (Scenario 1 and Scenario 2) or directly to a power plant (Scenario 3). The transmission of natural gas by pipeline involves the combustion of a portion of the natural gas in compressors, intentional venting, and fugitive losses of natural gas. For Scenario 1 and Scenario 2, the pipeline distance from natural gas extraction site to the LNG terminal is 971 km. This is the average distance of natural gas pipeline transmission in the United States (NETL, 2019). This distance is based on the characteristics of the entire transmission network and delivery rate for natural gas in the United States. Note, the same pipeline distance is used for both the U.S. and regional LNG scenarios. This simplification was used to focus on the differences in life cycle GHG emissions from transport of the LNG.
NETL’s model captures the LNG supply chain in the following manner: after extraction and processing, natural gas is transported by pipeline to a liquefaction facility. The LNG is then liquified and loaded onto an ocean tanker, transported to an LNG terminal with regasification operations, regasified and then fed to a pipeline that transports it to a power plant. The data for the LNG supply chain accounts for the construction and operation of LNG infrastructure (NETL, 2010a; NETL, 2013b; NETL, 2013c). For this analysis, it was assumed that the natural gas power plant in each of the import destinations is located close to the LNG port, so no additional pipeline transport of natural gas is modeled in the destination country. This analysis assumes the power plant is existing infrastructure and thus does not account for the construction impacts of building the power plant.
For the U.S. (New Orleans) export options, the Panama Canal is a viable option for all ship capacities (150,000 – 180,000 m3) (IGU, 2017). All other routes are assumed to be able to accommodate these ship sizes as well. The distances used for LNG transport are available in Section 5.
LIFE CYCLE GHG PERSPECTIVE ON EXPORTING LNG FROM THE U.S. 2019 UPDATE
5
For Scenario 3, the pipeline distance was calculated based on the great circle distance between the Yamal district of Siberia, Russia, to a power plant located in Rotterdam, Netherlands, or Shanghai, China. Yamal was chosen as the extraction site because that region accounted for 82.6 percent of Russian natural gas production in 2012 (EIA, 2013a; EIA, 2013b). The great circle distance is the shortest possible distance between two points on a sphere and was, therefore, used to represent the shortest possible pipeline distance between the extraction source and the power plant. An additional 1,000 km of pipeline transport was added to the great circle distance to adjust it to the expected pipeline transport distance. Given the extensive pipeline networks in Europe and Asia, determining an actual distance was not possible. This assumption is tested in the uncertainty analysis section of this analysis. The distances used for pipeline transport of Russian gas are available in Section 5.
The efficiency of the destination power plant is an important parameter required for determining the life cycle emissions for natural gas power. Average baseload natural gas-fired power plants in the United States have a net efficiency of 46.4 percent (NETL, 2019). This analysis uses the range of efficiencies that are consistent with the NETL modeling of natural gas power in the United States (NETL, 2019). This analysis assumed the same range of power plant efficiencies in the destination countries as was used for the U.S. model. The efficiency range is designed to be representative of fleet baseload power plants.
The transmission of electricity from the power plant to consumer incurs a 7 percent loss of electricity (NETL, 2013a). The consumption of electricity does not have any energy or material flows. A comprehensive list of the modeling parameters and values for the natural gas scenarios are provided in Section 5.

LIFE CYCLE GHG PERSPECTIVE ON EXPORTING LNG FROM THE U.S. 2019 UPDATE
6
4 COAL MODELING APPROACH This analysis uses NETL’s existing LCA model for the extraction and transport of sub-bituminous and bituminous coal in the United States as a proxy for foreign extraction in Germany and China. Foreign coal production was modeled as having emissions characteristics equivalent to average U.S. coal production.
Raw material extraction for coal incorporates extraction profiles for coal derived from the Powder River Basin (PRB), where sub-bituminous, low-rank coal is extracted from thick coal seams (up to approximately 180 feet) via surface mines located in Montana and Wyoming, and coal derived from the Illinois No. 6 (I-6) coal seam, where bituminous coal is extracted via underground longwall and continuous mining. In general, PRB represents coal from surface mining sources, and I-6 coal represents coal from underground sources. The regionally extracted coal is transported to the power plant by rail in both the European and Asian cases. The expected rail distance for both locations is 725 miles, modeled with uncertainty bounds of 500 miles.
PRB coal is modeled using modern mining methods at the following mines: Peabody Energy’s North Antelope-Rochelle mine (97.5 million short tons produced in 2008); Arch Coal, Inc.’s Black Thunder Mine (88.5 million short tons produced in 2008); Rio Tinto Energy America’s Jacobs Ranch (42.1 million short tons produced in 2008); and Cordero Rojo Operation (40.0 million short tons produced in 2008). These four mines were the largest surface mines in the United States in 2008 according to the National Mining Association’s 2008 Coal Producer Survey (NMA, 2009). For the purposes of this assessment, it is assumed that the coal seam in the area of active mining was previously drilled to extract methane. Based on the NETL Quality Guidelines for Energy Systems Studies: Methane Emissions from Mining Powder River Basin Coals and Quality Guidelines for Energy Systems Studies: Detailed Coal Specifications, this analysis uses a factor of 8 scf/ton for coal bed methane emissions for surface mining of PRB coal and a higher heating value of 8,564 Btu/lb (NETL, 2010b; NETL, 2012).
I-6 coal is part of the Herrin Coal seam and is a bituminous coal that is found in seams in the southern and eastern regions of Illinois and surrounding areas that typically range from about 2 to 15 feet in thickness. I-6 coal is commonly extracted via underground mining techniques, including continuous and longwall mining. I-6 coal seams may contain relatively high levels of mineral sediments or other materials, and, therefore, require coal cleaning (beneficiation) at the mine site. During the acquisition of I-6 coal, methane is released during both the underground coal extraction and the post-mining coal preparation activities. Based on the NETL Quality Guidelines for Energy Systems Studies: Methane Emissions from Mining Illinois Basin Coals and Quality Guidelines for Energy Systems Studies: Detailed Coal Specifications, this analysis uses a factor of 360 scf/ton for coal bed methane emissions for underground mining of I-6 coal and a higher heating value of 11,666 Btu/lb (NETL, 2010c; NETL, 2012).
The heating value of coal and the heat rate of the power plant were used to determine the feed rate of coal to the power plant. Average baseload coal-fired power plants in the United States have a net efficiency of 33.0 percent (NETL, 2014a). For consistency, this analysis utilized the range of efficiencies that were previously used for the modeling of coal power in the United

LIFE CYCLE GHG PERSPECTIVE ON EXPORTING LNG FROM THE U.S. 2019 UPDATE
7
States (NETL, 2014a). This analysis assumed the same range of power plant efficiencies for Europe and Asia as the U.S. model. The efficiency range is designed to be representative of fleet baseload power plants.
Electricity transmission and consumption is modeled using the same data used by the natural gas power scenario. The transmission of electricity from the power plant to consumer incurs a 7 percent loss of electricity (NETL, 2013a). The consumption of electricity does not have any energy or material flows. A comprehensive list of the modeling parameters and values for the coal scenarios are provided in Section 5.

LIFE CYCLE GHG PERSPECTIVE ON EXPORTING LNG FROM THE U.S. 2019 UPDATE
8
5 KEY MODELING PARAMETERS The following sections detail the key modeling parameters used to model natural gas and coal. For a full report on the modeling of upstream natural gas, reference the Life Cycle Analysis of Natural Gas Extraction and Power Generation (NETL, 2019). For additional information on the modeling of downstream natural gas, reference Appendix B. For additional information on the modeling of coal, reference the multiple works cited in Section 4 of this report.
5.1 UPSTREAM NATURAL GAS When the end use of natural gas is a power plant, there are four key steps in the supply chain:
• Production: A natural gas production site has a well pad that holds permanent equipment and provides room for development and maintenance activities. The construction of natural gas wells requires a well casing that provides strength to the well bore and prevents contamination of the geological formations that surround the gas reservoir. Well completions are the activities following well drilling and preceding production and, in the case of unconventional wells, involve the injection and flowback of water to stimulate production. Liquids unloading is an intermittent emission from wells that are affected by wellbore fluid accumulation. Other sources of emissions include the gas vented from pneumatically controlled devices and fugitive emissions from flanges, connectors, open-ended lines, and valves. When vapor recovery units are feasible, vented gas is captured and flared; otherwise, vented gas is released to the atmosphere. Production operations also include the combustion of natural gas by reciprocating engines that drive compressors, as well as combustion of natural gas and diesel to provide heat and energy for other supporting equipment.
• Gathering and Boosting: Natural gas gathering and boosting networks receive natural gas from multiple wells and transport it to processing or transmission facilities. Gathering and boosting sites include acid gas removal (AGR), dehydration, compressors operations, pneumatic devices and pumps.
• Processing: A natural gas processing facility removes impurities from natural gas, which improves its heating value and prepares it for pipeline transmission. Natural gas processing facilities include AGR, dehydration, hydrocarbon liquids removal, and compression operations. When feasible, vapor recovery units capture vented gas and send it to flares. The size and complexity of processing plants are variable; in some cases, processing occurs near production sites, while in other cases a central processing facility receives natural gas from gathering and boosting facilities.
• Transmission Stations, Storage Facilities, and Transmission Pipelines: A natural gas transmission system is a network of large pipelines that transport natural gas from processing facilities to the city gate (the point at which natural gas can be consumed by large-scale consumers or transferred to local distribution companies). A typical natural gas transmission pipeline is 32 inches in diameter and is constructed of carbon steel. Transmission pipelines operate at 1,500 pounds per square inch of gauge pressure (psig).

LIFE CYCLE GHG PERSPECTIVE ON EXPORTING LNG FROM THE U.S. 2019 UPDATE
9
Transmission stations are located along natural gas transmission pipelines and use compressors to boost the pressure of the natural gas. These stations consist of centrifugal and reciprocating compressors; most pipeline compressors are powered by natural gas, but some are powered by electricity. This stage also includes subsurface storage, which can be wells in depleted oil and gas fields, hollowed-out salt domes, or other geological formations. Storage facilities consist of pneumatic devices and compressors, and fugitive emissions coming from flanges, connectors, open-ended lines, and valves for both the storage station and wellhead.
The above processes define the boundaries of upstream natural gas. Distribution is another supply chain step that can follow transmission, but it is not included in the boundaries of this analysis because it moves natural gas from the city gate to small scale end users (commercial or household consumers). This analysis models natural gas used for large scale power generation. Natural gas power plants receive natural gas immediately downstream from natural gas transmission systems or LNG regasification facilities.
Two upstream natural gas profiles are used in this analysis: Appalachian Shale and a conventional mix. Appalachian Shale is used to represent the share of U.S. natural gas exported as LNG. The conventional mix represents a production-weighted composite of 9 conventional natural gas scenarios in the U.S. and is used as a proxy for the non-U.S. scenarios in this analysis. The emission sources for Appalachian Shale and the conventional mix are based on U.S. industry activity in 2016 (the latest year for which data are available to thoroughly characterize emission sources and supply chain throughputs).
NETL’s life cycle natural gas model used in this analysis contains 127 unit processes that account for the emissions from production through transmission. These unit processes comprise vented and fugitive emissions that arise from one-time construction and well completions, steady state operations, and episodic maintenance events. A summary of the key parameters used by these unit processes are provided in Exhibit 5-1 through Exhibit 5-4. These parameters are a partial list of the parameters used by NETL’s natural gas model, which holds thousands of parameters across different natural gas technologies and production basins. Additionally, the stage scaling parameters used by the model to represent the non-linear relationship between supply stages are included in Exhibit 5-5.
The Greenhouse Gas Reporting Program (GHGRP) and the Inventory of U.S. Greenhouse Gas Emissions and Sinks (GHGI) are two data sources that account for most vented and fugitive emissions (EPA, 2016; EPA, 2018). DI Desktop is also used to stratify annual production activity at a basin level (DrillingInfo, 2018). A complete list of parameters and their corresponding uncertainty is provided in NETL’s LCA of Natural Gas Extraction and Power Generation (NETL, 2019).
To account for uncertainty, distributions of low, expected, and high values were developed when the data allow. Otherwise, an expected value is given for each parameter. Exhibit 5-1 through Exhibit 5-4 display only expected values (despite having parameter distributions) for the sake of brevity. The full parameter tables can be found in the NETL natural gas report (NETL, 2019).

LIFE CYCLE GHG PERSPECTIVE ON EXPORTING LNG FROM THE U.S. 2019 UPDATE
10
Exhibit 5-1. Key Parameters for Natural Gas Production
Parameter Units
Basin
Anad
arko
Appa
lach
ian
Arkl
a
Arko
ma
East
Tex
as
Gre
en R
iver
Gul
f Coa
st
Perm
ian
San
Juan
Uin
ta
Basin Mix
Appalachian Shale fraction - 1.00 - - - - - - - -
Conventional fraction 0.20 - 0.04 0.03 0.14 0.14 0.07 0.21 0.13 0.05
Estimated Ultimate Recovery Mcf/well-life 4.37E+06 1.20E+07 2.99E+06 2.74E+06 2.11E+06 4.29E+06 1.07E+07 1.44E+07 1.57E+06 2.21E+06
Production Rate Mcf/facility-yr* 5.15E+08 7.84E+09 1.43E+08 1.19E+08 1.21E+09 3.09E+08 3.62E+08 4.47E+08 5.72E+08 6.71E+07
CH₄ Content of NG mass fraction 0.669 0.836 0.849 0.92 0.781 0.766 0.835 0.688 0.719 0.808
Completion Emissions tonnes CH₄/ facility-yr* 47.3 717 0.545 9.14 19.7 0.150 2.42 52.2 3.20 2.25
Pneu
mat
ic
Devi
ces†
High Bleed devices/ facility* 62 25.3 11 95.4 117 32.7 74.6 484 162 55.5
Intermittent Bleed
devices/ facility* 5,390 2,330 412 2,030 5,690 1,220 5,060 1,670 14,300 1,750
Low Bleed devices/ facility* 308 315 2.95 4.9 48.1 58.2 132 107 25,900 3,710
Liquids Unloading Emissions kg CH₄/kg NG 4.50E-04 5.60E-04 9.38E-03 1.17E-02 1.40E-03 7.00E-04 9.80E-04 9.00E-05 1.04E-02 1.76E-03
Reciprocating Compressors
compressors/ facility* 298 38.5 13.1 65.6 38.9 0.589 228 132 547 1.92
kg CH4 vented/ compressor-yr* 180 156 116 182 182 23.1 177 168 182 29.4
Fuel Consumption
Mcf NG/ facility-yr* 2.87E+03 9.1E+03 1.69E+02 1.25E+02 3.81E+02 1.00E+01 3.9E+03 4.75E+02 5.74E+03 3.29E+01
kg CO2/Mcf NG combusted 53.8 53.8 53.8 53.8 53.8 53.8 53.8 53.8 53.8 53.8
kg CH4/Mcf NG combusted 0.630 0.630 0.630 0.630 0.630 0.630 0.630 0.630 0.630 0.630
* GHGRP defines a production facility as a group of multiple production sites owned by a single operator in a given basin. The GHGRP-based parameters in this table represent a larger production scale than the values used for estimated ultimate recovery. Given this boundary difference, the values for production rate are higher than those for estimated ultimate recovery. NETL’s life cycle model normalizes these input parameters to a common basis. Similarly, the equipment counts for the GHGRP data are high under the conventional definition for a facility (e.g., 5,390 intermittent bleed devices for an Anadarko facility); however, these counts are reasonable when the GHGRP definition of a facility is understood. † The following emission factors are applied to pneumatic device counts: high bleed = 622 scf/device-day, intermittent bleed = 218 scf/device-day, low bleed = 23 scf/device-day (EPA, 2018).

LIFE CYCLE GHG PERSPECTIVE ON EXPORTING LNG FROM THE U.S. 2019 UPDATE
11
Exhibit 5-2. Key Parameters for Natural Gas Gathering and Boosting*
Parameter Units
Basin
Anad
arko
Appa
lach
ian
Arkl
a
Arko
ma
East
Tex
as
Gre
en R
iver
Gul
f Coa
st
Perm
ian
San
Juan
Uin
ta
Natural Gas Throughput Mcf/yr 2.06E+08 9.13E+08 3.37E+08 2.78E+08 1.92E+08 2.19E+08 2.3E+08 2.31E+09 2.89E+08 1.06E+08
Pneu-matic
Devices
High Bleed devices/facility 136 29.8 140 3.76 35.1 2.45 190 43.3 33.6 1.09
Intermittent Bleed devices/facility 939 515 234 1,874 661 178 1,150 241 535 143
Low Bleed devices/facility 420 68 204 203 69 3 352 79 384 30
Fugitive Emissions tonnes CH₄/facility-yr 3,840 866 535 1,230 884 269 918 3,065 808 2,026
Dehydrator Venting tonnes CH₄/facility-yr 155 1,689 103 2,096 234 13 91 49 812 7
Fuel Combustion for Compression
Mcf NG/facility-yr 1.04E+07 4.59E+07 1.69E+07 1.43E+07 9.65E+06 1.11E+07 1.18E+07 1.16E+08 1.44E+07 5.33E+06
kg CO2/Mcf NG combusted 53.8 53.8 53.8 53.8 53.8 53.8 53.8 53.8 53.8 53.8
kg CH4/Mcf NG combusted 0.630 0.630 0.630 0.630 0.630 0.630 0.630 0.630 0.630 0.630
* All parameters in this table are derived from GHGRP. GHGRP defines a gathering facility as a group of multiple gathering sites owned by a single operator in a given basin. The equipment counts and throughput for these data are high under the conventional definition for a facility, but they are reasonable within the context of the GHGRP definition of a facility.

LIFE CYCLE GHG PERSPECTIVE ON EXPORTING LNG FROM THE U.S. 2019 UPDATE
12
Exhibit 5-3. Key Parameters for Natural Gas Processing
Parameter Units U.S. Average
Natural Gas Throughput Mcf/facility-yr 3.36E+07
Acid Gas Removal Venting kg CH4/kg NG 3.73E-05
Dehydrator Venting tonnes CH₄/facility-yr 5.46E+00
Centrifugal Compressor Energy and Fuel Combustion Emission
Factors
horsepower 7.65E+04
operating hours/yr 4,120
gas-powered turbine thermal efficiency 26%
lb CO2 emissions/MMBtu fuel input 110
lb CH4 emissions/MMBtu fuel input 8.82E-03
Centrifugal Compressor Venting tonnes CH₄/facility-yr 2.07E+02
Reciprocating Compressor Energy and Fuel Combustion Emission
Factors
horsepower 2.46E+04
operating hours/yr 4,670
reciprocating engine thermal efficiency 44%
lb CO2 emissions/MMBtu fuel input 110
lb CH4 emissions/MMBtu fuel input 1.35
Reciprocating Compressor Venting tonnes CH₄/facility-yr 9.73E+01
Fuel Consumption Mcf NG/facility-yr 7.72E+05
Exhibit 5-4. Key Parameters for Natural Gas Transmission, Storage, and Transmission Pipelines
Parameter Units U.S. Average
Natural Gas Throughput Mcf/facility-yr 1.24E+08
Transmission Facility Blowdowns tonnes CH₄/facility-yr 1.26E+02
Centrifugal Compressor Power horsepower 2.48E+04
Centrifugal Compressor Venting tonnes CH₄/facility-yr 6.21E+01
Reciprocating Compressor Power horsepower 1.11E+04
Reciprocating Compressor Venting tonnes CH₄/facility-yr 1.18E+02
Equipment Leaks tonnes CH₄/facility-yr 2.39E+01
Pipeline Length km 4.84E+05
Pipeline Fugitive Emission Factor kg CH₄/km 6.96E+02

LIFE CYCLE GHG PERSPECTIVE ON EXPORTING LNG FROM THE U.S. 2019 UPDATE
13
The life cycle model used in this analysis normalizes natural gas system flows to a single basis, the delivery of 1 MJ of natural gas to consumers. The relationships among supply chain stages do not necessarily represent a single pathway with all stages connected in series. The following pathways are resolved to express results as a unit of delivered natural gas:
• Most (but not all) natural gas goes through gathering and boosting facilities.
• Most (but not all) natural gas goes through processing facilities.
• Natural gas goes through multiple transmission stations.
• Storage facilities do not represent a natural gas throughput, but an internal loop within the transmission network with storage and withdrawal.
Exhibit 5-5. Stage Scaling Parameters
Stage (or sub-stage)
Triangular Distributions Units Rationale
Low Expected High
Production 1 facility count Natural gas is extracted from a well exactly one time.
Gathering and boosting 0.8 0.9 1 dimensionless
The fraction of natural gas that goes through gathering and boosting is based on a recent measurement study (Marchese et al., 2015).
Processing 0.56 0.61 0.66 dimensionless The total volume of U.S. annual processing throughput is 61% of annual natural gas delivered (EIA, 2017a).
Transmission 6.8 10.2 14.5 station count
Transmission station count is based on literature review of inter- and intra-state transmission station counts, reconciled by average facility throughput to estimate the number of transmission stations between processing and delivery.
Storage 0.37 dimensionless
The United States has 0.37 units of storage capacity per unit of delivered natural gas. This factor is the ratio of total underground storage capacity (9.2 Tcf) to annual gas delivered (25 Tcf) (EIA, 2017a).
Pipelines 540 600 660 pipeline miles
Data for pipeline blowdown events are translated to an emission factor in terms of emissions per pipeline mile, thus requiring a corresponding activity factor in terms of pipeline miles traveled by average natural gas. The average distance of transmission is 600 miles (NETL, 2016).
The scaling parameters in Exhibit 5-5 should be interpreted in the context of an average unit of natural gas flowing through the supply chain. For example, using the information from the expected column in Exhibit 5-5, the pathway for average natural gas can be described as

LIFE CYCLE GHG PERSPECTIVE ON EXPORTING LNG FROM THE U.S. 2019 UPDATE
14
follows: After leaving a production site, 90% of natural gas goes through gathering and boosting stations, 61% goes through a processing plant, and travels 600 miles through 10.2 transmission stations.
The Russian natural gas scenario uses the upstream parameters shown in Exhibit 5-1 through Exhibit 5-4, but uses a separate profile for natural gas pipeline transmission. The Russian scenario was modeled using a unit process that allows for the adjustment of pipeline distance and its effect on energy consumption and emissions. Modeling parameters for pipeline distance are included in Exhibit 5-6. The pipeline distance was calculated based on the great circle distance between the Yamal district of Siberia, Russia to a power plant located in Rotterdam, Netherlands or Shanghai, China. The great circle distance is the shortest possible distance between two points on a sphere and was therefore used to represent the shortest possible pipeline distance between the extraction source and the power plant. An additional 1,000 km of pipeline transport were added to the great circle distance to specify the expected pipeline transport distance. Given the extensive pipeline networks in Europe and Asia, determining an actual distance was not possible, nor was it required for this level of analysis. This assumption is tested in the uncertainty analysis section of this study.
Exhibit 5-6. Key Modeling Parameters for Natural Gas Export – Russian Cases
Model Parameter Low Expected High Distribution
Pipeline Distance
(km)
Yamal, Russia to Rotterdam, Netherlands
3,792 4,792 5,792 Triangular
Yamal, Russia to Shanghai, China 5,448 6,447 7,446 Triangular
5.2 LNG SUPPLY SEGMENT There are four key steps in the LNG segment of the natural gas supply chain:
• Liquefaction: This step includes the pre-treatment of pipeline quality gas to make it suitable for liquefaction by removal of CO2, H2S, water and heavy hydrocarbons to prevent freezing and plugging in the downstream units. The pre-treated gas is then liquefied by reducing its temperature to approximately -160°C (API, 2015) and stored until it can be loaded. Boil-off gas is generated during storage, which is continuously removed and re-liquefied to maintain the temperature in the storage tanks.
• Loading and Unloading: The stored LNG from the liquefaction facility is loaded on an ocean tanker for transportation and unloaded into the storage tanks of the regasification facility after transport. The Boil-off Gas (BOG) generated during loading and unloading is re-liquefied on-site and added back to the supply-chain.
• Ocean Transport: Ocean tankers are the transportation method used to move LNG from the U.S. to Asian and European markets (Pace Global, 2015). Approximately 98 percent of an ocean tanker’s capacity is able to be loaded with LNG (Hasan et al., 2009). The BOG generated during this journey is compressed and used for fuel, with Ultra Low Sulfur

LIFE CYCLE GHG PERSPECTIVE ON EXPORTING LNG FROM THE U.S. 2019 UPDATE
15
Diesel (ULSD) used as supplementary fuel. Once the LNG is unloaded at the regasification facility, the ocean tanker begins its ballast voyage with approximately 2.5 percent capacity still onboard, which is used to maintain the temperature of the tanker to avoid cooling it down on arrival at the liquefaction facility for the next journey (Cheniere Energy, 2018).
• Regasification: The imported LNG is regasified at the facility to make it suitable for pipeline transportation to the power plant and combustion to generate power. The Open Rack Vaporizer (ORV) technology passes the LNG through a heat exchanger with sea water and regasifies it.
The parameters and modeling choices used in the unit processes corresponding to these steps in the LNG supply chain are provided in detail in Appendix B.
Key modeling parameters for the liquefaction through regasification portion of the LNG supply chain are included below in Exhibit 5-7 through Exhibit 5-11. Unless otherwise noted, these parameters are used for all LNG scenarios.

LIFE CYCLE GHG PERSPECTIVE ON EXPORTING LNG FROM THE U.S. 2019 UPDATE
16
Exhibit 5-7. Key Modeling Parameters for Liquefaction
Model Parameter Low Expected High Distribution Units Reference En
ergy
Req
uire
men
t Adsorption Based HHC* Removal,
with HRSG* 2.86 Point
Estimate MJ/kg NG liquefied
(Mallapragada et al., 2018)
Adsorption Based HHC, without
HRSG 3.08 Point
Estimate MJ/kg NG liquefied
(Mallapragada et al., 2018)
Cryogenic Distillation Based
HHC removal, with HRSG
2.78 Point Estimate
MJ/kg NG liquefied
(Mallapragada et al., 2018)
Cryogenic Distillation Based
HHC removal, without HRSG
3.35 Point Estimate
MJ/kg NG liquefied
(Mallapragada et al., 2018)
Boil-off Rate (temporary storage) 0.02% 0.1% Uniform percent
volume/day (Dobrota et al.,
2013)
Storage Time 1.33 1.60 Uniform days (EIA, 2017b; IGU, 2017)
Power Consumption for BOG Recondenser 4,450 Point
Estimate kW/kg BOG condensed
(Li & Wen, 2016)
Handling Capacity of BOG Recondenser 13.38 Point
Estimate tonne/hour (Kinder Morgan, n.d.; Li & Wen,
2016) *HHC stands for heavy hydrocarbon removal and HRSG stands for heat recovery steam generator
Exhibit 5-8. Key Modeling Parameters for Loading/Unloading
Model Parameter Low Expected High Distribution Units References
Standard Loading/Unloading Rate 10,000 12,000 Uniform m3/hour (Dobrota et al.,
2013)
Boil-off Rate 20,000 Point Estimate kg/hour (Dobrota et al.,
2013)
LIFE CYCLE GHG PERSPECTIVE ON EXPORTING LNG FROM THE U.S. 2019 UPDATE
17
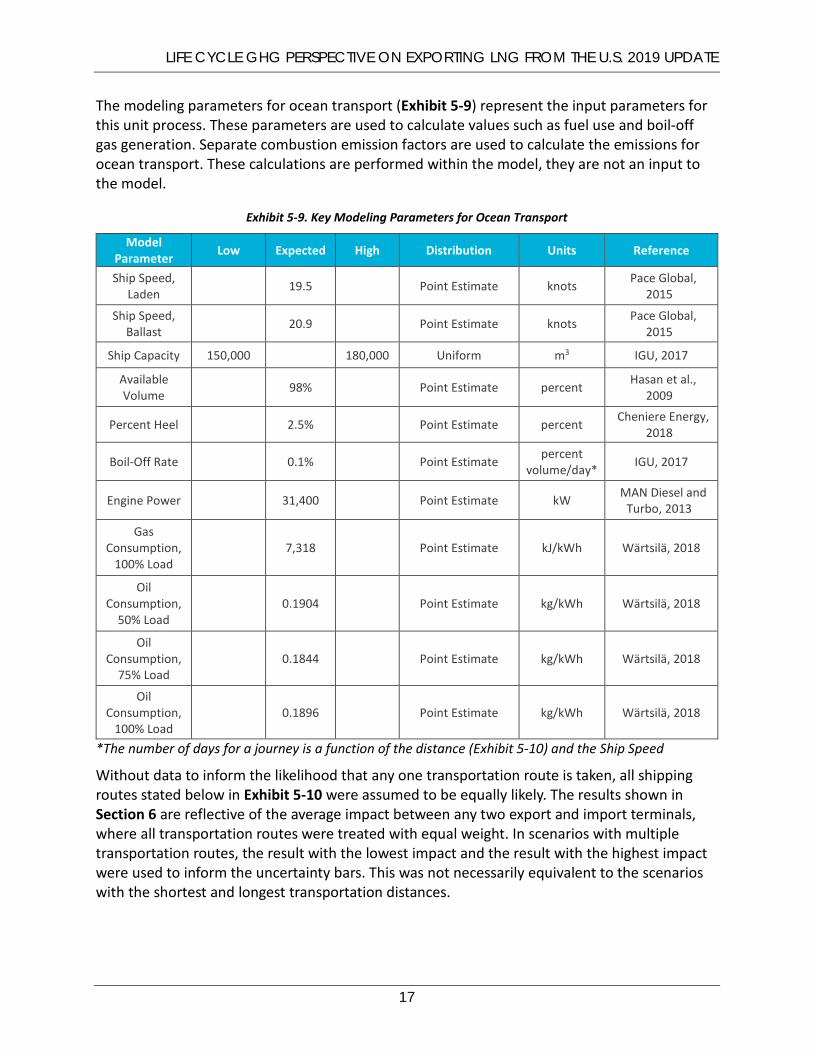
The modeling parameters for ocean transport (Exhibit 5-9) represent the input parameters for this unit process. These parameters are used to calculate values such as fuel use and boil-off gas generation. Separate combustion emission factors are used to calculate the emissions for ocean transport. These calculations are performed within the model, they are not an input to the model.
Exhibit 5-9. Key Modeling Parameters for Ocean Transport
Model Parameter Low Expected High Distribution Units Reference
Ship Speed, Laden 19.5 Point Estimate knots (Pace Global,
2015)
Ship Speed, Ballast 20.9 Point Estimate knots (Pace Global,
2015)
Ship Capacity 150,000 180,000 Uniform m3 (IGU, 2017)
Available Volume 98% Point Estimate percent (Hasan et al.,
2009)
Percent Heel 2.5% Point Estimate percent (Cheniere Energy, 2018)
Boil-Off Rate 0.1% Point Estimate percent volume/day* (IGU, 2017)
Engine Power 31,400 Point Estimate kW (MAN Diesel and Turbo, 2013)
Gas Consumption,
100% Load 7,318 Point Estimate kJ/kWh (Wärtsilä, 2018)
Oil Consumption,
50% Load 0.1904 Point Estimate kg/kWh (Wärtsilä, 2018)
Oil Consumption,
75% Load 0.1844 Point Estimate kg/kWh (Wärtsilä, 2018)
Oil Consumption,
100% Load 0.1896 Point Estimate kg/kWh (Wärtsilä, 2018)
*The number of days for a journey is a function of the distance (Exhibit 5-10) and the Ship Speed
Without data to inform the likelihood that any one transportation route is taken, all shipping routes stated below in Exhibit 5-10 were assumed to be equally likely. The results shown in Section 6 are reflective of the average impact between any two export and import terminals, where all transportation routes were treated with equal weight. In scenarios with multiple transportation routes, the result with the lowest impact and the result with the highest impact were used to inform the uncertainty bars. This was not necessarily equivalent to the scenarios with the shortest and longest transportation distances.

LIFE CYCLE GHG PERSPECTIVE ON EXPORTING LNG FROM THE U.S. 2019 UPDATE
18
Exhibit 5-10. Ocean Transport Distances – LNG scenarios
Export Terminal Import Terminal Via Distance (km)
New Orleans, U.S. Rotterdam, Netherlands Direct 8,990 (Sea-Distances.org, 2016)
New Orleans, U.S. Shanghai, China
Panama Canal 18,544 (Sea-Distances.org, 2016)
Suez Canal 25,436 (Sea-Distances.org, 2016)
Cape of Good Hope 27,731 (Sea-Distances.org, 2016)
Strait of Magellan 31,606 (Sea-Distances.org, 2016)
Cape Horn 31,722 (Sea-Distances.org, 2016)
Oran, Algeria Rotterdam, Netherlands Strait of Gibraltar 2,956 (Sea-Distances.org,
2016)
Cape of Good Hope 24,427 (Sea-Distances.org, 2016)
Darwin, Australia Shanghai, China Direct 5,444 (Sea-Distances.org, 2016)
Exhibit 5-11. Key Modeling Parameters for Regasification
Model Parameter Low Expected High Distribution Units Reference
Energy Requirement 2.14E-01 Point
Estimate MJ/kg LNG regasified (Pace Global, 2015)
Electricity Consumption 1.21E-05 Point
Estimate MWh/kg LNG
regasified (Papadopoulo et al.,
2011)
Boil-Off Rate 0.02% 0.1% Uniform percent volume/day (Dobrota et al., 2013)
Storage Time 1.33 1.60 Uniform days (EIA, 2017b; IGU, 2017)
Fugitive Emission Rate 0.009% Point
Estimate kg/kg LNG regasified
(Papadopoulo et al., 2011)
5.3 COAL UPSTREAM The coal scenario is sensitive to changes in coal type and rail transport distance. The key parameters for the upstream coal supply chain are summarized below in Exhibit 5-12.

LIFE CYCLE GHG PERSPECTIVE ON EXPORTING LNG FROM THE U.S. 2019 UPDATE
19
Exhibit 5-12. Key Modeling Parameters for Coal Upstream
Model Parameter Low Expected High Distribution Reference
Coal Mine Methane (scf/ton) 8 8 360 Triangular (NETL, 2010b; NETL,
2010c; NETL, 2012)
Coal Type PRB PRB I-6 Triangular (NETL, 2010b; NETL, 2010c; NETL, 2012)
Rail Transport Distance (km) 362 1,167 1,971 Triangular Estimate
5.4 POWER PLANT AND TRANSMISSION & DISTRIBUTION Lastly, key modeling parameters for the power plant and transmission and distribution portion of the supply chain are included in Exhibit 5-13. All scenarios are sensitive to variability in power plant net efficiency.
Exhibit 5-13. Key Modeling Parameters for Power Plant and Transmission & Distribution (All Scenarios)
Scenario/Parameter Low Expected High Distribution Reference
All LNG Cases – Power Plant Net Efficiency 41.2% 46.4% 49.2% Triangular (NETL, 2019)
Russian Natural Gas – Power Plant Net Efficiency 41.2% 46.4% 49.2% Triangular (NETL, 2019)
Regional Coal – Power Plant Net Efficiency 28.3% 33.0% 36.7% Triangular (NETL, 2014a)
All Scenarios – Electricity T&D Loss 7% Point Estimate (NETL, 2013a)

LIFE CYCLE GHG PERSPECTIVE ON EXPORTING LNG FROM THE U.S. 2019 UPDATE
20
6 RESULTS The LCA results for natural gas and coal power generation in Europe and Asia are shown in Exhibit 6-1 and Exhibit 6-2, respectively. The results in both exhibits are shown on both 100-yr and 20-yr GWP timeframes, which is important due to the uncaptured venting and fugitive emissions of methane in natural gas systems. Detailed results inventory for all of the scenarios in these exhibits are provided in Appendix A. It is important to note that the results from this analysis bracket the range of variability based on the cumulative change to the key parameters. Exhibit 6-1 and Exhibit 6-2 report an expected value for each of the scenarios. These values should not be interpreted as the most likely values due to the wide range of scenario variability and uncertainty in the underlying modeled data. Rather, the expected values allow for the evaluation of the contribution of each of the major processes to the total life cycle emissions (e.g., extraction, transport, combustion). The results should be interpreted as general guidance to provide perspective on trends only and not as prescriptive, scenario-specific results.
Exhibit 6-1. Life Cycle GHG Emissions for Natural Gas and Coal Power in Europe
636 694 705
1,085
719865
1,016 1,090
0
450
900
1,350
1,800
LNG:
New
Orle
ans t
oRo
tter
dam
, Net
herla
nds
LNG:
Ora
n, A
lger
ia to
Rott
erda
m, N
ethe
rland
s
NG:
Yam
al, R
ussia
toRo
tter
dam
, Net
herla
nds
Coal
: Eur
opea
n Re
gion
al
LNG:
New
Orle
ans t
oRo
tter
dam
, Net
herla
nds
LNG:
Ora
n, A
lger
ia to
Rott
erda
m, N
ethe
rland
s
NG:
Yam
al, R
ussia
toRo
tter
dam
, Net
herla
nds
Coal
: Eur
opea
n Re
gion
al
100-yr GWP 20-yr GWP
Gre
enho
use
Gas
Em
issi
ons
AR5
GW
P (k
g CO
2e/M
Wh)
Natural Gas/Coal Extraction Natural Gas Gathering & Boosting Natural Gas Processing
Domestic Pipeline Transport Liquefaction Tanker/Rail Transport
LNG Regasification Power Plant Operations Electricity T&D

LIFE CYCLE GHG PERSPECTIVE ON EXPORTING LNG FROM THE U.S. 2019 UPDATE
21
Exhibit 6-2. Life Cycle GHG Emissions for Natural Gas and Coal Power in Asia
The results from Exhibit 6-1 and Exhibit 6-2 show that for all 100-yr time horizon scenarios the generation of power from natural gas has lower life cycle GHG emissions than power generation from regional coal. The European and Asian coal scenarios are identical because the same parameter ranges are used for both. The interpretation of the 20-yr natural gas scenarios is more complex due to the tradeoff between upstream GHG intensities and end use efficiencies. Specific conclusions are as follows:
• On a 20-yr GWP time horizon, the Russian natural gas and Algeria LNG scenarios have overlapping error bars with the regional coal scenarios.
• The U.S. LNG to Europe and Asia and the Australia LNG scenarios do not overlap the regional coal scenario on a 20-yr time horizon.
On both time-horizons, uncertainty in the natural gas supply chain obfuscates upstream stage-wise comparisons among scenarios, but confidence in scenario-specific transport distances is a key differentiator.
Exhibit 6-1 and Exhibit 6-2 show that the majority of GHG emissions come from combustion at the power plant; however, the contributions from the upstream acquisition of the two fuels are very different. For the natural gas scenarios, 34 to 45 percent of the life cycle emissions are from the natural gas supply chain prior to the power plant, compared to 2 percent for coal on a
688 671 765
1,085
783 822
1,148 1,090
0
450
900
1350
1800LN
G: N
ew O
rela
ns to
Shan
ghai
, Chi
na
LNG:
Dar
win
, Aus
tral
ia to
Shan
ghai
, Chi
na
NG:
Yam
al, R
ussia
toSh
angh
ai, C
hina
Coal
: Chi
nese
Reg
iona
l
LNG:
New
Ore
lans
toSh
angh
ai, C
hina
LNG:
Dar
win
, Aus
tral
ia to
Shan
ghai
, Chi
na
NG:
Yam
al, R
ussia
toSh
angh
ai, C
hina
Coal
: Chi
nese
Reg
iona
l
100-yr GWP 20-yr GWP
Gre
enho
use
Gas
Em
issi
ons
AR5
GW
P (k
g CO
2e/M
Wh)
Natural Gas/Coal Extraction Natural Gas Gathering & Boosting Natural Gas ProcessingDomestic Pipeline Transport Liquefaction Tanker/Rail TransportLNG Regasification Power Plant Operations Electricity T&D

LIFE CYCLE GHG PERSPECTIVE ON EXPORTING LNG FROM THE U.S. 2019 UPDATE
22
100-yr basis. On a 20-yr basis, the upstream share (prior to power plant) for the natural gas scenarios increases to 42 to 64 percent, compared to 2 percent for coal, due to the high GWP associated with methane. The results show that the LNG and Russian natural gas cases produce essentially the same amount of GHG emissions on a 100-yr basis, with a significant portion of uncertainty bars overlapping. The emissions from the steps involved in LNG (liquefaction, tanker transport, and regasification) are lower than the pipeline transport emissions for the Russian natural gas cases, and the difference within the LNG scenarios is influenced only by the ocean transport distances. However, when comparing the scenarios on a 20-yr basis, the difference between the LNG and Russian natural gas cases is more significant, but there is still some overlap in the uncertainty bars in the Algeria to Rotterdam scenario. This is driven by the pipeline contribution to the Russian natural gas GHG results. The majority of pipeline emissions are methane, which has a higher GWP on a 20-yr basis.
Compared to domestically produced and combusted gas, there is a significant increase in the life cycle GHG emissions that are attributed to the LNG supply chain, specifically from liquefaction, tanker transport, and regasification processes. Exhibit 6-3 shows the speciated GHGs from the key stages in the natural gas power production life cycle for the U.S. LNG to Rotterdam scenario on a 100-yr GWP basis. The liquefaction, ocean transport, and regasification of natural gas are energy intensive activities with significant GHG emissions, accounting for 11 percent of the cradle-to-grave emissions in this scenario. For comparison, the natural gas extraction, processing, and transport activities in the exporting country (either United States or regional) account for 23 percent of the cradle-to-grave emissions. In this analysis, Appalachian Shale natural gas is used as an example, but the same patterns would be shown for other types of natural gas. As shown by Exhibit 6-3, methane emissions account for 9 percent of the total life cycle GHG emissions, while CO2 accounts for 90 percent. The total emissions from the plant stack account for 65 percent of the total life cycle GHG emissions.
For comparison, a speciated GHG drilldown is also shown for the Russian natural gas to Rotterdam scenario in Exhibit 6-4 on a 100-yr GWP basis. In that scenario, methane emissions account for 31 percent of the total life cycle GHG emissions, while CO2 accounts for 69 percent. In the Russian scenario, 59 percent of the total life cycle GHG emissions are direct emissions from the power plant stack. The increased percentage of methane emissions is the result of larger methane emissions from the longer pipeline transport distance.
Exhibit 6-5 shows a speciated GHG drilldown for the coal power production case on a 100-yr GWP basis. Methane emissions, primarily from releases during coal mining, account for 0.4 percent of the total life cycle GHG emissions, compared to 99 percent for CO2. The contribution of methane to the total life cycle GHG emissions for the coal scenario is significantly less than for the natural gas scenarios. For the coal power plant, 98 percent of life cycle GHG emissions come directly from the power plant. As shown by the exhibits, the upstream extraction, processing, and transport emissions are much more significant for the natural gas supply chain than for coal.

LIFE CYCLE GHG PERSPECTIVE ON EXPORTING LNG FROM THE U.S. 2019 UPDATE
23
Exhibit 6-3. Speciated Life Cycle GHG Emissions of Natural Gas Power – U.S. LNG to Rotterdam Scenario
Exhibit 6-4. Speciated Life Cycle GHG Emissions of Natural Gas Power – Russian NG to Rotterdam Scenario
21
49
18
61
38
28
4
416
2
636
0 200 400 600 800 1000
Natural Gas Extraction
Natural Gas Gathering & Boosting
Natural Gas Processing
Domestic Pipeline Transport
Liquefaction
Ocean Transport
LNG Regasification
Power Plant Operations
Electricity T&D
Total
Greenhouse Gas Emissions AR5 100-yr GWP (kg CO2e/MWh)
CO₂ CH₄ N₂O SF₆
61
45
17
166
416
2
705
0 100 200 300 400 500 600 700 800 900 1000
Natural Gas Extraction
Natural Gas Gathering & Boosting
Natural Gas Processing
Domestic Pipeline Transport
Power Plant operations
Electricity T&D
Total
Greenhouse Gas Emissions AR5 100-yr GWP (kg CO2e/MWh)
CO₂ CH₄ N₂O SF₆

LIFE CYCLE GHG PERSPECTIVE ON EXPORTING LNG FROM THE U.S. 2019 UPDATE
24
Exhibit 6-5. Speciated Life Cycle GHG Emissions of Coal Power
Exhibit 6-6 and Exhibit 6-7 use the uncertainty bars shown in Exhibit 6-1 and Exhibit 6-2 to compare the range of life cycle GHG emissions for the gas and coal scenarios in Europe and Asia on 100-yr and 20-yr bases. To calculate the range of difference between natural gas and coal scenarios, the minimum GWP of LNG and NG is compared to the maximum GWP of the coal scenario, and then the maximum GWP of LNG and NG is compared to the minimum GWP of the coal scenario. On a 100-yr basis, natural gas power is 20 to 53 percent less than coal for Europe and 14 to 49 percent less than coal for Asia. Liquefied natural gas power is 23 to 56 percent less than coal for Europe and 21 to 54 percent less than coal for Asia. The small difference in the ranges for Europe and Asia is driven by the longer transport distances for natural gas to Asia (both LNG from the United States and pipeline from Russia). On a 20-yr basis, there is still potential for natural gas and liquefied natural gas to have lower GHG emissions than coal, however natural gas and LNG scenario upper-bound results overlap with coal lower-bound results to some extent. LNG to Europe is 56 percent less to 1 percent greater than coal, and LNG to Asia is 2 to 53 percent less than coal. Russian gas to Europe ranges from 41 percent less to 22 percent greater than coal, and Russian gas to Asia ranges from 38 percent less to 30 percent greater than coal. As noted, the 20-yr GWP emissions for the Russian natural gas scenarios are driven by the methane emissions from pipeline transport. The estimated pipeline distances for Russian natural gas transport are roughly four to eight times longer than for the LNG cases.
9
11
1,063
2
1,085
0 250 500 750 1000 1250 1500
Coal Extraction
Rail Transport
Power Plant Operations
Electricity T&D
Total
Greenhouse Gas Emissions AR5 100-yr GWP (kg CO2e/MWh)
CO₂ CH₄ N₂O SF₆

LIFE CYCLE GHG PERSPECTIVE ON EXPORTING LNG FROM THE U.S. 2019 UPDATE
25
Exhibit 6-6. 100-yr GWP Comparison of Coal and Natural Gas Power in Europe and Asia
Exhibit 6-7. 20-yr GWP Comparison of Coal and Natural Gas Power in Europe and Asia
0 450 900 1,350 1,800
Regional Coal
Russian NG (Yamal, RU to Shanghai, CN)
Regional LNG (Darwin, AU to Shanghai, CN)
U.S. LNG (New Orleans, US to Shanghai, CN)
Regional Coal
Russian NG (Yamal, RU to Rotterdam, NL)
Regional LNG (Oran, DZ to Rotterdam, NL)
U.S. LNG (New Orleans, US to Rotterdam,NL)
Asia
Euro
pe
Greenhouse Gas Emissions AR5 100-yr GWP(kg CO₂e/MWh)
NG is 20% to 53% less than coal
NG is 14% to 49% less than coal
LNG is 23% to 56% less than coal
LNG is 21% to 54% less than coal
0 450 900 1,350 1,800
Regional Coal
Russian NG (Yamal, RU to Shanghai, CN)
Regional LNG (Darwin, AU to Shanghai, CN)
U.S. LNG (New Orleans, US to Shanghai, CN)
Regional Coal
Russian NG (Yamal, RU to Rotterdam, NL)
Regional LNG (Oran, DZ to Rotterdam, NL)
U.S. LNG (New Orleans, US to Rotterdam,NL)
Asia
Euro
pe
Greenhouse Gas Emissions AR5 20-yr GWP(kg CO₂e/MWh)
LNG is 56% less to 1% greater than coal
LNG is 2% to 53% less than coal
NG is 38% less to 30% greater than coal
NG is 41% less to 22% greater than coal
LIFE CYCLE GHG PERSPECTIVE ON EXPORTING LNG FROM THE U.S. 2019 UPDATE
26
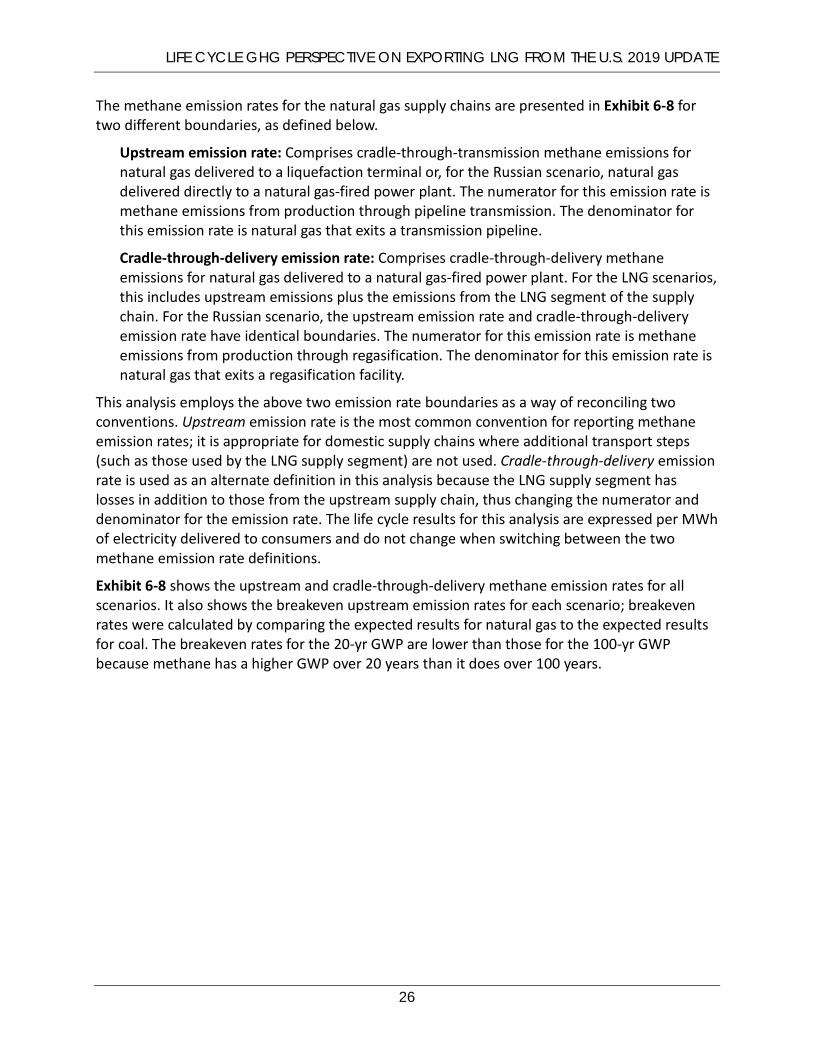
The methane emission rates for the natural gas supply chains are presented in Exhibit 6-8 for two different boundaries, as defined below.
Upstream emission rate: Comprises cradle-through-transmission methane emissions for natural gas delivered to a liquefaction terminal or, for the Russian scenario, natural gas delivered directly to a natural gas-fired power plant. The numerator for this emission rate is methane emissions from production through pipeline transmission. The denominator for this emission rate is natural gas that exits a transmission pipeline.
Cradle-through-delivery emission rate: Comprises cradle-through-delivery methane emissions for natural gas delivered to a natural gas-fired power plant. For the LNG scenarios, this includes upstream emissions plus the emissions from the LNG segment of the supply chain. For the Russian scenario, the upstream emission rate and cradle-through-delivery emission rate have identical boundaries. The numerator for this emission rate is methane emissions from production through regasification. The denominator for this emission rate is natural gas that exits a regasification facility.
This analysis employs the above two emission rate boundaries as a way of reconciling two conventions. Upstream emission rate is the most common convention for reporting methane emission rates; it is appropriate for domestic supply chains where additional transport steps (such as those used by the LNG supply segment) are not used. Cradle-through-delivery emission rate is used as an alternate definition in this analysis because the LNG supply segment has losses in addition to those from the upstream supply chain, thus changing the numerator and denominator for the emission rate. The life cycle results for this analysis are expressed per MWh of electricity delivered to consumers and do not change when switching between the two methane emission rate definitions.
Exhibit 6-8 shows the upstream and cradle-through-delivery methane emission rates for all scenarios. It also shows the breakeven upstream emission rates for each scenario; breakeven rates were calculated by comparing the expected results for natural gas to the expected results for coal. The breakeven rates for the 20-yr GWP are lower than those for the 100-yr GWP because methane has a higher GWP over 20 years than it does over 100 years.

LIFE CYCLE GHG PERSPECTIVE ON EXPORTING LNG FROM THE U.S. 2019 UPDATE
27
Exhibit 6-8. Coal and Natural Gas Breakeven for U.S. LNG and Russian Natural Gas Scenarios
Scenario Upstream Emission
Rate
Cradle-through-delivery Emission
Rate
Breakeven Upstream Emission Rate
Breakeven Upstream Emission Rate/
Upstream Emission Rate 100-yr GWP
20-yr GWP
100-yr GWP
20-yr GWP
U.S. LNG to Rotterdam 0.7% 1.1% 9.1% 3.6% 12.8 5.1
U.S. LNG to Shanghai 0.7% 1.2% 8.2% 3.1% 11.5 4.4
Russia NG to Rotterdam 4.1% 4.1% 11.2% 4.7% 2.7 1.1
Russia NG to Shanghai 5.1% 5.1% 11.1% 4.6% 2.2 0.9
Algeria LNG to Rotterdam* 1.5% 2.1% 8.9% 3.3% 5.9 2.2
Australia LNG to Shanghai* 1.5% 2.0% 9.3% 3.6% 6.2 2.0 *Scenarios not included in Exhibit 6-9 and 6-10
Exhibit 6-9 and Exhibit 6-10 show life cycle GHG emissions for the U.S. LNG and Russian natural gas scenarios as a function of upstream emission rate. Exhibit 6-9 shows life cycle GHG emissions using 100-yr GWP, and Exhibit 6-10 shows life cycle GHG emissions using 20-yr GWP. Both exhibits also include a reference line for the coal power scenario. The diamond-shaped data points represent the emission rate for each scenario and the circular data points represent the breakeven emission rate at which the cradle-through-delivery GHG emissions for natural gas power would equal those for the coal reference case.
The breakeven upstream emission rates for U.S. LNG to Shanghai and Rotterdam are 8.2 and 9.1 percent, respectively. On a 100-yr GWP basis, the upstream emission rate would have to increase by a factor of 11.5 before the expected life cycle GHG emissions matched those for coal-fired power in China. To match coal-fired power in Europe, the upstream emission rate would have to increase by a factor of 12.8 for the U.S. LNG to Rotterdam scenario. This breakeven point is higher than the U.S. LNG to Shanghai scenario due to the shorter transport distance between the U.S. and Rotterdam.
The upstream methane emission rates for Russian natural gas to Shanghai and Rotterdam are 5.1 and 4.1 percent, respectively. On a 100-yr GWP basis, the upstream emission rate would have to increase by a factor of 2.2 before the expected life cycle GHG emissions matched those for coal-fired power in China. To match coal-fired power in Europe, the upstream emission rate would have to increase by a factor of 2.7 for the U.S. LNG to Rotterdam scenario.
Exhibit 6-10 shows breakeven points for the U.S. and Russian scenarios on a 20-yr GWP basis. The upstream emission rate for U.S. LNG (0.7 percent) is still lower than the breakeven upstream emission rates for the corresponding Rotterdam and Shanghai scenarios (3.6 percent and 3.1 percent, respectively). The upstream emission rate for Russian natural gas to Rotterdam (4.1 percent) is also lower than the breakeven upstream emission rate (4.7 percent) on a 20-yr basis, but Russian natural gas to Shanghai scenario has an upstream emission rate (5.1 percent) that is higher than the breakeven upstream emission rate (4.6 percent).

LIFE CYCLE GHG PERSPECTIVE ON EXPORTING LNG FROM THE U.S. 2019 UPDATE
28
Exhibit 6-9. Coal and Natural Gas Breakeven for U.S. LNG and Russian Natural Gas Scenarios (100-yr GWP)
Exhibit 6-10. Coal and Natural Gas Breakeven for U.S. LNG and Russian Natural Gas Scenarios (20-yr GWP)
0.7% 4.1%
0.7% 5.1%
9.1% 11.2%
8.2% 11.1%
400
600
800
1,000
1,200
1,400
1,600
0% 2% 4% 6% 8% 10% 12%
Gre
enho
use
Gas
Em
issi
ons
AR5
100-
yr G
WP
(kgC
O2e
/MW
h)
Upstream Natural Gas Emission Rate (CH4 Emitted/ NG through Transmission)
U.S. LNG to Rotterdam Russian NG to Rotterdam U.S. LNG to Shanghai
Russian NG to Shanghai Coal
0.7%
4.1%
0.7%
5.1%
3.6% 4.7%
3.1% 4.6%
400
500
600
700
800
900
1,000
1,100
1,200
1,300
0% 1% 2% 3% 4% 5% 6%
Gre
enho
use
Gas
Em
issi
ons
AR5
20-y
r GW
P
(k
gCO
2e/M
Wh)
Upstream Natural Gas Emission Rate (CH4 Emitted/ NG through Transmission)
U.S. LNG to Rotterdam Russian NG to Rotterdam U.S. LNG to Shanghai
Russian NG to Shanghai Coal

LIFE CYCLE GHG PERSPECTIVE ON EXPORTING LNG FROM THE U.S. 2019 UPDATE
29
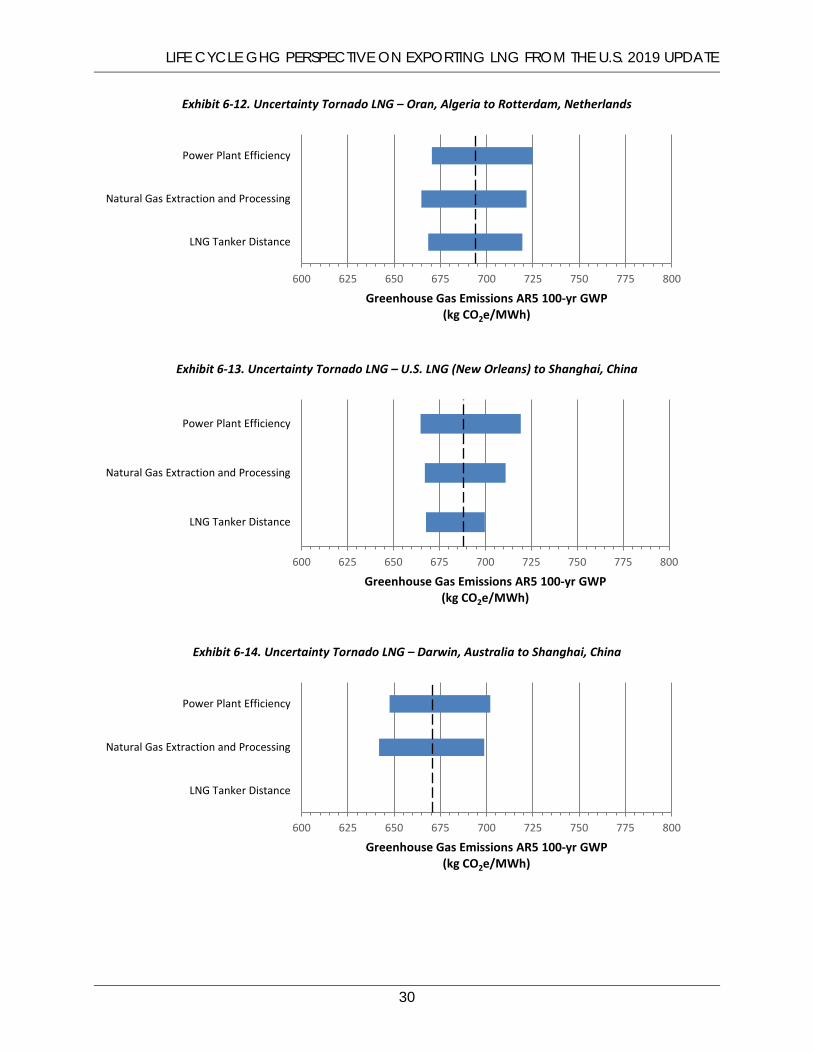
Exhibit 6-11 through Exhibit 6-17 are uncertainty tornado diagrams for each of the 100-yr GWP scenarios from Exhibit 6-1 and Exhibit 6-2. The parameter ranges for these exhibits are based on the values in Exhibit 5-1 through Exhibit 5-13. These exhibits show the uncertainty in the total life cycle results based on changes to only a single parameter.
As expected, the power plant efficiency contributes a significant fraction of the uncertainty for the natural gas and coal scenarios. Exhibit 6-11 through Exhibit 6-17 indicate that the transport of LNG does not have any uncertainty in the New Orleans to Rotterdam and Darwin to Shanghai cases (as only one route is modeled), but contributes significantly in the Oran to Rotterdam and New Orleans to Shanghai cases. In the Oran to Rotterdam and New Orleans to Shanghai scenarios, two and five possible shipping routes are considered, respectively (as described in Exhibit 5-10). The base case assumption for these scenarios is the average of all likely routes. The emissions associated with the extraction and processing of natural gas are significant contributors to the uncertainty of the overall emissions in all natural gas scenarios. For more details on the factors that drive the uncertainty of upstream natural gas extraction, refer to the NETL Life Cycle Analysis of Natural Gas Extraction and Power Generation (NETL, 2019). For the Russian natural gas cases shown in Exhibit 6-15 and Exhibit 6-16, uncertainty in the pipeline transport distance results is a large driver in the overall uncertainty of the life cycle result. As previously noted, the exact distance the natural gas travels from the extraction point in Yamal to the destination power plant is unknown, so a wide range spanning 2,000 km (1,243 miles) from low to high was used to represent all potential scenarios.
Exhibit 6-17 shows the uncertainty within the coal model used for both the Asian and European cases. The type of coal used at the power plant is one source of uncertainty. The high case uses I-6 coal, which has higher acquisition emissions due to higher methane emissions at the coal mine. The low and expected cases use PRB coal, and so have the same value for coal mine methane emissions.
Exhibit 6-11. Uncertainty Tornado LNG – U.S. LNG (New Orleans) to Rotterdam, Netherlands
600 625 650 675 700 725 750 775 800
LNG Tanker Distance
Natural Gas Extraction and Processing
Power Plant Efficiency
Greenhouse Gas Emissions AR5 100-yr GWP (kg CO2e/MWh)
LIFE CYCLE GHG PERSPECTIVE ON EXPORTING LNG FROM THE U.S. 2019 UPDATE
30
Exhibit 6-12. Uncertainty Tornado LNG – Oran, Algeria to Rotterdam, Netherlands
Exhibit 6-13. Uncertainty Tornado LNG – U.S. LNG (New Orleans) to Shanghai, China
Exhibit 6-14. Uncertainty Tornado LNG – Darwin, Australia to Shanghai, China
600 625 650 675 700 725 750 775 800
LNG Tanker Distance
Natural Gas Extraction and Processing
Power Plant Efficiency
Greenhouse Gas Emissions AR5 100-yr GWP (kg CO2e/MWh)
600 625 650 675 700 725 750 775 800
LNG Tanker Distance
Natural Gas Extraction and Processing
Power Plant Efficiency
Greenhouse Gas Emissions AR5 100-yr GWP (kg CO2e/MWh)
600 625 650 675 700 725 750 775 800
LNG Tanker Distance
Natural Gas Extraction and Processing
Power Plant Efficiency
Greenhouse Gas Emissions AR5 100-yr GWP (kg CO2e/MWh)

LIFE CYCLE GHG PERSPECTIVE ON EXPORTING LNG FROM THE U.S. 2019 UPDATE
31
Exhibit 6-15. Uncertainty Tornado Russian NG – Yamal, Russia to Rotterdam, Netherlands
Exhibit 6-16. Uncertainty Tornado Russian NG – Yamal, Russia to Shanghai, China
Exhibit 6-17. Uncertainty Tornado Coal – Europe and Asia Regional Production
600 625 650 675 700 725 750 775 800
Pipeline Distance
Natural Gas Extraction and Processing
Power Plant Efficiency
Greenhouse Gas Emissions AR5 100-yr GWP (kg CO2e/MWh)
600 625 650 675 700 725 750 775 800
Pipeline Distance
Natural Gas Extraction and Processing
Power Plant Efficiency
Greenhouse Gas Emissions AR5 100-yr GWP (kg CO2e/MWh)
950 1000 1050 1100 1150 1200 1250 1300
Rail Distance
Coal Type
Power Plant Efficiency
Greenhouse Gas Emissions AR5 100-yr GWP (kg CO2e/MWh)

LIFE CYCLE GHG PERSPECTIVE ON EXPORTING LNG FROM THE U.S. 2019 UPDATE
32
7 SUMMARY AND STUDY LIMITATIONS This analysis has determined that the use of U.S. LNG exports for power production in European and Asian markets will not increase GHG emissions from a life cycle perspective, when compared to regional coal extraction and consumption for power production.
The results show that for all 100-yr time horizon scenarios the generation of power from natural gas has lower life cycle GHG emissions than power generation from regional coal. The European and Asian coal scenarios are identical because the same parameter ranges are used for both. The interpretation of the 20-yr natural gas scenarios is more complex due to the tradeoff between upstream GHG intensities and end use efficiencies. Specific conclusions are as follows:
• On a 20-yr GWP time horizon, the Russian natural gas and Algeria LNG scenarios have overlapping error bars with the regional coal scenarios.
• The U.S. LNG to Europe and Asia and Australia LNG scenario do not overlap the regional coal scenario on a 20-yr time horizon.
On both time-horizons, uncertainty in the natural gas supply chain obfuscates upstream stage-wise comparisons among scenarios, but confidence in scenario-specific transport distances is a key differentiator.
Study limitations are due to challenges with data availability and LNG market dynamics:
• The upstream data for coal and natural gas are U.S.-based models that were adapted for foreign natural gas and coal production as well as power generation.
• The specific LNG export/import locations used in this study were chosen to represent an estimate for a region (e.g., New Orleans as U.S. Gulf Coast). Specific locations were required to allow for the estimation of LNG transport distances and do not imply the likelihood that LNG export or import will occur from that exact location. The same assumptions hold true for the Russian natural gas cases.
• Power plant efficiencies in destination countries are adapted from work based on U.S. power plants.

LIFE CYCLE GHG PERSPECTIVE ON EXPORTING LNG FROM THE U.S. 2019 UPDATE
33
8 REFERENCES API. 2015. Liquefied Natural Gas (LNG) Operations Consistent Methodology for Estimating Greenhouse
Gas Emissions. A.P. Institute. https://www.api.org/oil-and-natural-gas/wells-to-consumer/exploration-and-production/natural-gas/methodology-for-estimating-ghgs-from-lng. Washington, D.C.
Cheniere Energy. 2018. Personal Communication. U.S. Department of Energy, National Energy Technology Laboratory. December 21, 2018.
Dobrota, D., Lalic, B., Komar, I. 2013. Problem of Boil-off in LNG Supply Chain Transactions in Maritime Science, 2, 91-100.
DrillingInfo. 2018. DI Data & Insights.
EIA. 2013a. Russia's Key Energy Statistics. U.S. Energy Information Administration. http://www.eia.gov/countries/cab.cfm?fips=RS. Accessed December 16.
EIA. 2013b. Russia Analysis Brief. U.S. Energy Information Administration. http://www.eia.gov/countries/cab.cfm?fips=RS. Accessed December 16, 2013.
EIA. 2017a. Annual Energy Outlook 2017. U.S. Energy Information Administration. https://www.eia.gov/outlooks/aeo/index.cfm. Accessed June 13, 2017.
EIA. 2017b. U.S. Liquefied natural gas exports have increased as new facilities come online. U.S. Energy Information Administration. https://www.eia.gov/todayinenergy/detail.php?id=34032. Accessed November 20.
EPA. 2016. Greenhouse Gas Reporting Program. U.S. Environmental Protection Agency. https://www.epa.gov/enviro/greenhouse-gas-customized-search. Accessed August 22, 2018.
EPA. 2018. Inventory of U.S. Greenhouse Gas Emissions and Sinks, 1990-2016. U.S. Environmental Protection Agency. EPA 430-R-18-003. https://www.epa.gov/sites/production/files/2018-01/documents/2018_complete_report.pdf Accessed August 20, 2018.
Hasan, M.M.F., Zheng, A.M., Karimi, I.A. 2009. Minimizing Boil-Off Losses in Liquefied Natural Gas Transportation. Ind. Eng. Chem. Res., 48(21), 9571-9580.
IGU. 2017. 2017 World LNG Report. International Gas Union. https://www.igu.org/sites/default/files/103419-World_IGU_Report_no%20crops.pdf. Barcelona, Spain.
IPCC. 2013. Climate Change 2013 The Physical Science Basis. Intergovernmental Panel on Climate Change. http://www.climatechange2013.org/images/uploads/WGIAR5_WGI-12Doc2b_FinalDraft_All.pdf. New York: Cambridge University Press.
Kinder Morgan. n.d. Kinder Morgan CO2 - Supply. http://www.kindermorgan.com/business/co2/supply.cfm. Accessed November 12, 2012.
Li, Y., Wen, M. 2016. Boil-Off Gas Two-Stage Compression and Recondensation Process at a Liquefied Natural gas Receiving Terminal. Chemical Engineering & Technology, 40, 18-27.
Mallapragada, D.S., Reyes-Bastida, E., Roberto, F., McElroy, E.M., Veskovic, D., Laurenzi, I.J. 2018. Life cycle greenhouse gas emissions and freshwater consumption of liquefied Marcellus shale gas used for international power generation. Journal of Cleaner Production, 205, 672-680.
LIFE CYCLE GHG PERSPECTIVE ON EXPORTING LNG FROM THE U.S. 2019 UPDATE
34
MAN Diesel and Turbo. 2013. Propulsion Trends in LNG Carriers: Two-stroke Engines. MAN Diesel and Turbo. https://www.mandieselturbo.com/docs/default-source/shopwaredocuments/propulsion-trends-in-lngb395958927f2417aa98957b04cbb684a.pdf?sfvrsn=4. Copenhagen, Denmark.
Marchese, A.J., Vaughn, T.L., Zimmerle, D.J., Martinez, D.M., Williams, L.L., Robinson, A.L., Mitchell, A.L., Subramanian, R., Tkacik, D.S., Roscioli, J.R. 2015. Methane emissions from United States natural gas gathering and processing. Environmental Science & Technology, 49(17), 10718-10727.
NETL. 2010a. NETL Life Cycle Inventory Data – Unit Process: Water Carrier, 125,000 m3 LNG Tanker, Construction - Version 01. U.S. Department of Energy, National Energy Technology Laboratory. https://www.netl.doe.gov/projects/unit-process-library-download.aspx?pdid=1531&id=5825&filename=DS_Stage2_C_LNG_Water_Tanker_125000m3_2010-01.xls. Pittsburgh, PA.
NETL. 2010b. Quality Guidelines for Energy System Studies: Methane Emissions from Mining Powder River Basin Coals, DOE/NETL-2010/1446. U.S. Department of Energy, National Energy Technology Laboratory. http://www.netl.doe.gov/File%20Library/Research/Energy%20Analysis/Publications/DOE-NETL-2010-1446-QGESSMethaneEmissionsPRB.pdf. Pittsburgh, PA.
NETL. 2010c. Quality Guidelines for Energy System Studies: Methane Emissions from Mining Illinois Basin Coals, DOE/NETL-400/2010/1445. U.S. Department of Energy, National Energy Technology Laboratory. http://www.netl.doe.gov/File%20Library/Research/Energy%20Analysis/Publications/DOE-NETL-2010-1445-QGESSMethaneEmissionsIllns.pdf. Pittsburgh, PA.
NETL. 2012. Quality Guidelines for Energy System Studies: Detailed Coal Specifications, DOE/NETL-401/012111. U.S. Department of Energy, National Energy Technology Laboratory. http://www.netl.doe.gov/File%20Library/research/energy%20analysis/publications/QGESS_DetailCoalSpecs_Rev4_20130510.pdf. Pittsburgh, PA.
NETL. 2013a. Life Cycle Analysis: Natural Gas Combined Cycle (NGCC) Power Plant. U.S. Department of Energy, National Energy Technology Laboratory. September 10, 2012. https://www.netl.doe.gov/projects/unit-process-library-download.aspx?pdid=1635&id=5957&filename=DS_Stage3_O_NGCC_baseline_2012-03.xls. Pittsburgh, PA.
NETL. 2013b. Life Cycle Inventory Data - Unit Process: LNG Liquefaction, Construction. U.S. Department of Energy, National Energy Technology Laboratory. http://www.netl.doe.gov/File%20Library/Research/Energy%20Analysis/Life%20Cycle%20Analysis/UP_Library/DS_Stage12345_I_LNG_Liquefaction_Facility_2013-01.xlsx. Pittsburgh, PA.
NETL. 2013c. Life Cycle Inventory Data - Unit Process: LNG Regasification, Construction. U.S. Department of Energy, National Energy Technology Laboratory. http://www.netl.doe.gov/File%20Library/Research/Energy%20Analysis/Life%20Cycle%20Analysis/UP_Library/DS_Stage12345_C_LNG_Regasification_Facility_2013-01.xlsx. Pittsburgh, PA.
NETL. 2014a. Life Cycle Analysis of Natural Gas Extraction and Power Generation. U.S. Department of Energy, National Energy Technology Laboratory. DOE/NETL - 2014/1646. https://www.netl.doe.gov/projects/files/NaturalGasandPowerLCAModelDocumentationNG%20Report_052914.pdf. Pittsburgh, PA.

LIFE CYCLE GHG PERSPECTIVE ON EXPORTING LNG FROM THE U.S. 2019 UPDATE
35
NETL. 2014b. Life Cycle Greenhouse Gas Perspective on Exporting Liquefied Natural Gas from the United States. U.S. Department of Energy, National Energy Technology Laboratory. https://www.netl.doe.gov/projects/files/LCAGHGReportLNG%20Report_052914.pdf. Pittsburgh, PA.
NETL. 2016. Life Cycle Analysis of Natural Gas Extraction and Power Generation. U.S. Department of Energy, National Energy Technology Laboratory. August 30, 2016. DOE/NETL-2015/1714. https://www.netl.doe.gov/projects/files/LifeCycleAnalysisofNaturalGasExtractionandPowerGeneration_083016.pdf. Pittsburgh, PA.
NETL. 2019. Life Cycle Analysis of Natural Gas Extraction and Power Generation. U.S. Department of Energy, National Energy Technology Laboratory. April 2019. DOE/NETL-2019/2039. https://www.netl.doe.gov/energy-analysis/details?id=3198. Pittsburgh, PA.
NMA. 2009. 2008 Coal Producer Survery. National Mining Association. http://www.nma.org/pdf/members/coal_producer_survey2008.pdf. Washington, D.C.
Pace Global. 2015. LNG and Coal Life Cycle Assessment of Greenhouse Gas Emissions. Pace Global, A Siemens Business. October, 2015. http://www.paceglobal.com/wp-content/uploads/2015/10/LNG-and-Coal-Life-Cycle-Assessment-of-Greenhouse-Gas-Emissions.pdf. Fairfax, VA.
Papadopoulo, M., Kaddouh, S., Pacitto, P., Vernat, A.P. 2011. Life Cycle Assessment of the European Natural Gas Chain focused on three environmental impact indicators. Marcogaz. June 22, 2011. https://www.cgoa.cz/informacezezahranici/pdfdoc/marcogazudrzitelnost/2011/WG-LCA-12-01_D023_WG_LCA_Final_Report_Life_Cycle_Assessment.pdf. Brussels, Belgium.
Sea-Distances.org. 2016. Sea-Distances. https://sea-distances.org/. Accessed September, 27, 2018.
Wärtsilä, Corporation. 2018. Wartsila 50DF. June, 2018. https://cdn.wartsila.com/docs/default-source/product-files/engines/df-engine/product-guide-o-e-w50df.pdf?sfvrsn=9. Vaasa, Finland.
The authors thank representatives at Cheniere Energy and Dominion Energy who answered questions about operations at liquefaction terminals and on ocean tankers.

This page intentionally left blank.

LIFE CYCLE GHG PERSPECTIVE ON EXPORTING LNG FROM THE U.S. 2019 UPDATE
A-1
APPENDIX A: LIFE CYCLE RESULTS Exhibit A-1. Life Cycle GHG Emissions for Natural Gas and Coal Power in Europe (IPCC AR5 GWP) (kg CO2e/MWh)
Life Cycle Process
100-yr GWP 20-yr GWP
New Orleans to
Rotterdam, Netherlands
Oran, Algeria to
Rotterdam, Netherlands
Yamal, Russia to
Rotterdam, Netherlands
European Regional
Coal
New Orleans to
Rotterdam, Netherlands
Oran, Algeria to
Rotterdam, Netherlands
Yamal, Russia to
Rotterdam, Netherlands
European Regional
Coal
Natural Gas/Coal Extraction 21 66 61 9 31 145 134 14
Natural Gas Gathering & Boosting 49 48 45 0 72 74 69 0
Natural Gas Processing 18 18 17 0 25 25 23 0
Domestic Pipeline Transport 61 61 166 0 83 84 373 0
Liquefaction 38 39 0 0 53 39 0 0
Tanker/Rail Transport 28 40 0 11 32 75 0 11
LNG Regasification 4 4 0 0 5 5 0 0
Power Plant Operations 416 416 416 1,063 416 416 416 1,063
Electricity T&D 2 2 2 2 1 1 1 1
Total (Expected) 636 694 705 1,085 719 865 1,016 1,090
Low 615 644 668 969 701 811 941 973
High 709 750 778 1,408 825 982 1,183 1,602

LIFE CYCLE GHG PERSPECTIVE ON EXPORTING LNG FROM THE U.S. 2019 UPDATE
A-2
Exhibit A-2. Life Cycle GHG Emissions for Natural Gas and Coal Power in Asia (IPCC AR5 GWP) (kg CO2e/MWh)
Life Cycle Process
100-yr GWP 20-yr GWP
New Orleans to
Shanghai, China
Darwin, Australia
to Shanghai,
China
Yamal, Russia
to Shanghai,
China
Chinese Regional
Coal
New Orleans to
Shanghai, China
Darwin, Australia
to Shanghai,
China
Yamal, Russia
to Shanghai,
China
Chinese Regional
Coal
Natural Gas/Coal Extraction 21 66 63 9 32 143 137 14
Natural Gas Gathering & Boosting 50 48 46 0 73 74 70 0
Natural Gas Processing 18 18 17 0 25 25 24 0
Domestic Pipeline Transport 60 61 222 0 85 83 499 0
Liquefaction 41 38 0 0 54 53 0 0
Tanker/Rail Transport 76 19 0 11 91 22 0 11
LNG Regasification 4 4 0 0 5 5 0 0
Power Plant Operations 416 416 416 1,063 416 416 416 1,063
Electricity T&D 2 2 2 2 1 1 1 1
Total (Expected) 688 671 765 1,085 783 822 1,148 1,090
Low 663 644 712 969 757 782 999 973
High 763 750 833 1,408 888 955 1,267 1,602

LIFE CYCLE GHG PERSPECTIVE ON EXPORTING LNG FROM THE U.S. 2019 UPDATE
B-1
APPENDIX B: UNIT PROCESS DESCRIPTIONS B.1 LIQUEFACTION The pre-treatment, liquefaction and storage unit process (UP) accounts for the pre-treatment of the input pipeline quality gas, liquefaction of the pre-treated gas, and on-site temporary storage of LNG before it is loaded onto an ocean tanker. The pre-treatment processes include:
• Acid gas removal (AGR): removal of CO2 and H2S from the pipeline feed gas, to avoid freezing and plugging in downstream units. (~7,050 ppmv (EPA, 1996) to ~50 ppmv CO2
(Mallapragada et al., 2018))
• Molecular sieve dehydration: removal of water to avoid freeze-up and unplanned shut downs, costly repairs and hazardous working conditions (ensure <0.5 ppmv water (Mallapragada et al., 2018))
• Heavy hydrocarbon (HHC) removal: to protect the main heat exchanger from freezing and plugging. This can be done by either adsorption or cryogenic distillation (~75 ppmv (EPA, 1996) to <10 ppmv C5+ (Smith & Doong, 2016))
The liquefaction facilities in the U.S. predominantly employ two technologies, Propane Pre-cooled Mixed Refrigerant (C3MR) process and Optimized Cascade process. This model represents the C3MR technology in combination with different pre-treatment technologies, represented through four different scenarios. The energy requirement for all scenarios is estimated based on literature (Mallapragada et al., 2018). Based on the publicly available data on plant export capacities (EIA, 2017) and ship capacity assumptions (IGU, 2017), the residence time of LNG on site is estimated, which is treated as the LNG storage time on site. This value is estimated to be between 1.33 days to 1.60 days. During storage, boil-off gas (BOG) is generated at an estimated boil-off rate (BOR) of 0.02% to 0.1% (Dobrota et al., 2013). It is assumed that the BOG generated during storage is re-liquefied, which then enters back into the supply-chain. Literature suggests that the temporary onsite storage unit does not require energy to maintain the LNG in its liquid stage because it uses the concept of auto-refrigeration. The pre-treatment and liquefaction energy requirement is assumed to be met through combusting a parasitic stream of NG as it leaves the pre-treatment facility and before it enters the liquefaction facility. The functional unit of this unit process is the mass of LNG that is stored after being treated and liquefied.
B.2 LOADING AND UNLOADING The loading and unloading UPs represent the process of loading LNG from the liquefaction facility onto an ocean tanker and the process of unloading the LNG from the ocean tanker into a regasification storage facility after transportation. These UPs model the ship capacity to be in the range of 150,000 m3 to 180,000 m3 (IGU, 2017). The BOG generated during loading and unloading is assumed to be re-liquefied and directed back into the supply chain, so the net loss of LNG during loading and unloading is zero. Based on literature, a standard loading/unloading rate of 10,000-12,000 m3/hour and a BOR of 20,000 kg/hour is modeled (Dobrota et al., 2013).

LIFE CYCLE GHG PERSPECTIVE ON EXPORTING LNG FROM THE U.S. 2019 UPDATE
B-2
In any journey only 98% of the total ship capacity is utilized (Hasan et al., 2009). During loading, 0.15% of the volume is still occupied by the heel leftover from the previous ballast voyage, hence 97.85% [98%-0.15%] is to be loaded. During unloading, 2.5% of the capacity is to be left behind as heel for the ballast voyage (Cheniere Energy, 2018). The average time at sea for the scenarios investigated in this analysis is 22.67 days (Sea-Distances.org, 2016) and modeling the BOR to be 0.1 percent volume/day during transportation (IGU, 2017), it is calculated that approximately 93.23% [98%-2.5%-0.1*22.67] of the ship will have to be unloaded on arrival at the port. A sensitivity analysis was performed on this assumption. The same calculation was performed for the shortest shipping distance and the longest shipping distance. Because there are no losses during loading and unloading (all BOG is captured and re-liquified), no change in result was observed. Thus, the 22.67 average days at sea for all scenarios was a simplification used in the unloading unit process only to calculate the energy requirements of unloading. The ocean transport unit process accounts for the true number of days at sea, and thus calculates the appropriate losses that occur at sea. The loading/unloading equipment is modeled as diesel based and the total diesel consumption is estimated by back-calculation from a literature based CO2 emission data point (Pace Global, 2015). It is assumed that the BOG re-liquefaction compressor operates on purchased grid mix electricity. Compressor specifications from literature are used to estimate the energy requirement to re-liquify 1 kg of BOG (Li & Wen, 2016). The functional unit of this process is the mass of LNG loaded or unloaded from the ocean tanker.
B.3 OCEAN TRANSPORT The ocean transport UP accounts for the operation of a tanker to transport LNG from a given export country to the import country. The UP is based on specifications for the Wartsila 50DF engine (Wärtsilä, 2018), engine driving propeller, variable speed (ME). The fuel oil and fuel gas consumption rates are equal for all 5 engine configurations identified by Wartsila, so a specific configuration was not chosen to be represented. The model calculates the laden and ballast voyage time based on ship speed and voyage length. A 2.5% volume heel is modeled for the ballast voyage (Cheniere Energy, 2018). BOG from the storage of LNG is compressed and used for fuel, with Ultra Low Sulfur Diesel (ULSD) used as the supplementary fuel. The amount of BOG generated during the laden voyage is dependent on the length of the journey (a boil-off rate of 0.1% volume/day is used (IGU, 2017)). The BOG generated during the ballast journey is taken to be 95% of the heel (i.e. most of the heel is used as energy on the return voyage, leaving only enough to keep the ship cold and ready to load). It is assumed that 100% of the available capacity is loaded onto the ship, and that 98% of the tanker capacity is usable capacity (98% before the heel)(Hasan et al., 2009). The BOG is compressed to 0.6 megapascals (MPa) gauge pressure before it is sent for combustion, as specified by the engine requirements in the product manual (Wärtsilä, 2018). The tanker is assumed to operate 24 hours per day during ocean transport. Full cruise fuel use is calculated using 100% load factors, ramp up/ramp down 75% load factor, and idling/maneuvering 50% load factor (Wärtsilä, 2018). While it is possible for BOG to be generated at any time on the ship, due to the transient conditions and uncertainty in BOR, model limitations do not allow for the estimate of these volumes over short time frames. For simplification, BOG is assumed to be generated only during ramp up/down and
LIFE CYCLE GHG PERSPECTIVE ON EXPORTING LNG FROM THE U.S. 2019 UPDATE
B-3
full cruise, and combusted only when the ship is at full cruise. Diesel is assumed to be the only fuel used during non-full cruise operations. Roundtrip travel is accounted for in this unit process (i.e., emissions reported represent total emissions generated during the laden and ballast voyage). The following assumptions were made about the ship’s operations: the ship is idling during loading and unloading times, the ship spends one day in maneuvering mode, and the ship spends one day ramping up and one day ramping down for both the laden and ballast journey (4 days total). The distance traveled during ramping up and down counts towards the total distance traveled for the journey. Distance traveled during maneuvering and idling is assumed to be negligible. Travel distances for different scenarios were calculated using SEA-DISTANCES (Sea-Distances.org, 2016). The functional unit for this unit process is taken to be the mass of LNG delivered to the regasification terminal (import terminal). This is taken to be 98% of the ship capacity, minus BOG generation during the laden voyage, minus the 2.5% volume heel that will be left on the ship for the ballast voyage.
B.4 REGASIFICATION The regasification UP accounts for the operation of a regasification terminal located in either Europe or Asia. The UP is based on Open Rack Vaporization (ORV) technology, which is utilized in ~100% of Asian and ~60% of European regasification terminals (Agarwal et al., 2017). After unloading from the ship, the LNG is placed in temporary storage for between 1.33 and 1.60 days (EIA, 2017; IGU, 2017). The BOG generated during temporary storage is assumed to be captured and re-liquefied before being sent through the ORV. The BOR is 0.02% of storage volume/day (Dobrota et al., 2013). The required energy for regasification is assumed to be sourced from grid mix electricity. In ORV, the LNG is passed through a heat exchanger with sea water. Emissions results account for emissions from fugitives. Combustion emissions are accounted for in a separate combustion UP. The functional unit of this unit process is the mass of LNG that is regasified.

This page intentionally left blank.

LIFE CYCLE GHG PERSPECTIVE ON EXPORTING LNG FROM THE U.S. 2019 UPDATE
C-1
APPENDIX C: FLOW DIAGRAMS Note: The energy flows shown in the following flow diagrams represent energy flows specifically modeled in the LNG analysis. Other unit processes require energy, but have the energy requirements accounted for within the unit process and thus contain the GHGs from energy use.
C.1 U.S./REGIONAL LIQUEFIED NATURAL GAS
C.2 RUSSIAN NATURAL GAS

LIFE CYCLE GHG PERSPECTIVE ON EXPORTING LNG FROM THE U.S. 2019 UPDATE
C-2
C.3 REGIONAL COAL

LIFE CYCLE GHG PERSPECTIVE ON EXPORTING LNG FROM THE U.S. 2019 UPDATE
D-1
APPENDIX D: REFERENCES Agarwal, R., Rainey, T., Rahman, S., Steinberg, T., Perrons, R., Brown, R. 2017. LNG Regasification
Terminals: The Role of Geography and Meteorology on Technology Choices. Energies, 10(12), 2152.
Cheniere Energy. 2018. Personal Communication. U.S. Department of Energy, National Energy Technology Laboratory. December 21, 2018.
Dobrota, D., Lalic, B., Komar, I. 2013. Problem of Boil-off in LNG Supply Chain Transactions in Maritime Science, 2, 91-100.
EIA. 2017. U.S. liquefied natural gas exports have increased as new facilities come online. U.S. Energy Information Administration. https://www.eia.gov/todayinenergy/detail.php?id=34032 Accessed November 20.
EPA. 1996. Methane Emissions from the Natural Gas Industry, Volume 6: Vented and Combustion Source Summary. U.S. Environmental Protection Agency National Risk Management Research Laboratory. June 1996. EPA - 600/R-96-080f. https://www.epa.gov/sites/production/files/2016-08/documents/6_vented.pdf. Research Triangle Park, NC.
Hasan, M.M.F., Zheng, A.M., Karimi, I.A. 2009. Minimizing Boil-Off Losses in Liquefied Natural Gas Transportation. Ind. Eng. Chem. Res., 48(21), 9571-9580.
IGU. 2017. 2017 World LNG Report. International Gas Union. https://www.igu.org/sites/default/files/103419-World_IGU_Report_no%20crops.pdf. Barcelona, Spain.
Li, Y., Wen, M. 2016. Boil-Off Gas Two-Stage Compression and Recondensation Process at a Liquefied Natural gas Receiving Terminal. Chemical Engineering & Technology, 40, 18-27.
Mallapragada, D.S., Reyes-Bastida, E., Roberto, F., McElroy, E.M., Veskovic, D., Laurenzi, I.J. 2018. Life cycle greenhouse gas emissions and freshwater consumption of liquefied Marcellus shale gas used for international power generation. Journal of Cleaner Production, 205, 672-680.
Pace Global. 2015. LNG and Coal Life Cycle Assessment of Greenhouse Gas Emissions. Pace Global, A Siemens Business. October, 2015. http://www.paceglobal.com/wp-content/uploads/2015/10/LNG-and-Coal-Life-Cycle-Assessment-of-Greenhouse-Gas-Emissions.pdf. Fairfax, VA.
Sea-Distances.org. 2016. Sea-Distances. https://sea-distances.org/. Accessed September, 27, 2018.
Smith, T., Doong, S. 2016. Selective C5+ removal for lean feed gas. LNG Industry. February 2016. 15-20. https://www.uop.com/wp-content/uploads/2015/02/LNG-Industry-Article_Selective-C5-Removal-for-Lean-Feed-Gas.pdf. Surrey, England.
Wärtsilä, Corporation. 2018. Wartsila 50DF. June, 2018. https://cdn.wartsila.com/docs/default-source/product-files/engines/df-engine/product-guide-o-e-w50df.pdf?sfvrsn=9. Vaasa, Finland.

Timothy J. Skone, P.E. [email protected]
Selina Roman-White [email protected]
www.netl.doe.gov Albany, OR • Anchorage, AK • Morgantown, WV • Pittsburgh, PA • Sugar Land, TX
(800) 553-7681