Life Cycle GHG Emission Study on the Use of LNG as Marine Fuel
158
Life Cycle GHG Emission Study on the Use of LNG as Marine Fuel On behalf of SEA\LNG and SGMF Final Report
Transcript of Life Cycle GHG Emission Study on the Use of LNG as Marine Fuel

Life Cycle GHG Emission Study on the Use of LNG as Marine Fuel
On behalf of SEA\LNG and SGMF
Final Report

Life Cycle GHG Emission Study on the Use of LNG as Marine Fuel v1.0 2 of 154
Client: SEA\LNG Limited, and Society for Gas as a Marine Fuel Limited (SGMF)
Title: Life Cycle GHG Emission Study on the Use of LNG as Marine Fuel
Report version: V1.0
Report date: 10/04/2019
© thinkstep AG
On behalf of thinkstep AG and its subsidiaries
Document prepared by
Dr. Oliver Schuller Principal Consultant,
10/04/2019
[email protected] phone +49-711-341817-0
Team lead Energy & Mobility
Stefan Kupferschmid
Jasmin Hengstler
Simon Whitehouse
Quality assurance by
Alexander Stoffregen Senior Consultant
10/04/2019
Under the supervision of
Jan Poulsen CEO
This report has been prepared by thinkstep with all reasonable skill and diligence within the terms and conditions of the
contract between thinkstep and the client. thinkstep is not accountable to the client, or any others, with respect to any
matters outside the scope agreed upon for this project.
Regardless of report confidentiality, thinkstep does not accept responsibility of any nature to any third parties to whom
this report, or any part thereof, is made known. Any such party relies on the report at its own risk. Interpretations,
analyses, or statements of any kind made by a third party and based on this report are beyond thinkstep’s responsibility.
If you have any suggestions, complaints, or any other feedback, please contact us at [email protected].

Life Cycle GHG Emission Study on the Use of LNG as Marine Fuel v1.0 3 of 154
SEA\LNG Consortium Partners
SGMF Consortium Partners
Consortium Partners

Life Cycle GHG Emission Study on the Use of LNG as Marine Fuel v1.0 4 of 154

Life Cycle GHG Emission Study on the Use of LNG as Marine Fuel v1.0 5 of 154
Consortium Partners ........................................................................................................................... 3
Table of Contents ................................................................................................................................ 5
List of Figures ...................................................................................................................................... 9
List of Tables ..................................................................................................................................... 12
List of Acronyms ................................................................................................................................ 16
Glossary ............................................................................................................................................ 19
About thinkstep .................................................................................................................................. 21
Executive Summary .......................................................................................................................... 22
1. Introduction ................................................................................................................................ 31
1.1. Background ....................................................................................................................... 31
1.2. Motivation .......................................................................................................................... 32
2. Goal of the Study ....................................................................................................................... 33
2.1. Goal of the Study ............................................................................................................... 33
2.2. Reasons for Carrying out the Study .................................................................................. 33
2.3. Intended Application .......................................................................................................... 33
2.4. Intended Audience............................................................................................................. 34
3. General Scope of the Study ...................................................................................................... 35
3.1. Overview on Different Product Systems............................................................................ 35
3.2. Tasks ................................................................................................................................. 37
3.3. Selection of the Impact Category ...................................................................................... 38
3.4. Selection of Local Pollutants – Air Quality ........................................................................ 39
3.5. Interpretation to be used ................................................................................................... 40
3.6. Data Quality Requirements ............................................................................................... 40
3.7. Software and Databases ................................................................................................... 41
3.8. Critical Review ................................................................................................................... 41
4. Well-to-Tank Analysis ................................................................................................................ 42
4.1. Well-to-Tank – Scope of the Study.................................................................................... 42
4.1.1. Product System ......................................................................................................... 42
4.1.2. Product Function and Functional Unit ....................................................................... 42
4.1.3. System Boundary of the LNG Supply ........................................................................ 42
4.1.4. System Boundary of the Oil-based Marine Fuel Supply ........................................... 46
Table of Contents
Life Cycle GHG Emission Study on the Use of LNG as Marine Fuel v1.0 6 of 154
4.1.5. Multifunctional Processes and Allocation Rules ........................................................ 48
4.1.6. Cut-off Criteria ........................................................................................................... 48
4.2. Well-to-Tank – Inventory Analysis ..................................................................................... 49
4.2.1. Data Collection Procedure ........................................................................................ 49
4.2.2. Inventory Analysis of the LNG Supply ....................................................................... 49
4.2.3. Inventory Analysis of the Oil-based Marine Fuel Supply ........................................... 50
4.2.4. Background Data ....................................................................................................... 50
4.2.5. The GHG Models in the GaBi Software System ....................................................... 50
4.3. Well-to-Tank – GHG Emissions ........................................................................................ 52
4.3.1. Well-to-Tank GHG Emissions of LNG ....................................................................... 52
4.3.2. Well-to-Tank GHG Emissions of Oil-Based Marine Fuels ......................................... 54
4.4. Well-to-Tank – Comparison with Other Studies ................................................................ 56
5. Tank-to-Wake Analysis ............................................................................................................. 58
5.1. Tank-to-Wake – Scope of the Study ................................................................................. 58
5.1.1. Product System ......................................................................................................... 58
5.1.2. Product Function and Functional Unit ....................................................................... 58
5.1.3. System Boundary ...................................................................................................... 58
5.1.4. Multifunctional Processes and Allocation Rules ........................................................ 62
5.1.5. Cut-off Criteria ........................................................................................................... 62
5.2. Tank-to-Wake – Inventory Analysis ................................................................................... 63
5.2.1. Data Collection Procedure ........................................................................................ 63
5.2.2. Tank-to-Wake – Inventory Analysis ........................................................................... 64
5.2.3. Background Data ....................................................................................................... 70
5.2.4. The GHG model in the GaBi Software System ......................................................... 70
5.3. Tank-to-Wake – Local Pollutant Emissions of Marine Fuels ............................................. 71
5.3.1. Tank-to-Wake – Local Pollutant Emissions 2-stroke Slow Speed Engines .............. 71
5.3.2. Tank-to-Wake – Local Pollutant Emissions 4-stroke Medium Speed Engine ........... 72
5.3.3. Tank-to-Wake – Local Pollutant Emissions 4-stroke High Speed Engine ................ 72
5.3.4. Tank-to-Wake – Local Pollutant Emissions Gas Turbine .......................................... 73
6. Well-to-Wake Analysis .............................................................................................................. 74
6.1. Well-to-Wake – Scope of the Study .................................................................................. 74
6.1.1. Product System ......................................................................................................... 74
6.1.2. Product Functions and Functional Unit ..................................................................... 74
6.1.3. System Boundary ...................................................................................................... 74
6.2. Well-to-Wake – Inventory Analysis .................................................................................... 75
6.3. Well-to-Wake – GHG Emissions of Current Marine Fuels ................................................ 75

Life Cycle GHG Emission Study on the Use of LNG as Marine Fuel v1.0 7 of 154
6.3.1. Well-to-Wake – GHG Emissions - 2-stroke Slow Speed Engine .............................. 75
6.3.2. Well-to-Wake – GHG Emissions - 4-stroke Medium Speed Engine ......................... 78
6.3.3. Well-to-Wake – GHG Emissions - 4-stroke High Speed Engine ............................... 79
6.3.4. Well-to-Wake – GHG Emissions - Gas Turbines ...................................................... 81
6.4. Theoretical Benefits for the Global Ship Fleet by introducing LNG ................................... 82
6.5. Well-to-Wake – GHG Emissions of post-2020 Marine Fuels ............................................ 83
6.5.1. Well-to-Wake – GHG Emissions - 2-stroke Slow Speed Engine .............................. 83
6.5.2. Well-to-Wake – GHG Emissions - 4-stroke Medium Speed Engine ......................... 85
6.6. Well-to-Wake – GHG Emissions in Comparison with Other Studies ................................ 86
6.7. Well-to-Wake – Scenario Analysis .................................................................................... 87
6.8. Well-to-Wake – Sensitivity Analysis .................................................................................. 89
6.8.1. Well-to-Wake – Sensitivity Analysis on Impact Categories for LNG ......................... 89
6.8.2. Well-to-Wake – Sensitivity Analysis on Technical Parameters for LNG ................... 90
6.8.3. Well-to-Wake – Sensitivity Analysis on Technical Parameters for HFO2.5 ................ 92
6.9. Well-to-Wake – Uncertainty Analysis ................................................................................ 93
7. Outlook - Renewable LNG Supply Sources .............................................................................. 96
8. Interpretation ............................................................................................................................. 99
8.1. Identification of Relevant Findings .................................................................................... 99
8.2. Assumptions and Limitations ........................................................................................... 102
8.3. Data Quality Assessment ................................................................................................ 104
8.3.1. Precision and Completeness ................................................................................... 104
8.3.2. Consistency and Reproducibility ............................................................................. 105
8.3.3. Representativeness ................................................................................................. 105
8.4. Model Completeness and Consistency ........................................................................... 106
8.4.1. Completeness .......................................................................................................... 106
8.4.2. Consistency ............................................................................................................. 106
9. Conclusions, and Recommendations ...................................................................................... 107
9.1. Conclusions ..................................................................................................................... 107
9.2. Recommendations........................................................................................................... 108
References ...................................................................................................................................... 111
Annex A : Natural Gas and LNG ..................................................................................................... 116
Annex B : Default Values and Conversion Factors ......................................................................... 117
Annex C : Well-to-Tank - Scope of the Study ................................................................................. 121
Annex D : Well-to-Tank - Inventory Analysis ................................................................................... 126
Annex E : Data Sources and Data Quality ...................................................................................... 135

Life Cycle GHG Emission Study on the Use of LNG as Marine Fuel v1.0 8 of 154
Annex F : Well-to-Tank - GHG Emissions ....................................................................................... 140
Annex G : Well-to-Wake GHG Emissions ....................................................................................... 144
Annex H : Sensitivity Analysis on Technical Parameters ................................................................ 151
Annex I : Critical Review Statement ................................................................................................ 154
Life Cycle GHG Emission Study on the Use of LNG as Marine Fuel v1.0 9 of 154
Figure 3-1: Overview – Well-to-Tank, Tank-to-Wake and Well-to-Wake analysis of LNG [9] ........ 35
Figure 4-1: Well-to-Tank analysis – LNG supply [9]........................................................................ 43
Figure 4-2: Well-to-Tank analysis – Oil-based marine fuel supply [9] ............................................. 47
Figure 4-3: Data collection procedure applied by thinkstep [26] ..................................................... 49
Figure 4-4: GaBi screenshot of the Liquefied Natural Gas Mix (LNG) Mix as modelled (Sankey
diagram) (Example: Europe) [26] .................................................................................. 51
Figure 4-5: Well-to-Tank – GHG Emissions: Global LNG supply – breakdown by main process
steps [23] ...................................................................................................................... 52
Figure 4-6: Well-to-Tank – GHG Emissions: Global LNG supply – breakdown by main
individual emissions [23] ............................................................................................... 53
Figure 4-7: Well-to-Tank – GHG Emissions: Current global oil-based marine fuel supply -
breakdown by main process steps [23] ........................................................................ 54
Figure 4-8: Well-to-Tank – GHG Emissions: Global oil-based marine fuel supply “post-2020” - breakdown by main process steps [23] ...................................................................... 55
Figure 5-1: Fuel used in marine engines in the year 2015; breakdown by residual and distillate
fuels and different engine technologies, based on [17] ................................................ 60
Figure 5-2: GaBi screenshot of the combustion as modelled (Sankey diagram) (Example: 2-
stroke slow speed Diesel-DF engine) [26] .................................................................... 71
Figure 6-1: Well-to-Wake analysis – LNG supply and combustion [9] ............................................ 74
Figure 6-2: GaBi screenshot of the WtW process as modelled (Sankey diagram) (Example:
combustion and supply for the 2-stroke slow speed Diesel-DF engine) [26] ............... 75
Figure 6-3: Well-to-Wake - GHG emissions of 2-stroke slow speed engines - breakdown by
fuel supply and combustion [23] ................................................................................... 76
Figure 6-4: Well-to-Wake - GHG emissions of 2-stroke slow speed engines - breakdown by
main individual emissions [23] ...................................................................................... 77
Figure 6-5: Well-to-Wake - GHG emissions of 4-stroke medium speed engines - breakdown
by fuel supply and combustion [23] .............................................................................. 78
Figure 6-6: Well-to-Wake - GHG emissions of 4-stroke medium speed engines - breakdown
by main individual emissions [23] ................................................................................. 79
Figure 6-7: Well-to-Wake - GHG emissions of 4-stroke high speed engines - breakdown by
fuel supply and combustion [23] ................................................................................... 80
Figure 6-8: Well-to-Wake - GHG emissions of 4-stroke high speed engines - breakdown by
main individual emissions [23] ...................................................................................... 80
Figure 6-9: Well-to-Wake - GHG emissions of gas turbines in simple cycle (top) and combined
cycle (bottom) breakdown by fuel supply and combustion [23] .................................... 81
Figure 6-10: Well-to-Wake - GHG emissions of gas turbines in simple cycle (top) and combined
cycle (bottom) breakdown by main individual emissions [23] ....................................... 82
Figure 6-11: WtW GHG emissions of post-2020 fuels used in 2-stroke slow speed engines [23]
...................................................................................................................................... 84
List of Figures

Life Cycle GHG Emission Study on the Use of LNG as Marine Fuel v1.0 10 of 154
Figure 6-12: WtW GHG emissions of post-2020 fuels used in 4-stroke medium speed engines
[23] ................................................................................................................................ 85
Figure 6-13: Impact of different characterisation factors (relative) on the WtW GHG emissions
of 4-stroke medium speed engines when using LNG as fuel compared with IPCC,
AR5, GWP100 (= 100 %) and oil-based fuel operation (HFO2.5) shown as vertical
marks [23] ..................................................................................................................... 90
Figure 6-14: Sensitivity analysis on selected parameters from the WtW GHG model of LNG 4-
stroke medium speed Otto-SI [23] ................................................................................ 92
Figure 6-15: Sensitivity analysis on selected parameters from the WtW GHG model of HFO2.5
4-stroke medium speed Diesel [23] .............................................................................. 93
Figure 6-16: Uncertainty Analysis - Monte-Carlo simulation for the LNG 4-stroke medium speed
Otto-SI engine - distribution of results, calculated with the GaBi software system
[23] ................................................................................................................................ 94
Figure 6-17: Uncertainty Analysis - Monte-Carlo simulation for the HFO2.5 4-stroke medium
speed Diesel engine - distribution of results, calculated with the GaBi software
system [23] .................................................................................................................... 95
Figure 7-1: WtW GHG emissions of current and future LNG sources used in 2-stroke slow
speed engines [23] ........................................................................................................ 97
Figure 7-2: WtW GHG emissions of current and future LNG sources used in 4-stroke medium
speed engines [23] ........................................................................................................ 98
Figure 7-3: WtW GHG emissions of current and future LNG sources used in 4-stroke high
speed engines [23] ........................................................................................................ 98
Figure C-1: Global Liquefied Natural Gas (LNG) consumption mix 2017 as used in this study
[32] [76] [23] ................................................................................................................ 123
Figure C-2: Global crude oil consumption mix as used in this study [77] [78] [23] ........................ 125
Figure F-1: Well-to-Tank – GHG Emissions: LNG supply (global and regions) – breakdown by
main process steps [23] .............................................................................................. 140
Figure F-2: Well-to-Tank – GHG Emissions: LNG supply (global and regions) – breakdown by
main individual emissions [23] .................................................................................... 141
Figure F-3: Well-to-Tank – GHG Emissions: Current oil-based marine fuel supply (global and
regions) – breakdown by main process steps [23] ..................................................... 142
Figure F-4: Well-to-Tank – GHG Emissions: Oil-based marine fuel supply “post-2020” (global and regions) – breakdown by main process steps [23] .............................................. 143
Figure G-1: Impact of different characterisation factors (relative) on the WtW GHG emissions
of 2-stroke slow speed engines when using LNG compared with IPCC, AR5,
GWP100 (= 100 %) and oil-based fuel operation (HFO2.5) shown as vertical marks
[23] .............................................................................................................................. 144
Figure G-2: Impact of different characterisation factors (relative) on the WtW GHG emissions
of 4-stroke high speed engines when using LNG compared with IPCC, AR5,
GWP100 (= 100 %) and oil-based fuel operation (MGO0.1) shown as vertical marks
[23] .............................................................................................................................. 145
Figure G-3: Well-to-Wake - GHG emissions of 2-stroke slow speed engines (Tier II) [23] ........... 146
Figure G-4 Well-to-Wake - GHG emissions of 4-stroke medium speed engines (Tier II) [23]...... 146
Figure G-5: Well-to-Wake - GHG emissions of 4-stroke high speed engines (Tier II) [23] ............ 147
Figure G-6: Well-to-Tank – GHG Emissions: Other marine fuel supply [23] ................................. 148

Life Cycle GHG Emission Study on the Use of LNG as Marine Fuel v1.0 11 of 154
Figure G-7: WtW GHG emissions of 2-stroke slow speed engines using Methanol and LPG
[23] .............................................................................................................................. 149
Figure G-8: WtW GHG emissions of 4-stroke medium speed engines using Methanol [23] .......... 150
Figure H-1: Sensitivity analysis on selected parameters from the WtW GHG model of LNG 2-
stroke slow speed Diesel-DF [23] ............................................................................... 151
Figure H-2: Sensitivity analysis on selected parameters from the WtW GHG model of LNG 2-
stroke slow speed Otto-DF [23] .................................................................................. 151
Figure H-3: Sensitivity analysis on selected parameters from the WtW GHG model of LNG 4-
stroke medium speed Otto-DF [23] ............................................................................. 152
Figure H-4: Sensitivity analysis on selected parameters from the WtW GHG model of LNG 4-
stroke high speed Otto-SI [23] .................................................................................... 152
Figure H-5: Sensitivity analysis on selected parameters from the WtW GHG model of HFO2.5
2-stroke slow speed Diesel [23] .................................................................................. 153

Life Cycle GHG Emission Study on the Use of LNG as Marine Fuel v1.0 12 of 154
Table 3-1: Overview on current and post-2020 marine fuels considered in this study .................. 36
Table 3-2: Overview of engines technologies and fuels investigated ............................................ 37
Table 3-3: Members of critical review panel .................................................................................. 41
Table 4-1: System boundary – included and excluded elements or activities ............................... 45
Table 4-2: Allocation factors for purification step based on energy content (based on mass
for comparison) [23] ...................................................................................................... 48
Table 4-3: Well-to-Tank – GHG Emissions: Global LNG supply – breakdown by main process
steps [23] ...................................................................................................................... 53
Table 4-4: Well-to-Tank – GHG Emissions: Global LNG supply – breakdown by main
individual emissions [23] ............................................................................................... 53
Table 4-5: WtT - GHG Emissions: LNG supply - benchmarking (GHG IPCC - AR5) [23] ............. 56
Table 4-6: WtT - GHG Emissions: LNG supply - benchmarking (GHG IPCC – AR4) [23] ............ 57
Table 5-1: System boundary for Tank-to-Wake analysis ............................................................... 59
Table 5-2: Clustered engine technology overview by fuel type ..................................................... 62
Table 5-3: Overview of the collected datasets of the engine manufacturers separated in fuel
and engine technology .................................................................................................. 63
Table 5-4: Energy consumption for auxiliary services needed to run the main ship engine [48]
[49] [50] [51] [52] [53] [54] [55] ...................................................................................... 65
Table 5-5: N2O Emissions factor per fuel [56] ................................................................................ 65
Table 5-6: Assumptions for Tier III (ECA) operation with oil-based marine fuels based on data
from [50] and [51] .......................................................................................................... 66
Table 5-7: Resulting fuel consumption and emission altering due to the operation of an open-
loop EGCS when running on HFO [58]......................................................................... 66
Table 5-8: Tier III fuel consumption and emission data (primary) for 2-stroke slow speed
engines based on the IMO E2/E3 cycle [53], [49], (est. = estimated) .......................... 68
Table 5-9: Tier III fuel consumption and emission data (primary) for 4-stroke medium speed
engines based on the IMO E2/E3 cycle [49], [54], [51] (est. = estimated) ................... 68
Table 5-10: Tier III fuel consumption and emission data (primary) for 4-stroke high speed
engines based on the IMO E2/E3 cycle [50] ................................................................ 69
Table 5-11: Tier III fuel consumption and emission data (primary) for simple cycle gas turbines
(GT) based on the average of 75 and 100 % engine load [48], [52] ............................ 70
Table 5-12: Tier III fuel consumption and emission data (primary) for combined cycle gas
turbines (CCGT) based on the average of 75 and 100 % engine load [48], [52] ......... 70
Table 5-13: Tank-to-Wake - Local pollutant emissions of 2-stroke slow speed engines [23],
[53], [49] (est. = estimated) ........................................................................................... 72
Table 5-14: Tank-to-Wake - Local pollutant emissions of 4-stroke medium speed engines [23],
[49], [54], [51] (est. = estimated) ................................................................................... 72
Table 5-15: Tank-to-Wake - Local pollutant emissions of 4-stroke high speed engines [23],
[50] ................................................................................................................................ 73
List of Tables

Life Cycle GHG Emission Study on the Use of LNG as Marine Fuel v1.0 13 of 154
Table 5-16: Tank-to-Wake - Local pollutant emissions of simple cycle gas turbines based on
the average of 75 and 100 % engine load [23], [48], [52] ............................................. 73
Table 5-17: Tank-to-Wake - Local pollutant emissions of combined cycle gas turbines based
on the average of 75 and 100 % engine load [23], [48], [52] ........................................ 73
Table 6-1: Contribution of methane emissions to WtW GHG emissions of 2-stroke slow
speed engines [23] ........................................................................................................ 77
Table 6-2: Contribution of methane emissions to WtW GHG emissions of 4-stroke medium
speed engines [23] ........................................................................................................ 79
Table 6-3: Contribution of methane emissions to WtW GHG emissions of 4-stroke high speed
engines [23] .................................................................................................................. 81
Table 6-4: Contribution of methane emissions to WtW GHG emissions of gas turbines [23] ....... 82
Table 6-5: GHG benefit (theoretically) of using LNG at the global ship fleet [17], [23] .................. 83
Table 6-6: GHG reduction of LNG powered 2-stroke slow speed engines compared with
operation with different oil-based fuels [23] .................................................................. 84
Table 6-7: GHG reduction of LNG powered 4-stroke medium speed engines compared with
operation with different oil-based fuels [23] .................................................................. 85
Table 6-8: Potential WtW GHG reduction by the optimisation and reduction of methane slip
compared with the LNG base case (Figure 6-4 and Figure 6-6) [23] ........................... 89
Table 6-9: Uncertainty Analysis - Monte-Carlo simulation for LNG 4-stroke medium speed
Otto-SI engine - defined variances [23] ........................................................................ 93
Table 6-10: Uncertainty Analysis - Monte-Carlo simulation for LNG 4-stroke medium speed
Otto-SI engine - results [23] .......................................................................................... 94
Table 6-11: Uncertainty Analysis - Monte-Carlo simulation for HFO2.5 4-stroke medium speed
Diesel engine - defined variances [23].......................................................................... 95
Table 6-12: Uncertainty Analysis - Monte-Carlo simulation for HFO2.5 4-stroke medium speed
Diesel engine - results [23] ........................................................................................... 95
Table B-1: Emission factors of different IPCC characterisation schemes [15], [18] ..................... 117
Table B-2: IMO NOX limits as defined in MARPOL Annex VI regulation 13 [72] ......................... 117
Table B-3: IMO limits on the sulphur content of marine fuels as defined in MARPOL Annex VI
regulation 14 [73] ........................................................................................................ 118
Table B-4: Weighting factors for the IMO E2/E3 cycle for constant speed main propulsion
engines [74] ................................................................................................................ 118
Table B-5: Natural Gas and Liquefied Natural Gas (LNG) properties and default values [75]
[3], [14]. ....................................................................................................................... 119
Table B-6: Other fuel properties and default values [75] [3], [14]. ................................................ 120
Table B-7: Sulphur content and API gravity of region-specific crude oil [14], [39] ....................... 120
Table C-1: Liquefied Natural Gas (LNG) consumption mixes 2017 per region as used in this
study [32] [76] [23] ...................................................................................................... 122
Table C-2: Crude oil consumption mixes per region as used in this study [77] [78] [23] ............. 124
Table D-1: Energy use (LHV) and gas losses for conventional gas production & processing
[13] [14] ....................................................................................................................... 126
Table D-2: Energy use (LHV) and gas losses for conventional gas production & processing
[13] [14] (continued) .................................................................................................... 126
Table D-3: Energy use (LHV) and gas losses for unconventional gas production and
processing [14] [27] [28] [29] ...................................................................................... 127

Life Cycle GHG Emission Study on the Use of LNG as Marine Fuel v1.0 14 of 154
Table D-4: Distance, kind of pipeline, energy use (LHV) and gas losses for gas transport from
the gas production and processing fields to liquefaction plants [14] .......................... 127
Table D-5: Distance, kind of pipeline, energy use (LHV) and gas losses for gas transport from
the gas production and processing fields to liquefaction plants [14] (continued) ....... 127
Table D-6: Technology mix of liquefaction (weighted by installed capacity) based on [32] ......... 128
Table D-7: Technology mix of liquefaction (weighted by installed capacity) based on [32]
(continued) .................................................................................................................. 128
Table D-8: Average annual ambient temperature, and CCS [14] ................................................. 128
Table D-9: Average annual ambient temperature, and CCS [14] (continued) ............................. 128
Table D-10: Energy use (LHV), boil-off gas rate and recovery for gas purification and
liquefaction [14] ........................................................................................................... 129
Table D-11: Energy use (LHV), boil-off gas rate and recovery for gas purification and
liquefaction [14] (continued) ........................................................................................ 129
Table D-12: Global market share of propulsion types of <125,000 m³ LNG carriers (related to
vessel capacities) in 2017, own calculations based on IGU [32] ................................ 130
Table D-13: Global market share of propulsion types of 125,000 to 180,000 m³ LNG carriers
(related to vessel capacities) in 2017, own calculations based on IGU [32] .............. 130
Table D-14: Global market share of propulsion types of >180,000 m³ LNG carriers (related to
vessel capacities) in 2017, own calculations based on IGU [32] ................................ 130
Table D-15: LNG carrier fuel consumption (LHV) and methane emissions of <125,000 m³ LNG
carriers, taken from NGVA study [13] and thinkstep’s GaBi LCI databases [14]
and crosschecked with primary data provided by Shell and Total [30] [31] ............... 131
Table D-16: LNG carrier fuel consumption (LHV) and methane emissions of >125,000 m³ LNG
carriers, taken from NGVA study [13] and thinkstep’s GaBi LCI databases [14]
and crosschecked with primary data provided by Shell and Total [30] [31] ............... 131
Table D-17: Sea distances for LNG imports from Algeria [35] and kind of transport ..................... 132
Table D-18: Sea distances for LNG imports from Australia [35] and kind of transport .................. 132
Table D-19: Sea distances for LNG imports from Indonesia [35] and kind of transport ................. 132
Table D-20: Sea distances for LNG imports from Malaysia [35] and kind of transport .................. 132
Table D-21: Sea distances for LNG imports from Nigeria [35] and kind of transport ..................... 132
Table D-22: Sea distances for LNG imports from Norway [35] and kind of transport .................... 133
Table D-23: Sea distances for LNG imports from Qatar [35] and kind of transport ....................... 133
Table D-24: Sea distances for LNG imports from Trinidad and Tobago [35] and kind of
transport ...................................................................................................................... 133
Table D-25: Sea distances for LNG imports from the USA [35] and kind of transport ................... 133
Table D-26: Energy use (LHV) and methane losses for LNG terminal operations and maritime
bunkering (ship-to-ship) [14], [30] ............................................................................... 134
Table D-27: Electricity grid mix datasets used for the modelling of LNG terminal operations
and maritime bunkering [14] ....................................................................................... 134
Table D-28: Distance covered, fuel consumption (LHV) and methane emissions of LNG bunker
barge, taken from NGVA study [13] and thinkstep’s GaBi LCI databases [14] and
crosschecked with primary data provided by Shell and Total [30] [31] ...................... 134
Table E-1: Overview on data sources and data quality of the foreground system of the LNG
WtW analyses ............................................................................................................. 135

Life Cycle GHG Emission Study on the Use of LNG as Marine Fuel v1.0 15 of 154
Table E-2: Overview on data sources and data quality of the foreground system of the oil-
based marine fuels WtW analyses ............................................................................. 136
Table E-3: Key electricity datasets used for background system, obtained from thinkstep’s GaBi LCI databases 2018 [14] .................................................................................... 137
Table E-4: Other key datasets used for background system, obtained from thinkstep’s GaBi
LCI databases 2018 [14] ............................................................................................. 138
Table E-5: Overview on proxy data used ..................................................................................... 139
Table F-1: Well-to-Tank – GHG Emissions: LNG supply (global and regions) – breakdown by
main process steps [23] .............................................................................................. 140
Table F-2: Well-to-Tank – GHG Emissions: LNG supply (global and regions) – breakdown by
main individual emissions [23] .................................................................................... 141
Table G-1: Overview on other marine fuels considered in this study ........................................... 148
Table G-2: Tier II fuel consumption data (primary) for 2- and 4-stroke engines running on LPG
and Methanol based on the IMO E2/E3 cycle [71], [54] ............................................. 149

Life Cycle GHG Emission Study on the Use of LNG as Marine Fuel v1.0 16 of 154
AR Assessment Report
BC Black Carbon
BOG Boil-Off Gas
BAT Best Available Techniques
BREF Best Available Techniques Reference Document
CCGT Combined Cycle Gas Turbine
CCS Carbon Capture and Storage
CF Carbon Footprint
CH4 Methane
CHP Combined Heat and Power
CI Compression Ignited Engine
Cm Cubic Metre
CO2 Carbon Dioxide
CO2-eq. Carbon Dioxide Equivalent
DF Dual Fuel
DFDE Dual-Fuel Diesel Electric Propulsion (e.g., installed at LNG Carrier)
DSI Data Source Indicator (labelling primary, calculated, literature or estimated data)
E2 Cycle Emission Test Cycles (ISO 8178)
E3 Cycle Emission Test Cycles (ISO 8178)
ECA Emission Control Area
EEDI Energy Efficiency Design Index
EGCS Exhaust Gas Cleaning System (Scrubbers)
EGR Exhaust Gas Recirculation
EoL End of Life
EU European Union
EU-28 European Union with its 28 Member States
FQD Fuel Qualitative Directive
g CH4 Gram Methane Emissions
g CO2-eq Gram Carbon Dioxide-Equivalent Emissions
GaBi dt. “Ganzheitliche Bilanzierung”, engl. Life Cycle Engineering Software
GHG Greenhouse Gas(es)
GTP100 Global Temperature Change Potential at a 100-Year Time Horizon
List of Acronyms

Life Cycle GHG Emission Study on the Use of LNG as Marine Fuel v1.0 17 of 154
GWP20 Global Warming Potential at a 20-Year Time Horizon
GWP100 Global Warming Potential at a 100-Year Time Horizon
HFO Heavy Fuel Oil
HFO2.5 Heavy Fuel Oil with a Sulphur Content of 2.5 wt.%
HFO>2.5 Heavy Fuel Oil with a Sulphur Content of more than 2.5 wt.%
HHV Higher Heating Value
HS High Speed
HSD High Speed Diesel
H2S Hydrogen Sulphide
ICCT International Council on Clean Transportation
IEA International Energy Agency
IGU International Gas Union
ILCD International Reference Life Cycle Data System (developed by European
Commission)
IPCC Intergovernmental Panel on Climate Change
ISO International Organization for Standardisation
J Joule
JEC Consortium of JRC, EUCAR, and CONCAWE
JRC Joint Research Centre of the European Commission
kWh Kilowatt Hour
LCA Life Cycle Assessment
LCI Life Cycle Inventory
LCIA Life Cycle Impact Assessment
LHV Lower Heating Value
LPG Liquefied Petroleum Gas
LNG Liquefied Natural Gas
LSFO0.5, Blend Low Sulphur Fuel Oil; Index refers to “Blend of Residual and Distillate Marine Fuel”
LSFO0.5, LScrude Low Sulphur Fuel Oil; Index refers to “Based on Low Sulphur Crude Oil”
m³ Cubic Metre
MAC Methane Abatement Catalyst
MGO Marine Gas Oil
MGO0.1 Marine Gas Oil with a Sulphur Content of 0.1 wt.%
MDO Marine Diesel Oil
MJ Megajoule
MS Medium Speedf
MSD Medium Speed Diesel

Life Cycle GHG Emission Study on the Use of LNG as Marine Fuel v1.0 18 of 154
MW Megawatt
NGO Non-Governmental Organisation
NGVA Natural Gas & bio Vehicle Association
NOX Nitrogen Oxides
N2O Nitrous Oxide (Laughing Gas)
OEM(s) Original Equipment Manufacturer(s)
PCF Product Carbon Footprint
PM Particulate Matter
PM10 Particulate Matter with a Diameter of 10 Micrometres or less
PM2.5 Particulate Matter with a Diameter of 2.5 Micrometres or less
ppmv Parts per Million Volume
QFlex Q-Flex is a Type of Ship Carrying Liquefied Natural Gas
rpm Revolutions per Minute (referring to the Engine Speed)
S Sulphur
SCR Selective Catalytic Reduction
SFOC Specific Fuel Oil Consumption
SEEMP Ship Energy Efficiency Management Plan
SGC Specific Gas Consumption
SI Spark Ignited Engine
SOX Sulphur Oxides
SNG Synthetic Natural Gas
SS Slow Speed
SSD Slow Speed Diesel
TFDE Tri-fuel Diesel Electric Propulsion (e.g., installed at LNG Carrier)
TJin Terajoule related to Input
ts thinkstep
TtW Tank-to-Wake
UHC Unburned Hydrocarbon
vol.% Volume Percentage
WtT Well-to-Tank
WtW Well-to-Wake
wt.% Weight Percentage

Life Cycle GHG Emission Study on the Use of LNG as Marine Fuel v1.0 19 of 154
Carbon Footprint – Carbon Intensity – GHG intensity
Total emissions of greenhouse gases (GHG) using the life cycle approach. By characterising each
single GHG emission with its individual characterisation factor, all GHG emissions can be aggregated
to calculate the Global Warming Potential (GWP), also known as GHG intensity, Carbon Intensity or
Carbon Footprint, and is expressed in CO2-equivalents (CO2-eq).
Life Cycle
A view of a product system as “consecutive and interlinked stages … from raw material acqu isition
or generation from natural resources to final disposal” (ISO 14040:2006, section 3.1). This includes
all material and energy inputs as well as emissions to air, land and water. [1]
Life Cycle Assessment (LCA)
“Compilation and evaluation of the inputs, outputs and the potential environmental impacts of a product system throughout its life cycle” (ISO 14040:2006, section 3.2). [1]
Life Cycle Inventory (LCI)
“Phase of life cycle assessment involving the compilation and quantification of inputs and outputs for
a product throughout its life cycle” (ISO 14040:2006, section 3.3). [1]
Life Cycle Impact Assessment (LCIA)
“Phase of life cycle assessment aimed at understanding and evaluating the magnitude and
significance of the potential environmental impacts for a product system throughout the life cycle of
the product” (ISO 14040:2006, section 3.4). [1]
Life Cycle Interpretation
“Phase of life cycle assessment in which the findings of either the inventory analysis or the impact assessment, or both, are evaluated in relation to the defined goal and scope in order to reach
conclusions and recommendations” (ISO 14040:2006, section 3.5). [1]
Functional Unit
“Quantified performance of a product system for use as a reference unit” (ISO 14040:2006, section 3.20). [1]
Critical Review
“Process intended to ensure consistency between a life cycle assessment and the principles and
requirements of the international standards on life cycle assessment” (ISO 14044:2006, section 3.45). [2]
Well-to-Tank (WtT), Tank-to-Wake (TtW) and Well-to-Wake (WtW) Analyses
A Well-to-Wake (WtW) analysis includes all process steps from the production of the fuel to its
combustion in engines. WtW can be divided into Well-to-Tank (WtT) describing all process steps of
the fuel supply and Tank-to-Wake (TtW) describing the combustion of the fuel. [3]
Life Cycle Assessment (LCA) versus Well-to-Wake (WtW) Analysis in this Study
This study is defined as a Life Cycle Assessment (LCA) excluding the efforts (energy and emissions)
for manufacturing, maintenance and end of life of the infrastructure such as buildings or vessels. This
Glossary

Life Cycle GHG Emission Study on the Use of LNG as Marine Fuel v1.0 20 of 154
definition is in line with the definition of a Well-to-Wake (WtW) analysis according to [3]. Therefore,
both terms are used in this study.
Foreground System
The foreground system comprises all relevant processes within the scope of the study which are
influenced by the producers or operators of the technologies under study. The goal is to model all
relevant foreground processes using measured or calculated primary data. [4]
Background System:
The background system includes all processes within the scope of the study which are not directly
influenced by the producers or operators of the technologies under study, like the supply of energy
(e.g. electricity) or additives (e.g. urea). The goal is to represent all relevant background processes
using average market consumption mixes (based on secondary data). [4]
Primary Data:
“Primary data” are measured, calculated or expert judged data based on primary information sources
of the producer or operator of the technologies under study.
Secondary Data:
The term “secondary data” does include data from literature or from thinkstep’s GaBi LCI databases,
which are mainly based on industry derived data and literature.
Consumption Mix
The fuel consumption mix of a region considers the indigenous fuel production of the member
countries of the region (if applicable) as well as the fuel imports from producing countries to the region
and fuel exports of the member countries to other countries out of the region.
Heating Value
All energy related numbers in this study are referring to the lower heating value (LHV).
Number Format
Very large and very small numbers are expressed in exponential notation in this report, e.g. 1.5E-3.
In this example, the significand 1.5 is multiplied with a fixed base of 10 and an exponent of -3,
i.e. 1.5 x 10-3 = 0.0015. Similarly, 3.5E6 refers to 3,500,000.

Life Cycle GHG Emission Study on the Use of LNG as Marine Fuel v1.0 21 of 154
thinkstep is a leading global consulting and software company in the field of sustainability and, in
particular, life cycle thinking. Originally named PE International, thinkstep has grown over the past 25
years into a trusted resource for organisations worldwide. thinkstep draws on over 2,000+ person
years of combined subject matter expertise to provide a solid foundation that informs all projects.
thinkstep works with private and government clients around the world on technical, environmental,
and economic solutions to increase the sustainability of products, processes and services.
The knowledge we have gained and the work we have performed for 8,000 clients worldwide,
including some of the world’s most respected brands, has led to new strategies, management
systems, tools and processes needed to achieve leadership in sustainability. Our services and tools
are used to drive operational excellence, product innovation, brand value and regulatory compliance.
thinkstep has created the world’s leading Life Cycle Assessment (LCA) software and databases for
use across all business sectors (www.gabi-software.com). Using international energy statistics,
thinkstep has expertise in analysing and modelling the supply chain of Natural Gas to assess
greenhouse gas emissions and other air and water pollutants. As a provider of LCA databases,
thinkstep has gathered considerable experience in modelling emissions along the entire supply chain
of Natural Gas in a multitude of countries and regions. Country-specific data for greenhouse gas
relevant parameters can be used to perform benchmarks, consistency checks and closing data gaps
when performing LCA assessments.
Our LCA data and tools are used by major engine manufacturers as well as major oil & gas
companies. In addition, thinkstep works with many public authorities and national and regional
governments, including the European Commission (EC). For instance, thinkstep has supplied a
multitude of datasets to the European Commission’s LCA data network (ILCD - see
http://eplca.jrc.ec.europa.eu/) which are also used for the product environmental footprint (PEF)
method currently being piloted by the EC.
thinkstep’s vast experience in Life Cycle Assessment, carbon footprint and Well-to-X studies covers
all relevant sectors in different geographic regions around the world, including the oil & gas industry,
electricity generation, transportation and alternative fuels (biofuels, power-to-gas, hydrogen etc.)
sectors. Numerous LCA, carbon footprint, and WtW studies, as well as economic market and
technology analyses have been performed, and recommendations developed. These have focussed
on different aspects such as conventional oil & gas production, CNG and LNG supply from various
locations, shale gas production, oil sands, heavy oils, biomethane, power-to-gas etc.
thinkstep also prepared the “GHG Intensity of Natural Gas”, study for the Natural Gas & bio vehicle
Association (NGVA) in 2017. The report is available at: http://ngvemissionsstudy.eu/.
Our consulting teams consist of about 160 experts and practitioners and provide our clients with
substantial knowledge and professional services. The project team provided for this study is well
experienced and has a proven track record in analysing the Natural Gas life cycle.
thinkstep operates offices in Berlin, Boston, Copenhagen, Johannesburg, London, Lyon, Mumbai,
Perth, Ravenna, Sheffield, Tokyo, Wellington, and Winterthur. Headquarters is in Leinfelden-
Echterdingen, Germany (close to Stuttgart).
For further information, please visit: www.thinkstep.com.
About thinkstep

Life Cycle GHG Emission Study on the Use of LNG as Marine Fuel v1.0 22 of 154
This study analyses the life cycle greenhouse gas (GHG) emissions of the use of Liquified Natural
Gas (LNG) as marine fuel compared with current and post-2020 conventional oil-based fuels. In
addition, air quality is assessed by comparing local pollutants from the operation of the vessels using
these different fuels.
Key Messages from the Study
The collaboration and support from a large number of SEA\LNG and SGMF member companies
working across the entire fuel supply chain and engine manufacturers enabled the collection of up-
to-date, quality technical data. This has provided the basis for a complete and accurate life cycle
analysis of the GHG intensity expressed in terms of CO2-equivalents. For the main GHG emissions,
the IPCC AR5 characterisation factors have been used (1 CO2, 30 CH4, 265 N2O) to assess the global
warming potential (GWP100). Methane emissions from the supply chains as well as methane released
at the ship combustion process (methane slip) have been carefully included. The comparison
between LNG and oil-based fuelled engines is performed on a 1 kWh brake power specific unit
(g CO2-eq/kWh).
The study shows that LNG provides a significant advantage in terms of improving air quality which is
particularly important in ports and coastal areas. Beyond the benefits associated with reducing air
pollutants, LNG is a viable solution to reduce GHG emissions from international shipping and to
contribute to the International Maritime Organization (IMO) GHG reduction targets. However,
methane emission from the supply chain and engine slip need to be reduced further to maximise the
positive impact on both air quality and GHG emissions.
The key messages are:
• The use of LNG as marine fuel shows GHG reduction of up to 21 % compared with current
oil-based marine fuels over the entire life cycle from Well-to-Wake (WtW). The benefit is
highly dependent on the engine technology installed and, to a certain extent, on the type of
reference fuel (distillate or residual).
• On an engine technology basis, the WtW GHG emission reduction for gas fuelled engines
compared with HFO fuelled engines are between 14 % to 21 % for 2-stroke slow speed
engines, and between 7 % to 15 % for 4-stroke medium speed engines.
• On a Tank-to-Wake (TtW) basis, the combustion process for LNG as a marine fuel shows
GHG benefits of up to 28 % compared with current oil-based marine fuels. On an engine
technology basis, the TtW emissions reduction benefits for gas fuelled engines compared
with HFO fuelled engines are between 18 to 28 % for 2-stroke slow speed engines and
between 12 to 22 % for 4-stroke medium speed engines.
• Local pollutants, such as sulphur oxides (SOX), nitrogen oxides (NOX) and particulate matter
(PM), are reduced when using LNG compared with current conventional marine fuels. Due
to the negligible amount of sulphur in the LNG fuel, SOX emissions are reduced close to zero.
NOX emissions are reduced by up to 95 % to meet the IMO Tier III limits without NOx
reduction technologies when using Otto cycle engines. Limited data on PM emissions is
available, however reductions of up to 99 % are normal compared with heavy fuel oil (HFO).
• For post-2020 oil-based marine fuels (low sulphur fuel oil (LSFO) or the use of HFO in
combination with an exhaust gas cleaning system) there is no significant difference in the
WtW GHG emissions compared with current oil-based fuels. Post-2020 gas fuelled 2-stroke
Executive Summary

Life Cycle GHG Emission Study on the Use of LNG as Marine Fuel v1.0 23 of 154
engines have advantages in the order of 14 % to 22 % (current: 14-21 %), and 4-stroke
engines between 6 % to 16 % (current: 7-15 %) compared with HFO fuelled engines.
• As a direct comparison if the global marine transport fleet for 2015 were to completely switch
to LNG then there would be a GHG emission reduction of 15 % marine GHG emissions based
upon engine technology alone.
• GHG reductions are reduced depending upon the degree of methane slip incurred during the
combustion process. High pressure 2-stroke Diesel cycle engines and marine gas turbine
propulsion units incur methane slip less than 1 % of the overall WtW GHG emissions. Low
pressure 2-stroke and 4-stroke Otto cycle reciprocating engines are sensitive to methane slip
with 10-17 % of the WtW GHG emissions resulting from unburned methane in the combustion
process.
• This study presents the current status of the industry; ongoing optimisation in supply chain
and engine technology developments will further enhance the benefits of LNG as a marine
fuel. Methane slip reduction at combustion in the engines and methane emission reduction
in the supply chain as well as further improving energy efficiency in combination with other
measures such as enhanced operational methods and speed optimisation will make a major
contribution to meeting the IMO’s GHG emissions reduction target 2050 for shipping.
• An indicative analysis showed that bioLNG and synthetic LNG can provide an additional
significant (up to 90 %) benefit in terms of WtW GHG intensity. Bio and synthetic LNG are
completely fungible with LNG derived from fossil feedstocks. For example, a blend of 20 %
bioLNG as a drop-in fuel can reduce GHG emissions by a further 13 % compared with 100%
fossil fuel LNG.
• GHG emissions of fuel supply chains differ from region to region due to a large number of
variables. Therefore, specific supply chain analyses as applied in this study have been key
in order to get to a global average GHG intensity.
Context
The international shipping industry, as other industry sectors, are under pressure to reduce
emissions. The International Maritime Organization (IMO) has announced the ambition to reduce the
GHG emissions from international shipping by at least 50% by 2050 compared with 2008. More
stringent air quality regulations, such as the IMO 2020 global sulphur cap, are also approaching.
In the light of the IMO 2020 global sulphur cap, conventional oil-based residual marine fuels will need
to either change in their specification or be replaced by alternative fuels like LNG.
While the environmental benefits of LNG as the most promising alternative marine fuel are clear in
relation to local pollutants such as sulphur oxides (SOX), nitrogen oxide (NOX), and particulate matter
(PM), various studies have demonstrated different GHG impacts from the use of LNG. These
differences have resulted from the studies using different assumptions, methodologies and data. Most
important, the studies have used different data and assumptions about methane emissions in the
LNG supply chain, and methane slip in ship engines. The end result is that there are divergent
opinions about the GHG benefits of LNG as marine fuel which in turn influence views on whether LNG
is a viable option to address GHG emissions.
Life cycle analysis of GHG emissions of LNG and oil-based marine fuels and their use is a complex
topic due to different engine technologies in operation, the different fuels bunkered and their
geographically specific supply chains. In addition, fuels and their supply chain GHG emissions may
change over time, e.g. due to the introduction of the low sulphur standards.
The marine engine market, in contrast to the road transport market for instance, comprises of a
multitude of different engine technologies for different shipping applications and power requirements.
This results in the use of different engines with 2-/4-stroke, single/dual fuel, combustion cycle,
Life Cycle GHG Emission Study on the Use of LNG as Marine Fuel v1.0 24 of 154
efficiency, exhaust gas cleaning system, etc.. Hence, gas fuelled vessels cannot be summarised by
one representative technology and propulsion and power provision system, and more differentiation
is necessary when drawing further conclusions, particularly by ship type, size and operational
parameters. Large container ships for instance, are used to transport goods from one continent to
another, and hence mainly operate in deep-sea regions, mostly with a constant engine load after
leaving the harbour. In contrast, ferries or cruise ships mainly operate in coastal areas, and may
change engine load more frequently. For smaller ships such as support vessels and tug boats, engine
response with many engine load changes is crucial. There is therefore not one single gas engine to
be considered, but rather different engines with different performance, fuel consumption and emission
characteristics.
For ocean-going shipping outside Emission Control Areas (ECAs), the fuel sulphur limit is currently
3.5 wt.%, changing to 0.5 wt.% from 2020 onwards. For shipping inside ECAs, the sulphur limit has
been 0.1 wt.% since 2015. For NOX emissions, different Tier limits (Tier I-III) apply based on the
construction date of the ship and the engine speed. For engines build from 2016 onwards, Tier III
limits apply inside Emission Control Areas (ECA). Outside these areas, Tier II limits apply.
Study Objectives
SEA\LNG and SGMF commissioned thinkstep to perform a comprehensive, industry-wide Well-to-
Wake (WtW) GHG emission analysis on the use of LNG as marine fuel. The intention was to reduce
the uncertainty regarding the GHG benefits of LNG as marine fuel as mentioned above. Special focus
was given to methane emissions. The study also investigated air quality aspects. By collecting
primary, state-of-the-art data and by the integration of an external critical review the main study
objectives were achieved.
While the analysis has been performed on a global level, it considers:
• the most common ship engine technologies in operation, taking into account the specific fuel
consumption and methane slip.
• a global average LNG supply inventory, based on ‘bottom-up’ calculations of different
regional consumption mixes, and LNG production countries.
• a differentiated view on various oil-based marine fuels, taking into account different fuel types
and specifications, as well as post-2020 sulphur limits (including exhaust gas cleaning
systems). Different regional analyses have also been carried out, analogous to the LNG
supply analysis.
In 2018, the most common marine fuels were oil-based Heavy Fuel Oil (HFO) with a global average
sulphur content of 2.5 wt. % and Marine Gas Oil (MGO) with 0.1 wt. % sulphur, which is primarily
used in ECAs. HFO made up more than 75 % of the marine fuels followed by MGO with around 20 %.
As mentioned, the upcoming more stringent air quality regulations relating to SOX and NOX, will
change the marine fuel portfolio.
Today, it is not known how refiners will provide marine fuel that will comply with the IMO 2020 sulphur
regulations for global fuels with a maximum of 0.5 wt.% sulphur. Fuel makers are likely to treat the
fuel to reduce the sulphur, or blend it with ultra-low sulphur fuel oil, e.g. blending hydro-treated
residuals, heavy fractions from hydrocrackers and lighter hydro-treated fractions or blending it with
low sulphur MGO. Other options to obtain a 0.5 wt. % sulphur content fuel include the usage of a low
sulphur crude oil feedstock. There will be a wide variability of fuel oil quality depending on input crude,
refining process, blend strategy, and region.
Based on the available information and considerations of likely future actions, the project consortium
defined the following current and “post-2020” fuels for consideration in this study:

Life Cycle GHG Emission Study on the Use of LNG as Marine Fuel v1.0 25 of 154
Current fuels considered:
• Liquefied Natural Gas (LNG)
• Marine Gas Oil (MGO) as distillate marine fuel with a sulphur content of 0.1 wt. %
• Heavy Fuel Oil (HFO) as residual marine fuel with an average sulphur content of 2.5 wt. %
(global average)
Post 2020 fuels considered:
• Liquefied Natural Gas (LNG)
• Marine Gas Oil (MGO) as distillate marine fuel with a sulphur content of 0.1 wt. %
• Heavy Fuel Oil (HFO) as residual marine fuel with an average sulphur content of >2.5 wt. %
with scrubbers as approved exhaust gas cleaning system (EGCS)
• Low Sulphur Fuel Oil (LSFO0.5, LScrude) as residual marine fuel with a sulphur content of
0.5 wt. %, using low sulphur crude oil as feedstock in refineries
• Low Sulphur Fuel Oil (LSFO0.5, Blend) as blend of residual and distillate marine fuels with a
sulphur content of 0.5 wt. %.
Other alternative fuels, e.g. Liquified Petroleum Gas (LPG), methanol, bioLNG, and synthetic LNG
are also analysed in this study.
Approach and Methodology
The analysis distinguishes between the following ship engines and their specific characteristics when
operating on different fuels:
• 2-stroke slow speed dual fuel engines
• 4-stroke medium speed single and dual fuel engines
• 4-stroke high speed single fuel engines
• Gas turbines in simple and combined cycle.
These engine technologies are further distinguished by combustion cycle, i.e. Otto combustion cycle
(low pressure gas injection) and diesel combustion cycle (high pressure gas injection). Steam turbines
as a main fuel oil engine are not analysed in this context due to the small number of vessels in
operation with this technology. However, within the LNG supply chain analysis, steam turbines are
considered as engine technology in LNG carriers in this study.
The data collection in particular focussed on ship engine data provided by eight major engine
manufacturers (OEMs) incorporating the latest engine technologies and performance attributes. Main
data providers were Carnival, Caterpillar MaK, Caterpillar Solar Turbines, GE Aviation, MAN Energy
Solutions, MTU Friedrichshafen, Winterthur Gas & Diesel and Wärtsilä. On the fuel supply chains,
ExxonMobil, Shell and Total were engaged in this study.
The study details the complete Well-to-Wake GHG emissions analysis of the LNG supply and use as
marine fuel. The results of this analysis are compared with the WtW GHG emissions of other marine
fuels in order to show the advantages and disadvantages. The study also includes a summary
indicative outlook looking at the integration of bioLNG and synthetic LNG into the LNG supply chain.
In addition, scenarios of potential future developments and technical improvements are investigated
such as more efficient technologies which would reduce methane emissions.
The study is based on steady-state test-bed data using standard test cycles. GHG emissions based
on actual operational fuel consumption and measured emissions data will differ due to load cycles
and duration and could be considered as further analysis. However, this is the case for both LNG and
fuel oil engines.

Life Cycle GHG Emission Study on the Use of LNG as Marine Fuel v1.0 26 of 154
This assessment considers global warming as an environmental impact category only. However, the
study assesses the supply and use of LNG as a marine fuel according to ISO 14040/44 and compares
the GHG results with values for other marine fuels.
Air quality related local pollutants of sulphur oxides (SOX), nitrogen oxides (NOX) and particulate
matter (PM) of the fuel combustion are also presented in the results.
The focus of this study is on the data collection and calculation of the GHG emissions of ship engines
for LNG and oil-based fuels. For both, primary data has been provided by the OEMs.
In general, the chosen approach regarding GHG emissions can be seen as conservative from a LNG
perspective (i.e. not favouring LNG) compared with oil-based fuelled ships, because a) for oil-based
engines black carbon emissions are not considered (though potentially contributing to the global
warming potential), b) for oil-based fuelled engines low mark-up values for EGCS operation are used,
c) GHG impacts occurring as a result of a chemical reaction of used EGCS cleaning water (at open
loop EGCS) and sea water are neglected and d) it is assumed that up to 90 % of the measured total
hydrocarbon tailpipe emissions of the LNG engine are pure methane (recent studies show lower
numbers). The key findings are:
Well-to-Wake Results
As described above, the total WtW GHG emissions of marine engine are highly dependent on the
engine technology and fuel type. The overall Well-to-Wake GHG emissions of the marine engines
operating on current oil-based HFO, MGO and LNG have been calculated based on fuel consumption
and emission data provided by eight different engine manufacturers and members from SEA\LNG
and SGMF. All data is related to compliance with the IMO Tier III NOX limits, and are given in brake
power specific units (kWh) per engine technology weighted according to the IMO E2/E3 cycle. The
following tables shows the technical parameters (all primary data are provided by engine
manufacturers) that are used for the calculation of the Well-to-Wake GHG emissions of the 2-stroke
slow speed and the 4-stroke medium speed engines. Please note that all energy related numbers in
this study are referring to the lower heating value (LHV).
g/kWh Oil-based fuels Gas-based fuel
HFO2.5 MGO0.1 LNG LNG
2-stroke slow speed Diesel Diesel-DF Otto-DF
Main fuel consumption 184.8 174.0 141.3 145.1
Pilot fuel consumption - - 6.4 1.5
Urea solution consumption 20.7 20.7 - -
Methane slip - - 0.1 % 1.5 %
g/kWh Oil-based fuels Gas-based fuel
HFO2.5 MGO0.1 LNG LNG
4-stroke medium speed Diesel Otto-SI Otto-DF
Main fuel consumption 197.5 184.7 155.8 156.5
Pilot fuel consumption - - - 2.8
Urea solution consumption 15.7 15.7 - -
Methane slip - - 1.3 % 2.5 %
2-stroke slow speed engines are the most common engines in shipping and burn more than 70 wt. %
of the fuel used in the industry. Due to their high efficiency and high power, these engines are mainly

Life Cycle GHG Emission Study on the Use of LNG as Marine Fuel v1.0 27 of 154
used in large ocean-going cargo ships. LNG is used in two engine technologies which differ in their
underlying combustion cycle and gas injection system.
a) The WtW GHG emissions of the 2-stroke slow speed Diesel dual fuel engine (high pressure
gas injection) are 549 g CO2-eq/kWh when using LNG which is 21 % less compared with the
same engine operating on HFO (697 g CO2-eq/kWh) as shown in the figure below.
b) The WtW GHG emissions of the 2-stroke slow speed Otto dual fuel engine (low pressure gas
injection) are 598 g CO2-eq/kWh when using LNG which is a reduction of 14 % compared
with HFO operation.
For these LNG fuelled engines, the WtT GHG emissions of the supply chain contribute about 22-24 %
of the entire life cycle emissions (WtW). For oil-based fuels, the supply chain accounts for 16-18 %.
4-stroke medium speed engine are the second most common engine (18 wt. % of fuel burned) used
in shipping. They typically have a lower engine power and are mainly used in car and passenger
ferries as well as cruise ships. Both engines investigated in the study are Otto cycle engines and can
be differentiated according to their ability to run on single (SI) or dual fuel (DF).
a) The WtW GHG emissions of the 4-stroke medium speed Otto-DF engine are 692 g CO2-
eq/kWh running on LNG which is a 7 % reduction compared with operation on HFO
(741 g CO2-eq/kWh).
b) The WtW GHG emissions of the 4-stroke medium speed Otto-SI engine which is a single
fuel, pure gase engine, are 629 g CO2-eq/kWh resulting in a 15 % reduction compared with
HFO.

Life Cycle GHG Emission Study on the Use of LNG as Marine Fuel v1.0 28 of 154
4-stroke high speed engines only account for 6 wt.% of the fuel burned in shipping, with gas turbines
in simple and combined cycle operation having a minor share of 2 wt.%. Nonetheless, these engines
are also analysed in the study and described in detail in the report. The high speed engines and gas
turbines only run on MGO0.1 and LNG. 4-stroke high speed engines show a potential GHG reduction
of 5 % compared with MGO0.1.
Gas turbines in simple and combined cyle have a methane slip during the combustion accounting for
only 0.3 % of the overall WtW GHG emissions. Simple operation gas turbines using LNG give a
benefit of 16 % compared with MGO0.1, or 20 % in combined cycle operation.
The comparison of LNG fuelled engines with post-2020 oil-based fuelled engines shows similar GHG
results as for the current situation, depending on the post-2020 fuel type and engine technology. For
2-stroke engines the advantages of gas fuelled engines are calculated to be 14-22 % (current fuels:
14-21 %) and for 4-stroke engines 6-16 % (current fuels: 7-15 %).The main reason for the high range
of GHG reduction potential is the methane slip during the combustion phase which is mainly
dependent on the combustion cycle of the engine and evaluated in more detail below.
Methane Emissions Contribution Analysis
Methane emissions can have a significant impact on the total WtW GHG emissions of marine engines.
For oil-based marine fuels, methane emissions are limited to the supply chain of the fuel. In LNG
operation, the methane slip in the engine (combustion) plays an important role in addition to the
emission from the supply chain. The following tables show an analysis along the life cycle of the fuel
and the contribution of supply and combustion. GHG emissions resulting from methane account for
around 3 % of the total WtW GHG emissions of oil-based fuels (HFO2.5 and MGO0.1 in the following
tables) and can be considered as insignificant whereas this goes up to 22 % for certain engines
combusting LNG (to be considered as significant).
Methane emissions in the supply chain are mainly fugitive emissions. Methane emissions from the
combustion of the fuel show a strong dependency from the combustion cycle.
Due to the high gas injection pressure and the combustion in a Diesel cycle, methane emission in the
combustion of the 2-stroke slow speed Diesel-DF engine are about 4 g CO2-eq/kWh representing
less than 1 % of the total WtW GHG emissions. The data of the 2-stroke slow speed Otto cycle engine
shows that methane slip accounts for 63 g CO2-eq/kWh which is equal to 11 % of the total WtW GHG
emissions.
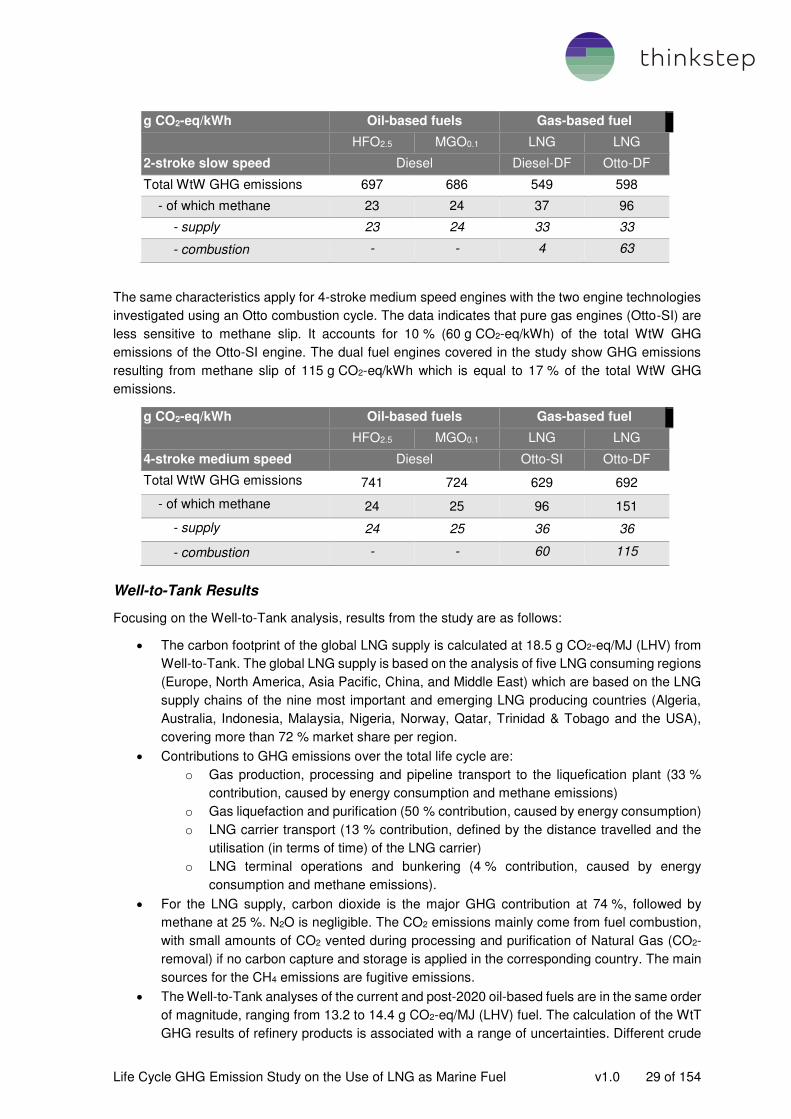
Life Cycle GHG Emission Study on the Use of LNG as Marine Fuel v1.0 29 of 154
g CO2-eq/kWh Oil-based fuels Gas-based fuel
HFO2.5 MGO0.1 LNG LNG
2-stroke slow speed Diesel Diesel-DF Otto-DF
Total WtW GHG emissions 697 686 549 598
- of which methane 23 24 37 96
- supply 23 24 33 33
- combustion - - 4 63
The same characteristics apply for 4-stroke medium speed engines with the two engine technologies
investigated using an Otto combustion cycle. The data indicates that pure gas engines (Otto-SI) are
less sensitive to methane slip. It accounts for 10 % (60 g CO2-eq/kWh) of the total WtW GHG
emissions of the Otto-SI engine. The dual fuel engines covered in the study show GHG emissions
resulting from methane slip of 115 g CO2-eq/kWh which is equal to 17 % of the total WtW GHG
emissions.
g CO2-eq/kWh Oil-based fuels Gas-based fuel
HFO2.5 MGO0.1 LNG LNG
4-stroke medium speed Diesel Otto-SI Otto-DF
Total WtW GHG emissions 741 724 629 692
- of which methane 24 25 96 151
- supply 24 25 36 36
- combustion - - 60 115
Well-to-Tank Results
Focusing on the Well-to-Tank analysis, results from the study are as follows:
• The carbon footprint of the global LNG supply is calculated at 18.5 g CO2-eq/MJ (LHV) from
Well-to-Tank. The global LNG supply is based on the analysis of five LNG consuming regions
(Europe, North America, Asia Pacific, China, and Middle East) which are based on the LNG
supply chains of the nine most important and emerging LNG producing countries (Algeria,
Australia, Indonesia, Malaysia, Nigeria, Norway, Qatar, Trinidad & Tobago and the USA),
covering more than 72 % market share per region.
• Contributions to GHG emissions over the total life cycle are:
o Gas production, processing and pipeline transport to the liquefication plant (33 %
contribution, caused by energy consumption and methane emissions)
o Gas liquefaction and purification (50 % contribution, caused by energy consumption)
o LNG carrier transport (13 % contribution, defined by the distance travelled and the
utilisation (in terms of time) of the LNG carrier)
o LNG terminal operations and bunkering (4 % contribution, caused by energy
consumption and methane emissions).
• For the LNG supply, carbon dioxide is the major GHG contribution at 74 %, followed by
methane at 25 %. N2O is negligible. The CO2 emissions mainly come from fuel combustion,
with small amounts of CO2 vented during processing and purification of Natural Gas (CO2-
removal) if no carbon capture and storage is applied in the corresponding country. The main
sources for the CH4 emissions are fugitive emissions.
• The Well-to-Tank analyses of the current and post-2020 oil-based fuels are in the same order
of magnitude, ranging from 13.2 to 14.4 g CO2-eq/MJ (LHV) fuel. The calculation of the WtT
GHG results of refinery products is associated with a range of uncertainties. Different crude

Life Cycle GHG Emission Study on the Use of LNG as Marine Fuel v1.0 30 of 154
oil properties and refinery settings, different levels of desulphurisation and blending ratios,
and assumptions made, as well as methodological differences such as different allocation
methods can lead to different results. This means that interpretation of results and
comparison between studies needs to be undertaken with care. However, the global supply
of oil-based marine fuels has a lower WtT GHG intensity compared with LNG.
• For both, LNG and oil-based fuel supply chains, GHG emissions differ from region to region
due to different natural reservoir characteristics, and hence production technologies applied,
ambient temperatures at liquefaction (LNG supply only), transport distances, etc. Technology
consideration as well as specific supply chain analyses to get to a global average are key for
the assessment of the supply chains.
Air Quality and Local Pollutants
Although the focus of the study is on GHG emissions of the supply and use of LNG compared with
other marine fuels, the influence of the fuel combustion on air quality is investigated but limited to the
Tank-to-Wake stage of the life cycle. Sulphur oxide (SOX), nitrogen oxide (NOX) and particulate matter
(PM) emission data were reported by the engine manufacturers for the operation with LNG, HFO and
MGO. Based on these data, the following conclusions are drawn:
• Due to the absence of sulphur in LNG, sulphur oxide emissions of LNG are zero for pure gas
engines, and negligible for dual fuel engines where a small amount of sulphur oxide
emissions occur due to the use of pilot fuel. Oil-based pilot fuel is self-ignitable and is needed
in dual fuel engines to function as a spark plug for the gas. Because it accounts for only 1 to 5
% of the fuel used in normal engine operation, LNG has a clear advantage compared with
oil-based fuels.
• NOX emissions are mainly dependent on the underlying combustion cycle. Most gas fuelled
engines utilise the Otto cycle and comply with the strict IMO Tier III NOX limits (e.g. for ECAs)
without any NOX after-treatment system. The 2-stroke slow speed Diesel-DF engines
complies with Tier III by incorporating exhaust gas recirculation (EGR) or selective catalytic
reduction (SCR) systems.
• PM measurement data was provided for gas turbines and 4-stroke medium speed engines.
Based on these data, LNG can deliver a PM reduction of up to 99 % compared with oil-based
marine fuels.

Life Cycle GHG Emission Study on the Use of LNG as Marine Fuel v1.0 31 of 154
1.1. Background
The international shipping industry is under pressure to reduce atmospheric emissions. Greenhouse
Gas (GHG) emissions as well as local pollutants, like sulphur oxides (SOX), nitrogen oxide (NOX), and
particulate matter (PM) are in focus of most governmental environmental agencies, public health
organisations and non-governmental environmental groups.
In 2018, the most common marine fuels were Heavy Fuel Oil (HFO) and Marine Gas Oil (MGO), with
a maximum sulphur limit of 3.5 wt. % outside the Emission Control Areas (ECAs)1 respectively 0.1
wt. % inside the ECAs. As a result of the external pressures, as well as foreseeing the impending
more stringent air quality regulations relating to SOX and NOX, the marine fuel portfolio will change.
The International Maritime Organization (IMO) has already introduced different measures to reduce
GHG emissions from shipping (e.g. the Energy Efficiency Design Index (EEDI), the Ship Energy
Efficiency Management Plan (SEEMP) and announced, subsequent to the Paris Agreement, a
commitment to reduce the GHG emissions from shipping by at least 50 % by 2050, compared with
2008 [5], [6]
MARPOL Annex VI, Regulation for the Prevention of Air Pollution from Ships, limits the sulphur
content of marine fuels used in Emission Control Areas (ECAs) to a maximum of 0.1 wt. % from
January 1, 2015 and globally to 0.5 wt. % from January 1, 2020 [7]. Hence, ships will have to use
marine fuels with a sulphur content of no more than 0.5 wt. % unless using an approved exhaust gas
cleaning system (EGCS), such as a scrubber. An additional benefit of reducing SOX emissions is a
decrease in the level of PM, especially an advantage for ports and coastal areas with high shipping
traffic.
As mentioned, the IMO 2020 global low sulphur cap with its 0.5 wt. % global sulphur cap, may lead
to changes in the marine fuel market in 2020. However, it is currently unknown how refiners and fuel
makers will provide marine fuel that will comply with the global 2020 requirements. There will be a
wide variability of fuel oil quality depending on crude, refining process, blend strategy, and region. In
general, the following main fuel options are possible [8]:
• Marine Gas Oil (MGO0.1) → low sulphur distillate fuel
• Marine Diesel Oil (MDO) → blend of distillates with small amounts of residual fuel
• Low Sulphur Fuel Oil (LSFO0.5) → specification not known (low sulphur residual fuel), either
desulphurised HFO or HFO produced by using low sulphur crude oil as feedstock 2.
• Heavy Fuel Oil in combination with an Exhaust Gas Cleaning Systems (i.e. scrubbers)3
• Liquified Natural Gas (LNG)
• Other alternative fuels, e.g. Liquified Petroleum Gas (LPG), methanol, bioLNG4, synthetic
LNG, etc.
1 ECAs are: the Baltic Sea, the North Sea, the North American and the US Caribbean Sea area. 2 According to [8], the sulphur content of crude oil in different parts of the world ranges from 0.1 wt. % to 4.1 wt.%. As a rule of
thumb 2 to 3 times the S content in the crude ends up in the residual fuel, which means a crude having a S content of 0.3 wt. % would translate to a residual fuel sulphur content of approx. 0.6 wt. % to 0.9 wt. %. Hence to meet the IMO regulations the refiners have to either treat the fuel or blend it with ultra-low sulphur fuel oil. Other options to obtain a 0.5 wt. % S content HFO include blending with hydro-treated residuals, heavy fractions from hydrocrackers and lighter hydro-treated fractions.
3 No sulphur limit in HFO. 4 For details regarding bioLNG and synthetic LNG please see section 7.
1. Introduction

Life Cycle GHG Emission Study on the Use of LNG as Marine Fuel v1.0 32 of 154
To control NOx emissions new vessels, based on their date of construction, are required to use Tier II
compliant engines outside Emission Control Areas (ECAs) and Tier III compliant engines within
ECAs. For explanations regarding the emission limit regulations, please see Annex B. Where these
emission limits cannot be met by the engine itself, either exhaust gas recirculation (EGR) or selective
catalytic reduction (SCR) technologies may be applied.
Both the IMO GHG emission reduction ambition as well as the IMO 2020 global sulphur cap are
challenging the shipping industry. While emission reduction may be achieved by efficiency
improvements at the vessels, the industry is searching for alternatives to comply with the upcoming
regulations. Liquified Natural Gas (LNG) is seen as the most promising alternative low carbon fuel on
a short to medium term.
1.2. Motivation
The use of LNG as a marine fuel continues to gain the attention of the shipping industry as the benefits
from the reduction of local air pollutants like SOX, NOX, and PM are widely accepted. However, the
actual greenhouse gas emissions of LNG in this use are unclear for various reasons. Data availability
of conventional oil-based fuelled engines is much greater than for LNG based vessel propulsion.
There is also the issue that methane emissions from incomplete combustion could play a major role
in GHG emissions from LNG use. The diverse engine technologies and engine characteristics used
in shipping further complicate the issue, especially with regard to methane slip. The resulting paucity
of data and complexity of systems mean that it is very difficult to make valid general statements of
the GHG emissions of LNG in shipping.
For this reason, SEA\LNG and SGMF commissioned a comprehensive Well-to-Wake (WtW) GHG
analysis on the use of LNG as marine fuel. While the analysis has been performed on a global level,
it considers different regions for the LNG supply, and distinguishes between different ship engines
technologies. Primary, up-to-date data from engine manufacturers (OEMs), incorporating the latest
technologies and performance attributes, have been used to calculate the Well-to-Wake GHG
emissions. The results of this analysis, the WtW GHG emissions, are compared with the WtW GHG
emissions of other marine fuels in order to show the advantages and disadvantages.
The Life Cycle Assessment (LCA) method has been applied for the analysis. LCA is a method to
evaluate the potential environmental impacts of a product, a system or services throughout its entire
life cycle, from raw material extraction to end of life, by quantifying the material and energy inputs and
outputs of all unit processes that comprise the product system under study.
LCA is standardised in ISO 14040/14044 [1], [2] and consists of four steps:
• Goal and Scope Definition (sets the objectives and boundaries of the study)
• Life Cycle Inventory Analysis (includes data collection and quantifies the inputs and outputs)
• Life Cycle Impact Assessment (evaluates the potential environmental impacts of resource
consumption and emissions)
• Interpretation (discusses the results in relation to the stated goal and scope).
The report is structured as follows: Section 2 outlines the goal of the study and section 3 the general
scope of the study. In the subsequent sections 4, 5 and 6, the Well-to-Tank, Tank-to-Wake, and Well-
to-Wake analyses are described. Section 7 gives an outlook on renewable LNG sources. Section 8
addresses the interpretation of the results and section 9 details the conclusions and
recommendations.

Life Cycle GHG Emission Study on the Use of LNG as Marine Fuel v1.0 33 of 154
2.1. Goal of the Study
The main goal of the study is to provide an accurate report of the life cycle GHG emissions on the
use of LNG as a marine fuel compared with conventional marine fuels. An objective is to resolve the
existing uncertainty of the overall life cycle GHG emissions of LNG and hence clarify its potential
benefit compared with oil-based fuels.
In addition, the study is aimed to provide information on local pollutant emissions of the combustion
of fuels in the marine engines.
The goals are reached by using state-of-the-art Well-to-Tank data and performing an industry-wide
Tank-to-Wake analysis including data from the most up-to-date marine engine technology available
on the market.
An intensive data collection effort was initiated to gather primary industry information about the fuel
consumption, methane emissions and pollutant emissions of marine engines. Based on the data
collected, the GHG intensity (carbon footprint) is calculated.
2.2. Reasons for Carrying out the Study
While the benefits of LNG in terms of air quality are widely accepted, there is considerable uncertainty
regarding the level of greenhouse gas emissions. A number of studies have produced varying results
creating further uncertainty5.
To clarify the potential benefits and barriers of LNG compared with conventional marine fuels,
especially as the fuel market changes due to the IMO 2020 sulphur regulations, primary, up-to-date
data from engine manufacturers incorporating the latest technologies and performance attributes has
been used to calculate the Well-to-Wake GHG emissions from the use of LNG compared with oil-
based marine fuels.
2.3. Intended Application
This report is mainly prepared to support open and transparent communications with external
stakeholders such as investors, ship owners and ship operators. It is intended to provide transparent
information of the benefits of, as well as barriers to LNG as a marine fuel. This includes its GHG
intensity along the whole life cycle (Well-to-Wake) as well as emissions of local pollutants during the
combustion of the fuel. The results are intended to support the decision-making process of investors
and ship operators.
The results of the study are intended to be disclosed to the public. Therefore, the study was subjected
to a critical review by a panel of independent experts according to ISO 14044.
5 This is especially true for the amount of methane being released during the combustion of the fuel (also known as methane
slip). Sometimes, general statements have been made regarding the benefit of LNG, even the methane slip and hence GHG performance is highly dependent on the engine technology, analysed.
2. Goal of the Study

Life Cycle GHG Emission Study on the Use of LNG as Marine Fuel v1.0 34 of 154
2.4. Intended Audience
The report has been prepared to be used for public dissemination and the dialogue with external
stakeholders, particularly investors, ship owners, operators, governmental agencies, NGOs and
regulators.
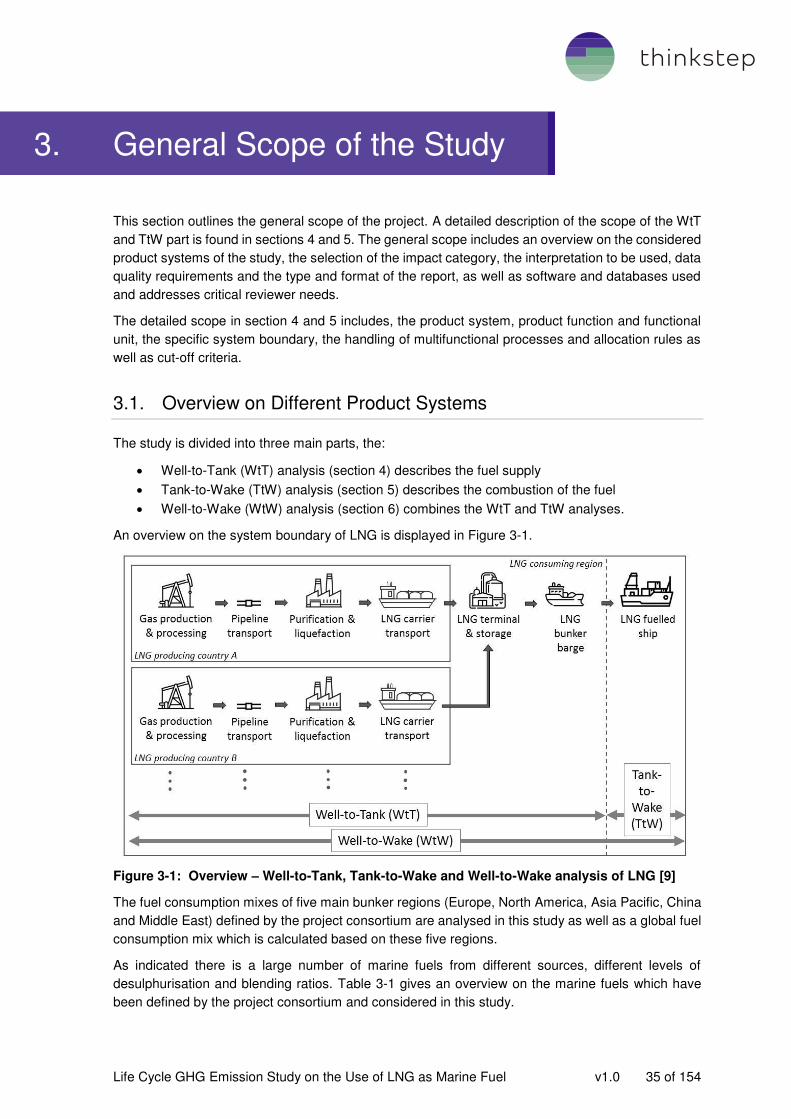
Life Cycle GHG Emission Study on the Use of LNG as Marine Fuel v1.0 35 of 154
This section outlines the general scope of the project. A detailed description of the scope of the WtT
and TtW part is found in sections 4 and 5. The general scope includes an overview on the considered
product systems of the study, the selection of the impact category, the interpretation to be used, data
quality requirements and the type and format of the report, as well as software and databases used
and addresses critical reviewer needs.
The detailed scope in section 4 and 5 includes, the product system, product function and functional
unit, the specific system boundary, the handling of multifunctional processes and allocation rules as
well as cut-off criteria.
3.1. Overview on Different Product Systems
The study is divided into three main parts, the:
• Well-to-Tank (WtT) analysis (section 4) describes the fuel supply
• Tank-to-Wake (TtW) analysis (section 5) describes the combustion of the fuel
• Well-to-Wake (WtW) analysis (section 6) combines the WtT and TtW analyses.
An overview on the system boundary of LNG is displayed in Figure 3-1.
Figure 3-1: Overview – Well-to-Tank, Tank-to-Wake and Well-to-Wake analysis of LNG [9]
The fuel consumption mixes of five main bunker regions (Europe, North America, Asia Pacific, China
and Middle East) defined by the project consortium are analysed in this study as well as a global fuel
consumption mix which is calculated based on these five regions.
As indicated there is a large number of marine fuels from different sources, different levels of
desulphurisation and blending ratios. Table 3-1 gives an overview on the marine fuels which have
been defined by the project consortium and considered in this study.
3. General Scope of the Study

Life Cycle GHG Emission Study on the Use of LNG as Marine Fuel v1.0 36 of 154
Table 3-1: Overview on current and post-2020 marine fuels considered in this study
Marine fuel Description
Current fuels
LNG Liquefied Natural Gas (LNG) is produced from Natural Gas
through liquefaction.
Heavy fuel oil
(HFO2.5)
The maximum sulphur content limit of this residual marine fuel is
3.5 wt. % [7]. The worldwide average sulphur content for HFO2.5
is assumed to be 2.5 wt. % and is used in this study [10]. No
EGCS used in ships outside ECAs.
Marine gas oil
(MGO0.1)
Distillate marine fuel with an average sulphur content of 0.1 wt. %.
Fuel used mainly in ECAs.
Post -2020 fuels6
LNG Liquefied Natural Gas (LNG) is produced from Natural Gas
through liquefaction.
Heavy fuel oil
(HFO>2.5) with
EGCS
Residual marine fuel with an average sulphur content of >2.5
wt. %7. An SOx exhaust gas cleaning system at the ships is used
to meet the 0.5 wt.% sulphur limit. It is assumed that the fuel is
produced in the same way as today HFO2.5.
Marine gas oil
(MGO0.1)
Distillate marine fuel with an average sulphur content of 0.1 wt. %.
It is assumed that the fuel is produced in the same way as today.
Low sulphur heavy
fuel oil
(LSFO0.5, Blend)
LSFO0.5, Blend is a blend of 50:50 residual and distillate marine fuels
with an average sulphur content of 0.5 wt. % produced from a
crude oil with an average sulphur content. In general, different
blending ratios are possible. Additional CO2 emissions for the
production of the fuel are assumed to be in the range of 2 to 10 %
of refinery CO2, depending on the blending ratio between residual
and distillate fuels [11]. After intensive discussions with a
representative of CONCAWE [12], 4 % additional GHG emissions
for the production are assumed in this study for a 50:50 blend.
Low sulphur heavy
fuel oil
(LSFO0.5, LScrude)
Residual marine fuel with an average sulphur content of 0.5 wt. %.
LSFO0.5, LScrude can be produced using low sulphur crude oils as
feedstock in refineries. No further direct modifications in the
existing refinery are assumed.
Other marine fuels such as LPG and methanol are also analysed, as well as renewable supply
sources of LNG. The WtT, TtW and WtW analysis for LPG and methanol can be found in Annex G.
Section 7 analyses the WtW GHG emissions of renewable supply sources of LNG.
6 According to [8], the sulphur content of crude oil in different parts of the world ranges from 0.1 wt. % to 4.1 wt.%. As a rule of
thumb 2 to 3 times the sulphur content in the crude ends up in the residual fuel, which means a crude having a sulphur content of 0.3 wt. % would translate to a residual fuel sulphur content of approx. 0.6 wt. % to 0.9 wt. %. Hence to meet the IMO regulations the refiners have to either treat the fuel or blend it with ultra-low sulphur fuel oil. Other options to obtain a 0.5 wt. % sulphur content HFO include blending with hydro-treated residuals, heavy fractions from hydrocrackers and lighter hydro-treated fractions [8].
7 It is very likely that the sulphur content will increase post-2020. CONCAWE, for instance, estimates an increase of the average sulphur content of post-2020 HFO to potentially 4.2 wt. % for European refineries [12].

Life Cycle GHG Emission Study on the Use of LNG as Marine Fuel v1.0 37 of 154
Based on the global fuel supply, different ship engines are analysed. Table 3-2 provides an overview
of the engines investigated. A detailed explanation of the technologies can be found in section 5.1.3.
Table 3-2: Overview of engines technologies and fuels investigated
Oil-based fuels Gas-based fuel
HFO2.5, HFO>2.5,
LSFO0.5, Blend,
LSFO0.5, LScrude
MGO0.1 LNG
2-stroke SS-Diesel-DF or Otto-DF8 x x x
4-stroke MS-Diesel-CI x x
4-stroke MS-Diesel DF or Otto DF x x x
4-stroke MS-Otto-SI x
4-stroke HS-Diesel-CI x
4-stroke HS-Otto-SI x
Gas turbine simple cycle (GT) x x
Gas turbine combined cycle (CCGT) x x
Steam turbines are not analysed in this context due to the small number of vessels in operation and
less common technology. However, within the LNG supply chain analysis, steam turbines are
considered as engine technology at LNG carriers in this study. The usage of natural gas in fuel cells
is not common in shipping today and is therefore not investigated here.
This study is a Well-To-Wake analysis, however the data collection focuses more on the Tank-to-
Wake analysis than the Well-to-Tank analysis because the majority of the Well-to-Tank primary data
were already collected within the NGVA study [13]. These data are supplemented by thinkstep’s LCI databases [14] and literature and have been validated by energy suppliers. Tank-to-Wake primary
data have been collected intensively for the combustion of the fuels in ship engines.
3.2. Tasks
The assessment of the GHG emissions (carbon intensity) of LNG is carried out on a full life cycle
basis. This includes the following life cycle phases: production & processing, pipeline transport,
liquefaction, LNG carrier transportation (for imports), LNG terminal operations (for imports), bunkering
(dispensing) and the final combustion in the engine. Several LNG pathways are analysed, including
LNG from Algeria, Australia, Qatar, Indonesia, Malaysia, Nigeria, Norway, Trinidad & Tobago and the
USA. In addition to the life cycle GHG emissions, local pollutants, like SOX, NOX, and PM are
considered for the use phase of the fuels. The main reason why the local pollutant emissions are
considered for the use phase only, is that adding all air pollutants along the fuel supply chains in
different global regions and locations may give wrong conclusions of air quality impacts, especially
for coastal areas, harbours and ECAs.
The following tasks are performed:
• Literature survey to identify relevant documents and studies
• Data collection and validation
o Primary data for the marine engines from engine manufacturers (OEMs) of SEA\LNG
and SGMF members for both operation on LNG as well as on oil-based fuels
8 Low pressure engines (all 4-stroke engines considered and the 2-stroke SS-Otto-DF) run in the Otto cycle while using LNG
and in the Diesel cycle when using oil-based fuels. The high-pressure engine (2-stroke SS-Diesel-DF) run in a Diesel cycle when using both LNG and oil-based fuels.

Life Cycle GHG Emission Study on the Use of LNG as Marine Fuel v1.0 38 of 154
o Use (and update were necessary) existing supply chain models (mainly from NGVA
study [13]) by collecting primary data from LNG suppliers
o Secondary data for the oil-based fuels
• Development of specific life cycle GHG models including the fuel supply and combustion
• Calculation of life cycle GHG emissions using established midpoint metrics (e.g. Global
Warming Potential)
• Comparison of the life cycle GHG results of LNG marine fuel with the use of oil-based fuels
used today (HFO2.5, MGO0.1), and fuels that will mostly likely enter the market due to the
introduction of the IMO 2020 global sulphur cap, e.g. low sulphur fuels
• Comparison of the local pollutants, like SOX, NOX, and PM for the use phase of the fuels
• Scenario analysis to quantify GHG impact from different EGCS technologies, e.g. open loop,
closed loop9
• Consideration of future LNG supply sources, including biomethane and synthetic gas (based
on results from other publicly available reports)
• Sensitivity and uncertainty analyses on technical parameters and different midpoint metrics,
e.g. GHG characterisation factors referring to different IPCC reports and/or targeted years.
• Third-party critical review of the study / report.
3.3. Selection of the Impact Category
As this study focuses to understand the influence of the fuel usage on the global warming potential,
GHG emissions and their impact to the global warming potential are investigated. The global warming
potential is of major relevance to climate change, of high public and institutional interest, and deemed
to be the most pressing environmental issue of our time. The marine transport sector is currently
being driven by policy makers, NGOs, the shipping industry and the public towards carbon reduction
to mitigate the effects and consequences of climate change as far as possible.
This study is not a complete LCA as limited to GHG. LCAs typically consider various other
environmental impact categories at the midpoint level with respect to different environmental
compartments such as air, water and soil. Instead, the study focuses exclusively on the impact
category called “climate change” which is caused by a number of substances emitted into the air,
mainly carbon dioxide (CO2), methane (CH4) and nitrous oxide (N2O). By characterising each single
greenhouse gas (GHG) by its individual characterisation factor, all GHG emissions can be aggregated
to the global warming potential (GWP), also known as greenhouse gas (GHG) intensity or Product
Carbon Footprint (PCF), and expressed in CO2-equivalents (CO2-eq). The impact category climate
change is assessed based on the current IPCC (Intergovernmental Panel on Climate Change)
characterisation factors taken from the 5th Assessment Report (AR5, 2013) for a 100-year timeframe
(GWP100), as this is currently the most commonly used metric [15] and also in accordance with
ISO 14067 “Carbon Footprinting of Products” [16].
Black carbon (BC) is part of the particulate matter emissions and another contributor to the global
warming potential. It absorbs the energy of the sun leading to atmospheric warming. Compared with
the greenhouse gases mentioned above, the location of the emission and the deposit of BC is of
importance. In addition to the absorption of solar radiation, BC reduces the albedo of the surface
when it deposits on snow or ice. Hence the global warming impact of BC is especially significant in
the arctic where its presence leads to increased melting of the artic sea ice10 [17]. The IPCC AR5
collected information from different studies indicating a range of characterisation factors for GWP100
9 ECGS systems typically use either sea water or fresh water to wash of pollutant emissions. Sea water is used in open-loop
systems and discharged into the sea without any further treatment (the high water flow ensures that the IMO guidelines are met). Fresh water is used in closed-loop systems and only discharged after special after treatment. [57]
10More detailed information on BC (especially BC from shipping) and its special importance for the artic regions can be found in [80].

Life Cycle GHG Emission Study on the Use of LNG as Marine Fuel v1.0 39 of 154
of BC from 100-1.700 g CO2-eq/g BC [15]. The International Council on Clean Transportation (ICCT)
[17] estimated using a characterisation factor of 900 g CO2-eq/g BC that GHG emissions of shipping
resulting from black carbon emissions account for 5-8 % of the global GHG emissions of shipping.
The range of characterisation factors researched by the IPCC, however, shows a high level of
uncertainty with respect to the quantitative influence of black carbon emissions on GWP. Considering
the estimations used by ICCT [17] and the range of characterisation factors presented by IPCC [15],
the GHG emissions resulting from black carbon emissions would add between 0.3 and 15 % to the
total WtW GHG emissions of the oil-based fuelled engines. Due to this high uncertainty, GHG
emissions resulting from black carbon are not included in this study. This represents a conservative
approach with respect to the potential benefits of LNG, as CO2-eq emissions resulting from black
carbon would increase the GHG emissions mainly of oil-based fuels.
In order to increase the comparability of the results of this study with the results of other studies, the
factors from the 4th Assessment Report (AR4, 2007) for a 100-year timeframe (GWP100) are applied
in a sensitivity analysis to check the influence of any changes to the different factors on the overall
GHG results [18]. Additionally, the short-term climate effects (20-year timeframe) which are described
by the GWP20 and the global temperature potential11 on a 100-year timeframe (GTP100) are
investigated. For a complete listing of the characterisation factors used, refer to Annex B.
It must be noted that impact categories represent impact potentials, i.e., they are estimates of
environmental impacts that could occur if the emissions (a) follow the underlying impact pathway and
(b) meet certain conditions in the receiving environment while doing so. In addition, the inventory only
captures that fraction of the total environmental load that corresponds to the functional unit (relative
approach). GHG results are therefore relative expressions only and do not predict actual impacts, the
exceeding of thresholds, safety margins, or risks.
Optional elements of the ISO 14040/14044 standard include normalisation, grouping and weighting
factors. Normalisation is not applied. Weighting and grouping are also not included, because only one
impact category is chosen for the present study.
3.4. Selection of Local Pollutants – Air Quality
In addition to the GHG emissions, the following selected local pollutant emissions that are released
during the combustion of the fuel (hence Tank-to-Wake emissions) are analysed:
• Nitrogen oxides (NOX):
“Nitrogen oxides” is a collective term for binary compounds of nitrogen and oxygen, mainly
nitrogen monoxide and nitrogen dioxide. NOx are a significant source of air pollution. There
are three different types of NOx emissions released during combustion: thermal NOx, fuel NOx
and prompt NOx. Thermal NOx emissions result from the combustion of fuels at high
temperatures. Fuel NOx emissions are related to the nitrogen content of the combusted fuel
and released during combustion. Prompt NOx emissions are caused by atmospheric nitrogen
but is considered to be negligible. NOx emissions are responsible for the formation of acidic
rain and the eutrophication of the environment. They have a negative effect on the respiratory
tracts of humans when occurring in high concentrations in the ambient air and tend to produce
11 Compared with the GWP, the Global Temperature Change Potential (GTP) goes one step further down the cause-effect
chain and is defined as the change in global mean surface temperature at a given point in time in response to an emission pulse, and expressed relative to that of CO2. Compared with the GWP, the GTP puts much less emphasis on near-term climate fluctuations caused by emissions of short-lived species (e.g., CH4). The GWP and GTP are different by definition, and different numerical values can be expected. In particular, the GWPs for near-term climate forcers are higher than GTPs over the same timeframe due to the integrative nature of the metric. The GTP values can be considerably affected by assumptions about the climate sensitivity and heat uptake by the ocean. Thus, the relative uncertainty ranges are wider for the GTP than for GWP.

Life Cycle GHG Emission Study on the Use of LNG as Marine Fuel v1.0 40 of 154
low-lying atmospheric ozone in the presence of UV-radiation causing summer smog
(photochemical ozone formation).
• Sulphur oxides (SOX):
Sulphur oxide emissions are not dependent on the temperature of the combustion process
but are a product of the reaction of sulphur in the fuel with oxygen, and hence directly linked
to the sulphur content of the fuel.
Sulphur oxides are another major reason for the occurrence of acidic rain and its
consequences [19]. SOX emissions are also main constituents for PM, and its related health
impacts and contribute to summer smog.
• Particulate matter (PM):
Particulate matter emissions consist of solid and liquid particles and result from the
combustion of fuels. They are mainly classified according to their size (PM2.5-PM10). The data
used in this study refers to total PM emissions from marine engines and is not distinguished
into different particle sizes due to data availability.
The effects of PM emissions range from health issues for humans mainly in the respiratory
tracks, to other environmental effects [20]. Black carbon is part of the fine particulate matter
(PM2.5). Health impacts is listed as the main driver for reduction at IMO (MEPC 70/INF.34).
3.5. Interpretation to be used
The results of the life cycle inventory analysis and the GHG impact assessment are interpreted
according to the goal and scope. The interpretation addresses the following topics:
• Identification of relevant findings, such as the main process step(s), material(s), and/or
emission(s) contributing to the overall results
• Evaluation of completeness, sensitivity, and consistency to justify the exclusion of data from
the system boundaries as well as the use of proxy data
• Conclusions, limitations and recommendations.
The interpretation is provided in section 8, and the conclusions and recommendations in section 9.
The interpretation does include the evaluation of the differences of the results according to their
significance. Whether differences between the results are environmental significant or not varies from
case to case. Differences in the results of the Well-to-Wake (WtW) GHG analysis of 3 %12 and more
are already considered as environmental significant, while differences in the results of the Well-to-
Tank (WtT) GHG analysis are considered as environmental significant from 15 % onwards. For local
pollutants differences more than 30 % can be considered as significant.
3.6. Data Quality Requirements
The data used to create the inventory model must be as precise, complete, consistent, and
representative as possible with regards to the goal and scope of the study.
• Measured primary data are considered to be of the highest precision, followed by calculated
(or extrapolated) data, literature data, and estimated data. The goal is to model all relevant
foreground processes using measured or calculated primary data.
• Completeness is judged based on the completeness of the inputs and outputs per unit
process and the completeness of the unit processes themselves. The goal is to capture all
relevant data and all relevant LCA stages/activities.
12 The Well-to-Wake (WtW) results are mainly defined by the fuel consumption of the engine, and to a certain extend by the
methane slip.

Life Cycle GHG Emission Study on the Use of LNG as Marine Fuel v1.0 41 of 154
• Consistency refers to modelling choices and data sources. The goal is to ensure that
differences in results reflect actual differences between product systems and are not due to
inconsistencies in modelling choices, data sources, emission factors, or other artefacts.
• Reproducibility expresses the degree to which third parties would be able to reproduce the
results of the study based on the information contained in this report. The goal is to provide
enough transparency with this report so that third parties are able to approximate the reported
results. This ability may be limited by the exclusion of confidential primary data and access
to the same background data sources.
• Representativeness expresses the degree to which the data matches the geographical,
temporal, and technological requirements defined in the study’s goal and scope. The goal is to use the most representative specific respectively industry-average data. Whenever such
data were not available (e.g., no industry-average data available for a certain country), best-
available proxy data were used. An overview on the proxy data used is given in Annex E.
An evaluation of the data quality with regard to these requirements is provided in section 8.3.
3.7. Software and Databases
The LCA software system GaBi 8.713 is used to synthesise the collected
data and information and to build the basis for the GHG model. The
associated LCI databases (GaBi databases 2018, service pack 36) [14] provide the life cycle inventory
data for the background datasets, like country-specific electricity grid mix data and data for urea
solutions. A list of the key background datasets is given in Annex E.
3.8. Critical Review
The results of the study are intended to be disclosed to the public. The study was therefore subjected
to a critical review by a panel of independent experts according to ISO 14044, section 6 [2].
The critical review statement can be found in Annex I. The critical review report containing the
comments and recommendations by the independent experts as well as the practitioner’s responses is available upon request from the study commissioner in accordance with ISO/TS 14071 [21].
The members of the critical review panel are introduced in Table 3-3.
Table 3-3: Members of critical review panel
Reviewer Organisation, Location, Position Role
Philippe Osset Solinnen, Paris (France) CEO, member of the ISO 14040/14044 working group
Chair of Review Panel
Prof. Dr. Atsushi Inaba Kogakuin University (Japan) Department of Environmental and Energy Chemistry
Reviewer
Prof. Dr. Friedrich Wirz Hamburg University of Technology (Germany) Head of Department of Marine Engineering
Reviewer
Dr. Michael Wang Argonne National Laboratory (USA) Head of Systems Assessment Department
Reviewer
The panel has expertise of the different technical systems and applied methodologies and, in
consideration of the global nature of the shipping industry, has an international membership.
13 GaBi is an LCA software and one of the largest consistent LCA databases on the market. The databases offer >10,000 LCA
datasets (all compliant with ISO 14040/44 standards in the ILCD data format of the European Commission [22]), based on collected primary data during thinkstep global work with companies, associations and public bodies including all relevant industry sectors. The datasets are updated annually. More than 2,000 professionals work with GaBi on a daily basis.

Life Cycle GHG Emission Study on the Use of LNG as Marine Fuel v1.0 42 of 154
4.1. Well-to-Tank – Scope of the Study
The following sections describe the scope of the Well-to-Tank analysis in detail to achieve the stated
goals. This includes, but is not limited to, the identification of specific product systems to be assessed,
the product function, functional unit and reference flows, the system boundary, handling of
multifunctional processes, and cut-off criteria of the study.
4.1.1. Product System
The Well-to-Tank (WtT) section analyses the following product systems:
• the fuel supply of Liquefied Natural Gas (LNG)
• the fuel supply of current oil-based fuels: HFO2.5, MGO0.1
• the fuel supply of post-2020 oil-based fuels: HFO>2.5, MGO0.1, LSFO0.5, Blend and LSFOLScrude.
The focus of the study is on the supply and use of LNG as the main fuel. Therefore, the WtT section
for LNG is highlighted. However, the section on the oil-based fuels is outlined as well.
4.1.2. Product Function and Functional Unit
The product function is the provision of the fuel to be used for engines. The lower heating value (LHV)
of the fuels is the main property to be used to describe the functional unit. The functional unit is to
provide 1 MJ (LHV) of fuel, in tank. The reference flow related to the defined functional unit is 1 MJ
(LHV) of fuel, in tank.
The technical characteristics of the different fuels are stated in Annex B.
The system boundaries of the LNG and the oil-based fuel engines are described in the following.
4.1.3. System Boundary of the LNG Supply
The system boundary of the product system includes the whole supply chain from the production and
processing of Natural Gas up to the provision of LNG (see definitions on Natural Gas and LNG in
Annex A) to LNG fuelled ships:
• Natural Gas production & processing (including well drilling)
• Natural Gas pipeline transport
• Natural Gas purification and liquefaction
• LNG carrier transport
• LNG terminal and storage,
• Maritime bunkering by LNG bunker barge.
Figure 4-1 shows the Well-to-Tank system boundary of LNG.
4. Well-to-Tank Analysis

Life Cycle GHG Emission Study on the Use of LNG as Marine Fuel v1.0 43 of 154
Figure 4-1: Well-to-Tank analysis – LNG supply [9]
The global LNG consumption as well as five LNG consumption regions are considered in the Well-
to-Tank Analysis. Data is collected for each process step of the LNG supply chains from each LNG
producing country to each considered region. The considered regions as well as the LNG producing
countries are addressed more precisely in the Geographical Coverage section below.
The following paragraphs describe the product system. Corresponding data used for the modelling
are displayed in section 4.2. and Annex D.
Natural Gas Production & Processing (including Well Drilling)
After drilling and well installation, raw Natural Gas is produced from gas fields. It is sometimes mixed
with other hydrocarbons such as crude oil. The raw Natural Gas is separated and processed to
remove Natural Gas liquids (NGL) and impurities such as carbon dioxide, hydrogen sulphide, and
water. These process steps include the following GHG emissions relevant processes respectively
emission sources:
• Extraction of the hydrocarbons itself (e.g. conventional gas, unconventional gas like shale
gas, tight gas and coal bed methane (CBM) and associated gas) at the reservoir, considering
data on the latest analyses of fugitive emissions associated with hydraulic fracturing
(“fracking”)14,
• Separation facilities (including separators as well as washing tanks)
• Natural Gas processing (including heat exchanger, scrubbers, compressors, gas dehydration
and glycol regeneration unit, Claus processing of H2S to elemental sulphur)
• Energy supply units (diesel generator, gas turbine, gas engines, electricity from the grid)
• Waste water treatment facilities (e.g., for the treatment of produced water)
• Natural gas flaring, venting (if any) and other methane emissions (fugitives)
• Well drilling and well installation efforts, such as flaring and venting during installation (scaled
by the natural gas production over well lifetime).
14 Conventional natural gas is extracted by drilling vertical wells and can be produced without further technical measures. The
extraction of unconventional natural gas requires the drilling of horizontal wells and pumping of chemicals and water to create fractures in the rock of the reservoir around the well. This process is called hydraulic fracturing or fracking.

Life Cycle GHG Emission Study on the Use of LNG as Marine Fuel v1.0 44 of 154
Natural Gas Pipeline Transport
Natural Gas is transported by onshore and/or offshore pipelines from the Natural Gas production and
processing units to the liquefaction plant. All necessary processes are included: energy supply units
(diesel generator, gas turbine, electricity from the grid), and fugitive methane emissions.
Natural Gas Purification and Liquefaction
Before liquefaction, Natural Gas needs to be purified. Different liquefaction technologies have been
developed which use different cooling cascades and different refrigerants. The following process
steps and emission sources are taken into account for Natural Gas purification and liquefaction:
• Purification process, including removal of acid gas and sulphur recovery unit, gas
dehydration, removal of mercury, liquefied petroleum gas (LPG) recovery, carbon capture
and storage (CCS) technology to sequester the CO2 separated in the purification process (at
the considered countries, CCS is only applied in Norway)
• Liquefaction process itself, including heat exchanger, refrigerant cycles, etc.
• Onsite storage and loading facilities
• Energy supply units (diesel generator, gas turbine, electricity from the grid)
• Natural Gas methane emissions
LNG Carrier Transport
Liquefied Natural Gas is transported by dedicated LNG carriers. These vessels are equipped either
with steam turbine, dual-fuel diesel electric (DFDE), tri-fuel diesel electric (TFDE), M-type
electronically controlled gas injection (ME-GI), dual-fuel (X-DF) or slow speed Diesel (SSD)
propulsion systems. Due to the high outside temperature (compared with the LNG at -162°C), LNG
is warmed leading to some LNG evaporating to gaseous Natural Gas (called boil-off gas). This boil-
off gas either is used as propulsion fuel at steam, DFDE, TFDE, ME-GI, X-DF vessels or is re-liquefied
on-board (SSD). The “LNG carrier transport” includes:
• Transportation process, specifying the fuel demand
• Boil-off rates
• Energy supply processes (HFO2.5, MGO0.1, BOG)
• Fuel demand of the vessels due to loading and unloading operation (harbour operations)
• Natural Gas methane emissions
The propulsion type, fuel type, distance (round trip), boil-off rates, and usage of the boil-off gas (re-
liquefied or used as fuel) as well as the utilisation of the LNG carrier are taken into account. The time
the vessels spend both sailing and in port depends on the trip distance, the speed of the vessel, and
the time required for loading and unloading the tanks.
LNG Terminal Operations and Storage
This includes the storage and unloading activities, energy supply units (diesel generator, submerged
combustion vaporisers, boilers, electricity from the grid) and methane emissions.
Maritime LNG Bunkering
LNG terminals are marine terminals where LNG carriers unload or load the LNG. Often after storage,
the LNG can be either warmed-up to its gaseous state and fed into the Natural Gas transmission
network, or provided by means of pipelines, trucks, trains or LNG bunker barges to LNG consumers.
The focus of the study is on the provision of LNG to LNG fuelled ships.

Life Cycle GHG Emission Study on the Use of LNG as Marine Fuel v1.0 45 of 154
Three general pathways for maritime LNG bunkering operations are possible:
• ship-to-ship
• shore-to-ship
• truck-to-ship
This study focuses on ship-to-ship since it is the seen as the most common pathway, but a scenario
analysis is assessed for the alternative maritime bunkering pathways (please see section 6.7). The
following emission sources are considered: energy supply units (diesel generator, gas turbine,
electricity from the grid) and methane emissions.
Table 4-1 provides an overview on the elements and activities included and excluded from the system
boundary.
Table 4-1: System boundary – included and excluded elements or activities
Included Excluded
✓ Well drilling and well installation Seismic exploration and exploratory drilling
✓ Production and processing (CO2-
removal, water removal, H2S removal)
Infrastructure and maintenance efforts for
infrastructure (e.g., pipeline, LNG carriers,
liquefaction plants)
✓ Pipeline transport Auxiliary materials, like lubricants
✓ Purification and liquefaction Overhead of production plants, e.g., personnel
lodging and transport, employee commute,
administration
✓ LNG carrier transport Accidents
✓ LNG terminal and storage
✓ Maritime LNG bunkering
✓ Energy supply: gas turbine, gas engines,
diesel generators, grid electricity
✓ Methane emissions
✓ Consideration of co-products (crude oil,
NGLs, and LPG)
Previous work conducted demonstrated that the excluded data do not have a relevant influence on
the overall GHG results [14]. Seismic exploration and exploratory drilling activities may have an
impact resulting from methane emissions, but there is no useable information available, as exploration
activities may vary considerably from case to case, and from year to year. Because of this variability,
only data covering multiple years would make sense. Additionally, most of the other studies used for
benchmarking also did not take exploratory drilling into account, so it is excluded from consideration.
However, well drilling and well installation efforts are considered. Accidents are excluded since “LCA only accounts for impacts related to normal and abnormal operation of processes and products, but

Life Cycle GHG Emission Study on the Use of LNG as Marine Fuel v1.0 46 of 154
not covering, e.g., impacts from accidents, spills, and similar15”, as outlined in the European
Commission’s ILCD handbook on LCA [22]. Infrastructure is assumed to be negligible.
Time Coverage
The intended reference year for all primary data collected for the LNG supply is 2017, and 2016 if
2017 data are not available. The detailed reference years are given in Annex C and Annex D. The
reference period of the background data is from 2014 to 2017.
Technology Coverage
The technology covered in the study is described in detail in section 4.2 for all processes and for all
LNG supply chains under consideration. It is intended to cover all relevant technologies.
Geographical Coverage
The LNG consumption mix of a region considers the indigenous LNG production of the member
countries (if applicable) as well as the LNG imports from producing countries and LNG exports of the
member countries. The LNG consumption mixes of the five main bunker regions (Europe, North
America, Asia Pacific, China and Middle East) are analysed in this study, as well as a global LNG
consumption mix which is calculated based on these five regions. The approach for the calculation of
the consumption mixes is explained in Annex C.
4.1.4. System Boundary of the Oil-based Marine Fuel Supply
Figure 4-2 shows the Well-to-Tank system boundary for oil-based marine fuels HFO2.5, HFO>2.5,
MGO0.1, LSFO0.5, Blend and LSFO0.5, LScrude. After production and processing, the crude oil is transported
by pipeline and/or oil tanker from the crude oil producing country to the consuming region for the
production of the oil-based marine fuels in a refinery. The fuels are distributed by pipeline to the
bunkering terminal to be used as fuel for ships.
15 ”Accidents and accident-type leakages and spills shall not be inventoried as part of the normal life cycle inventory since they
are fundamentally different in nature from the production or operation related to normal and abnormal operating conditions that LCA relates to (other than e.g., fugitive emissions through seals and other “engineered losses” that are included in LCA). Accident modelling necessarily requires dealing with frequencies and with cause-effect chains (to assign them to the causing unit processes). Work on this Life Cycle Accident Assessment is still under methodological development, while a number of exploratory case-studies have been published.” [22].

Life Cycle GHG Emission Study on the Use of LNG as Marine Fuel v1.0 47 of 154
Figure 4-2: Well-to-Tank analysis – Oil-based marine fuel supply [9]
Analogue to LNG, the global consumption as well as five consuming regions are considered in the
Well-to-Tank Analysis of the oil-based fuels. Data are collected for each process step of the supply
chains from each producing country to each considered region. The considered regions as well as
the producing countries are addressed more precisely in section Geographical Coverage below.
Time Coverage
The intended reference year for all data collected for the oil-based fuel supply chains is 2017, and
2016 if 2017 data are not available. The detailed reference years are given in Annex C and Annex D.
The reference period of the background data is from 2014 to 2017.
Technology Coverage
The technology covered in the study is described in detail in section 4.2 for all processes and for all
oil-based fuel supply chains under consideration. It is intended to cover all relevant technologies.
Geographical Coverage
Analogue to LNG, the oil-based fuel consumption mix of a region considers the indigenous oil-based
fuel production of the member countries (if applicable) as well as the oil-based fuel imports from
producing countries and oil-based fuel exports of the member countries. The oil-based fuel
consumption mixes of the five main bunker regions (Europe, North America, Asia Pacific, China and
Middle East) are analysed in this study as well as a global oil-based fuel consumption mix which is
calculated based on these five regions. The approach for the calculation of the consumption mixes is
explained in Annex C.

Life Cycle GHG Emission Study on the Use of LNG as Marine Fuel v1.0 48 of 154
4.1.5. Multifunctional Processes and Allocation Rules
Multi-output allocation generally follows the requirements of ISO 14044, section 4.3.4.2. The main
products and co-products occurring in the given product systems are listed below:
• Products and co-products of “Crude Oil and Natural Gas production”: o Crude oil
o Natural Gas
o Natural Gas Liquids (NGL, i.e., mix of ethane, propane, butane, and higher
hydrocarbons)
• Products and co-products of “Natural Gas purification” (LNG supply chain): o Natural Gas
o Liquefied petroleum gas (LPG, i.e., mix of propane, butane)
The allocation was applied on the basis of the energy content (MJ LHV) as is common practice in
modelling oil and gas supply chains.
In Table 4-2, an example of the sensitivity on the allocation factors is displayed for the “Natural Gas Purification” step. Applying allocation by either energy or mass does not lead to different results due
to the nearly equal LHVs (~45-49 MJ/kg) of the different products. In both cases, the majority of the
environmental burdens is allocated to Natural Gas.
Table 4-2: Allocation factors for purification step based on energy content (based on mass
for comparison) [23]
Energy carrier Allocation factor
(energy)
Allocation factor
(mass)
Natural Gas (after treatment) 96.23 % 95.95 %
Propane (C3) 1.76 % 1.87 %
Butane (C4) 1.37 % 1.48 %
Pentane (C5) 0.64 % 0.70 %
For the “Crude Oil and Natural Gas production”, the choice of the allocation method is also of minor significance due to the similar LHVs of the different products. Hence, no further sensitivity analysis
was performed.
Allocation of the refinery efforts and background data (energy and materials) taken from thinkstep’s LCI databases is documented in [24].
Relevant for this study, the products and co-products of “combined heat and power generation (CHP)
units”, namely: thermal energy and electricity, are allocated based on exergy in accordance with the IPPC - BREF document on large combustion plants [25], one of the Best Available Techniques (BAT)
reference documents related to the Industrial Emissions Directive. CHPs are used during drilling, well
installation, production and processing of natural gas.
4.1.6. Cut-off Criteria
No cut-off was applied within the system boundary, apart from the infrastructure which is assumed to
be negligible. The system boundary was defined based on the relevance to the goal of the study (all
included and excluded processes are listed in Table 4-1). For the processes within the system
boundary, all available energy, material and activity data have been included in the model.
In cases where no matching life cycle inventories were available to represent a flow, proxy data have
been applied based on conservative assumptions regarding environmental impacts. The choice of
proxy data is documented in the report and an overview on the proxy data used is given in Annex E.

Life Cycle GHG Emission Study on the Use of LNG as Marine Fuel v1.0 49 of 154
4.2. Well-to-Tank – Inventory Analysis
4.2.1. Data Collection Procedure
Existing primary data from the NGVA study prepared by thinkstep [13] and information from
thinkstep’s GaBi LCI databases [14] and literature were used for the development of the fuel supply
chains. The data used were circulated among the consortium partners who were invited to validate
the data and to provide feedback and remarks. Additional primary data were collected for maritime
LNG bunkering using customised data collection templates, which were sent out by email to the
respective data providers in the participating companies. Upon receipt, each questionnaire was
crosschecked for completeness and plausibility. If gaps, outliers, or other inconsistencies occurred,
thinkstep engaged with the data provider to resolve any open issues. The following companies were
actively engaged in the data collection process and gave advice based on their individual expertise:
• Exxon Mobil Corporation
• Shell International B.V.
• Total S.A.
All three companies are major LNG as well as oil-based marine fuel suppliers operating globally.
The general data collection procedure is displayed in Figure 4-3.
Figure 4-3: Data collection procedure applied by thinkstep [26]
The inventory analyses for the LNG supply and the oil-based marine fuel supply are described below.
4.2.2. Inventory Analysis of the LNG Supply
Data for the Natural Gas production and processing of Algeria, Nigeria, Norway and Qatar are the
main sources of primary data from the NGVA study prepared by thinkstep [13]. The Natural Gas
production and processing data for Australia, Indonesia, Malaysia, Trinidad & Tobago are sourced
from thinkstep’s GaBi LCI databases [14]. US data for US unconventional gas production and
processing, including data on the latest analyses of fugitive emissions associated with hydraulic
fracturing (“fracking”), are provided by Exxon Mobil [27] and literature [28] [29], and data gaps closed
by thinkstep’s GaBi LCI databases [14]. However, all data used in the model were circulated among
respective data providers in the participating companies (i.e. Shell [30], Total [31] and Exxon Mobil
for the US LNG supply chain [27]) for validation and adapted, if necessary.
Preparation of data collection
Data collection
Validation of data
Reference of data to processes
Reference of data to a functional unit
Calculation of the GHG emission results
Improvement of system boundary
Ite
rati
on
Data collection sheet
Collected data
Validated data
Checked data per process
Checked data per functional unit
Calculated Life Cycle GHG Inventory
Completed Life Cycle GHG Inventory
Life Cycle GHG Emission Study on the Use of LNG as Marine Fuel v1.0 50 of 154
The life cycle inventories for the Natural Gas pipeline transport from the gas production and
processing fields to liquefaction plants as well as the liquefaction are sourced from thinkstep’s GaBi
LCI databases [14].
The composition of the fleets for the LNG carrier transport is calculated based on the distance and
the vessel capacities based on a study published by the International Gas Union (IGU) [32]. Data on
fuel consumption and methane emissions of the LNG carrier transport are taken from the NGVA study
[13] and thinkstep’s GaBi LCI databases [14], crosschecked with [33], [34] and additionally
crosschecked with primary data provided by representatives of Shell and Total [30] [31]. The fuel
consumption values were crosschecked with [32]. The distances for the LNG imports are calculated
based on [35].
Data for LNG terminal operations are taken from the NGVA study [13] and thinkstep’s GaBi LCI databases [14]. Shell provided primary data for maritime LNG bunkering [36], [30].
A detailed description of the inventory analysis of the LNG supply and the data sources and data
quality can be found in Annex D and Annex E.
4.2.3. Inventory Analysis of the Oil-based Marine Fuel Supply
The GHG emissions data on the country-specific crude oil supply are taken from the study “Global
carbon intensity of crude oil production” [37], published in 2018, as it is considered to be the most up-
to-date and most reliable public source currently available. The data are calculated based on the “Oil
Production Greenhouse Gas Emissions Estimator” (OPGEE) model v2.0 developed by the Stanford
University [38] and include all GHG emissions from the exploration, drilling, development, production
and extraction, surface processing, and transport to the refinery gate considering onshore and
offshore production as well as conventional and unconventional oil. In [37], default values have been
used for the crude oil transport and are included in the crude oil production data. Since this study at
hand, intends to represent the actual transports from the production country to the region of
consumption, the GHG emissions of the transport are subtracted from the total GHG emissions for
the crude oil supply [39] and life cycle inventories from thinkstep’s GaBi LCI databases [14] are used
to calculate the GHG emissions associated with the actual crude oil transport by pipeline and oil
tanker from the oil production and processing fields to the refinery.
The GHG emissions of the refining and distribution of the oil-based fuel by pipeline from the refinery
to the terminal to be used as fuel for ships are sourced from thinkstep’s GaBi LCI databases [14]. The
refinery key parameters16 are crosschecked with the PRELIM: Petroleum Refinery Life Cycle Model
developed by the University of Calgary [40].
4.2.4. Background Data
Background data (e.g., fuels, electricity, materials) are taken from thinkstep’s GaBi LCI databases
[14]. A list of the key background datasets is given in Annex E.
4.2.5. The GHG Models in the GaBi Software System
Based on the collected data from the NGVA study [13], information from thinkstep’s GaBi LCI
databases [14] and literature, the GHG model was developed and set up in the LCA software system
GaBi 8. It follows a modular approach. Each module consists of several single underlying processes
or other modules. The modules are connected via materials and energy flows, resulting in a
hierarchical system of modules representing the complete supply chain with each relevant process
step. Each module can be set up and maintained independently. As an example, a screenshot of the
16 E.g. refinery configuration, conversion rate, crude oil spec, energy use, etc.

Life Cycle GHG Emission Study on the Use of LNG as Marine Fuel v1.0 51 of 154
module “Liquefied Natural Gas (LNG) Mix” is shown in Figure 4-4 (Sankey diagram) with each box
representing another module.
The GHG model:
• allows modular model set-up
• enables the hierarchical structuring of processes
• provides comprehensive analysis functionalities
• provides access to all necessary background data needed.
Figure 4-4: GaBi screenshot of the Liquefied Natural Gas Mix (LNG) Mix as modelled
(Sankey diagram) (Example: Europe) [26]

Life Cycle GHG Emission Study on the Use of LNG as Marine Fuel v1.0 52 of 154
The GHG model of the global LNG supply chain consists of 5 modules representing the 5 region-
specific LNG supply chains. Each of these region-specific LNG supply chains include the supply
chains of 4 to 6 LNG producing countries. Each of these country-specific LNG supply chains countries
include modules covering all relevant process steps of the LNG supply chain from Natural Gas
production and processing, pipeline transport, purification and liquefaction, LNG carrier transport,
LNG terminal operations and storage to LNG bunkering. These modules are set-up generically and
allow an easy transfer of the collected region-, country- and process-specific data into the GHG
models.
The GHG models of the oil-based marine fuel supply chains are set up in the same way.
4.3. Well-to-Tank – GHG Emissions
4.3.1. Well-to-Tank GHG Emissions of LNG
This section presents the results for the Well-to-Tank GHG emissions of the LNG supply.
It is important to note once again that the reported impact category “Global Warming Potential GWP100” represents impact potentials and not actual observed impacts. In addition, the inventory only
captures that fraction of the total environmental load that corresponds to the functional unit chosen
(relative approach). GHG results are therefore relative expressions only and do not predict actual
impacts, exceeding of thresholds, safety margins, or risks. Furthermore, they do not express an effect
on any other environmental impacts apart from global warming. As mentioned in section 3.3, the
following IPCC AR5 characterisation factors have been used for the main GHG emissions. 1 CO2,
30 CH4, 265 N2O.
The GHG results are displayed for the global LNG supply. The GHG results for the five LNG
consumption regions can be found in Annex E. An overview of the GHG results in grams of CO2-eq
per MJ of lower heating value (LHV) delivered to the tank is provided in Figure 4-5. The results are
broken down by the main process steps of the LNG supply chain.
Figure 4-5: Well-to-Tank – GHG Emissions: Global LNG supply – breakdown by main
process steps [23]
Table 4-3 presents GHG emissions of the global LNG supply in a corresponding table.

Life Cycle GHG Emission Study on the Use of LNG as Marine Fuel v1.0 53 of 154
Table 4-3: Well-to-Tank – GHG Emissions: Global LNG supply – breakdown by main
process steps [23]
GHG IPCC - AR5 [g CO2-eq/MJ (LHV)], in tank Global LNG supply
Gas production, processing and pipeline transport 6.1
Gas liquefaction (including purification) 9.2
LNG carrier transport 2.5
LNG terminal operations and maritime bunkering 0.7
TOTAL LNG 18.5
Figure 4-6 displays the same overall results as Figure 4-5 and Table 4-3, but are broken down into
the main individual emissions CO2, CH4, and N2O. CO2 is the main contributor to the GHG emissions,
followed by CH4. N2O only contributes to a very small extent, and the contributions of other
greenhouse gases also included in the life cycle inventory data are orders of magnitude smaller and
therefore not shown in the Figure and the Table.
Figure 4-6: Well-to-Tank – GHG Emissions: Global LNG supply – breakdown by main
individual emissions [23]
Table 4-4 presents results of the global LNG supply broken down by main individual emissions in a
corresponding table.
Table 4-4: Well-to-Tank – GHG Emissions: Global LNG supply – breakdown by main
individual emissions [23]
GHG IPCC - AR5 [g CO2-eq/MJ (LHV)], in tank Global LNG supply
CO2 13.7
CH4 4.7
N2O 0.1
TOTAL LNG 18.5
The key findings of the LNG supply are stated in the following:
• The carbon footprint of the global LNG supply, in tank is 18.5 g CO2-eq/MJ (LHV).
• The GHG emissions are dominated by gas production, processing and pipeline transport
(33 %) and gas liquefaction (including purification) (50 %), followed by LNG carrier transport
(13 %) and LNG terminal operations and bunkering (4 %).

Life Cycle GHG Emission Study on the Use of LNG as Marine Fuel v1.0 54 of 154
• Carbon dioxide is the major contributor to LNG supply chain GHG emissions (74 %), followed
by methane (25 %). N2O only contributes to a very small extent (0.5 %)17. Other GHG
emissions are taken into account but can be ignored. The CO2 emissions mainly come from
fuel combustion at gas turbines, with small amounts of CO2 vented during processing and
purification of Natural Gas (CO2-removal) if no carbon capture and storage is applied. The
main sources for the CH4 emissions are fugitive emissions.
• The contributions of other greenhouse gases also included in the life cycle inventory data are
orders of magnitude smaller (<0.02 % in total) and therefore excluded from the chart.
• This study focuses on ship-to-ship maritime LNG bunkering. The possible alternatives shore-
to-ship and truck-to-ship are also analysed (see section 6.7).
4.3.2. Well-to-Tank GHG Emissions of Oil-Based Marine Fuels
An overview of the GHG results of the current oil-based marine fuels in g CO2-eq/MJ (LHV) fuel
delivered to the tank is provided in Figure 4-7. The results are broken down by the main process steps
of the fuel supply chains. The fuel supply chains of HFO2.5 and MGO0.1 show similar GHG emission
profiles. The global GHG emissions for the HFO2.5 supply are 6 % less compared with the MGO0.1
supply. Compared with the HFO2.5 supply, the supply of MGO0.1 requires more crude oil feedstock
(causing higher GHG emissions for the oil production, processing and transport) as well as more
energy intensive refinery processes (causing higher GHG emissions for refining) per MJ (LHV) of fuel.
Similar results for HFO2.5 and MGO0.1 are confirmed by the study “Life Cycle Assessment of
greenhouse gas emissions from marine fuels”, published in 2018 [41]. The global GHG results are
dominated by oil production, processing and transport (67-68 %) and refining (29-31 %). The marine
fuel distribution has a low impact on the results (3 %).
Figure 4-7: Well-to-Tank – GHG Emissions: Current global oil-based marine fuel supply -
breakdown by main process steps [23]
Figure 4-8 provides the GHG results for the considered post-2020 scenarios for oil-based marine
fuels in g CO2-eq/MJ (LHV) fuel delivered to the tank. It should be noted that there is a large number
of fuels which could be considered for post-2020 regarding different levels of desulphurisation and
blending ratios. This study considers the fuels defined by the project consortium (please see Table
3-1). The results are broken down by the main process steps of the fuel supply chains. The GHG
emission profiles of the post-2020 scenarios are in the same range. The global results are dominated
17 N2O emissions occur during combustion processes within the LNG supply chain and they are included in the background
data used. Other GHG emissions, like halogenated organic emissions, are included in the background data (e.g. electricity supply) and thus taken into account.

Life Cycle GHG Emission Study on the Use of LNG as Marine Fuel v1.0 55 of 154
by oil production, processing and transport (67-68 %) and the refining (29-31 %). The marine fuel
distribution has an impact of 3 % on the results. Depending on the amount of crude oil feedstock and
the specific refinery processes, the contributions of the main process steps of the fuel supply chains
vary per MJ (LHV) of fuel. The GHG result for MGO0.1 is the same for post-2020 and today because
it is produced in post-2020 in the same way as today. HFO>2.5 shows the same GHG emissions as
for the current fuel HFO2.5, since it is produced in the same way as HFO2.518. Exhaust gas cleaning
systems at the ships are used for HFO>2.5 to meet the SOx limit. The GHG profile of the LSFO0.5, Blend
supply is insignificant higher compared with the supply of HFO>2.5 due to the additional
desulphurisation needed. The supply of LSFO0.5, LScrude shows a insignificant better performance than
the supply of HFO>2.5 due to less desulphurisation within the whole refinery.
A further scenario analysis is conducted on the additional GHG emissions for LSFO0.5, Blend which are
estimated to be in the range of 2 to 10 %, depending on the blending ratio between residual and
distillate fuels [11]. For details, please see section 6.7 “Scenario Analysis on the GHG Emissions for
the Supply of LSFO0.5, Blend”.
Figure 4-8: Well-to-Tank – GHG Emissions: Global oil-based marine fuel supply “post-2020” - breakdown by main process steps [23]19
In summary, the calculated global results of the current oil-based marine fuel supply chains and the
post-2020 scenarios on oil-based marine fuel supply chains are quite similar, ranging from 13.2 to
14.4 g CO2-eq/MJ (LHV) fuel. The calculation of the WtT GHG results of refinery products is
associated with uncertainties. Different crude oil properties and refinery settings, different levels of
desulphurisation and blending ratios, and assumptions made, as well as methodological differences
such as different allocation methods can lead to different results. This uncertainty is addressed in a
sensitivity analysis in the context of the entire Well-to-Wake life cycle, see section 6.8.3. However,
the GHG emissions for oil-based marine fuel supply chains will not change significantly after 2020.
18 It is very likely that the sulphur content will increase post-2020. CONCAWE, for instance, estimates an increase of the
average sulphur content of post-2020 HFO to potentially 4.2 wt. % for European refineries [12]. This is expressed by HFO>2.5. 19 Remember that LSHO0.5, Blend and LSFO0.5, LScrude are two sample options (scenarios) of many.

Life Cycle GHG Emission Study on the Use of LNG as Marine Fuel v1.0 56 of 154
4.4. Well-to-Tank – Comparison with Other Studies
Comparison of the WtT GHG Emissions LNG with Other Studies
The GHG results of the global LNG supply presented above were compared with the GHG intensity
reported in other public studies. Since some results relate to GHG IPCC AR5 and others to GHG
IPCC AR4 (for details of AR4 vs. AR5, see Annex B), the GHG benchmarking is split into two tables
for comparability. Table 4-5 shows a comparison of the results with other studies evaluated according
to GHG IPCC AR5, while Table 4-6 shows the results based on GHG IPCC AR4. It is important to
note that the scopes of the studies differ and therefore the results of the studies are only comparable
to a certain extent and with care.
Table 4-5 shows the comparison with the GREET model [42] developed by the Argonne National
Laboratory based on GHG IPCC AR5. The GREET model considers the LNG supply (as a
transportation fuel) of the United States including LNG from indigenous Natural Gas production
(conventional and unconventional Natural Gas) but no LNG imports. Reference year of the data is
mainly 2016. Compared with the GREET model, this study at hand calculates 6 % lower GHG
emissions for the global LNG supply. After adapting the North American LNG supply of this study
(representing the consumption mix of Canada, Mexico and the United States) to 100% US LNG
supply, the differences between GREET and this study are smaller, showing 3 % lower GHG
emissions for the US LNG supply chain compared with the GREET result. The differences are within
acceptable limits considering small differences in the scope, e.g. this study analysis only large-scale
LNG production. Summarized, excellent consensus with GREET
Table 4-5: WtT - GHG Emissions: LNG supply - benchmarking (GHG IPCC - AR5) [23]
LNG supply [g CO2-eq/MJ (LHV)]
This study (global LNG supply) 18.5
This study (100% US LNG supply without imports) 19.2
GREET 2018 [42] (US LNG supply) 19.7
Table 4-6 shows the comparison with other studies based on GHG IPCC AR4.
The similarity of the results between this study at hand and the NGVA study is not surprising as data
from the NGVA study served as a basis for this study. Small differences in the scope (reference year,
LNG consumption mix and distribution) do not have a notable impact on the results for the European
LNG supply chains.
The GHG emission results for the European LNG supply in this study are 19 % lower than the GHG
emissions of the Exergia study [43]. The Exergia study is based mainly on literature data from 2012.
Differences between the results are mainly related to different kind of data for the LNG supply chains
(primary data derived from NGVA study versus data from public sources in Exergia) and differences
in the scope (reference year, LNG consumption mix and distribution). More detailed information on
the debate can be found in the NGVA study in chapter 5.4: Well-to-Tank – Comparison with other
Studies. [13].
The JEC-WtW study [3] is based on data mainly from 2010 and considers the European LNG supply
for use in vehicles, explaining the differences of 3 % between the results for the European LNG supply
(JEC-WtW 19.4 vs. this study 19.9 g CO2-eq/MJ (LHV).
The TNO - CE Delft study [44] considers the supply of LNG for road transport from Qatar to Europe
in 2025. For comparability, the European LNG supply of this study (representing the consumption mix
of Europe) is adapted to 100% European LNG supply from Qatar. The GHG emissions of the

Life Cycle GHG Emission Study on the Use of LNG as Marine Fuel v1.0 57 of 154
European LNG supply in this study are 9 % lower than the results of the TNO - CE Delft study which
could be explained by differences in the methodology, scope, data, assumptions, etc.
Eight different pathways for the LNG supply in the United States were analysed in a study published
by the ICCT [45] analysing indigenous and imported LNG and differences in LNG liquefaction (small
scale and large scale), distribution and storage. The results of the considered pathways vary
significantly. More detailed information can be found in the ICCT study, in chapter 2: Analysis of LNG
Pathways [45]. The GHG emissions for the North American LNG supply of this study and for the
adapted North American LNG supply with 100% LNG supply from the USA are within the range of
these results.
Table 4-6: WtT - GHG Emissions: LNG supply - benchmarking (GHG IPCC – AR4) [23]
LNG supply [g CO2-eq/MJ (LHV)]
This study (global LNG supply) 17.7
This study (North American LNG supply) 17.9
This study (100% US LNG supply, without imports) 18.1
This study (European LNG supply) 19.9
This study (European LNG supply from Qatar) 15.4
NGVA 2016 [13] (European LNG supply) 19.9
Exergia 2015 [43] (European LNG supply) 24.6
JEC-WtW 2014 [3] (European LNG supply) 19.4
TNO - CE Delft 2013 [44] (European LNG supply from Qatar) 17.0
ICCT 2013 [45] (US LNG supply) 13.1-33.3
The comparison with other studies reveals that the results are in the same order of magnitude.
Differences can be explained by differences in the scope of the studies.
Life Cycle GHG Emission Study on the Use of LNG as Marine Fuel v1.0 58 of 154
5.1. Tank-to-Wake – Scope of the Study
The following sections describe the scope of the Tank-to-Wake analysis to achieve the stated goals.
This includes, but is not limited to, the identification of specific product systems to be assessed, the
product function, functional unit and reference flows, the system boundary, handling of multifunctional
processes, and cut-off criteria of the study.
5.1.1. Product System
The product system of the Tank-to-Wake section is the combustion of the fuels described in
section 4.1 and its related emissions. It is described in more detail in the following paragraphs.
5.1.2. Product Function and Functional Unit
The function of the Tank-to-Wake product system is the power to serve the transport of goods and/or
people by marine ships. The engine energy output expressed in kWh is the property to be used to
describe the functional unit. The functional unit is to provide 1 kWh brake power. The reference flow
related to the defined functional unit is 1 kWh brake power specific unit. For instance, GHG emissions
are expressed in g CO2-eq/kWh.
The relation to kWh ensures that the main objective of the study, the evaluation of GHG emissions of
LNG as marine fuel compared with conventional oil-based fuels is achieved. The evaluation of GHG
emissions of the transportation itself (e.g. emissions per cargo and nautical mile) is not within the
scope of this study as well as the consideration of different ship applications, e.g. cargo, ferries,
cruises.
5.1.3. System Boundary
The Tank-to-Wake process includes the combustion of the defined fuels in marine engines and all
auxiliary services needed to run the engine excluding services that are ship specific (such as cabin
heating, electricity generation on board, cooling/heating of cargo, etc.). This includes the energy
consumption for fuel, gas, oil and coolant pumps and the energy and material needed for the
treatment of exhaust gases to comply with emission regulations within and outside ECA regions.
These treatment systems are:
• Exhaust Gas Cleaning System (EGCS) (also called: scrubber) to decrease sulphur oxide
emissions if needed.
• IMO Tier III-NOX limit compliant after-treatment systems if needed. This can include Selective
Catalytic Reduction (SCR) or Exhaust Gas Recirculation (EGR).
The Tier III NOX limit is chosen because it is the most onerous regulation (the direction in which
regulation is likely to travel). In addition, Tier II results are also calculated and presented in Annex G.
The study assesses the global warming potential as defined in section 3.3 and the local pollutants
described in section 3.4, that occur during the regular operation of the engines. All emissions from
the engines are considered including gases from the complete or incomplete combustion process, as
well as unburned gases and emissions.
5. Tank-to-Wake Analysis

Life Cycle GHG Emission Study on the Use of LNG as Marine Fuel v1.0 59 of 154
For clarification, the production and end of life (EoL) of the ship are not within the system boundary
since this study compares different marine fuels on an engine basis. In general, it can be assumed
that the manufacturing and EoL of ships for the different engine technologies are very similar. The
GHG emissions of the manufacturing and EoL of the engine themselves is estimated be of minor
relevance for the total life cycle Well-to-Wake GHG emissions, considering that ship engines are
typically 20-30 years in operation. Table 5-1 summarises the elements that are included and excluded
in the Tank-to-Wake part of the analysis.
Table 5-1: System boundary for Tank-to-Wake analysis
Included Excluded
✓ Use of fuel in marine engines
✓ Emissions from combustion (complete and
incomplete)
✓ Auxiliary material needed for the exhaust gas
cleaning system (e.g. urea solution for SCR
systems)
✓ Emissions that may occur due to the use of
exhaust gas cleaning systems (EGCS)
✓ Fuel consumption needed to run fuel, gas, oil
and coolant pumps
✓ Fuel consumption needed to run exhaust gas
after-treatment systems such as scrubber
(only for HFO operation) and SCR or EGR
Efficiencies of the propulsion system from
engine shaft to propeller
Manufacturing and EoL of the engines and
exhaust gas cleaning systems
Potential CO2 emissions occurring from the
dilution of SOX-emissions and their chemical
reactions in sea water (when operating an
open loop EGCS)20
Energy (and related emissions) needed for
the removal of waste products (e.g. HFO
sludge, sludge from closed loop EGCS, etc.)
Emissions that occur during the switch of
LNG to fuel oil operation of dual fuel engines
(and vice versa)
Time Coverage
The data considered in this study reflect existing technologies that are available on the market today
or within the near future. Potential future improvements are considered as a scenario (see
section 6.7). The intended reference year for all primary data collected for marine engines is 2018.
As engines entering the market today are typically in operation for several years, the data collected
today can be seen as valid for the upcoming years, especially for the considerations with post-2020
fuels.
Technology Coverage
The engine technology covered in the study is described in detail in section 5.2 for all fuels under
consideration, including specific characteristics regarding fuel consumption and emissions.
For all applications, a share of 100 % fossil fuels is considered. This enables an equal starting point
for comparison with other studies. Hence, the possible bio-shares of existing fuels are not taken into
consideration.
The following section provides an outline of the relevant engine technologies. The study includes the
most important engine technologies for marine ships. Figure 5-1 shows an overview of the engines
and fuels used in shipping in 2015 [17]. More than 70 wt.% of the fuel used in shipping (267 million
tons in total including residual and distillate fuel as well as LNG) is burned by 2-stroke slow speed
Diesel engines (SSD: 68 wt. % residual fuel, 4 wt. % distillate fuel)21 followed by 4-stroke medium
speed Diesel engines (MSD: 10 wt. % residual fuel, 8 wt.% distillate fuel). The two engine
20 For more details see section 5.1.5 21 Residual fuel is mainly HFO, distillate fuel mainly MGO.

Life Cycle GHG Emission Study on the Use of LNG as Marine Fuel v1.0 60 of 154
technologies hence burn 90 wt. % of the overall fuel. 4-stroke high speed engines (HSD) running on
distillate fuels have a share of 6 wt. %. The amount of fuel burned in gas turbines and steam turbines
is low compared with the reciprocating engines and accounts for only 2 wt. %.
Due to the high proportion of 2-stroke slow speed and 4-stroke medium speed engine for the marine
market, the study focuses on these engine technologies. Nevertheless, high-speed engines and gas
turbines are included for completeness.
Figure 5-1: Fuel used in marine engines in the year 2015; breakdown by residual and
distillate fuels and different engine technologies, based on [17]
2-stroke engines:
2-stroke engines are mainly slow speed engines with engine speeds below 300 revolutions per
minute (rpm) [46]. They have the highest efficiency among marine reciprocating engines and are the
most common engine in marine propulsion. Due to the high engine efficiency and high power, 2-
stroke engines are mainly used for large ocean-going cargo ships. The engines considered in the
study are dual fuel engines (DF) that can run on oil-based fuels (HFO, LSFO, or MGO) and on LNG,
and can also be differentiated between a high and low-pressure injection systems. Depending on the
size of the bore and number of cylinders, 2-stroke engines cover a range from below 5 up to 75 MW.
When running on oil-based fuel, the combustion is based on a Diesel combustion cycle22. In LNG
operation engines can either of two different combustion cycles:
• Engines running in a Diesel cycle (SS-Diesel-DF) inject the gas in the compression stroke
(hence a high-pressure injection system is needed) and ignite it with a small amount of pilot
fuel. The most prominent engine in the market is the MAN ME GI engine. [47]
• Engines running in an Otto cycle (SS-Otto-DF) mix the gas with the air prior to the cylinder
and ignite it with a small amount of pilot fuel. Win GD offers Otto cycle dual fuel engines that
use a low-pressure injection system (e.g. the X-62 DF, X-72 DF etc).
The high-pressure engines have a good fuel economy. However, after-treatment systems are needed
to be able to comply with the IMO Tier III NOX limits in both oil-based fuel and LNG operation. The
low-pressure Otto-DF engine complies with the Tier III limits without after-treatment when using LNG
[47].
22 A more detailed description of the differences between Diesel and Otto cycle combustion in marine engines can be found in
[47].

Life Cycle GHG Emission Study on the Use of LNG as Marine Fuel v1.0 61 of 154
4-stroke engines:
4-stroke engines can be distinguished by different characteristics. Medium speed (MS) engines
normally range between 300 and 1000 rpm, while high speed (HS) operate above 1000 rpm [46]. MS
engines typically cover the power range up to 20 MW whereas HS engines are provided for the lower
one-digit MW range.
The latter usually have lower efficiencies but tend to be used in applications where engine response
is more important. 4-stroke engines have a different ship design/dimensions and are more operational
flexible compared with 2-stroke engines. 4-stroke medium speed engines are typically used in cruise
ships and ferries. Within medium speed engines, there are single and dual fuel (DF) engines. Dual
fuel engines can run on oil-based fuel and on LNG. Depending on the fuel used, the engines run on
a Diesel combustion cycle (oil-based fuel) or on an Otto cycle (LNG) (see also Table 5-2). The most
prominent manufacturers of 4-stroke medium speed dual fuel engines are MAN, Wärtsilä, Caterpillar
and HiMSEN [47]. Single fuel engines are either designed for operation with oil-based fuels (CI =
compressed ignition, Diesel combustion cycle) or LNG operation (SI = spark ignited combustion, Otto
combustion cycle). The high-speed engines investigated in this study are limited to single fuel engines
(CI for oil-based fuel and SI for LNG).
When running on oil-based fuels, all engine technologies need after-treatment systems to comply
with the Tier III limits. When running on LNG, no treatment system is needed as the formation of NOX
is lower.
In modern reciprocating engines (2-stroke and 4-stroke), part of the heat produced by the engine is
used for fuel treatment. Additionally, the heat in the exhaust gas can be used by waste heat recovery
systems for the generation of electricity for on-board services. However, as the study is focused on
the main engine only and not on the ship, waste heat recovery systems are not included 23.
Simple cycle gas turbines (GT):
Gas turbines can burn either low sulphur oil-based fuel (assumed as MGO0.1) or LNG. Due to the
combustion relying on the Brayton cycle, the efficiency of gas turbines is lower than that of the
reciprocating engines described above. Due to the high energy density, gas turbines are mainly used
in applications where installation space is limited, e.g. fast ferries. For both LNG and MGO0.1, Tier III
limits can be met without additional after-treatment.
Combined cycle gas turbines (CCGT):
Combing a gas turbine with a steam turbine increases the overall efficiency of the system. Hence
combined cycle gas turbines have an efficiency similar to that of reciprocating engines. Again,
compliance with the IMO Tier III limit is achieved for both MGO and LNG operation.
Engines and marine fuels considered:24
As presented, Table 3-2 shows the engine technologies explained above in combination with the fuel
which can be burned in these engines. The relevant combinations are marked with x and are mainly
related to the technical capabilities of the systems at hand. E.g. high-speed engines as well as gas
turbines have higher restrictions regarding fuel quality and can only run on MGO or LNG. Therefore,
HFO operation is not considered for these engines.
To be able to adequately compare oil-based fuel operation to gas operation the engines are clustered
as shown in Table 5-2 based on the underlying combustion cycle. Running on oil-based fuels, the 2-
stroke slow speed engines both (low-pressure and high pressure) run on a Diesel combustion cycle
23 A paper by MAN suggests that the overall efficiency (engine + waste heat recovery system) could be increased by 5 % [79]. 24 Steam turbines are not analysed in this context due to the small number of vessels in operation and less common technology.
However, within the LNG supply chain, steam turbines are considered as engine technology in LNG carriers in this study. The use of natural gas in fuel cells is also not investigated within this study.
Life Cycle GHG Emission Study on the Use of LNG as Marine Fuel v1.0 62 of 154
and are hence aggregated to one reference value25. When running on LNG, the combustion cycle is
different as mentioned above and the engines are distinguished accordingly. As both 4-stroke
medium speed DF and CI engine run on a Diesel combustion cycle when using oil-based fuels,
efficiencies are comparable and hence the consumption and emission data are aggregated to one
reference value which can be compared with LNG SI and DF engines. 4-stroke HS engines as well
as GT and CCGT are as described above only evaluated on MGO0.1 and LNG. A brief explanation of
the calculation of the engine efficiency based on the fuel consumption is given in Annex B.
Table 5-2: Clustered engine technology overview by fuel type
Oil-based fuels Gas-based fuel
HFO, LSFO0.5, Blend,
LSFO0.5, LScrude
MGO0.1 LNG
2-stroke SS-Diesel 2-stroke SS-Diesel-DF
2-stroke SS-Otto-DF
4-stroke MS-Diesel-CI/DF 4-stroke MS-Otto-SI
4-stroke MS-Otto-DF
not applicable 4-stroke HS-Diesel-CI 4-stroke HS-Otto-SI
not applicable GT GT
not applicable CCGT CCGT
Geographical Coverage
The maritime industry operates on a global scale and the data collected from the engine manufacturers are globally on duty and hence representative.
5.1.4. Multifunctional Processes and Allocation Rules
There is no multifunctional process in the Tank-to-Wake part of the assessment for marine engines
as the only output of the system is propulsion energy.
5.1.5. Cut-off Criteria
As summarised in section 5.1.3, the system boundaries are defined based on relevance to the goal
of the study.
GHG impacts that potentially occur as a result of a chemical reaction of used Exhaust Gas Cleaning
System (EGCS) cleaning water (on open loop EGCS) and sea water are neglected in this study.26
Emissions that occur due to the removal of waste products coming from the EGCS or from fuel
treatment are not included as they are dependent on the actual technology used onboard a ship. Non-
methane hydrocarbon emissions from LNG are neglected due to their negligible contribution to the
GWP on a Well-to-Wake basis (less than 0.5 %).
25 For a more detailed explanation of the aggregation process, see section 5.2. 26 A scrubber cleans the exhaust gases of SOX emissions by using a solvent that is sprayed into the exhaust gas. The solvent
reacts with the sulphur oxide emissions to form sulphuric acid. In open-loop EGCS (scrubber) sea water is used as solvent. The acidic water is discharged to the sea. According to [66] the discharged scrubber acidic water triggers a reaction with bicarbonates creating CO2 which is released to the atmosphere.
According to [64], the molar ratio of SOX released during combustion (and eventually discharged as acidic water into sea) to CO2 released to the atmosphere is assumed to be 1.7 (resulting in 1.17 g CO2 / g SO2 [23]) which shows that with the sulphur contents assumed within this study, this effect is minor. This represents a conservative approach with respect to the potential benefits of LNG, as the CO2 emissions would increase the GHG emissions of oil-based fuels and not LNG fuelled vessels.

Life Cycle GHG Emission Study on the Use of LNG as Marine Fuel v1.0 63 of 154
5.2. Tank-to-Wake – Inventory Analysis
5.2.1. Data Collection Procedure
For the Tank-to-Wake analysis, primary data were collected from engine manufacturers and ship
operators (for EGCS) using customised data collection questionnaires (spreadsheets), which were
distributed by email to the data providers in the participating companies. The collected data include
consumption and emission data for engines running on LNG, MGO and HFO for 25 , 50 %, 75 %
and 100 % of the maximum continuous rating of the engine (engine load). A webinar was organised
introducing the questionnaire to the data providers. Upon receipt by thinkstep, each questionnaire
was crosschecked for completeness and plausibility. If gaps, outliers, or other inconsistencies were
identified, thinkstep engaged with the data provider to resolve such issues bilaterally. The following
companies provided primary Tank-to-Wake information directly and gave advice based on their
individual expertise:
• Carnival Corporation & plc
• Caterpillar MaK
• Caterpillar Solar Turbines
• GE Aviation
• MAN Energy Solutions SE
• MTU Friedrichshafen GmbH
• Winterthur Gas & Diesel Ltd.
• Wärtsilä Oyj Abp
Experts from DNV-GL were included for their expertise in marine energy management and for
crosschecking of the consumption mark-ups for auxiliary services as described in the following
section.
The data were provided in brake power specific units (kWh) per individual engines and per engine
load point and clustered as shown in Table 5-2. The individual data points are averaged for the
different engine load points resulting in one average value for each load point and each engine
technology. For reciprocating engines, the load points are further weighted according to the IMO
E2/E3 cycle as described in Annex B. For gas turbines with simple and combined cycle, the 75 %
and 100 % load point are averaged as the IMO E2/E3 cycle does not apply here. All data refer to the
LHV listed in Table B-5 and Table B-6 in Annex B and are shown in detail in Table 5-8 to Table 5-12.
The engine manufacturers provided between 1-3 representative datasets each representing
consumption and emission data of one individual engine out of their portfolio. Table 5-3 shows an
overview of the number of datasets that were collected for the different engine technologies.
Table 5-3: Overview of the collected datasets of the engine manufacturers separated in fuel
and engine technology
Oil-based fuels Gas-based fuel
HFO2.5 MGO0.1 LNG
2-stroke SS-Diesel-DF or Otto-DF 3 6 3 + 3
4-stroke MS-Diesel-CI 2 2 not applicable
4-stroke MS-Diesel-DF or Otto-DF 2 2 4
4-stroke MS-Otto-SI not applicable not applicable 2
4-stroke HS-Diesel-CI not applicable 1 not applicable
4-stroke HS-Otto-SI not applicable not applicable 1
Gas turbine simple cycle (GT) not applicable 2 2
Gas turbine combined cycle (CCGT) not applicable 2 2

Life Cycle GHG Emission Study on the Use of LNG as Marine Fuel v1.0 64 of 154
For the 2-stroke slow speed engines, six datasets were provided for the operation on MGO and three
for the operation of HFO. Three datasets each were provided for the two LNG technologies (Diesel-
DF and Otto-DF). As described in section 3, 4-stroke medium speed CI and DF engines are
aggregated as one engine technology when using oil-based fuels. In total eight datasets have been
provided equally distributed for HFO and MGO operation. For LNG operation, four datasets for DF
engines and two datasets for SI engines have been used. Data for the high-speed engine were
provided by one OEM for MGO and LNG operation. The two gas turbine suppliers each provided one
representative dataset for MGO and LNG in simple and combined cycle operation. In total, 39 engine
specific datasets have been collected and evaluated.
5.2.2. Tank-to-Wake – Inventory Analysis
In the following section, the inventory of the Tank-to-Wake analysis is described in detail explaining
the datasets which comprise test-bed data (data from engine laboratories) for marine engines running
on LNG, MGO and HFO.
A general description on the different data collected broken down by the specific fuel consumption,
CH4, N2O, NOX, PM and SOX emissions including relevant calculations and assumptions is provided
followed by the description of the actual data collected.
General Description of the Data Collected
Fuel consumption (SFOC):
Due to differing test-bed capabilities, not all engine manufacturers were able to provide fuel
consumption and emission data on MGO and HFO. In these cases, HFO data is derived from MGO
consumption data, the ratio of the LHV (Annex B, Table B-6) of HFO2.5 and MGO0.1 is used. For the
analyses of LSFO0.5, Blend as well as LSFO0.5, LScrude, consumption data is derived from HFO2.5 in the
same manner (Annex B, Table B-6).
For oil-based marine fuel operation, delivered data are in most cases not separated into pilot and
main fuel consumption as the pilot fuel consumption is included in the main fuel consumption.
As described in section 5.1.3, the auxiliary services needed to run the main engine are included in
the system evaluated. However, the pump setup differs from engine to engine and is not always
included in the test-bed data. Therefore, mark-ups representing the additional energy consumption
needed for their operation are derived [48] [49] [50] [51] [52] [53] [54] [55] and applied if not already
included in the data provided (Table 5-4). The energy needed for oil and fuel supply is included in the
figure “general pumps”. The high-pressure LNG pump is only needed for the operation of the 2-stroke
SS Diesel-DF engine (see section 5.1.3) due to the high injection pressure (300 bar).
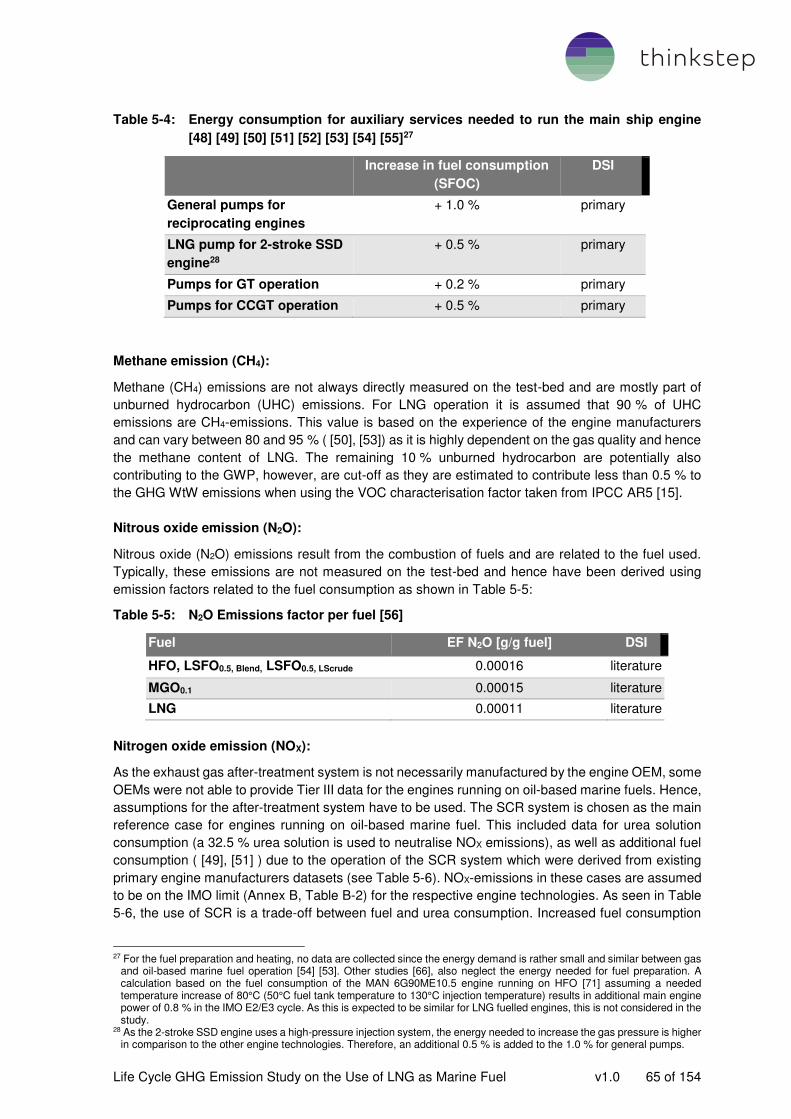
Life Cycle GHG Emission Study on the Use of LNG as Marine Fuel v1.0 65 of 154
Table 5-4: Energy consumption for auxiliary services needed to run the main ship engine
[48] [49] [50] [51] [52] [53] [54] [55]27
Increase in fuel consumption
(SFOC)
DSI
General pumps for
reciprocating engines
+ 1.0 % primary
LNG pump for 2-stroke SSD
engine28
+ 0.5 % primary
Pumps for GT operation + 0.2 % primary
Pumps for CCGT operation + 0.5 % primary
Methane emission (CH4):
Methane (CH4) emissions are not always directly measured on the test-bed and are mostly part of
unburned hydrocarbon (UHC) emissions. For LNG operation it is assumed that 90 % of UHC
emissions are CH4-emissions. This value is based on the experience of the engine manufacturers
and can vary between 80 and 95 % ( [50], [53]) as it is highly dependent on the gas quality and hence
the methane content of LNG. The remaining 10 % unburned hydrocarbon are potentially also
contributing to the GWP, however, are cut-off as they are estimated to contribute less than 0.5 % to
the GHG WtW emissions when using the VOC characterisation factor taken from IPCC AR5 [15].
Nitrous oxide emission (N2O):
Nitrous oxide (N2O) emissions result from the combustion of fuels and are related to the fuel used.
Typically, these emissions are not measured on the test-bed and hence have been derived using
emission factors related to the fuel consumption as shown in Table 5-5:
Table 5-5: N2O Emissions factor per fuel [56]
Fuel EF N2O [g/g fuel] DSI
HFO, LSFO0.5, Blend, LSFO0.5, LScrude 0.00016 literature
MGO0.1 0.00015 literature
LNG 0.00011 literature
Nitrogen oxide emission (NOX):
As the exhaust gas after-treatment system is not necessarily manufactured by the engine OEM, some
OEMs were not able to provide Tier III data for the engines running on oil-based marine fuels. Hence,
assumptions for the after-treatment system have to be used. The SCR system is chosen as the main
reference case for engines running on oil-based marine fuel. This included data for urea solution
consumption (a 32.5 % urea solution is used to neutralise NOX emissions), as well as additional fuel
consumption ( [49], [51] ) due to the operation of the SCR system which were derived from existing
primary engine manufacturers datasets (see Table 5-6). NOX-emissions in these cases are assumed
to be on the IMO limit (Annex B, Table B-2) for the respective engine technologies. As seen in Table
5-6, the use of SCR is a trade-off between fuel and urea consumption. Increased fuel consumption
27 For the fuel preparation and heating, no data are collected since the energy demand is rather small and similar between gas
and oil-based marine fuel operation [54] [53]. Other studies [66], also neglect the energy needed for fuel preparation. A calculation based on the fuel consumption of the MAN 6G90ME10.5 engine running on HFO [71] assuming a needed temperature increase of 80°C (50°C fuel tank temperature to 130°C injection temperature) results in additional main engine power of 0.8 % in the IMO E2/E3 cycle. As this is expected to be similar for LNG fuelled engines, this is not considered in the study.
28 As the 2-stroke SSD engine uses a high-pressure injection system, the energy needed to increase the gas pressure is higher in comparison to the other engine technologies. Therefore, an additional 0.5 % is added to the 1.0 % for general pumps.

Life Cycle GHG Emission Study on the Use of LNG as Marine Fuel v1.0 66 of 154
enables the operation of less urea and vice-versa. For LSFO0.5, Blend and LSFO0.5, LScrude, NOX
emissions are assumed to be the same as with HFO.
Table 5-6: Assumptions for Tier III (ECA) operation with oil-based marine fuels based on data
from [50] and [51]
Unit IMO
E2/E3 Cycle
DSI
2-stroke engines
Fuel consumption [% of SFOC] + 0.4 % primary
32.5 % urea solution [g/kWh] 20.6 primary
4-stroke engines
Fuel consumption [% of SFOC] + 0.6 % primary
32.5 % urea solution [g/kWh] 15.7 primary
For the 2-stroke slow speed Diesel-DF engine running on LNG, MAN provided data for their EcoEGR
system [49]. Here, combustion gases are cooled and recirculated back into the combustion chamber.
By doing this, part of the oxygen of the intake air is replaced by CO2 which has a higher heat capacity,
thus reducing the peak temperature of the combustion process and hence reducing the formation of
NOX29 [57]. At 2-stroke slow speed Diesel-DF engine, EcoEGR systems are used instead of a SCR
system.
Particulate matter emission (PM):
Particulate matter emissions where supplied by most OEMs as total PM emissions and not classified
in different particle sizes due to data availability. Where no data is available, PM is stated as “not available”. As for NOX emissions, PM emission for LSFO0.5, Blend and LSFO0.5, LScrude are assumed to
be the same as with HFO.
Sulphur oxide emission (SOX):
SOX emissions are directly linked to the sulphur content of the fuel. SOX emissions are therefore
derived from the fuel consumption using a stochiometric approach assuming all sulphur reacts to
SO2. � + 2 → � 2
This means one gram of S in the fuel results in two grams of SO2. For HFO with an assumed sulphur
content of 2.5 wt. % (global average), an EGCS is needed to be able to comply with the IMO 2020
global sulphur cap (MARPOL convention Annex VI). On-board measurement data from [58] are used
(Table 5-7) and applied on the inventory of the engines running on HFO when evaluating the EGCS
operation. This leads to the following changes in fuel consumption and pollutant emissions.
Table 5-7: Resulting fuel consumption and emission altering due to the operation of an
open-loop EGCS when running on HFO [58]
Increase due to EGCS operation DSI
Fuel consumption + 1.0 % primary
SOX - 97.7 % primary
NOX + 1.5 % primary
PM - 45.7 % primary
29 For more information regarding the influence of NOX reduction technologies on WtW GHG emissions, see Annex G.

Life Cycle GHG Emission Study on the Use of LNG as Marine Fuel v1.0 67 of 154
The measured EGCS is an open-loop scrubber installed on a Wärtsilä 8L46CR 8.4 MW engine
running on HFO [58]. Other technologies such as closed-loop, hybrid or dry Exhaust Gas Cleaning
System (scrubber) are also available in shipping and analysed in section 6.7. However, open-loop
EGCS (scrubbers) are the most widely used technology making up more than 63 % of the EGCS
installed or on order [59].
PM and SOX are both aerosols emissions coming from different sources. SOX emissions are a result
of the reaction of oxygen with the sulphur bound in the fuel. PM emissions contain all sorts of particles
leaving the engine due to impurities of the fuel or the intake air. The water used in ECGS systems
sticks to these aerosols resulting in a reduction of both PM and SOX-emissions.
Summarised, Table 5-7 can be seen as a conservative approach from an LNG perspective, since fuel
consumption increases at HFO fuelled engines ranges from 1 to 4 %. Higher increases in the fuel
consumption at HFO fuelled engines are addressed by scenario analyses in section 6.7.
Inventory of the Engines Investigated
The primary data which were supplied by the engine manufacturers (OEMs) mentioned above are
shown below. The data represent the averaged data among the different engine technologies
including SCR or EcoEGR is the case of the 2-stroke slow speed diesel DF engine, if applicable. Pilot
fuel consumption is added to the main fuel consumption for the operation of oil-based marine fuels.
For LNG operation, MGO0.1 is used as pilot fuel where needed.
The data shown in Table 5-8 to Table 5-12 are primary data provided by the engine manufacturers if
not stated otherwise. They include the assumptions made for fuel, gas, oil and coolant pumps as well
as consumption data for SCR operation were applicable (taken from Table 5-4 to Table 5-6). The fuel
consumption and emission data resulting from the operation of the EGCS when using HFO>2.5 (Table
5-7) are also applied in the GHG model but not explicitly shown here. Hence, the data below represent
the fuel consumption (including mark-ups) and direct emissions of the engines. All data is related to
compliance with the IMO Tier III NOX limits.
2-stroke slow speed engines:
The primary data collected for the 2-stroke engines are shown in Table 5-8 broken down by the fuel
used and the combustion cycle. HFO fuel consumption data is scaled up from MGO as described
above as no data were provided.
For compliance with the IMO Tier III NOX-limits the operation of a SCR system is applied as described
in Table 5-6 for the combustion of oil-based marine fuels. For LNG operation, EcoEGR data [49] is
used for the Diesel-DF engine to comply to the IMO Tier III limits. The Otto-DF engine complies to
the IMO Tier III limits without after-treatment.
Both LNG powered engines have comparable fuel consumption of around 147 g/kWh (combined main
and pilot fuel). Methane slip of the Diesel-DF engine is stated by MAN as 0.1 % of the LNG main fuel
consumption. The methane slip of the Otto-DF engine is derived from the collected data as 1.5 % in
the IMO E2/E3 cycle.
PM emissions were not provided as PM measurement is not standard for such big engines and hence
are marked as not available (n.a.).

Life Cycle GHG Emission Study on the Use of LNG as Marine Fuel v1.0 68 of 154
Table 5-8: Tier III fuel consumption and emission data (primary) for 2-stroke slow speed
engines based on the IMO E2/E3 cycle [53], [49], (est. = estimated)
Oil-based fuels Gas-based fuel
g/kWh HFO2.5 MGO0.1 LSFO0.5
LScrude or Blend
LNG LNG
Combustion cycle Diesel Diesel-DF Otto-DF
Main fuel consumption 184.8 174.0 181.2est 141.3 145.1
Pilot fuel consumption - - - 6.4 1.5
Urea solution consump. 20.6 20.6 20.6est - -
CH4 absolute
CH4 relative
- - - 0.14
0.1 %
2.10
1.5 %
N2O 0.029 0.026 0.028est 0.016 0.016
SOX 9.15 0.34 1.79est 0.01 0.003
NOX 3.40est 3.40est 3.40est 3.40est 0.88
PM n.a. n.a. n.a. n.a. n.a.
4-stroke medium speed engines:
4-stroke medium speed engines have a higher fuel consumption due to the lower engine efficiency
compared with 2-stroke slow speed engines. This is the case for all fuel types.
The data for the oil-based fuels are based on an aggregation of datasets including measured fuel,
urea consumption and resulting NOX emissions and datasets complying to IMO Tier III including the
assumptions made in Table 5-4 to Table 5-6.
Both LNG powered engines have similar LNG fuel consumption with the DF engine needing additional
pilot fuel. Methane slip for the SI engine is 1.3 % of the LNG consumption. DF engines are sensitive
to methane slip as they are designed to also run on oil-based marine fuels alone. The respective CH4
emissions make up 2.5 % of the LNG fuel consumption.
Table 5-9: Tier III fuel consumption and emission data (primary) for 4-stroke medium
speed engines based on the IMO E2/E3 cycle [49], [54], [51] (est. = estimated)
Oil-based fuels Gas-based fuel
g/kWh HFO2.5 MGO0.1 LSFO0.5
LScrude or Blend LNG LNG
Combustion cycle Diesel Otto-SI Otto-DF
Main fuel consumption 197.5 184.7 193. est 155.8 156.5
Pilot fuel consumption - - - - 2.8
Urea solution consump. 15.7 15.7 15.7est - -
CH4 absolute
CH4 relative - - -
2.00
1.3 %
3.84
2.5 %
N2O 0.031 0.027 0.031est 0.017 0.017
SOX 9.87 0.37 1.92est 0.00 0.01
NOX 2.55 2.55 2.55est 1.20 1.96
PM 1.231 0.173 1.231est 0.008 0.016
4-stroke high speed engines:

Life Cycle GHG Emission Study on the Use of LNG as Marine Fuel v1.0 69 of 154
Table 5-10 shows the consumption and emission data for 4-stroke high speed engines that were
delivered. As mentioned above, these engines only run on low-sulphur fuel and hence data were
delivered for MGO0.1 and LNG operation. Due to data availability, no Tier III data were supplied when
running on MGO0.1. Therefore, the assumptions described in Table 5-6 are applied on the Tier II data
to be able to compare the two engines.
Fuel consumption of LNG is 196.2 g LNG/kWh with a methane slip of 1.7 %. PM data were not
provided for 4-stroke high speed engines.
Table 5-10: Tier III fuel consumption and emission data (primary) for 4-stroke high speed
engines based on the IMO E2/E3 cycle [50]
Gas turbines in simple and combined cycle:
The following tables show the fuel consumption and emissions data for gas turbines in simple (GT,
Table 5-11) and combined cycle (CCGT). Table 5-12 cycle for MGO0.1 and LNG operation. As
mentioned above the data are averaged values of the 75 % and 100 % engine load point. Pilot fuel
is not used in any of the gas turbine applications.
In gas turbines, methane slip is small with 0.04 % (GT) respectively 0.03 % (CCGT) of the LNG
consumption.
Gas turbines running on MGO0.1 or LNG are both compliant to IMO Tier III NOX-limits without further
after-treatment systems.
Oil-based fuel Gas-based fuel
g/kWh MGO0.1 LNG
Combustion cycle Diesel Otto-SI
Main fuel consumption 219.6 196.2
Pilot fuel consumption - -
Urea solution consumption 15.7 -
CH4 absolute
CH4 relative -
3.25
1.7 %
N2O 0.033 0.022
SOX 0.44 0.00
NOX 2.01 1.51
PM n.a. n.a.

Life Cycle GHG Emission Study on the Use of LNG as Marine Fuel v1.0 70 of 154
Table 5-11: Tier III fuel consumption and emission data (primary) for simple cycle gas turbines
(GT) based on the average of 75 and 100 % engine load [48], [52]
g/kWh
Oil-based fuel Gas-based fuel
MGO0.1 LNG
Combustion cycle Brayton simple (GT)
Main fuel consumption 247.2 215.9
Pilot fuel consumption - -
Urea solution consumption - -
CH4 absolute
CH4 relative -
0.08
0.04 %
N2O 0.037 0.024
SOX 0.49 0.00
NOX 1.59 1.11
PM 0.124 0.055
Table 5-12: Tier III fuel consumption and emission data (primary) for combined cycle gas
turbines (CCGT) based on the average of 75 and 100 % engine load [48], [52]
g/kWh
Oil-based fuel Gas-based fuel
MGO0.1 LNG
Combustion cycle Brayton combined
Main fuel consumption 174.4 145.3
Pilot fuel consumption - -
Urea solution consumption - -
CH4 absolute
CH4 relative -
0.05
0.03 %
N2O 0.026 0.016
SOX 0.35 0.00
NOX 1.17 0.77
PM 0.088 0.038
As of today, the application of the combined cycle gas turbines in ship operation is limited to a few
vessels.
5.2.3. Background Data
The GHG impact of the production of the urea solution (mixture of 32.5 % urea and 67.5 % deionised
water) that is needed for the operation of the SCR system is taken from thinkstep’s GaBi LCI
databases [14]. A list of the key background datasets is given in Annex E.
5.2.4. The GHG model in the GaBi Software System
Figure 5-2 shows the TtW model that was set up in the GaBi software. It includes the combustion part
of the respective engine (shown for the 2-stroke Slow Speed Diesel-DF). In this process, the
consumption and emission data described above are implemented. For each engine technology as
clustered in Table 5-2 and each fuel used, one model is set-up resulting in 23 engine models.

Life Cycle GHG Emission Study on the Use of LNG as Marine Fuel v1.0 71 of 154
Figure 5-2: GaBi screenshot of the combustion as modelled (Sankey diagram) (Example: 2-
stroke slow speed Diesel-DF engine) [26]
5.3. Tank-to-Wake – Local Pollutant Emissions of Marine Fuels
In contrast to greenhouse gases, the location of where local pollutants are emitted matters. This
aspect has been addressed by the introduction of emission control areas for SOX (also addressing
PM) and NOX. For this reason, the evaluation of local pollutants within this study is restricted to use
phase of the life cycle, meaning the combustion of the fuel and is therefore addressed in the Tank-
to-Wake section.
In the following paragraphs the pollutant emissions covered in this study are investigated by analysing
the data described in the inventory analysis in section 5.2.2. SOx, NOX and PM emissions are the
same values as shown in Table 5-8 to Table 5-12 for HFO2.5, MGO0.1 and LNG operation. For the
case of the operation of HFO>2.5 with an ECGS, the emissions are reduced under consideration of
Table 5-7. LSFO0.5 emissions are estimated to be the same as HFO2.5 emissions apart from SOX which
is derived by the sulphur content of the fuel.
5.3.1. Tank-to-Wake – Local Pollutant Emissions 2-stroke Slow Speed Engines
Table 5-13 shows the local pollutant emission weighted according the IMO E2/E3 cycle for 2-stroke
slow speed engines running on different fuels.
The SOX emissions are directly linked to the fuel consumption and the sulphur content of the fuel.
Hence high sulphur fuels produce high sulphur oxide emissions. When using an EGCS, SOX
emissions are reduced by around 98 % (see Table 5-7) and are in the same order of magnitude as
the emissions in MGO0.1 operation. The sulphur oxide emissions of LNG powered engines are rather
insignificant as the sulphur content of LNG is assumed to be zero and therefore – if present – are
coming from the combustion of the pilot fuel.
Data provision for nitrogen oxide emissions for the operation of oil-based fuels in Tier III mode were
limited, hence all data set are based on the worst-case assumption of being on the Tier III threshold
of 3.40 g NOX/kWh for engines below 130 rpm (see Annex B). The Otto-DF engine running on LNG
shows the lowest NOX emissions.
PM data were not provided for any of these engines.

Life Cycle GHG Emission Study on the Use of LNG as Marine Fuel v1.0 72 of 154
Table 5-13: Tank-to-Wake - Local pollutant emissions of 2-stroke slow speed engines [23],
[53], [49] (est. = estimated)
Oil-based fuels Gas-based fuel
g/kWh HFO2.530 MGO0.1
HFO>2.5
+ EGCS
LSFO0.5
LScrude or Blend LNG LNG
Combustion
cycle Diesel Diesel-DF Otto-DF
SOX 9.15 0.34 0.21 1.79est 0.01 0.003
NOX 3.40est 3.40est 3.40est 3.40est 3.40est 0.88
PM n.a. n.a. n.a. n.a. n.a. n.a.
5.3.2. Tank-to-Wake – Local Pollutant Emissions 4-stroke Medium Speed Engine
The dual fuel 4-stroke medium speed engine running on LNG shows minor sulphur oxide emissions
which are caused by the small amount of pilot fuel burned. The spark ignited pure gas engine (SI)
shows no sulphur oxide emissions.
NOX emissions of engines running on oil-based fuels (Diesel combustion cycle) are close to the
average IMO Tier III NOX limit as reduction of NOx tends to increase fuel consumption of the engine
or increases the amount of urea solution needed which engine manufacturers try to avoid. The NOX
emissions of LNG powered engines are below the IMO Tier III limit even though no after-treatment
system is applied here. The main reason is the combustion based on the Otto cycle and the resultant
lower peak temperatures (see section 5.1.3).
Particulate matter emissions are highest for the heavy fuel oil with 1.231 g PM/kWh. The cleaning
process of an EGCS tends to reduce PM emissions as well (see Table 5-7) reducing it to around half
of the original engine combustion emissions. PM emissions of MGO0.1 are 86 % lower than PM
emissions of HFO (0.173 versus 1.231 g PM/kWh). With engines running on LNG, PM emissions are
reduced by 90-96 % to below 0.02 g PM/kWh (DF engine) and below 0.01 g PM/kWh (SI engine)
respectively.
Table 5-14: Tank-to-Wake - Local pollutant emissions of 4-stroke medium speed engines [23],
[49], [54], [51] (est. = estimated)
Oil-based fuels Gas-based fuel
g/kWh HFO2.513 MGO0.1
HFO>2.5
+ EGCS
LSFO0.5
LScrude or Blend LNG LNG
Combustion
cycle Diesel Otto-SI Otto-DF
SOX 9.87 0.37 0.23 1.92est 0.00 0.01
NOX 2.55 2.55 2.55 2.55est 1.20 1.96
PM 1.231 0.173 0.684 1.231est 0.008 0.016
5.3.3. Tank-to-Wake – Local Pollutant Emissions 4-stroke High Speed Engine
The SOX dependence on the fuel consumption and sulphur content of the fuel has been described in
section 5.2.2. The same characteristics apply here. NOx emissions of LNG are with 1.51 g NOX/kWh
30 As described in section 3, Table 3-1 HFO with an average sulphur content of 2.5 wt. % sulphur is used.

Life Cycle GHG Emission Study on the Use of LNG as Marine Fuel v1.0 73 of 154
24 % lower than when operating with oil-based MGO0.1. Particulate matter emissions were not
provided for these engines and are therefore not shown.
Table 5-15: Tank-to-Wake - Local pollutant emissions of 4-stroke high speed engines [23], [50]
Oil-based fuel Gas-based fuel
g/kWh MGO0.1 LNG
Combustion cycle Diesel Otto-SI
SOX 0.44 0.00
NOX 2.01 1.51
PM n.a. n.a.
5.3.4. Tank-to-Wake – Local Pollutant Emissions Gas Turbine
Gas turbines in simple cycle operation produce the same absolute amount of emissions as in
combined cycle operation. However, due to the higher power output in combined cycle operation the
brake power specific emissions are lower for combined cycle operation.
Sulphur oxide emissions of gas turbines in simple and combined cycle operation are zero for LNG
operation as no pilot fuel is used.
Gas turbines do not need any kind of NOX after treatment-system to comply with the IMO Tier III NOX-
limits for both MGO0.1 and LNG operation. However, NOX emissions of LNG combustion are 43 %
lower than NOX emissions of MGO0.1 operation31.
The use of LNG reduces gas turbine PM emissions about 55 % compared with the operation with
MGO0.1.
Table 5-16: Tank-to-Wake - Local pollutant emissions of simple cycle gas turbines based on
the average of 75 and 100 % engine load [23], [48], [52]
g/kWh
Oil-based fuel Gas-based fuel
MGO0.1 LNG
Combustion cycle Brayton simple
SOX 0.49 0.00
NOX 1.59 1.11
PM 0.124 0.055
Table 5-17: Tank-to-Wake - Local pollutant emissions of combined cycle gas turbines based
on the average of 75 and 100 % engine load [23], [48], [52]
g/kWh
Oil-based fuel Gas-based fuel
MGO0.1 LNG
Combustion cycle Brayton combined
SOX 0.35 0.00
NOX 1.17 0.77
PM 0.088 0.038
31 The data presented show compliance to IMO Tier III limits. In discussion with industry experts it was stated that the gas
turbines are capable of NOx levels below 0.5 g/kWh [48].

Life Cycle GHG Emission Study on the Use of LNG as Marine Fuel v1.0 74 of 154
6.1. Well-to-Wake – Scope of the Study
6.1.1. Product System
The Well-to-Wake analysis combines the Well-to-Tank part (section 4) and the Tank-to-Wake part
(section 5) and assesses the overall emissions from the fuel supply and the fuel combustion in the
assessed ship engines.
6.1.2. Product Functions and Functional Unit
The function of the whole Well-to-Wake product system (fuel supply and fuel use) is the power to
serve the transport of goods and/or people by marine ships. The engine energy output expressed in
kWh is the property to be used to describe the functional unit. The functional unit is to provide 1 kWh
brake power. The reference flow related to the defined functional unit is 1 kWh brake power specific
unit. For instance, GHG emissions are expressed in g CO2-eq/kWh.
The relation per kWh ensures that the main objective of the study, the evaluation of GHG emissions
of LNG as marine fuel compared with conventional oil-based fuels is achieved over the whole life
cycle. The evaluation of GHG emissions of the transportation itself (e.g. emissions per cargo and
nautical mile) is not within the scope of this study as well as the consideration of different ship
applications, e.g. cargo, ferries, cruises.
6.1.3. System Boundary
The system boundary of the product system includes the supply and combustion of the fuel in ship
engines. Figure 6-1 shows the Well-to-Wake system boundary for LNG with the WtT and TtW life
cycle stages combined (refer to Figure 4-2 and section 5.1).
Figure 6-1: Well-to-Wake analysis – LNG supply and combustion [9]
6. Well-to-Wake Analysis

Life Cycle GHG Emission Study on the Use of LNG as Marine Fuel v1.0 75 of 154
The WtW analysis of oil-based fuels consists of the WtT part as described in Figure 4-2 the
combustion of the fuel is described in section 5.1.
6.2. Well-to-Wake – Inventory Analysis
All data for the Well-to-Tank analysis and the Tank-to-Wake analysis are documented in sections 4.2
and 5.2. Figure 6-2 shows the WtW model that was set up in the GaBi software. It includes the
combustion element of the respective engine and the supply of the fuels and respective auxiliaries
(e.g. urea solution).
Figure 6-2: GaBi screenshot of the WtW process as modelled (Sankey diagram) (Example:
combustion and supply for the 2-stroke slow speed Diesel-DF engine) [26]
6.3. Well-to-Wake – GHG Emissions of Current Marine Fuels
This section provides the Well-to-Wake GHG emissions for the product system assessed, i.e., LNG
and oil-based marine fuels used in the different engine technologies and applications. The results are
displayed per functional unit and compared with defined alternatives. As described above, the results
are based on the weighting of steady-state engine load points according to the IMO E2/E3 cycle (75
and 100 % average for the gas turbine applications) in Tier III operation as described in Annex B. The
results for Tier II operation are displayed in Annex G. All data refer to the LHV and CO2 emission
factors for complete combustion listed in Table B-5 and Table B-6 in Annex B.
Note, the methane emissions (slip) are subtracted from the specific fuel consumption for the
calculation of the combustion CO2 emissions to avoid double-counting of CO2 combustion emissions
and CO2-eq emissions resulting from methane slip.
The difference on a TtW basis (combustion only) can be calculated by relating the combustion
emissions of LNG to the combustion emissions of HFO. For the 2-stroke SS-Diesel-DF engine (see
next section), the TtW reduction would be 28 % [(417-583)/583 g CO2-eq/kWh = 28 %].
6.3.1. Well-to-Wake – GHG Emissions - 2-stroke Slow Speed Engine
Figure 6-3 shows the overall brake power specific Well-to-Wake GHG emissions of 2-stroke slow
speed engines (g CO2-eq/kWh) broken down by fuel supply and fuel combustion (WtT and TtW). The
share of emissions resulting from the supply of the fuel is higher for LNG powered engines compared
with engines powered by oil-based marine fuels although overall GHG emissions are lower. This is
the case due to higher GHG emissions per MJ of fuel when using LNG as shown in section 4.3.

Life Cycle GHG Emission Study on the Use of LNG as Marine Fuel v1.0 76 of 154
The overall GHG emissions of MGO0.1 operation is 686 g CO2-eq/kWh, while running on HFO2.5
697 g CO2-eq/kWh are emitted.
Both engine technologies for LNG applications investigated (Diesel and Otto cycle LNG engines),
achieve a net GHG reduction compared with the oil-based marine fuels. The 2-stroke slow speed
Diesel-DF engine (SS-Diesel-DF) running on LNG emits 549 g CO2-eq/kWh which is 21 % less
compared with HFO operation (20 % compared with MGO0.1) over the whole life cycle. The 2-stroke
slow speed Otto engine (SS-Otto-DF) emits 598 g CO2-eq/kWh and achieves a GHG reduction of
14 % compared with HFO (13 % compared with MGO0.1).
Figure 6-3: Well-to-Wake - GHG emissions of 2-stroke slow speed engines - breakdown by
fuel supply and combustion [23]
Figure 6-4 shows the same absolute values but broken down into the main individual emissions CO2,
CH4, and N2O. The CO2 emissions that result from supply and combustion of the fuel make up the
highest share of the overall GHG emissions of all engine technologies and fuels analysed. For oil-
based marine fuels, methane emissions are mainly released during the production and processing of
crude oil. For LNG, the WtW GHG emissions resulting from unburned methane (CH4) are 37 g CO2-
eq/kWh when using the 2-stroke SS-Diesel-DF engine and 96 g CO2-eq/kWh using the 2-stroke SS-
Otto-DF engine. Nitrous oxide emissions (N2O) occur during the combustion of the fuel (see section
5.2.2) and are shown in the graphs but not quantified due to their minor share of the overall emissions
(around 1 %).

Life Cycle GHG Emission Study on the Use of LNG as Marine Fuel v1.0 77 of 154
Figure 6-4: Well-to-Wake - GHG emissions of 2-stroke slow speed engines - breakdown by
main individual emissions [23]
Table 6-1 shows the WtW GHG emissions resulting from methane based on the characterisation
factor for methane of 30 (IPCC, AR5) [15]. The methane slip indicated by the primary data described
in Table 5-8 is reflected in the GHG emissions resulting from unburned methane in the combustion
process. The SS-Diesel-DF engine shows methane emissions of 0.14 g/kWh resulting in 4 g CO2-
eq/kWh which is less than 1 % of the total WtW GHG emissions of the engine. Due to the low-pressure
injection system and the combustion in the Otto cycle, the SS-Otto-DF engines shows methane
emission of 2.1 g/kWh resulting in 63 g CO2-eq/kWh (11 % of total WtW GHG emissions) (Table 5-8).
GHG emissions from methane emissions in the supply chain are comparable as the fuel consumption
of the two engines is comparable.
Table 6-1: Contribution of methane emissions to WtW GHG emissions of 2-stroke slow speed
engines [23]
g CO2-eq/kWh Oil-based fuels Gas-based fuel
HFO2.5 MGO0.1 LNG LNG
2-stroke slow speed Diesel Diesel-DF Otto-DF
Total WtW GHG emissions 697 686 549 598
- of which methane 23 24 37 96
- supply 23 24 33 33
- combustion - - 4 63

Life Cycle GHG Emission Study on the Use of LNG as Marine Fuel v1.0 78 of 154
6.3.2. Well-to-Wake – GHG Emissions - 4-stroke Medium Speed Engine
Figure 6-5 shows that the 4-stroke medium speed engines running on HFO emit 741 g CO2-eq/kWh.
Both LNG engines investigated (DF and pure gas, SI engines) show a reduction of GHG emissions
compared with the operation with oil-based fuels. Medium speed dual fuel (DF) engines in gas mode
emit 692 g CO2-eq/kWh resulting in a GHG reduction compared with HFO operation of 7 %
(4 % compared with MGO0.1). Medium speed SI engines emitting 629 g CO2-eq/kWh can achieve a
GHG reduction of 15 % compared with the HFO operation (13 % compared with MGO0.1).
Figure 6-5: Well-to-Wake - GHG emissions of 4-stroke medium speed engines - breakdown
by fuel supply and combustion [23]
Figure 6-6 shows that GHG emissions resulting from CH4 emissions make up 22 % of the total GHG
emissions of LNG dual fuel engines (151 of 692 g CO2-eq/kWh), the share of CO2 of the overall GHG
emissions are 78 % (e.g. for HFO operation, this share is 96 %).
Table 6-2 gives an overview of the contribution of methane to the total WtW GHG emissions of 4-
stroke medium speed engines. With SI engines, 96 g CO2-eq result from unburned methane in the
supply chain and during combustion. The methane slip during combustion results in 60 g CO2-eq/kWh
which is 10 % of the total WtW GHG emissions of the engine. As the emission data in Table 5-9
indicates, the MS-Otto-DF engine is more sensitive to methane slip. 115 g CO2-eq/kWh are emitted
during the combustion (16 % of the total WtW GHG emissions) with additional 36 g CO2-eq/kWh
coming from methane emissions from the supply chain. The emissions from the supply chain are
comparable for both engine technologies as the main fuel consumption is comparable.

Life Cycle GHG Emission Study on the Use of LNG as Marine Fuel v1.0 79 of 154
Figure 6-6: Well-to-Wake - GHG emissions of 4-stroke medium speed engines - breakdown
by main individual emissions [23]
The contribution of methane emissions is shown in Table 6-2.
Table 6-2: Contribution of methane emissions to WtW GHG emissions of 4-stroke medium
speed engines [23]
g CO2-eq/kWh Oil-based fuels Gas-based fuel
HFO2.5 MGO0.1 LNG LNG
4-stroke medium speed Diesel Otto-SI Otto-DF
Total WtW GHG emissions 741 724 629 692
- of which methane 24 25 96 151
- supply 24 25 36 36
- combustion - - 60 115
6.3.3. Well-to-Wake – GHG Emissions - 4-stroke High Speed Engine
As mentioned above, high speed engines are only capable of running on low sulphur fuel and
therefore only the operation with MGO0.1 and LNG is considered here. The GHG emissions in MGO0.1
operation of the high-speed Diesel engine investigated amount to 859 g CO2-eq/kWh. The high-
speed engine running on LNG in an Otto cycle combustion emits 812 g CO2-eq/kWh which is equal
to a reduction of 5 %. This can be explained by the lower fuel consumption when using LNG.

Life Cycle GHG Emission Study on the Use of LNG as Marine Fuel v1.0 80 of 154
Figure 6-7: Well-to-Wake - GHG emissions of 4-stroke high speed engines - breakdown by
fuel supply and combustion [23]
GHG emissions resulting from methane emissions are 142 g CO2-eq/kWh which is 18 % of the overall
GHG emissions of the LNG engine.
Table 6-3 shows the GHG emissions resulting from methane in the context of the total WtW GHG
emission. 98 g CO2-eq/kWh are related to the methane slip in the engine (12 % of the total WtW GHG
emissions) with the supply chain accounting for 45 g CO2-eq/kWh.
Figure 6-8: Well-to-Wake - GHG emissions of 4-stroke high speed engines - breakdown by
main individual emissions [23]

Life Cycle GHG Emission Study on the Use of LNG as Marine Fuel v1.0 81 of 154
Table 6-3: Contribution of methane emissions to WtW GHG emissions of 4-stroke high speed
engines [23]
g CO2-eq/kWh Oil-based fuel Gas-based fuel
MGO0.1 LNG
4-stroke high speed Diesel Otto-SI
Total WtW GHG emissions 859 812
- of which methane 30 142
- supply 30 45
- combustion - 98
6.3.4. Well-to-Wake – GHG Emissions - Gas Turbines
Figure 6-9 and Figure 6-10 display the GHG emissions of gas turbines running on MGO0.1 and LNG.
The GHG emissions in simple cycle operation using MGO0.1 are calculated as 954 g CO2-eq/kWh.
When running on LNG, GHG emissions are reduced to 798 g CO2-eq/kWh which corresponds to a
16 % reduction. Figure 6-9 bottom shows the GHG emissions of a combined cycle gas and steam
turbine. With similar fuel consumption and emissions, the engine output and hence the engine
efficiency is increased significantly resulting in lower specific GHG emissions both for LNG
(537 g CO2-eq/kWh) as well as for MGO0.1 operation (673 g CO2-eq/kWh). The potential GHG
reduction of LNG fuelled gas turbines in combined cycle is 20 %.
Figure 6-9: Well-to-Wake - GHG emissions of gas turbines in simple cycle (top) and
combined cycle (bottom) breakdown by fuel supply and combustion [23]
Figure 6-10 shows that for gas turbines running on LNG, GHG emissions resulting from methane are
relatively low compared with reciprocating engines. This is due to the negligible amount of unburned
hydrocarbons during the combustion of the fuel. The emissions reported here are mainly coming from
the supply of the fuel. This is also reflected by the data in Table 6-4. Methane emissions from the
combustion account for less than 0.4 % of the total WtW GHG emissions. The main source of
methane emissions and related GHG emissions is the supply chain.

Life Cycle GHG Emission Study on the Use of LNG as Marine Fuel v1.0 82 of 154
Figure 6-10: Well-to-Wake - GHG emissions of gas turbines in simple cycle (top) and
combined cycle (bottom) breakdown by main individual emissions [23]
Table 6-4 outlines the methane emission contribution analysis.
Table 6-4: Contribution of methane emissions to WtW GHG emissions of gas turbines [23]
g CO2-eq/kWh Oil-based fuel Gas-based fuel
Gas turbines MGO0.1 LNG
GT CCGT GT CCGT
Total WtW GHG emissions 954 673 798 537
- of which methane 32 23 52 35
- supply 32 23 49 33
- combustion - - 2 2
6.4. Theoretical Benefits for the Global Ship Fleet by introducing LNG
As seen in the previous section, the level of GHG reduction of LNG compared with current oil-based
marine fuels highly depends on the engine technology investigated. In order to comment to a “global GHG reduction when operating on LNG”, the engines and fuels currently used are taken as a basis
for comparison.
Figure 5-1 in section 5.1.3 shows the status of the global fleet in 2015. It shows which engine
technologies burns how much of the total fuel used in shipping. The share is displayed again in Table
6-5. The last column includes the reduction compared with the fuel used (HFO or MGO0.1) as
calculated in the section above, Figure 6-3 to Figure 6-8. This is based on the assumption that the
LNG engines evaluated are equally represented. For example, for 2-stroke engines, the Otto-DF and
Diesel-DF engine each have a 50:50 share, and the same applies for the 4-stroke medium speed
Otto-DF and Otto-SI medium speed engines. Depending on the reference fuel, the average GHG
benefit of LNG burned in 2-stroke engines for example ranges from 13 to 20 % (MGO0.1) and 14 to
21 % (HFO2.5), see Figure 6-3. The difference in GHG emissions when running on HFO2.5 and MGO0.1

Life Cycle GHG Emission Study on the Use of LNG as Marine Fuel v1.0 83 of 154
is coming from the different fuel properties (LHV and carbon content, hence CO2 emission factor) and
the different GHG emissions from the supply of HFO2.5 and MGO0.1.
Table 6-5: GHG benefit (theoretically) of using LNG at the global ship fleet [17], [23]
Engine Fuel Share of global fuel usage GHG benefit of using LNG
2-stroke slow speed HFO 68 % 18 %
MGO0.1 4 % 16 %
4-stroke medium speed HFO 10 % 11 %
MGO0.1 8 % 9 %
4-stroke high speed MGO0.1 5 % 5 %
Others 5 % -
Total 100 % ~15 %
Multiplying the share of global fuel used in these engines with the average benefit of LNG (weighted
average), this results in a global GHG reduction potential when using LNG compared with fuel use in
2015 of ~15 %32, 33.
6.5. Well-to-Wake – GHG Emissions of post-2020 Marine Fuels
In this section, the GHG emissions from LNG powered engines are shown in comparison with the
post-2020 fuels defined by the project consortium as described in Table 3-1: HFO>2.5 with EGCS,
LSFO0.5, Blend and LSFO0.5, LScrude. This is done for 2-stroke slow speed as well as for 4-stroke medium
speed engines. 4-stroke high speed engines and gas turbines in simple and combined cycle operation
are not considered in this section as they only run on MGO0.1 and LNG. As MGO0.1 and LNG are both
2020 compliant fuels, the way of producing them will not change and hence the GHG results will not
change as well.
6.5.1. Well-to-Wake – GHG Emissions - 2-stroke Slow Speed Engine
Figure 6-11 displays the GHG emissions of LNG in comparison with the defined post-2020 marine
oil-based fuels for 2-stroke slow speed engines. The GHG emissions of HFO when using an EGCS
are 704 g CO2-eq/kWh. The use of different EGCS technologies (scrubbers) can result in higher fuel
consumption. This is addressed by a scenario of increased fuel consumption in section 6.7.
LSFO0.5, LScrude is - as defined in section 3 - based on crude oil with a low sulphur content and hence
does not need further energy intensive desulphurisation to reach the 2020 global sulphur limit of
0.5 wt.%. The overall WtW GHG emissions of LSFO0.5, LScrude are in the same order of magnitude
(695 g CO2-eq/kWh) as LSFO0.5, Blend (699 g CO2-eq/kWh).
Compared with the operation of today’s HFO2.5, without an EGCS (697 g CO2-eq/kWh), as displayed
in Figure 6-3, the GHG emissions of the defined post-2020 fuels do not vary significantly.
32 Consistently using the highest GHG reduction value of the engines, the global reduction would be 18 %. Using the lowest
reduction value, would results in 11 % global reduction instead of 15 %. 33 Assuming that the GHG emissions of the fuel supply are being constant, i.e. not considering any consequential changes that
may occur in the fuel supply if the demand increases significantly.
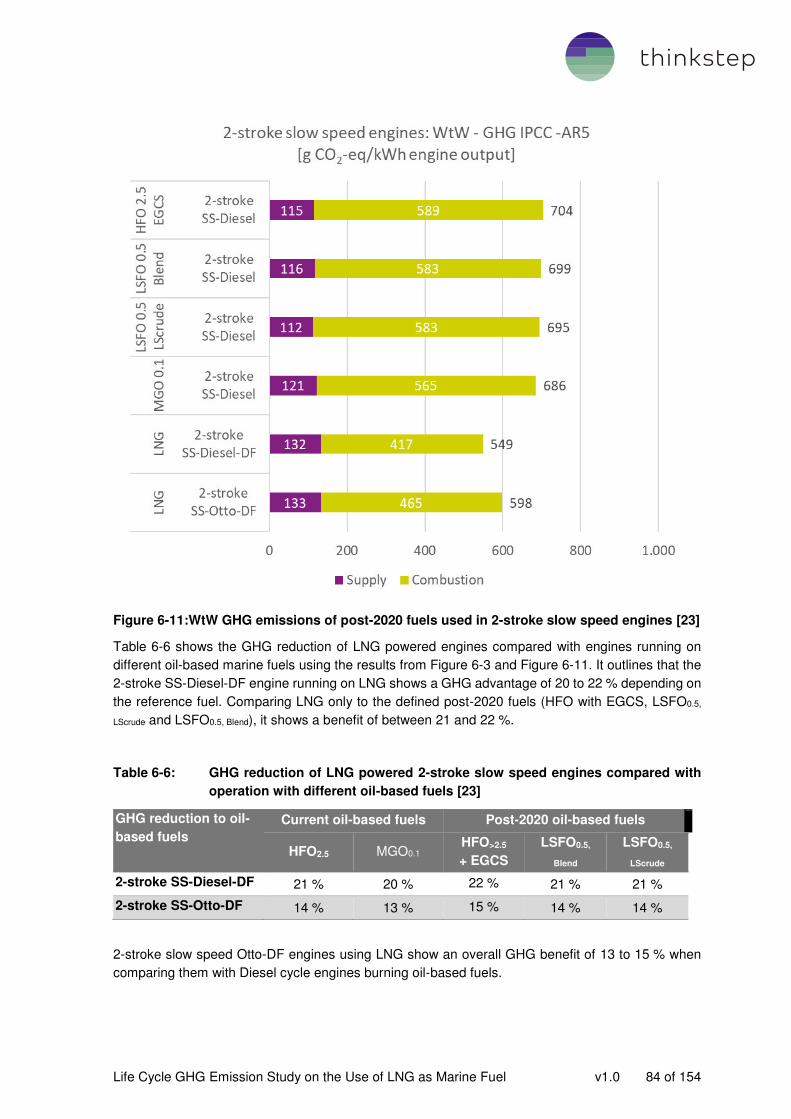
Life Cycle GHG Emission Study on the Use of LNG as Marine Fuel v1.0 84 of 154
Figure 6-11:WtW GHG emissions of post-2020 fuels used in 2-stroke slow speed engines [23]
Table 6-6 shows the GHG reduction of LNG powered engines compared with engines running on
different oil-based marine fuels using the results from Figure 6-3 and Figure 6-11. It outlines that the
2-stroke SS-Diesel-DF engine running on LNG shows a GHG advantage of 20 to 22 % depending on
the reference fuel. Comparing LNG only to the defined post-2020 fuels (HFO with EGCS, LSFO0.5,
LScrude and LSFO0.5, Blend), it shows a benefit of between 21 and 22 %.
Table 6-6: GHG reduction of LNG powered 2-stroke slow speed engines compared with
operation with different oil-based fuels [23]
GHG reduction to oil-
based fuels
Current oil-based fuels Post-2020 oil-based fuels
HFO2.5 MGO0.1 HFO>2.5
+ EGCS
LSFO0.5,
Blend
LSFO0.5,
LScrude
2-stroke SS-Diesel-DF 21 % 20 % 22 % 21 % 21 %
2-stroke SS-Otto-DF 14 % 13 % 15 % 14 % 14 %
2-stroke slow speed Otto-DF engines using LNG show an overall GHG benefit of 13 to 15 % when
comparing them with Diesel cycle engines burning oil-based fuels.

Life Cycle GHG Emission Study on the Use of LNG as Marine Fuel v1.0 85 of 154
6.5.2. Well-to-Wake – GHG Emissions - 4-stroke Medium Speed Engine
The same characteristics that apply to 2-stroke slow speed engine running on oil-based marine fuels,
also apply to 4-stroke medium speed engines. The GHG difference between HFO operation with
EGCS (749 g CO2-eq/kWh) and operation on LSFO0.5, LScrude (739 g CO2-eq/kWh) is 10 g CO2-
eq/kWh. LSFO0.5, Blend operation results in GHG emissions of 742 g CO2-eq/kWh.
Figure 6-12:WtW GHG emissions of post-2020 fuels used in 4-stroke medium speed engines
[23]
Table 6-7 shows the relative GHG reduction of the two 4-stroke medium speed engines investigated
within this study. The dual fuel engine running on LNG gives a GHG benefit of 4 to 8 % compared
with oil-based fuels. The spark ignited engine shows reduced GHG emissions of 13 to 16 %.
Table 6-7: GHG reduction of LNG powered 4-stroke medium speed engines compared
with operation with different oil-based fuels [23]
GHG reduction to oil-
based fuels
Current oil-based fuels Post-2020 oil-based fuels
HFO2.5 MGO0.1 HFO> 2.5
+ EGCS
LSFO0.5,
Blend
LSFO0.5,
LScrude
4-stroke MS-Otto-DF 7 % 4 % 8 % 7 % 6 %
4-stroke MS-Otto-SI 15 % 13 % 16 % 15 % 15 %

Life Cycle GHG Emission Study on the Use of LNG as Marine Fuel v1.0 86 of 154
6.6. Well-to-Wake – GHG Emissions in Comparison with Other Studies
As seen in section 6.3 and 6.5, the GHG emissions are highly dependent on the application and
hence engine technology. General statements on the GHG of LNG as marine fuel can therefore be
rather misleading and special care has to be taken when comparing the results.
SINTEF [60] recently analysed the GHG emissions of different LNG powered engines in operation on
a ship and compared them with test-bed data received from manufacturers (only combustion phase,
TtW). The average methane slip emissions provided by engines manufacturers to SINTEF for SI
engines is 2.8 g CH4/kWh for the IMO E2/E3 cycle. This is comparable to the average data received
in this study (2.0 g CH4/kWh for medium speed engines, Table 5-9). For 4-stroke medium speed SI
engines, the Tank-to-Wake (combustion) GHG emissions are reported as 528 g CO2-eq/kWh (444 g
CO2-eq due to complete fuel combustion and 84 g CO2-eq due to methane slip) which is in the same
order of magnitude as the value calculated within this study (488 g CO2-eq/kWh, see Figure 6-5).
For the 4-stroke medium speed Otto-DF engines, the average methane emissions are stated in [60]
as 7.6 g CH4/kWh which is higher than the average data collected within this study by a factor of two.
Care must be taken when interpreting these data as this engine is the only engine technologies where
SINTEF measured lower CH4 emissions (5.3 g CH4/kWh) than what were provided by the
manufacturers. In general, comparison of test-bed data and real operation data is difficult due to the
stationary vs. transient operating conditions. Due to the higher methane emissions, TtW GHG
emissions are 669 g CO2-eq/kWh which is significantly higher than what is calculated in this study
(549 g CO2-eq/kWh, Figure 6-5). The fuel consumption mentioned by SINTEF is comparable to that
provided by the engine OEMs within this study34.
The 2-stroke Otto-DF engine is also mentioned in the study [60] with total hydrocarbon emissions
ranging between 2.8 to 3.8 g CH4/kWh depending on the engine load point. Assuming a methane
share of 90 % (see section 5.2.2), this is in the same order of magnitude as was provided within this
study (see Table 5-8). However, GHG emissions for this engine are not calculated by SINTEF.
TNO [61] investigated the use of LNG as shipping fuel in the Netherlands. They received CH4 data
from a gas engine supplier which states 2.0 % methane slip at high loads and between 2.5 and 8.5 %
at very low loads for SI and DF engines. The raw data collected within this study show similar
characteristics (higher methane slip at low loads) but lower absolute numbers (1.3 % for SI and 2.5 %
for DF engines for the IMO E2/E3 cycle, see Table 5-9). For the calculation of the GHG emissions, a
methane slip of 2.6 % was used resulting in a calculated range of CO2 emissions per MJ of fuel of
78.4-92.6 g CO2-eq/MJ depending on different fuel supply chains including the combustion of LNG.
Assuming a fuel consumption of 156.5 g LNG / kWh (4-stroke medium speed DF engine. Table 5-9,
neglecting pilot fuel) this leads to CO2-eq emissions per kWh of 603-713 g CO2-eq/kWh. The value
calculated within this study using a global LNG supply is 692 g CO2-eq/kWh (see Figure 6-5) which
is within the range indicated by TNO.
A study recently published by Transport & Environment [62] calculated the potential GHG reduction
when switching from HFO or MGO to LNG using data of a study done by Ricardo [63]. They compared
three different LNG supply chains ranging from 18.8-24.6 g CO2-eq/MJ with the first value being in
the same order of magnitude as that calculated within this study (18.5 g CO2-eq/MJ, see Figure 4-5).
Using the three different supply chains, two scenarios with 1.8 and 3.5 % methane slip have been
calculated. The scenario with 1.8 % methane slip and 18.8 g CO2-eq/MJ results in a maximum GHG
reduction of LNG compared with HFO with EGCS of 9.6 % and 3.7 % compared with MGO. The
equivalent within this study is the 2-stroke slow speed Otto-DF engine as the methane slip for this
34 Original data provided by SINTEF refer to the CO2 emissions from the combustion of LNG. By using emission factor for LNG
(Table B-5) the actual fuel consumption in g/kWh was calculated resulting in 162 g LNG/kWh for the SI engine which is comparable to the 155.8 g LNG/kWh used in this study (Table 5-9).

Life Cycle GHG Emission Study on the Use of LNG as Marine Fuel v1.0 87 of 154
engine is comparable (1.5 %, Table 5-8). Nonetheless, the GHG reduction calculated here is 14 %
(Table 6-6) compared with HFO operation with EGCS and 13 % when compared with MGO. This can
be explained by the combination of slightly lower LNG WtT (18.5 versus 18.8 g CO2-eq/MJ) and
slightly higher HFO WtT emissions (13.5 versus 13.0 g CO2-eq/MJ) with slightly lower methane slip
during the combustion (1.5 % versus 1.8 %) compared with the study of Transport & Environment
[63] [64].
El-Houjeiri [41] compared the use of LNG as marine fuel with HFO produced in different regions.
Produced from crude oil from Saudi Arabia, the GHG emissions are ~ 5 g CO2-eq/MJ which is
relatively low in global comparison. The HFO fuels investigated in [41] show GHG emissions for the
supply chain between 10 – 14 g CO2/MJ (depending on the region) which is in line with the findings
in this study (Figure F-4).
Data from 4-stroke medium speed dual fuel engines were used that show 0.7 % methane slip at high
engine load and 2.3 – 3.6 % at low engine load (taken from a field measurement study conducted by
[65]). The data collected within the study at hand range from 2.3 % for high engine load to 3.5 % for
low engine load resulting in an overall 2.5 % when weighted according to the IMO E2/E3 cycle (Table
5-9) which is higher than the data collected in [41]. Weighted fuel consumption for the 4-stroke DF
engine is 161 g LNG/kWh compared with 156.5 g LNG/kWh (Table 5-9) collected within this study.
HFO fuel consumption reaches 193 g HFO/kWh (compared with 197.5 g HFO/kWh, Table 5-9) with
MGO consumption at 199 g MGO/kWh (184.7 g MGO/kWh, Table 5-9). The unusual pattern of higher
MGO than HFO consumption was discussed in [65] which resulted in the belief that the engine
investigated is designed mainly for HFO operation leading to an overcompensation when using MGO.
Considering HFO from non-Saudi crude combined with the fuel consumption stated
(193 g HFO/kWh), the HFO results are comparable. The LNG life cycle GHG emissions are evaluated
within three different regions (US Gulf Coast, Europe and Japan) indicating different LNG supply
chain emissions. The LNG supply chain emissions (WtT) used by El Houjeiri for the US LNG
production are ~ 15 g CO2-eq/MJ compared with 18.9 g CO2-eq/MJ used in the study at hand for the
US and 18.5 g CO2-eq/MJ globally. Due to the differences in the inventory (LNG supply, methane
slip) and characterisation factors used35, the comparison of the LNG results is limited.
6.7. Well-to-Wake – Scenario Analysis
Influence of EGCS (Scrubber) Technologies when Operating on HFO
As mentioned in section 5.2, open-loop EGCS (scrubbers) and their influence on the emissions and
fuel consumption of 2- and 4-stroke engines running on HFO were investigated within this study as a
default. To take into account different EGCS technologies, a scenario was developed assuming a
higher increase in SFOC due to different EGCS technologies. Increasing the fuel consumption by up
to 5 % would lead to an increase of the WtW GHG emissions of 3.9 % compared with the base
scenario (1 % SFOC increase, see Table 5-7). This is in the same order of magnitude with a study
conducted by Shell [66] that takes into account three different scrubber technologies (open-/closed-
loop and dry EGCS) resulting in GHG increase between 2.5-5.5 %36 depending on the technology.
35 El-Houjeiri uses 36 as characterisation factor for methane compared with 30 in this study. 36 GHG emissions of the production of the necessary EGCS consumables when using closed-loop or dry EGCS (scrubbers)
(NaOH and Ca(OH)2) are included.

Life Cycle GHG Emission Study on the Use of LNG as Marine Fuel v1.0 88 of 154
Scenario Analysis on Different Maritime LNG Bunkering Pathways
There are three general possible pathways for maritime LNG bunkering operations:
• ship-to-ship
• shore-to-ship
• truck-to-ship.
This study focuses on ship-to-ship since it is seen as the most common upcoming pathway for
maritime deep-sea LNG bunkering. Compared with ship-to-ship, shore-to-ship maritime bunkering
would lead to a insignificant reduction of 2 % WtT GHG emissions for the global LNG supply. The
truck-to-ship maritime bunkering shows a higher impact through an increase in the WtT GHG
emissions by 5 %. Under Well-to-Wake perspective the impact is less than 1 %, and hence also
insignificant.
Scenario Analysis on the GHG Emissions for the Supply of LSFO0.5, Blend
As stated in section 4.1.4 the LSFO0.5, Blend is a 50:50 blend of residual and distillate marine fuels with
an average sulphur content of 0.5 wt. %. Different blends are possible. The fuels are produced from
a crude oil with an average sulphur content which requires a modified, more energy intensive refinery
structure and more desulphurisation within the whole refinery which increases the GHG emissions.
These additional GHG emissions are assumed to be in the range of 2 to 10 %, depending on the
blending ratio of residual and distillate marine fuels [11]. After intensive discussions with a
representative of CONCAWE [12], 4 % additional GHG emissions for the production are assumed in
this study. A scenario analysis has been carried out to investigate the effect of the variation of the
additional CO2 emissions on the WtT results. Assuming 2 % additional CO2 emissions for the
production of LSFO0.5, Blend would lead to a reduction in the WtW GHG result of 0.1 %, and an
assumption of 10 % additional CO2 emissions increases the WtW GHG result by 0.2 %. This shows
that the effect of the variation of the additional CO2 emissions on the WtW GHG results in the defined
ranges of 2 to 10 % is negligible.
Influence of reduced Methane Slip when Operating on LNG
The theoretical GHG benefit LNG has due to its lower carbon content is partly reduced by methane
emissions that escape the combustion chamber of the engine and are directly released to the
atmosphere. This is known as methane slip.
Methane slip is mostly an issue for engines that run in the Otto cycle and result from incomplete
combustion37. This has especially been the case for old engines in low loads as slow combustion is
assumed to enable part of the gas to avoid the combustion process [67]. However, according to
industry experts, significantly higher methane emissions on low load are not expected for new engines
as they are optimised also for low load operation [54]. Dual fuel Otto cycle engines are especially
sensitive to methane slip as they are designed to run on both oil-based fuel as well as on LNG38.
Even though improvements have been made to reduce methane slip during the combustion of LNG,
further reduction is necessary to reduce overall WtW GHG emissions. In discussions with industry
experts, it was confirmed that substantial efforts are taken to further reduce methane slip by means
37 2-stroke slow speed Diesel-DF engines as well as the gas turbine applications have a very small methane slip (<0,3 %) due
to the underlying combustion cycle and are hence not analysed here. 38 There is a trade-off between the maximum temperature of the first piston ring (that basically seals the combustion chamber
to the crankcase) and the minimum distance to the combustion chamber. As combustion of HFO leads to higher temperatures, a certain distance from the combustion chamber to the first piston ring is needed to avoid high temperatures at the piston ring. On LNG operation, this distance leads to a dead volume where the flame dies out resulting in incomplete combustion [51].

Life Cycle GHG Emission Study on the Use of LNG as Marine Fuel v1.0 89 of 154
of engine-internal measures such as combustion optimisation. [49] [53] New engine generations are
expected to achieve methane emissions, which are in the 50 % range lower than today’s levels.
Another possible solution to tackle methane emissions is the use of methane oxidation catalysts such
as the Methane Abatement Catalyst (MAC) currently under development by Shell [36]. Oxidation
catalysts are expected to reach methane slip reduction rates between 60-80 % [53].
Two scenarios are calculated taking into account the potential saving’s indicated above. This would lead to the following reductions in WtW GHG emissions compared with the base scenario:
Table 6-8: Potential WtW GHG reduction by the optimisation and reduction of methane slip
compared with the LNG base case (Figure 6-4 and Figure 6-6) [23]
2-stroke
SS-Otto-DF 4-stroke
MS-Otto-SI 4-stroke
MS-Otto-DF 4-stroke
HS-Otto-SI
40 % CH4 reduction (with in-engine measures)
4 % 5 % 6 % 4 %
80 % CH4 reduction (incl. catalyst)
8% 9 % 12 % 7 %
Note: 2-stroke slow speed Diesel-DF engines and gas turbine applications have small resp. negligible
methane slip and are hence not shown in the table.
Depending on the engine technology and hence the amount of methane emission in the base
scenario, the reduction of methane slip by 40 % leads to a reduction of WtW GHG emissions of 4 to
6 %. By using a catalyst, the potential is even higher resulting in up to 12 % WtW GHG reduction for
the 4-stroke medium speed DF engine. Both reductions are significant considering the WtW life cycle.
6.8. Well-to-Wake – Sensitivity Analysis
6.8.1. Well-to-Wake – Sensitivity Analysis on Impact Categories for LNG
As described in section 3.3, all GHG results presented so far refer to the IPCC characterisation factors
taken from the 5th Assessment Report (AR5) for a 100-year timeframe (GWP100) [15], as this is
currently the most commonly used metric. In order to analyse the sensitivity on the chosen metrics,
a sensitivity analysis on the environmental impact category used has been performed. The GHG
results based on AR5 GHG results for a 100-year timeframe (GWP100) are compared with the AR4
GHG results for the same timeframe [18], the AR5 GHG results for a 20-year timeframe (GWP20) and
the AR5 global temperature potential for a 100-year timeframe (GTP100) [15]. Please remember, the
emission factors of the different characterisation schemes are displayed in Table B-1 within Annex B.
As the main differentiator between the characterisation schemes is the characterisation factor for
methane emissions, the comparison shown here is related to the engine with the highest absolute
methane emissions to make sure that the biggest possible range is illustrated.
Figure 6-13 shows the GHG emissions broken down by emission type for the 4-stroke medium speed
engines running on LNG (for the other engines, see Annex G). The different characterisation schemes
are all related to the base case which is represented by the results described in section 6.3 (IPCC
AR5, 100-year timeframe) and hence amounts to 100 %. The vertical marks represents the
comparison with the corresponding oil-based fuels.
The difference from the evaluation using the characterisation factor of AR4 is minor with 2 %
difference for the SI engine and 4 % for the DF engine. When evaluating the inventories of the two

Life Cycle GHG Emission Study on the Use of LNG as Marine Fuel v1.0 90 of 154
engines using the IPCC AR5 on a 20-year timeframe (which describes the short-term climate effects)
[15], the difference in overall GHG emissions is significant. The GHG emissions of the dual fuel engine
increase to 140 % compared with the 100-year timeframe and exceeds the GHG emissions of the
respective HFO2.5 fuelled engine. Due to the lower methane emissions, the increase in GHG
emissions of the SI engine is slightly lower reaching 128 %. This is due to the higher characterisation
factor of methane emissions when using the 20-year timeframe (see Figure 6-13) [15].
Using characterisation factors used for the GTP100 evaluation [15], the decrease in overall GHG
emissions for both engine technologies decrease due to lower characterisation factors, mainly for
CH4 but also for N2O, which result in a relative decrease to 82 % for the dual fuel (DF) engine and
88 % for the spark ignited (SI) engine.
Although CO2 emissions from combustion and fuel supply make up the greatest share of the overall
GHG emissions, they do not differ between the different characterisation schemes. The main
differentiator is, as mentioned above, the amount of methane which is released to the atmosphere.
The higher these emissions, the bigger the difference compared with the base case (AR 5, GWP100)39.
Figure 6-13: Impact of different characterisation factors (relative) on the WtW GHG
emissions of 4-stroke medium speed engines when using LNG as fuel
compared with IPCC, AR5, GWP100 (= 100 %) and oil-based fuel operation
(HFO2.5) shown as vertical marks [23]
In general, the findings as seen in Figure 6-13 can be transferred to the 2-stroke slow speed engines
as well as the 4-stroke high speed engines, although the deviation from the base case differ due to
different methane emissions. For gas turbines, because methane emissions during the combustion
are generally low, the deviation between AR5 GWP100 and the other characterisation schemes is
lower.
6.8.2. Well-to-Wake – Sensitivity Analysis on Technical Parameters for LNG
The sensitivity analysis considers the influence on the GHG results of the variation of single
parameters in certain ranges. Thus, a sensitivity analysis provides a purposeful evaluation of the
39 Using a characterisation factor of 36 g CO2-eq/g CH4 (which is currently under discussion), the WtW GHG emissions would
be 104 % for the 4-stroke MS-Otto-DF engine (AR 5, GWP100=100 %) and 103 % for the 4-stroke MS-Otto-SI engine.
Life Cycle GHG Emission Study on the Use of LNG as Marine Fuel v1.0 91 of 154
underlying parameters applied in the GHG model, and aims to provide an understanding of the
importance and scale of the parameters defined and choices made in the GHG model. The WtW
sensitivity analysis on selected parameters has been conducted for:
• LNG 2-stroke slow speed Diesel-DF
• LNG 2-stroke slow speed Otto-DF
• LNG 4-stroke medium speed Otto-DF
• LNG 4-stroke medium speed Otto-SI
Starting from the base case settings, the values of the following parameters are varied by ±50 %:
• GHG emissions of the fuel supply
• Fuel consumption during combustion
• Methane slip during combustion.
This study does not include a detailed analysis of the technical parameters of the LNG supply, such
as energy consumption or methane losses along the supply chain. These are discussed and analysed
in detail in the NGVA study prepared by thinkstep [13] and included in the parameter variation of the
total GHG emissions of the fuel supply (sum value, summarising several technical parameters).
Please note: The definition of the +/- 50% variation is based on a theoretical bandwidth. The aim of
the sensitivity analysis is to identify the influence of certain parameters on the results rather than
showing possible minimum and maximum values of the GHG results. Meaningful variances for these
parameters based on minimum and maximum values of the primary and literature data obtained are
given in section 6.9.
By recording the effects of the parameter variations on the WtW GHG results, sensitivity diagrams
are created. It is important to be aware that:
• each line is based on just three data points (base case, -50 % value and +50 % value) which
are connected to each other,
• steep lines stand for parameters with high effect and lines with a low slope for parameters
with little effect,
• lines with a positive slope stand for a positive correlation, which means that an increase in
the value of the parameter also increases the GHG result, and lines with a negative slope
mean that an increase in the parameter value decreases the GHG result.
Since the sensitivity analysis showed quite similar results for the different product systems
considered, the results for the 4-stroke medium speed Otto-SI are presented in Figure 6-14 of this
section. The results of the other engines can be found in Annex H.
Varying the parameter by ±50 % leads to:
• deviations of 42 to 47 % from the base case WtW GHG results for the fuel consumption
during combustion for all investigated LNG engines,
• deviations of 10 to 12 % from the base case WtW GHG results for the GHG emissions of the
fuel supply for all investigated LNG engines,
• deviations of 4 to 8 % from the base case WtW GHG results for the methane slip of almost
all investigated engines. One exception is the LNG 2-stroke slow speed Diesel-DF. The base
case setting for the methane slip of this engine is very low leading to effects of <0.5 % for the
±50 % parameter variation.
For all investigated LNG engines, the fuel consumption during combustion shows a very high impact
on the WtW GHG results and dominates the sensitivity analysis.
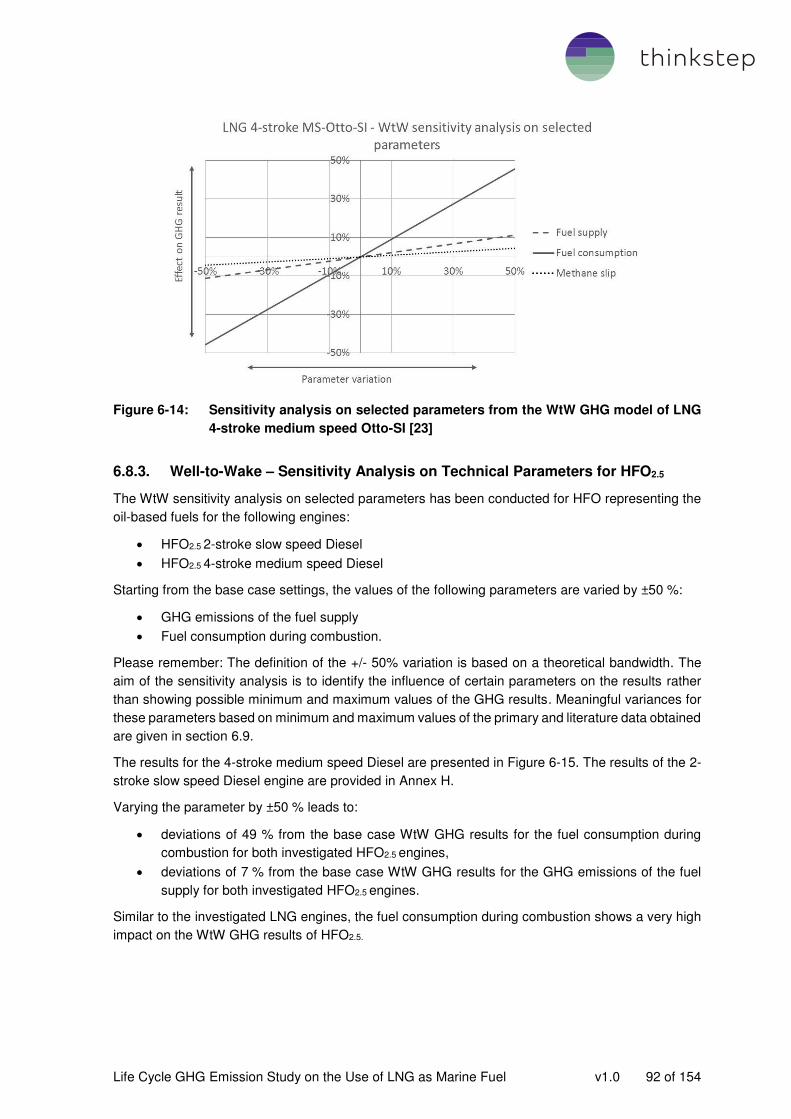
Life Cycle GHG Emission Study on the Use of LNG as Marine Fuel v1.0 92 of 154
Figure 6-14: Sensitivity analysis on selected parameters from the WtW GHG model of LNG
4-stroke medium speed Otto-SI [23]
6.8.3. Well-to-Wake – Sensitivity Analysis on Technical Parameters for HFO2.5
The WtW sensitivity analysis on selected parameters has been conducted for HFO representing the
oil-based fuels for the following engines:
• HFO2.5 2-stroke slow speed Diesel
• HFO2.5 4-stroke medium speed Diesel
Starting from the base case settings, the values of the following parameters are varied by ±50 %:
• GHG emissions of the fuel supply
• Fuel consumption during combustion.
Please remember: The definition of the +/- 50% variation is based on a theoretical bandwidth. The
aim of the sensitivity analysis is to identify the influence of certain parameters on the results rather
than showing possible minimum and maximum values of the GHG results. Meaningful variances for
these parameters based on minimum and maximum values of the primary and literature data obtained
are given in section 6.9.
The results for the 4-stroke medium speed Diesel are presented in Figure 6-15. The results of the 2-
stroke slow speed Diesel engine are provided in Annex H.
Varying the parameter by ±50 % leads to:
• deviations of 49 % from the base case WtW GHG results for the fuel consumption during
combustion for both investigated HFO2.5 engines,
• deviations of 7 % from the base case WtW GHG results for the GHG emissions of the fuel
supply for both investigated HFO2.5 engines.
Similar to the investigated LNG engines, the fuel consumption during combustion shows a very high
impact on the WtW GHG results of HFO2.5.

Life Cycle GHG Emission Study on the Use of LNG as Marine Fuel v1.0 93 of 154
Figure 6-15: Sensitivity analysis on selected parameters from the WtW GHG model of HFO2.5
4-stroke medium speed Diesel [23]
6.9. Well-to-Wake – Uncertainty Analysis
Uncertainty analyses test the combined effect of parameter uncertainties on the final results as some
of the effects seen in sensitivity analyses may cancel each other out or reinforce each other. The
uncertainty analysis is performed using Monte-Carlo simulation which draws random values from
defined uncertainty intervals to calculate a multitude of possible results. The less these results vary,
the lower is the overall parameter uncertainty of the GHG model. Gaussian distribution functions are
used.
Well-to-Wake – Uncertainty Analysis for LNG
In Table 6-9 uncertainty intervals are defined for relevant parameters of the LNG 4-stroke medium
speed Otto-SI engine which are independent from each other, called variance 1 and variance 2.
Meaningful variances are used as intervals based on minimum and maximum values of the primary
and literature data obtained. In total, 10,000 simulations were run with every simulation is generating
a GHG result for the product system based on a random combination of parameter values. The
Monte-Carlo analysis was calculated using the GaBi software.
Table 6-9: Uncertainty Analysis - Monte-Carlo simulation for LNG 4-stroke medium speed
Otto-SI engine - defined variances [23]
Process step Parameter Variance 1 Variance 2
Supply GHG emissions of fuel supply -15 % +15 %
Combustion Fuel consumption -5 % +5 %
Methane slip -20 % +20 %
The results of the Monte-Carlo simulation for the WtW GHG emissions of the LNG 4-stroke medium
speed Otto-SI engine are presented in Table 6-10 and Figure 6-16. The simulations showed that the
results based on the GHG model with the parameter settings for the LNG 4-stroke medium speed
Otto-SI engine are very stable and robust. The standard deviation of 3.2 % is very low. This low
standard deviation is visible in Figure 6-16 as the results create a high Gaussian bell curve. The

Life Cycle GHG Emission Study on the Use of LNG as Marine Fuel v1.0 94 of 154
higher the bell curve, the more stable the results. The median is 0.03 % lower than the base case
result and the base case result is within the distribution of the 10,000 simulation runs.
Table 6-10: Uncertainty Analysis - Monte-Carlo simulation for LNG 4-stroke medium speed
Otto-SI engine - results [23]
Parameter Value Unit
Base case, GHG result 629 g CO2-eq/kWh
Monte-Carlo simulation
Median GHG result 629 g CO2-eq/kWh
Standard deviation 3.2 %
10 % percentile 602 g CO2-eq/kWh
25 % percentile 615 g CO2-eq/kWh
75 % percentile 644 g CO2-eq/kWh
90 % percentile 656 g CO2-eq/kWh
The percentile values show the distribution of the simulation results. For example, 90 % of all
simulation GHG results are below 656 g CO2-eq/kWh and 10 % of all simulation results are below
602 g CO2-eq/kWh.
Figure 6-16: Uncertainty Analysis - Monte-Carlo simulation for the LNG 4-stroke medium
speed Otto-SI engine - distribution of results, calculated with the GaBi software
system [23]
The uncertainty analysis demonstrates the robustness of the calculated WtW GHG results for LNG.
The conclusion is there can be high confidence in base case results. The results are judged to be
robust and sufficient within the range and distribution functions assumed in this study.
Well-to-Wake – Uncertainty Analysis for HFO2.5
Table 6-11 shows the defined uncertainty intervals for relevant parameters of the HFO2.5 4-stroke
Diesel medium speed engine. Meaningful variances are used as intervals based on minimum and
maximum values of the primary and literature data obtained. In total, 10,000 simulations were run.

Life Cycle GHG Emission Study on the Use of LNG as Marine Fuel v1.0 95 of 154
Table 6-11: Uncertainty Analysis - Monte-Carlo simulation for HFO2.5 4-stroke medium
speed Diesel engine - defined variances [23]
Process step Parameter Variance 1 Variance 2
Supply GHG emissions of fuel supply -15 % +15 %
Combustion Fuel consumption -5 % +5 %
Table 6-12 and Figure 6-17 show the results of the Monte-Carlo simulation for the WtW GHG
emissions of the HFO2.5 4-stroke medium speed Diesel engine. The simulations showed that the
results based on the GHG model with the parameter settings for the HFO2.5 4-stroke medium speed
Diesel engine are very stable and robust. The standard deviation of 2.9 % is very low. The median is
0.02 % lower than the base case result. The base case result is within the distribution of the 10,000
simulation runs.
Table 6-12: Uncertainty Analysis - Monte-Carlo simulation for HFO2.5 4-stroke medium
speed Diesel engine - results [23]
Parameter Value Unit
Base case, GHG result 741 g CO2-eq/kWh
Monte-Carlo simulation
Median GHG result 741 g CO2-eq/kWh
Standard deviation 2.9 %
10 % percentile 713 g CO2-eq/kWh
25 % percentile 725 g CO2-eq/kWh
75 % percentile 758 g CO2-eq/kWh
90 % percentile 771 g CO2-eq/kWh
Figure 6-17: Uncertainty Analysis - Monte-Carlo simulation for the HFO2.5 4-stroke medium
speed Diesel engine - distribution of results, calculated with the GaBi software
system [23]
The results are judged to be robust and sufficient within the range and distribution functions assumed
in this study.

Life Cycle GHG Emission Study on the Use of LNG as Marine Fuel v1.0 96 of 154
This section provides an indicative and informative outlook on the use of bioLNG and synthetic LNG
as marine fuel. The analysis was performed as part of the NGVA study [13] in the European context.
This overview is not represented as complete nor most up-to-date. For example, the results do not
include GHG emissions and removals associated with land use change and land use, in accordance
with [16]. However, it gives some understanding on what GHG reduction potential might be possible
by using renewable LNG.
Biomethane from renewable resources can be obtained from various pathways and feedstocks:
• Biogas, a mixture of methane and carbon dioxide, from anaerobic digestion, landfill or
sewage sludge treatment can be upgraded to Natural Gas quality. Within the last couple of
years, the installation of upgrading units has grown. In Europe, additional biogas is mainly
produced via anaerobic digestion from organic waste, manure and other suitable residues.
• In addition to anaerobic digestion, synthetic Natural Gas (SNG) can be produced via
gasification of lignocellulosic biomass and subsequent methanation or via electrolysis and
methanation. The production of methane from electrolysis powered by electricity is
considered as a possibility to use surplus electricity from intermittent renewable electricity
generation, such as wind power and photovoltaics (PV). Methane produced via electrolysis
and methanation has different names, such as Power-to-Gas (PtG), Synthetic Natural Gas
(SNG), e-gas, or windgas etc.
bioLNG and synthetic LNG are also being produced via micro or small-scale liquefaction plants. The
LNG is distributed typically by LNG truck to the LNG terminal to be used as fuel for ships and for other
purposes.
For the analysis, data from the Renewable Energy Directive (RED) [68], mainly the Fuel Quality
Directive (FQD) [69], and its related Council Directive (EU) 2015/652 [70] have been used for the
supply of biomethane from residues and manure and SNG. Data for the micro scale liquefaction are
based on literature40. Data for the distribution of bioLNG and synthetic LNG are taken from the NGVA
study [13]41. For the LNG terminal operations and bunkering the same data as for fossil LNG are
used. The TtW emissions are calculated based on the consumption values and GHG emissions of
the defined engines in section 5.
The clear advantage of bioLNG and synthetic LNG is that the carbon dioxide emitted is effectively
carbon neutral, i.e., no additional CO2 is released and therefore not accounted in the WtW analysis.
Only the CH4 and N2O emissions of the combustion are considered in the TtW GHG emissions. Apart
of the carbon neutrality of bioLNG and synthetic LNG themselves, CO2 emissions from fuel supply for
pumping LNG, etc., such as CO2 emissions from the electricity grid are accounted.
The analysis of renewable supply sources is assessed for:
• LNG 2-stroke slow speed Diesel-DF
• LNG 2-stroke slow speed Otto-DF
40 For a micro scale liquefaction plant in the range of 2,000-30,000 tonnes per annum using mixed refrigerant, Wärtsilä indicates
an electricity consumption of 0.7 kWh/kg [81]. For the liquefaction of biomethane the average European grid mix is used as electricity supply. For SNG the assumption has been made that the liquefaction uses the same electricity supply as the electrolysis, i.e., electricity from wind.
41 Potential gas losses during LNG distribution are cut-off.
7. Outlook - Renewable LNG Supply Sources

Life Cycle GHG Emission Study on the Use of LNG as Marine Fuel v1.0 97 of 154
• LNG 4-stroke medium speed Otto-DF
• LNG 4-stroke medium speed Otto-SI
• LNG 4-stroke high speed Otto-SI
The assumption is made that no technical changes in engines are needed for the use of bioLNG and
synthetic LNG.
The GHG emissions for using 100% fossil LNG, 100% synthetic LNG or 100% bioLNG as well as
possible blends for the 2-stroke slow speed engines are shown in Figure 7-1. Compared with fossil
LNG, the use of blends can reduce the WtW GHG emissions by 13 % to 18 % and the use of 100%
bioLNG or synthetic LNG show a WTW GHG reduction potential of 64 % or as much as 92 %.
Figure 7-1: WtW GHG emissions of current and future LNG sources used in 2-stroke slow
speed engines [23]
Figure 7-2 illustrates the possible reduction potentials for 4-stroke medium speed engines. Compared
with fossil LNG, blends can result in a reduction by 12 % to 18 % and the use of 100% bioLNG or
synthetic LNG in a reduction by 59 to 88 %.

Life Cycle GHG Emission Study on the Use of LNG as Marine Fuel v1.0 98 of 154
Figure 7-2: WtW GHG emissions of current and future LNG sources used in 4-stroke
medium speed engines [23]
The GHG emissions for fossil LNG and possible blends for a 4-stroke high speed engine in Figure
7-3 show that the use of blends can reduce the GHG emissions by 13 % to 17 %. 100% bioLNG or
synthetic LNG shows reduction potentials between 64 to 86 %.
Figure 7-3: WtW GHG emissions of current and future LNG sources used in 4-stroke high
speed engines [23]

Life Cycle GHG Emission Study on the Use of LNG as Marine Fuel v1.0 99 of 154
8.1. Identification of Relevant Findings
The relevant findings are broken down by its life cycle part.
Well-to-Tank Analysis of LNG
The key findings of the Well-to-Tank analysis of the LNG supply chain are:
• The carbon footprint of the global LNG supply, in tank is 18.5 g CO2-eq/MJ (LHV).
• Main contributors in terms of life cycle phases (“GHG hot spots”) of the average LNG supply chain are:
o Gas liquefaction (including purification) (50 % contribution, caused by energy
consumption)
o Gas production, processing and pipeline transport to the liquefaction plant (33 %
contribution, caused by energy consumption and methane emissions)
o LNG carrier transport (13 % contribution, defined by the distance travelled and the
utilisation (in terms of time) of the LNG carrier)
o LNG terminal operations and bunkering (4 % contribution, caused by energy
consumption and methane emissions).
• Carbon dioxide is the main contributor to the GHG emissions (contribution of 74 %), followed
by methane (contribution of 25 %). Nitrous oxide (N2O) is emitted only in small quantities
(contribution of <0.5 %)42. Other GHG emissions, like halogenated organic emissions, are
included in the background data (e.g. electricity supply) and thus taken into account but can
be neglected. The CO2 emissions mainly come from fuel combustion and small CO2 amounts
vented during processing and purification of Natural Gas if no carbon capture and storage is
applied (CO2-removal). The main sources for the CH4 emissions are fugitive emissions.
• The GHG emissions for the LNG supply chain differ from region to region due to different
natural reservoir characteristics, and hence production technologies applied, ambient
temperatures at liquefaction, transport distances, etc. Technology consideration as well as a
country-by-country analysis to get to a global average are key for the assessment of the
supply chains.
• The comparison with other studies reveals that the results are in the same order of
magnitude. Differences can be explained by differences in the scope of the studies or data
used.
Well-to-Tank Analysis of Current and Post-2020 Oil-based Marine Fuels
The calculated global results of the current oil-based fuel supply chains and the post-2020 scenarios
on oil-based marine fuel supply chains are in the same order of magnitude (±4,5 %), ranging from
13.2 to 14.4 g CO2-eq/MJ (LHV) fuel. Especially, the calculation of the post-2020 fuels is associated
with uncertainties. Different crude oil properties and refinery settings, different levels of
desulphurisation and blending ratios, and assumptions made as well as methodological differences
like different allocation methods can lead to different results. This means that interpretation and
42 N2O emissions occur during combustion processes within the LNG supply chain and they are included in the background
data used.
8. Interpretation

Life Cycle GHG Emission Study on the Use of LNG as Marine Fuel v1.0 100 of 154
comparison of results needs to be undertaken with care. See also section 9.2 “Recommendations”, update of the study 2020/2021, once more information which fuel will penetrate the market are known.
Even if the uncertainties for post-2020 fuels are quite high, differences to current marine fuels higher
than ±10 % seems unlikely.
Air Quality and Local Pollutants
The relevant findings of the Tank-to-Wake component of the life cycle are limited to the local pollutant
emissions investigated in this study (SOX, NOx and PM). Aspects regarding the GHG emissions are
discussed in the section “Well-to-Wake” below. The results of pollutant emissions are directly linked
to the inventory analysis and hence to the data that were collected from the engine OEMs.
The relevant findings of the Tank-to-Wake analysis are:
• SOX and PM emissions are mainly dependent on the fuel used.
• SOX emissions directly relate to the amount of sulphur in the fuel hence are highest for the
high sulphur fuels such as HFO and lowest for LNG (assumed as zero within this study). This
shows that most of the fuel that is used today (HFO with a global average sulphur content of
2.5 wt. % [10]) is not compliant to the IMO 2020 sulphur regulations.
• NOX emissions are mainly dependent on the underlying combustion cycle and not directly
linked to the fuel. Gas turbines running on a simple or combined Brayton cycle show low NOX
emission (1.17 – 1.59 g NOX/kWh) for MGO0.1 operation with LNG giving reduction of around
30 %. For reciprocating Diesel cycle engines, the NOX emissions are mostly just below the
respective Tier III limit. This is also the case for the 2-stroke slow speed Diesel-DF engine
when running on LNG. The Otto cycle engines using LNG show a good margin to the
respective Tier III limit. The 2-stroke slow speed Otto-DF engine reduces NOX by nearly 80 %
compared with oil-based fuel operation; the 4-stroke medium speed SI engine reduces NOx
by half with the DF engine resulting in 20 % NOX-reduction which is comparable to the NOX
savings of the 4-stroke high speed engine.
• PM emissions of the 4-stroke medium speed engines are highest for the operation with HFO
(1.23 g PM/kWh) and lowest for LNG (0.012 g PM/kWh on average). This means that LNG is
able to deliver PM reduction of up to 99 % compared with HFO operation. When operating a
EGCS, HFO PM levels can be reduced by 45.7 % resulting in a PM benefit of LNG of 98 %.
In summary, the combustion of LNG shows the lowest emissions of sulphur oxides and particulate
matter of the fuels investigated. NOX emissions are also reduced significantly compared with Diesel
cycle operation.
Well-to-Wake Analysis: Greenhouse Gas Emissions
As described above, engine technologies used in shipping have quite different characteristics43 and
are used in different applications and hence not directly comparable. The study therefore intended to
compare the use of LNG with the use of current and post-2020 oil-based marine fuels within a certain
engine technology.
The main findings of the Well-to-Wake analysis investigating greenhouse gas emissions are:
• The GHG emissions resulting from the supply of the fuel make up 16 – 18 % of the overall
WtW emissions of oil-based marine fuels and 21 – 25 % of the emissions of the LNG life
cycle. This is also reflected by the higher CO2-eq emissions per MJ of fuel of LNG compared
with oil-based fuels.
• Carbon dioxide is the main contributor (~ 99 % for oil-based fuels and 77 – 98 % for LNG),
followed by methane (mainly LNG) and nitrous oxide (N2O). The latter is only contributing by
43 e.g. combustion cycle, engine efficiency, single-/dual fuel capability, methane slip, etc.
Life Cycle GHG Emission Study on the Use of LNG as Marine Fuel v1.0 101 of 154
around 1 %. Although methane emissions contribute up to a maximum 22 % of the total WtW
GHG emissions of LNG, they are especially important due to the high characterisation factor
(30 g CO2-eq/g CH4, IPCC AR5 GWP100). Every gram gas combusted rather than directly
released to the atmosphere reduces the TtW GHG emissions by 27.3 g CO2-eq44.
• The difference in overall WtW emissions for current HFO2.5 and its investigated alternatives
as of 2020 (HFO>2.5 + EGCS, LSFO0.5, Blend, LSFO0.5, LScrude and MGO0.1) are minor. Looking
at the 2-stroke slow speed Diesel engines, the respective WtW GHG emissions range from
686 – 704 g CO2-eq/kWh indicating an overall deviation of 3 % (see Figure 6-3 and Figure
6-11).
• The WtW GHG emissions of 2-stroke slow speed engines running on HFO are 697 g CO2-
eq/kWh and 686 g CO2-eq/kWh when using MGO0.1. As the combustion principle of the two
2-stroke slow speed engines using LNG is different, GHG emissions also differ despite
comparable fuel consumption. The 2-stroke slow speed Otto-DF engine reaches a GHG
reduction with respect to HFO of 14 % and the 2-stroke slow speed Diesel-DF engine of 21 %
with respect to HFO (see Figure 6-3), when running on LNG.
• The 4-stroke medium speed engines running with HFO emit 741 g CO2-eq/kWh and 724
g CO2-eq/kWh when running on MGO0.1. For the 4-stroke dual fuel engine running on LNG,
692 g CO2-eq/kWh are calculated of which 151 g CO2-eq/kWh are related to unburned
methane both from the supply as well as from the combustion phase. The GHG benefit
compared with HFO is 7 %. CO2-eq emissions of the SI engine resulting from methane
emissions account for 96 g CO2-eq/kWh leading to total WtW GHG emissions of 629 g CO2-
eq/kWh which equals a GHG reduction of 15 % with respect to HFO.
• 4-stroke high speed engines do not use high sulphur fuel and are hence evaluated based on
the operation with MGO0.1. In LNG operation, the 4-stroke high speed engine emit 812 g CO2-
eq/kWh of which 142 g CO2-eq/kWh result from methane that is released to the atmosphere.
This equals a reduction of 5 % compared with MGO0.1 operation (859 g CO2-eq/kWh, see
Figure 6-7).
• Gas turbines running on MGO0.1 show total WtW GHG emissions of 954 g CO2-eq/kWh due
to the lower efficiency of the Brayton cycle. The overall WtW GHG emissions in LNG
operation are calculated to 798 g CO2-eq/kWh indicating a reduction of 16 %. The same order
of magnitude can be seen for combined cycle operation.
Considering the marine engines currently in operation and the amount of fuel burned in these engines,
a complete switch from oil-based marine fuels to LNG could immediately reduce GHG emissions by
~15 % based on the assumptions made in this study (see section 6.3).
Scenario, Sensitivity and Uncertainty Analysis
A scenario on the influence of different EGCS (scrubber) technologies when operating on HFO shows
that by increasing the fuel consumption by another 4 percentage points, the WtW GHG emissions
increase by another 3.9 % compared with a 1 % increase in fuel consumption in the base case.
The scenario analysis on different maritime LNG bunkering pathways indicates a possible change in
the WtT GHG results of LNG by -2 % when using shore-to-ship, or +5 % truck-to-ship instead of ship-
to-ship. Under Well-to-Wake perspective the impact is less than 1 %, and hence insignificant.
The scenario analysis on the GHG Emissions for the supply of LSFO0.5, Blend shows that the effect of
the variation of the additional CO2 emissions by 2 to 10 % is negligible on the total WtW GHG results.
As the methane emissions resulting from incomplete combustion are one of the main reasons why
the theoretical GHG reduction due to the lower carbon content of LNG are not currently being
44 One gram LNG combusted results in 2.750 g CO2-eq (see Annex B) compared with 30 g CO2-eq when released directly to
the atmosphere.

Life Cycle GHG Emission Study on the Use of LNG as Marine Fuel v1.0 102 of 154
achieved, a lot of effort is being put into the development of engines with lower methane slip. This is
addressed by two scenarios with different methane slip reduction ratios. As indicated by industry
experts, a reduction of the methane slip of around 40 % by engine optimisation is attainable, which
would reduce the WtW GHG emissions of LNG engines between 4-6 % with respect to current levels
depending on the engine technology. Methane oxidation catalysts are a promising technology to
further reduce WtW GHG emissions; this technology, however, has yet to mature and become
commercially available for large bore internal combustion engines.
In addition, new conversion technologies, such as fuel cells, may also penetrate the market in the
upcoming years and may further help to reduce GHG intensity of LNG fuelled vessels.
The sensitivity calculated using different impact categories (IPCC AR5 GWP100, GWP20, GTP100 and
IPCC AR4 GWP100) shows that the characterisation factor of methane has a significant influence on
the final WtW results. E.g. for the 4-stroke medium speed Otto-DF engine, the calculated WtW results
range from 82 % to 140 % compared with the base case GWP100 (AR5).
The sensitivity analyses on the technical parameters reveals a strong dependency of the WtW GHG
intensity on the fuel consumption during combustion. The variations of the methane slip associated
with LNG fuelled engines and the GHG emissions of the fuel supply for LNG and HFO2.5 also show
effects on the results.
An uncertainty analysis was performed to test the robustness of the WtW GHG results towards the
combined parameter variations based on the LNG 4-stroke medium speed Otto-SI and the HFO2.5 4-
stroke slow speed Diesel engine. The overall WtW GHG results are deemed to be robust based on
the simulation results.
Outlook
This study indicates that a significant reduction of the WtW GHG emissions of LNG as a marine fuel
can be achieved in future. The actual reduction will of course depend on the energy and actions of
the relevant organisations involved.
In addition to the developments and improvements at the ship engines (see descriptions in the section
above), developments and technical improvements in the LNG supply chain will reduce the WtT GHG
emissions. Compared with fossil LNG, the use of blends, such as 80 % fossil LNG and 20 %
renewable LNG supply (bioLNG and/or synthetic LNG) shows large reduction potentials and can
reduce the WtW GHG emissions of LNG as a marine fuel by 12 to 18 %. The reduction potential for
the use of 100% bioLNG or synthetic LNG is even higher (59 to 92 %).
8.2. Assumptions and Limitations
This assessment considers global warming as an environmental impact category only. However, the
study assesses the supply and use of LNG as a marine fuel according to ISO 14040/44 [1] [2] and
compares the GHG results with values for other marine fuels. This study is a Well-To-Wake analysis,
however the data collection focuses more on the TtW analysis than the WtT analysis because the
majority of the WtT primary data were already collected within the NGVA study [13]. These data are
supplemented by thinkstep’s LCI databases [14] and literature. TtW primary data have been collected
intensively for the combustion of the fuels in ship engines from engine OEMs.
The analysis of local pollutants (air quality) was limited to the use phase of the fuels and was carried
out solely for the TtW part.

Life Cycle GHG Emission Study on the Use of LNG as Marine Fuel v1.0 103 of 154
It must be noted that all conclusions are drawn from the considered global warming potential and
local pollutants. The analysis of other environmental impact categories, indicators and pollutants
might lead to other conclusions.
The assumptions made, and limitations identified within the assessment of the use and supply of LNG
are the following:
• The global LNG supply is based on the analysis of five LNG supply regions (Europe, North
America, Asia Pacific, China, and Middle East) which are based on the LNG supply chains
of nine countries. Obviously not all regions are analysed, however, the main producing and
consuming countries are investigated.
• Based on the distance and vessel capacities, the LNG carrier transport is considered for each
region individually. Short distance transport (<125,000 m³), long distance transport
(125,000 m³ to 180,000 m³) and long-distance transport (>180,000 m³) categories have been
used. In addition, in all categories, the LNG carrier fleet mix by propulsion type has been
modelled.
• For the LNG supply chain, mainly primary data from the NGVA study prepared by thinkstep
[13] and data from thinkstep’s GaBi LCI databases [14] were used. The data used were
circulated among data providers in the participating companies (i.e. Shell [30], Total [31] and
Exxon Mobil for the US LNG supply chain [27]) for validation . Primary data were used for
maritime LNG bunkering, provided by Shell [30].
• The calculation of the WtT GHG results of refinery products is associated with uncertainties.
Different crude oil properties and refinery settings, different levels of desulphurisation and
blending ratios, and assumptions made, as well as methodological differences such as
different allocation methods can lead to different results. However, the impact on a Well-to-
Wake perspective is of minor relevance as a sensitivity analysis demonstrated.
• Emissions related to the manufacturing / building / installation of the infrastructure are not
considered in this study because they are negligible.
• The calculations done within this study are based on the defined heating values and CO2
emission factors for the respective fuels. Since a lot of different fuels with different qualities
(and hence heating value, carbon content, impurities, etc.) are often defined as HFO and
MGO, emissions of a certain fuel with deviating characteristics will most likely differ from the
emissions calculated here.
• The data provided by engine manufacturers represent steady state test-bed conditions on
four different engine loads. To represent reality as closely as possible, the IMO E2/E3 cycle
was used as the main point of comparison. In consultation with the owner/operators within
the wider SEA\LNG and SGMF membership it was agreed that this was a reasonable
methodology to approximate the operating profile of the current fleet. However, different ship
applications, itineraries, weather conditions and load profiles will have a big influence on the
operation of the engines and result in different load profiles from those considered by the IMO
E2/E3 cycle. In actual ship applications, high shares of transient engine operation are likely
showing load shifts that are not reflected within this study. Port operations was also not in
focus in this study. These have an influence on both the fuel consumption as well as the
emissions (GHG and local pollutants). As the engines are mainly optimised on certain load
points, transient engine operation will most likely increase GHG emissions.
• Dual fuel engines are capable of running on both oil-based fuels as well as on LNG. They
typically start and stop on oil-based marine fuels. As the data collected is based on steady-
state conditions, fuel switches from oil-based to LNG (and vice versa) and their related GHG
emissions are not included.
• Unburnt hydrocarbon emissions other than methane or cut off from the evaluation due to the
neglectable contribution (>0.5 %) to the total WtW GHG emissions.

Life Cycle GHG Emission Study on the Use of LNG as Marine Fuel v1.0 104 of 154
• The calculation to quantify the theoretical benefit for the global ship fleet by introducing LNG
(see section 6.4), is based on the assumption that the LNG engines evaluated are equally
represented. For example, for 2-stroke engines, the Otto-DF and Diesel-DF engine each
have a 50:50 share, and the same applies for the 4-stroke medium speed Otto-DF and Otto-
SI medium speed engines.
• The energy consumption for the auxiliary services needed to run the main engine (see Table
5-4, mark-ups) are mostly expert judgement from industry experts and do not represent actual
test-bed data.
• For certain engines, no primary data were provided for PM measurements. This is mostly the
case for the large 2-stroke slow speed engines. The influence of black carbon is not
investigated within this study.
• For the WtW GHG analysis of the renewable LNG supply chains, the assumption is made
that no technical changes in engines are needed.
• The assumptions for the prospective outlook are only indicative and do not necessarily reflect
the most probable future trends. Instead, they are intended to demonstrate the theoretical
effect of potential developments.
In general, a conservative approach from a LNG perspective, i.e. not favouring LNG compared with
oil-based fuelled engines, have been applied because a) for oil-based engines black carbon
emissions are not considered (though potentially contributing to the global warming potential), b) for
oil-based engines low mark-up values for EGCS operation are used, c) GHG impacts occurring as a
result of a chemical reaction of used EGCS cleaning water (at open loop EGCS) and sea water are
neglected and d) it is assumed that up to 90 % of the measured total hydrocarbon tailpipe emissions
of the LNG engines are pure methane (recent studies show lower numbers).
8.3. Data Quality Assessment
Inventory data quality is judged by its precision (measured, calculated or estimated), completeness
(e.g., unreported emissions), consistency (degree of uniformity of the methodology applied) and
representativeness (geographical, temporal, and technological).
To cover these requirements and to ensure reliable results, first-hand industry data, either collected
within this study or taken from the NGVA study [13] in combination with consistent LCA information
from literature and thinkstep’s GaBi LCI databases [14] are used. The LCI datasets from the
databases are widely distributed and used with the GaBi 8 Software. The datasets have been used
in LCA models worldwide in industrial and scientific applications in internal as well as in many critically
reviewed and published studies. In the process of providing these datasets they are crosschecked
with the GHG results of datasets from other databases and with key parameters and GHG results
from industry and literature regarding the respective goal and scope (time, technology and
geographical coverage).
8.3.1. Precision and Completeness
✓ Precision: Measured primary data are considered to be of the highest precision, followed by
calculated data, literature data and estimated data. As the majority of the relevant foreground
data are measured data or calculated based on primary information sources of the owner of
the technology, precision is considered to be high for the TtW element. Most engine
manufacturers provided test-bed data. Data of the MAN 2-stroke engines were provided by
MAN via the CEAS Engine Calculation tool [71] and considered as representative by MAN45
45 Via the CEAS tool, only consumption data can be accessed. Assumptions for the emissions were made in accordance with
MAN where needed (see section 5.2) [49].

Life Cycle GHG Emission Study on the Use of LNG as Marine Fuel v1.0 105 of 154
[49]. Variations across different manufacturers were balanced out by using averages. For the
WtT part, mainly primary data from the NGVA study prepared by thinkstep [13] and data from
thinkstep’s GaBi LCI databases [14] were used. The data used were circulated among
respective data providers in the participating companies (i.e. Shell [30], Total [31] and Exxon
Mobil for the US LNG supply chain [27]) for validation and adapted, if necessary. Primary
data were used for maritime LNG bunkering, provided by Shell [30]. All background data are
sourced from thinkstep’s GaBi LCI databases [14] with the documented precision. A list of
the key background datasets is given Annex E. In summary, the precision can be seen as
appropriate according to the goal and scope of the study.
✓ Completeness: Each foreground process was checked for mass balance and completeness
of the emission inventory. No data were knowingly omitted. Completeness of foreground unit
process data is considered to be high. All background data are sourced from thinkstep’s GaBi
LCI databases [14] with the documented completeness.
8.3.2. Consistency and Reproducibility
✓ Consistency: To ensure data consistency, all primary data were collected with the same
level of detail, while all background data were sourced from the thinkstep’s GaBi LCI
databases [14] or literature.
✓ Reproducibility: Reproducibility is supported as much as possible through the disclosure of
input-output data, dataset choices, and modelling approaches in this report. Based on this
information, any third party should be able to approximate the results of this study using the
same data and modelling approaches.
8.3.3. Representativeness
✓ Temporal: Nearly all primary data were collected for the time period 2016-2018. All
secondary data come from thinkstep’s GaBi LCI databases [14] and are representative of the
years 2015-2018. As the study intended to be up-to-date to the best extend possible,
temporal representativeness is considered to be high.
✓ Geographical: All primary and secondary data were collected specific to the countries or
regions under study. Where country-specific or region-specific data were unavailable in
exceptional cases, proxy data were used. An overview on the proxy data used is given in
Annex E. Geographical representativeness is considered to be high with regards to the goal
and scope of this study.
✓ Technological: All primary and secondary data were modelled to be specific to the
technologies or technology mixes under study. Where technology-specific data were
unavailable in exceptional cases, proxy data were used. An overview on the proxy data used
is given in Annex E. Technological representativeness is considered to be high.
In order to fill data gaps and to avoid inconsistencies, bilateral communication with the data providers
helped to improve the quality of the data basis. As internal stakeholder process, the members of the
project consortium were invited to provide feedback and comments to the draft version of the study
report hence improving the quality of the assessment.
This study is ISO 14040/44 conforming [1], [2] and a review in accordance with ISO/TS 14071 [21]
was performed.
thinkstep considers the data quality assessment to be sound. Areas where the data quality may be
low, are discussed in detail in this report. Main data quality issues are addressed in the reports, such
as the lack of primary data for e.g. LNG supply data for Australia, Indonesia, Malaysia and Trinidad

Life Cycle GHG Emission Study on the Use of LNG as Marine Fuel v1.0 106 of 154
& Tobago, or the uncertainty in the calculation of WtT GHG results of oil-based marine fuels due to
different crude oil properties and refinery settings, different levels of desulphurisation and blending
ratios, assumptions made and methodological differences like different allocation methods.
8.4. Model Completeness and Consistency
8.4.1. Completeness
All relevant process steps for each product system were considered and modelled to represent each
specific situation. The process chain is considered sufficiently complete and detailed with regards to
the goal and scope of this study.
8.4.2. Consistency
System boundaries, allocation rules, and the impact assessment method have been applied
consistently throughout the study. All assumptions, methods and data are consistent with each other
and with the study’s goal and scope. Differences in background data quality were minimised by using thinkstep’s GaBi LCI databases [14]. A list of the key background datasets is given in Annex E. This
approach ensures that the different product systems are equivalent and that differences in the results
reflect actual differences between the product systems and are not due to inconsistencies in modelling
choices, data sources, emission factors, or other artefacts.
Life Cycle GHG Emission Study on the Use of LNG as Marine Fuel v1.0 107 of 154
9.1. Conclusions
This study is based on high quality, reliable, and up-to-date industry-based life cycle data for the use
of LNG as a marine fuel and has been conducted in accordance with ISO 14040/14044 with respect
to data quality, and the completeness and consistency of the model. The study has been validated
by the consortium industry partners and critically reviewed in accordance with ISO/TS 14071 by an
independent expert review panel.
The study demonstrates the benefit from reduced WtW GHG emissions that comes from the use of
LNG as a marine fuel compared with current and post-2020 oil-based fuels like HFO2.5, HFO>2.5 with
EGCS, MGO0.1, LSFO0.5, Blend and LSFO0.5, LScrude. The lower carbon content and higher energy content
of LNG compared with the other oil-based marine fuels lead to a better overall GHG performance
even though the fuel supply of LNG shows a higher GHG profile.
The amount of unburned methane that escapes the combustion process, known as methane slip, and
is released to the atmosphere and hence increases the GHG emissions of LNG is critical and is
closely related to engine technology.
The study also shows that general statements of the benefit of LNG with respect to GHG emissions
is difficult as the marine engine market consists of different engines technologies, developed for
different applications and resulting in different engine characteristics (2-/4-stroke, single/dual fuel,
combustion cycle, efficiency, methane slip, exhaust gas cleaning system, etc.), and hence different
GHG intensities.
However, it is possible to make an indicative statement of an advantage of LNG versus oil-based
marine fuels in the range of 4 to 22 %, depending on the engine technology. Nonetheless, considering
that black carbon, which would increase the GHG intensity of the oil-based engines, was not included,
this can be seen as a likely conservative calculated benefit from the use of LNG.
Looking at the global shipping fleet broken down by engine technology and corresponding fuel, the
total GHG emissions could be reduced immediately by ~15 % when switching from oil-based marine
fuels to LNG, not taking into account the requested investment needed to do this immediate change.
Technical developments and improvements in the LNG supply chain and LNG engines - especially
regarding the reduction of methane emissions - play a fundamental role in further improving the
benefits from the use of LNG as a marine fuel. The study shows that biofuels like bioLNG and
synthetic LNG have a potential to further reduce the GHG intensity. Improvements in the combustion
process in the engine focussing on the reduction of methane emissions and the use of specific after-
treatment system can further decrease the overall WtW GHG emissions of LNG. New conversion
technologies, such as fuel cells, may also penetrate the market in the upcoming years and may further
help to reduce GHG intensity of LNG fuelled vessels.
Other alternative fuels such as Liquified Petroleum Gas (LPG) and methanol derived from Natural
Gas, were assed briefly, see Annex G “Well-to-Wake – GHG Emissions of Methanol and LPG”. Initial
results show GHG benefits for LPG compared with HFO2.5, while methanol has slightly higher
emissions than HFO2.5. However, further analysis is needed to derive reliable conclusions on LPG
and methanol.
9. Conclusions, and Recommendations

Life Cycle GHG Emission Study on the Use of LNG as Marine Fuel v1.0 108 of 154
As the study is based on primary, steady-state test-bed data for the combustion of the fuels and on
the most recent available technology in the market, the results are seen as robust. Transient, on-
board measurement data from ship operation can further increase the quality of the study.
Independent of the engine technology, the study shows, that LNG provides a major advantage in
terms of improving air quality which is specifically relevant in ports and coastal areas. Beyond the
benefits associated with reducing air pollutants (sulphur oxides, nitrogen oxides and particulate
matters), LNG represent part of solution to reduce GHG emissions of international shipping by at least
50 % by 2050 (compared with 2008) and contribute to the International Maritime Organization (IMO)
GHG reduction targets [5]. Methane emission from the supply chain and engine methane slip need
to be reduced further to maximise the positive impact on both air quality and GHG emissions. The
use of bioLNG or synthetic LNG is also key to reduce GHG impact.
9.2. Recommendations
Please note that the recommendations given in section 9.2 are out of the scope of the critical review
since the section contains recommendations which are more general and not directly derived from
the results of this study.
Improving Technology and Reducing Emissions
Technology progress and continuous improvement measures have increased energy efficiencies of
ships and supply chains in the last years. There are a range of opportunities to improve efficiencies
and reduce emissions across the supply chains further. This held true for the LNG as well as oil-
based fuel systems. Examples are, application of best practices in crude oil and Natural Gas
production, minimising global supply distances (trades), increasing efficiencies in liquefaction and
refining and reducing methane emissions (methane slip) at ship engines (applicable for some engine
technologies). Analyses in this study has shown that engine optimisation and the use of catalysts,
can reduce Well-to-Wake GHG emissions by up to 10-15 %, depending on engine technology. This
should be energetically pursued and implemented at the earliest opportunity by the relevant industry
parties, in order to support the IMO 50 % GHG reduction target by 2050 [5].
As a consideration, regulations on methane slip may help by giving planning certainty to stakeholders,
including ship owners, operators, manufacturers, and, importantly, investors. Since policy and
regulatory certainty is often key to industry developments, a regulation may be seen as an appropriate
strategy to support the GHG emission reduction target. Regulation may provide the essential
ingredient of certainty needed by industry to provide direction for future actions, and, most importantly,
investment. However, no industry sector has such requirements nowadays, including the current oil-
based ship fleet, and hence competitive disadvantage should be avoided.
Recommendation: Gas supplying companies should continue working on minimising methane
emissions along the LNG supply chain.
Recommendation: Gas supplying companies should invest and develop/communicate action plans
for bio and synthetic gas production.
Recommendation: The ship engine manufacturers (OEMs) should increase investment and effort
on engine optimisation, particularly in the areas of energy efficiency and minimisation of methane slip.
They should also increase research on the use of catalysts.
Recommendation: The ship and engine manufacturers (OEMs) should develop and publish action
plans to reduce methane slip. This plan will demonstrate to policy makers and the community the
focus and commitment of the industry. The plan should give milestones for action and should be
regularly reviewed and the progress used as part of industry communication programmes.

Life Cycle GHG Emission Study on the Use of LNG as Marine Fuel v1.0 109 of 154
Recommendation: The ship and engine manufacturers (OEMs) as well as the gas suppling
companies should consult with Government and other appropriate groups, including customers and
other stakeholders, on possible policies and regulations that could provide certainty for future
developments.
The Importance of Accurate and Comprehensive Information
This study has used best available data as its basis. Limitations of data, including the necessity of
using literature sources where no other was available, and out-of-date data, have been clearly
identified in order to provide a transparent data basis. These estimations and assumptions represent
a limitation to the results.
Developing appropriate policies and making sound decisions requires accurate, up-to-date data. All
relevant ship engine technologies including its special characteristics, such as methane emissions,
have been considered and analysed in a differentiated manner in this study. Global fuel supply chains
have been analysed on a regional level, and LNG fuelled engines have been compared with current
and post-2020 oil-based fuelled vessels.
Furthermore, the scope of this study should be broadened to cover various environmental impacts
and resource depletion. In particular the effect of black carbon is currently being discussed widely,
which would imply further research to be integrated in a subsequent GHG intensity study.
Recommendation: Develop technologies to enable making on-board measurements looking at
transient (real life) operation. This would help to better understand real time fuel consumption and the
amount and significance of methane slip.
Recommendation: The extension of the scope to other environmental aspects and impacts, such as
black carbon, heavy metals, and resource efficiency would provide a more complete evaluation. It
would add a broader quantitative picture to the potential benefits of LNG and complete the GHG
impact assessment.
Recommendation: Due to the uncertainty about the post-2020 oil-based fuels, and the lack of
information which marine fuel will penetrate the market, as well as ongoing developments in engine
technologies, and potential new technologies entering the market, e.g. fuel cells, the study should be
updated in 2021/2022.
Economic Aspects
Decisions are often made based on the economic performance of a product system. An economic
analysis of the total cost of ownership (TCO) would add a further dimension to this study and would
help future ship owners to make more holistic decisions on the product system of choice. This is not
only of interest for the fuel selection between LNG and oil-based fuels, but also to quantify the different
costs which may accompany the different options for post-2020 fuels.
Recommendation: Perform a total cost of ownership (TCO) analysis, including environmental and
human health impacts, for the different engine technologies and corresponding supply chains to
analyse the economic impact of LNG fuelled vessels compared with its oil-based.

Life Cycle GHG Emission Study on the Use of LNG as Marine Fuel v1.0 110 of 154
Dissemination
The results of this study should be used for dialogue with external stakeholders involved in the
determination of fuel emission impacts, and development of regulations. These include the
International Maritime Organization (IMO), national Environmental Protection Agencies (EPA), and
institutions such as the European Commission.
Recommendation: The key results of this study should be disseminated to and discussed with
relevant policy and decision makers in government with the objective informing about harmonised
usage of LNG related data.
Recommendation: The key results of this study should be disseminated to and discussed with
representatives of the International Maritime Organization (IMO) to facilitate the input of high quality,
up-to-date information into upcoming work.
The overarching recommendation from this study, asks for further investigations to validate if
additional energy efficiency measures and improved logistics and speed adaptations, may close the
gap between the calculated GHG reduction provided by LNG and the 50 % GHG emission reduction
target to 2050 of the IMO. Beyond question, LNG has a great potential to contribute, apart from the
significant benefits in terms of air quality, to the GHG reduction target, however methane emissions
need to be reduced to a lowest value possible.

Life Cycle GHG Emission Study on the Use of LNG as Marine Fuel v1.0 111 of 154
[1] ISO 14040:2006, Environmental Management – Life Cycle Assessment – Principles and
Framework, Geneva, Switzerland: International Organization for Standardization (ISO), 2006.
[2] ISO 14044:2006, Environmental Management – Life Cycle Assessment – Requirements and
Guidelines, Geneva, Switzerland: International Organization for Standardization (ISO), 2006.
[3] JEC - Joint Research Centre-EUCAR-CONCAWE Collaboration, “Well-to-Wheels Report
Version 4.a,” Prepared for European Commission, Luxembourg, Luxembourg, 2014.
[4] European Commission - Joint Research Centre - Institute for Environment and Sustainability,
“International Reference Life Cycle Data System (ILCD) Handbook - General guide for Life
Cycle Assessment - Detailed guidance. First edition March 2010. EUR 24708 E,” Brussels, Belgium, 2010.
[5] International Maritime Organization (IMO), “Resolution MEPC.304(72) - Initial IMO Strategy on
Reduction of GHG Emissions from Ships,” 2018.
[6] International Maritime Organisation (IMO), “Full Speed Ahead with Climate-change Measures
at IMO Following Paris Agreement,” 07 12 2018. [Online]. Available: http://www.imo.org/en/mediacentre/pressbriefings/pages/55-paris-agreement.aspx.
[7] International Maritime Organization (IMO), “IMO MARPOL Annex VI - Regulations for the
Prevention of Air Pollution from Ships,” 2005. [Online]. Available: http://www.imo.org/en/OurWork/Environment/PollutionPrevention/AirPollution/Pages/Air-
Pollution.aspx. [Accessed 04 January 2019].
[8] American Bureau of Shipping (ABS), “Marine Fuel Oil Advisory 2018,” 2018.
[9] thinkstep / Freepik Company, Own Illustration with Icons Made by Freepik from
www.flaticon.com, thinkstep AG / Freepik Company S.L., 2019.
[10] International Maritime Organization (IMO) / Marine Environment Protection Committee (MEPC),
Air Pollution and Energy efficiency - Sulphur Monitoring Programme for 2017 (MEPC 72/5/3),
2017.
[11] CONCAWE - Environmental Science for the European Refining Industry, EU Refiners
Association Perspective: Marine Fuels Supply Study, London, 2018.
[12] CONCAWE, Personal Communication, 2018.
[13] NGVA Europe (European Natural & bio Gas Vehicle Association), “Greenhouse Gas Intensity of Natural Gas,” prepared by thinkstep, Brussels, Belgium, 2017.
[14] thinkstep, Own Datasets, Leinfelden-Echterdingen, Germany: thinkstep AG, 2015-2018.
[15] IPCC - AR5, “Climate Change 2013: The Physical Science Basis - IPCC Working Group I
Contribution to 5th Assessment Report (AR5),” IPCC (International Panel on Climate Change), Geneva, Switzerland, 2013.
References

Life Cycle GHG Emission Study on the Use of LNG as Marine Fuel v1.0 112 of 154
[16] ISO TS 14067:2018, Greenhouse Gases - Carbon Footprint for Products - Requirements and
Guidlines for Quantification, Geneva, Switzerland: International Organization for
Standardization (ISO), 2018.
[17] International Council on Clean Transportation (ICCT), “Black Carbon Emissions And Fuel Use In Global Shipping,” 2015.
[18] IPCC - AR4, “Climate Change 2007: The Physical Science Basis - IPCC Working Group I
Contribution to 5th Assessment Report (AR4),” IPCC (International Panel on Climate Change), Geneva, Switzerland, 2007.
[19] U.S. Environmental Protection Agency (EPA), “Sulfur Dioxide Basics,” 28 06 2018. [Online]. Available: https://www.epa.gov/so2-pollution/sulfur-dioxide-basics#effects. [Accessed 03 01
2019].
[20] U.S. Environmental Protection Agency (EPA), “Health and Environmental Effects of Particulate Matter (PM),” 06 2018. [Online]. Available: https://www.epa.gov/pm-pollution/health-and-
environmental-effects-particulate-matter-pm. [Accessed 03 01 2019].
[21] ISO/TS 14071:2014, Environmental Management - Life Cycle Assessment - Critical Review
Processes and Reviewer Competencies: Additional Requirements and Guidelines to ISO
14044:2006, Geneva, Switzerland: International Organization for Standardization (ISO), 2014.
[22] Joint Research Centre (JRC), ILCD Handbook: General Guide for Life Cycle Assessment –
Detailed Guidance. EUR 24708 EN, 1st ed., Luxembourg, Luxembourg: Joint Research Centre
(JRC), European Commission, 2010.
[23] thinkstep, Own Calculation, Leinfelden-Echterdingen, Germany: thinkstep AG, 2019.
[24] thinkstep, “GaBi LCI Databases Documentation,” thinkstep AG, 2018. [Online]. Available: http://database-documentation.gabi-software.com.
[25] IPCC - BAT Large Combustion Plants, “Reference Document on Best Available Techniques for Large Combustion Plants,” IPCC - Integrated Pollution Prevention and Control, Brussels,
Belgium, 2006.
[26] thinkstep, Own Illustration, Leinfelden-Echterdingen, Germany: thinkstep AG, 2019.
[27] Exxon Mobil Corporation, Answer to Data Collection Questionnaire prepared by thinkstep and
further Discussions, 2018.
[28] D. S. Mallapragada, E. Reyes-Bastida, F. Roberto, E. M. McElroy, D. Veskovic and I. J.
Laurenzi, “Life Cycle Greenhouse Gas Emissions and Freshwater Consumption of Liquefied Marcellus Shale Gas Used for International Power Generation,” Journal of Cleaner Production,
vol. 205, pp. 672-680, 2018.
[29] Argonne National Laboratory, “Updated Natural Gas Pathways in the GREET1_2018 Model,” 2018.
[30] Shell International B.V., Answer to Data Collection Questionnaire prepared by thinkstep and
further Discussions, 2018.
[31] Total S.A., Answer to Data Collection Questionnaire prepared by thinkstep and further
Discussions, 2018.

Life Cycle GHG Emission Study on the Use of LNG as Marine Fuel v1.0 113 of 154
[32] International Gas Union (IGU), “World Gas LNG Report - 2018 Edition,” IGU - International Gas
Union, 2018.
[33] Delphi Group, “LNG Emission Benchmarking,” Delphi Group, Ottawa, Canada, 2013.
[34] Pace Global, “LNG and Coal Life Cycle Assessment of Greenhouse Gas Emissions,” Pace Global, Fairfax, USA, 2015.
[35] Sea Distances, “Sea Distances / Port Distances - Online Tool for Calculation of Distances
Between Sea Ports,” January 2019. [Online]. Available: https://www.sea-distances.org/.
[36] M. Koot and O. Butler, Measuring and Managing Methane Emissions in the Downstream, Where
LNG is Used as a Transport Fuel, Shell International B.V., 2018.
[37] M. S. Masnadi, H. M. El-Houjeiri and et. al., “Global Carbon Intensity of Crude Oil Production,” American Association for the Advancement of Science, Washington DC, 2018.
[38] Stanford University, Oil Production Greenhouse Gas Emissions Estimator (OPGEE) model v2.0,
Stanford, 2018.
[39] H. M. El-Houjeiri, Personal Communication on Carbon Intensity of Country-specific Crude Oil
Production, Aramco Services Company, 2018.
[40] University of Calgary, Petroleum Refinery Life Cycle Inventory Model (PRELIM) v1.2.1, Calgary,
2017.
[41] H. M. El-Houjeiri, J.-C. Monfort, J. Bouchard and S. Przesmitzki, “Life Cycle Assessment of Greenhouse Gas Emissions from Marine Fuels - A Case Study of Saudi Crude Oil versus
Natural Gas in Different Global Regions,” Journal of Industrial Ecology (JIE), Yale, 2018.
[42] Argonne National Laboratory (ANL), GREET1_2018 - The Greenhouse Gases, Regulated
Emissions, and Energy Use in Transportation Model, Lemont, 2018.
[43] Exergia S.A., Energy-Economy-Environment Modelling Laboratory E3MLab, Cowi A/S, “Study on Actual GHG Data for Diesel, Petrol, Kerosene and Natural Gas - Final Report,” prepared for European Commission DG ENERGY, Brussels, Belgium, 2015.
[44] TNO, ECN, CE Delft, “Natural Gas in Transport – An Assessment of Different Routes,” Delft, Netherlands, 2013.
[45] International Council on Clean Transportation (ICCT), “Assessment of the Fuel Cycle Impact of Liquefied Natural Gas as Used in International Shipping,” 2013.
[46] Basicsofmarineengineering, December 2012. [Online]. Available:
http://basicsofmarineengineering.blogspot.com/2012/12/engine-classification.html.
[47] DNV-GL, “Assessment of Selected Alternative Fuels and Technologies,” 2018.
[48] GE Aviation, Answer to Data Collection Questionnaire prepared by thinkstep and further
Discussions, 2018.
[49] MAN Energy Solutions SE, Answer to Data Collection Questionnaire prepared by thinkstep and
further Discussions, 2018.
[50] MTU Friedrichshafen GmbH, Answer to Data Collection Questionnaire prepared by thinkstep
and further Discussions, 2018.

Life Cycle GHG Emission Study on the Use of LNG as Marine Fuel v1.0 114 of 154
[51] Caterpillar MaK, Answer to Data Collection Questionnaire prepared by thinkstep and further
Discussions, 2018.
[52] Caterpillar Solar Turbines, Answer to Data Collection Questionnaire prepared by thinkstep and
further Discussions, 2018.
[53] Winterthur Gas & Diesel Ltd., Answer to Data Collection Questionnaire prepared by thinkstep
and further Discussions, 2018.
[54] Wärtsilä Oyj Abp, Answer to Data Collection Questionnaire prepared by thinkstep and further
Discussions, 2018.
[55] DNV-GL, “Answer to Data Collection Questionnaire prepared by thinkstep and further Discussions,” 2018.
[56] International Maritime Organization (IMO), Third IMO GHG Study 2014, 2015.
[57] MAN Energy Solutions SE, “Emission Project Guide,” 2018.
[58] Carnival Corporation & plc, Answer to Data Collection Questionnaire prepared by thinkstep and
further Discussions, 2018.
[59] Shipandbunker, 23 07 2018. [Online]. Available:
https://shipandbunker.com/news/world/811942-imo-2020-how-many-ships-have-scrubbers.
[60] SINTEF, “GHG and NOX Emissions from Gas Fuelled Engines,” 2017.
[61] TNO, “Environmental and Economic Aspects of Using LNG as a Fuel for Shipping in the Netherlands,” 2011.
[62] Transport & Environment, “CNG and LNG for Vehicles and Ships - the Facts,” 2018.
[63] Ricardo, “The Role of Natural Gas and Biomethane in the Transport Sector,” Transport & Environment, 2016.
[64] Transport & Enviroment prepared by UMAS, “LNG as a marine fuel in the EU,” 2018.
[65] H. Winnes and E. Fridell, “Particle Emissions from Ships: Dependence of Fuel Type,” Journal
of the Air & Waste Management Association, 24 January 2012.
[66] Shell International B.V., Well-to-Wake Energy and GHG Analysis of SOX Abatement Options
for the Marine Industry, 2012.
[67] M. Anderson, K. Salo and E. Fridell, “Particel- and Gaseous Emissions from an LNG Powered
Ship,” Environmental Science & Technology, pp. 12568-12575, 2015.
[68] Renewable Energy Directive (RED), Directive 2009/28/EC of the European Parliament and of
the Council of 23 April 2009 on the Promotion of the Use of Energy from Renewable Sources
and Amending and Subsequently Repealing Directives 2001/77/EC and 2003/30/EC, European
Commission, 2009.
[69] Fuel Quality Directive (FQD), Directive 98/70/EC of the European Parliament and of the Council
of 13 October 1998 Relating to the Quality of Petrol and Diesel Fuels and Amending Council
Directive 93/12/EEC, European Commission, 1998.
[70] Council Directive (EU) 2015/652, Council Directive (EU) 2015/652 of 20 April 2015 Laying Down
Calculation Methods and Reporting Requirements Pursuant to Directive 98/70/EC of the

Life Cycle GHG Emission Study on the Use of LNG as Marine Fuel v1.0 115 of 154
European Parliament and of the Council Relating to the Quality of Petrol and Diesel Fuels,
European Commission, 2015.
[71] MAN Energy Solutions SE, “CEAS Engine Calculations,” November 2018. [Online]. Available: https://marine.man-es.com/two-stroke/ceas.
[72] International Maritime Organisation (IMO), “Nitrogen Oxides (NOx) - Regulation 13,” 2018. [Online]. Available:
http://www.imo.org/en/OurWork/Environment/PollutionPrevention/AirPollution/Pages/Nitrogen-
oxides-(NOx)-%E2%80%93-Regulation-13.aspx. [Accessed 21 12 2018].
[73] International Maritime Organization (IMO), “Sulphur Oxides (SOx) and Particulate Matter (PM)
- Regulation 14,” 2018. [Online]. Available: http://www.imo.org/en/OurWork/Environment/PollutionPrevention/AirPollution/Pages/Sulphur-
oxides-(SOx)-%E2%80%93-Regulation-14.aspx. [Accessed 21 12 2018].
[74] International Maritime Organisation (IMO), “NOx Technical Code,” 2008.
[75] International Maritime Organisation (IMO), “Resolution MEPC.281(70) Annex 9: Guidelines on the Method of Calculation of the Attained Energy Efficiency Design Index for New Ships (EEDI),” 2016.
[76] GIIGNL, “The LNG Industry GIIGNL Annual Report - 2018,” GIIGNL (International Group of Liquefied Natural Gas Importers), 2018.
[77] International Energy Agency (IEA), “Oil Information 2017,” International Energy Agency (IEA), Paris, 2017.
[78] International Energy Agency (IEA), “World Energy Statistics,” International Energy Agency (IEA), Paris, 2017.
[79] MAN Diesel & Turbo, “Waste Heat Recovery System (WHRS) for Reduction of Fuel Consumption, Emission and EEDI,” 2014.
[80] International Maritime Organization (IMO), “Investigation of Appropriate Control Measures (Abatement Technologies) to Reduce BC Emissions from International Shipping,” 2015.
[81] Wärtsilä Oyj Abp, 2016 - LNG Solution, Helsinki, Finnland, 2016.

Life Cycle GHG Emission Study on the Use of LNG as Marine Fuel v1.0 116 of 154
Natural Gas
Natural gas is a gaseous hydrocarbon fuel obtained from underground sources. Natural gas remains
in the gaseous state under ambient temperature and atmospheric pressure. Conventional natural gas
is commonly found in underground sandstone and limestone formation whereas unconventional gas
refers to coal bed methane, shale gas, tight gas and gas hydrates.
Composition:
A mixture of primarily methane (CH4) and smaller amounts of ethane (C2H6), propane (C3H8), butane
(C4H10) and other higher hydrocarbons. It generally also includes some inert gases, such as nitrogen
(N2) and carbon dioxide (CO2), plus trace amounts of impurities (ppb, parts per billion), such as
sulphur (e.g., H2S), and mercury (Hg).
Characteristics:
• Colourless, odourless, tasteless, shapeless and lighter than air. At atmospheric pressure, it
is gaseous at any temperature over -162 ºC
• High ignition temperature and narrow flammability range, making it an inherently safe fossil
fuel compared with other fuel sources
• Condenses to Liquefied Natural Gas (LNG) when cooled to a temperature of approximately
-162°C at atmospheric pressure
• Commercialised natural gas is practically sulphur free and produces - if combusted - virtually
no sulphur dioxide (SO2). It emits lower levels of nitrogen oxides (NOX) and CO2 than other
fossil fuels
Liquefied Natural Gas (LNG)
Purified natural gas is liquefied for storage and transportation purpose. At atmospheric pressure, LNG
stays liquid below temperatures below approx. -162°C.
Composition:
LNG is a mixture of primarily methane (CH4) and smaller amounts of ethane (C2H6), propane (C3H8),
butane (C4H10) and other higher hydrocarbons. It generally also includes some inert gases, such as
nitrogen (N2), plus trace amounts of impurities, such as sulphur (e.g., H2S), carbon dioxide (CO2) and
mercury (Hg). Since natural gas is further purified before it is liquefied to LNG, LNG contains typically
less higher hydrocarbons and impurities compared with gaseous natural gas.
Characteristics
• Colourless, odourless, tasteless and lighter than air
• Volume is typically ~600 times smaller in a liquid state based on composition, pressure and
temperature
• With its clean burning properties, it produces less air pollutants and can be more efficient
compared with traditional fuels e.g., oil, diesel, wood, coal and other organic matters
• LNG is an option when pipeline gas is not possible or economically viable due to distance,
environmental context (deep sea, natural reserve, mountains) or political reasons.
Annex A: Natural Gas and LNG
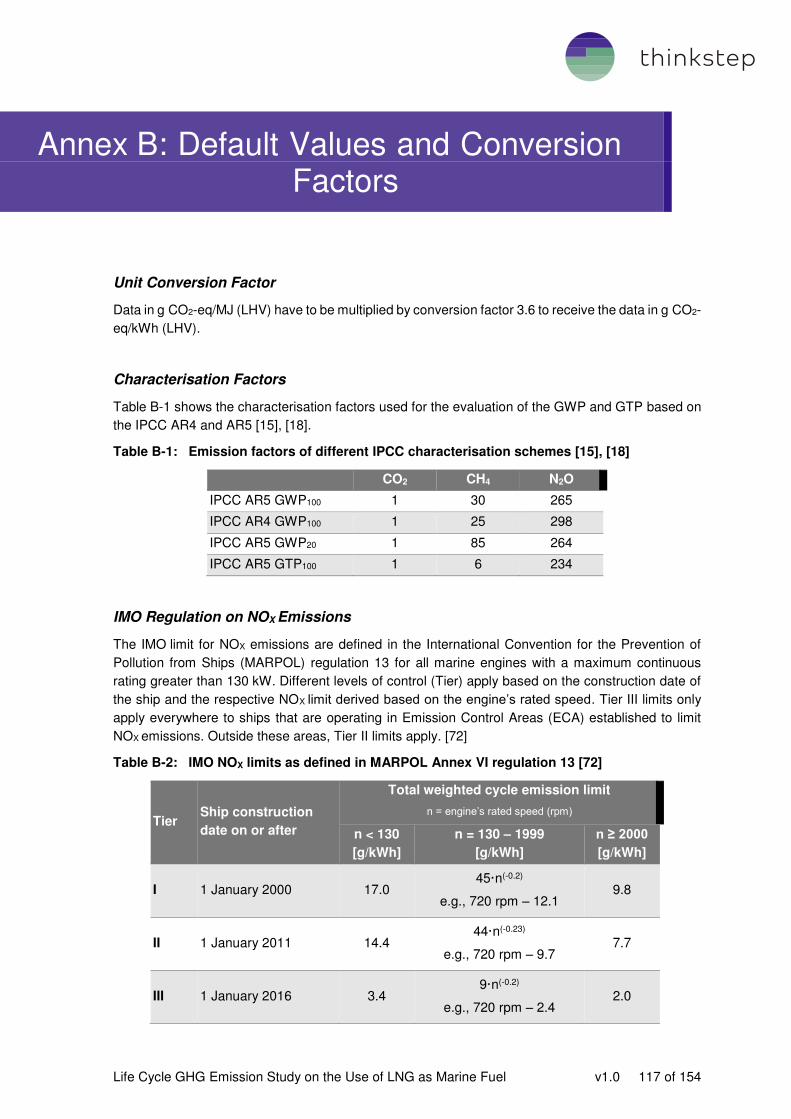
Life Cycle GHG Emission Study on the Use of LNG as Marine Fuel v1.0 117 of 154
Unit Conversion Factor
Data in g CO2-eq/MJ (LHV) have to be multiplied by conversion factor 3.6 to receive the data in g CO2-
eq/kWh (LHV).
Characterisation Factors
Table B-1 shows the characterisation factors used for the evaluation of the GWP and GTP based on
the IPCC AR4 and AR5 [15], [18].
Table B-1: Emission factors of different IPCC characterisation schemes [15], [18]
CO2 CH4 N2O
IPCC AR5 GWP100 1 30 265
IPCC AR4 GWP100 1 25 298
IPCC AR5 GWP20 1 85 264
IPCC AR5 GTP100 1 6 234
IMO Regulation on NOX Emissions
The IMO limit for NOX emissions are defined in the International Convention for the Prevention of
Pollution from Ships (MARPOL) regulation 13 for all marine engines with a maximum continuous
rating greater than 130 kW. Different levels of control (Tier) apply based on the construction date of
the ship and the respective NOX limit derived based on the engine’s rated speed. Tier III limits only
apply everywhere to ships that are operating in Emission Control Areas (ECA) established to limit
NOX emissions. Outside these areas, Tier II limits apply. [72]
Table B-2: IMO NOX limits as defined in MARPOL Annex VI regulation 13 [72]
Tier Ship construction
date on or after
Total weighted cycle emission limit
n = engine’s rated speed (rpm)
n < 130
[g/kWh]
n = 130 – 1999
[g/kWh]
n ≥ 2000
[g/kWh]
I 1 January 2000 17.0 45·n(-0.2)
e.g., 720 rpm – 12.1 9.8
II 1 January 2011 14.4 44·n(-0.23)
e.g., 720 rpm – 9.7 7.7
III 1 January 2016 3.4 9·n(-0.2)
e.g., 720 rpm – 2.4 2.0
Annex B: Default Values and Conversion Factors

Life Cycle GHG Emission Study on the Use of LNG as Marine Fuel v1.0 118 of 154
IMO Regulation on Sulphur and PM Emissions
The IMO regulation 14 of MARPOL defines certain limits on the sulphur content of the fuel bunkered
and hence used on the ship. By doing this, the particulate matter and sulphur oxide emissions from
the engine are directly influenced and can be kept under a certain limit. By using exhaust gas cleaning
systems (EGCS) designed to decrease the sulphur oxide emissions of the combustion gases such
as a scrubber, fuels with a higher sulphur content than defined in regulation 14 can be used. As for
the NOX emissions, the IMO differentiates between operation in an ECA zone established to limit
emissions of SOX and PM and the operation outside of such regions. [73]
Table B-3: IMO limits on the sulphur content of marine fuels as defined in MARPOL
Annex VI regulation 14 [73]
Outside an ECA established to limit SOX and particulate matter emissions
Inside an ECA established to limit SOX and particulate matter emissions
4.5% wt. % prior to 1 January 2012 1.5 wt. % prior to 1 July 2010
3.5% wt. % on and after 1 January 2012 1.0 wt. % on and after 1 July 2010
0.5% wt. % on and after 1 January 2020 0.1 wt. % on and after 1 January 2015
IMO E2/E3 Emission Cycle
The data evaluated within this study is based on the IMO E2/E3 cycle for main propulsion engines.
The cycle is used for the engine certification regarding the emissions of NOx with respect to the Tier
limits mentioned above and described in the IMO NOx technical code [74].
The IMO E2/E3 weighting factors are used to calculate the weighted specific fuel consumption as well
as the weighted specific emissions for CH4, PM, N2O, NOx and SOx. The weighting factors used in the
IMO NOX technical code [74] are applicable to the mass flow rates of the gas. As the data collected
within the study are given in g / kWh at the engine load points (25, 50, 75 and 100 % load), the
weighting factors have to be reformulated taking into account the measured power (see also section
5.12.6 in the NOX Technical Code [74]). The resulting weighting factors are shown in Table B-4. The
75 % engine load point makes up 55 % of the overall value and hence contributes the most.
Table B-4: Weighting factors for the IMO E2/E3 cycle for constant speed main propulsion
engines [74]
Engine Load Point 25 % 50 % 75 % 100 %
Speed 100 % 100 % 100 % 100 %
E2/E3 weighting factor (mass flow
rates) 0.15 0.15 0.5 0.2
E2/E3 weighting factor for specific
consumption / emissions 0.05 0.11 0.55 0.29
Note, the consumption values and emissions used in the study are calculated as the sum of each
weighting factors per engine load point multiplied by the measured specific consumption / emissions
per engine load point. For gas turbines the IMO E2/E3 cycle does not apply. Here, an average of the
75 % and 100 % engine load is calculated (representing 87.5 % load).

Life Cycle GHG Emission Study on the Use of LNG as Marine Fuel v1.0 119 of 154
Engine Efficiency
The fuel consumption vales collected represents the mass of fuel needed to delivery 1 kWh of
mechanical energy (g/kWh). The engine efficiency is defined as the ratio of mechanical energy to
energy content of the fuel. If the fuel consumption is known, the engine efficiency can be calculated
as follows:
� � = � = 3600� � ∗ ��� �
With mfuel being the fuel consumption (g/kWh), and LHV (MJ/kg) as defined in Table B-5 and Table
B-6. E.g. the 4-stroke medium speed Otto-SI engine has an engine efficiency of 47 % (gas
consumption of 155.8 g/kWh). The diesel counterpart, the 4-stroke medium speed CI engine, has an
efficiency of 46 % (MGO consumption of 184.7 g/kWh).
Number Format
For the number format in this report, a decimal dot is applied. Example: 1,234.56. If not otherwise
specified, all values are related to the corresponding output.
Natural Gas and Liquefied Natural Gas (LNG)
The values were taken from [75], [3] and thinkstep’s GaBi LCI databases [14]. Please note that all
energy related numbers in this report refer to the lower heating value (LHV). Table B-5 summarises
the main properties for Natural Gas and LNG.
Table B-5: Natural Gas and Liquefied Natural Gas (LNG) properties and default values [75]
[3], [14].
Properties Unit Natural Gas LNG
Density [kg/m³] 0.763 450
HHV [MJ/kg] 52.5 54.1
LHV [MJ/kg] 47.5 49.2
HHV/LHV [-] 1.10 1.10
CO2-emission Factor [g CO2/MJcombusted] 55.6 55.9
CO2-emission Factor [g CO2/g fuel combusted] 2.641 2.750

Life Cycle GHG Emission Study on the Use of LNG as Marine Fuel v1.0 120 of 154
Heavy Fuel Oil (HFO, Marine Gas Oil (MGO), Methanol and LPG
In Table B-6 properties and default values for other fuels are illustrated. These figures were taken
from [75], [3] and thinkstep’s GaBi LCI databases [14]. LSFO is assumed to have the same emission
factor on an energy basis as HFO2.5 and HFO>2.5.
Table B-6: Other fuel properties and default values [75] [3], [14].
Unit
HFO2.5 /
HFO>2.5
LSFO0.5,
LS crude /
LSFO0.5,
Blend
MGO0.1
Methanol
LPG
Lower heating value
(LHV)
[MJ/kg] 40.2 41.0 42.7 19.9 46.0
Sulphur content [wt.% S] 2.5 / >2.5 0.5 0.1 - -
CO2-emission
factor46
[g CO2/
MJcombusted]
77.5 77.5 75.1 69.1 65.7
CO2-emissions
factor
[g CO2/
g fuelcombusted]
3.114 3.176 3.206 1.375 3.020
Table B-7 states the sulphur content of the region-specific crude oil going into the refinery. These
data are sourced from thinkstep’s GaBi LCI databases [14] and personal communication with an
expert from the oil industry [39].
Table B-7: Sulphur content and API gravity of region-specific crude oil [14], [39]
Region Europe North
America
Asia Pacific China Middle East
Sulphur content of
crude oil [wt.% S]
1.08 1.43 1.05 1.05 1.30
API gravity [°] 34.4 30.7 35.4 30.9 32.9
46 CO2-emission factor, at complete combustion.

Life Cycle GHG Emission Study on the Use of LNG as Marine Fuel v1.0 121 of 154
Calculation of LNG Consumption Mixes
The LNG consumption mix of a region considers the indigenous LNG production of the member
countries (if applicable) of a region as well as the LNG imports from LNG producing countries to the
region and LNG exports of the member countries of the region. The LNG consumption mixes of the
five main bunker regions (Europe, North America, Asia Pacific, China and Middle East) are analysed
in this study as well as a global LNG consumption mix which is calculated based on these five regions.
The mixes are based on two public studies [32] and [76] as not all the required information is available
in one study. The approach for the calculation of the consumption mixes is explained below.
First, the member countries of the five regions are defined:
• Europe: all member countries of the European Union (EU-28)
• North America: Canada, Mexico and the USA
• Asia Pacific: Indonesia, Japan, Malaysia, Singapore, South Korea, Taiwan and Thailand
• China: China
• Middle East: Egypt, Israel, Jordan, Kuwait, Oman, Qatar and the United Arab Emirates.
The LNG consumption mix of a region is calculated based on the indigenous LNG production of the
member countries (using the capacity and utilisation of the liquefaction plants), the LNG imports from
LNG producing countries and the LNG exports of the member countries:
LNG consumption mix = indigenous LNG production + LNG imports - LNG exports.
The LNG production of the following countries were defined based on the identification of the most
important and the emerging supply chains for LNG bunker fuel and investigated (in alphabetical
order):
• Algeria
• Australia
• Indonesia
• Malaysia
• Nigeria
• Norway
• Qatar
• Trinidad & Tobago
• USA.
These nine LNG producing countries were analysed with the aim of reaching the defined threshold of
70 % of the region-specific consumption mixes which was achieved for all regions under
consideration. For the GHG modelling of the LNG supply chains of the regions, the LNG consumption
mixes are scaled to 100 % (e.g. for China from 90 % to 100 %) as presented in Table C-1.
Annex C: Well-to-Tank - Scope of the Study

Life Cycle GHG Emission Study on the Use of LNG as Marine Fuel v1.0 122 of 154
Table C-1: Liquefied Natural Gas (LNG) consumption mixes 2017 per region as used in this
study [32] [76] [23]
Region Modelled LNG consumption mix Coverage
Europe
The countries included in the
LNG consumption mix modelled
cover >92 % of the actual LNG
consumption mix of Europe.
North
America
The countries included in the
LNG consumption mix modelled
cover >92 % of the actual LNG
consumption mix of the region of
North America.
Asia Pacific
The countries included in the
LNG consumption mix modelled
cover >74 % of the actual LNG
consumption mix of the region of
the Asia Pacific.
China
The countries included in the
LNG consumption mix modelled
cover >90 % of the actual LNG
consumption mix of China.

Life Cycle GHG Emission Study on the Use of LNG as Marine Fuel v1.0 123 of 154
Region Modelled LNG consumption mix Coverage
Middle East
The countries included in the
LNG consumption mix modelled
cover >72 % of the actual LNG
consumption mix of the Middle
East.
In addition to these regions, the global LNG consumption mix is calculated based on the absolute
LNG consumption data of the five LNG consumption regions as shown in Figure C-1.
Figure C-1: Global Liquefied Natural Gas (LNG) consumption mix 2017 as used in this study
[32] [76] [23]
Calculation of Oil-based Marine Fuel Consumption Mixes
Following the same approach as for LNG, five consumption regions are considered for the oil-based
marine fuel supply chains. The procedure is explained below for HFO but is the same for all oil-based
marine fuels considered in this study.
The HFO consumption mixes of the five regions (Europe, North America, Asia Pacific, China and
Middle East) are analysed in this study as well as a global HFO consumption mix which is calculated
based on these five regions. The approach for the calculation of the consumption mixes is explained
below.
First, the member countries of the five regions are defined:
• Europe: all member countries of the European Union (EU-28)
• North America: Canada, Mexico and the USA
• Asia Pacific: Indonesia, Japan, Malaysia, Myanmar, Philippines, Singapore, South Korea,
Taiwan and Thailand
• China: China
• Middle East: Iran, Iraq, Israel, Kuwait, Oman, Qatar, Saudi Arabia, Turkey and the United
Arab Emirates.
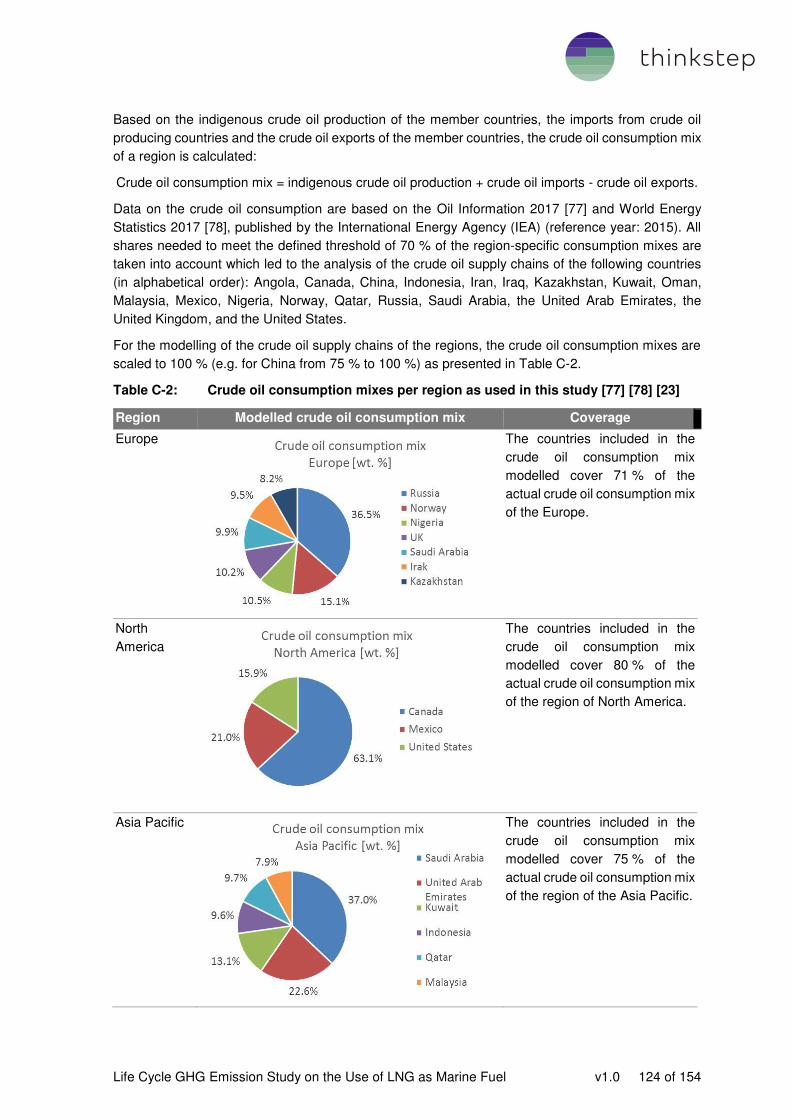
Life Cycle GHG Emission Study on the Use of LNG as Marine Fuel v1.0 124 of 154
Based on the indigenous crude oil production of the member countries, the imports from crude oil
producing countries and the crude oil exports of the member countries, the crude oil consumption mix
of a region is calculated:
Crude oil consumption mix = indigenous crude oil production + crude oil imports - crude oil exports.
Data on the crude oil consumption are based on the Oil Information 2017 [77] and World Energy
Statistics 2017 [78], published by the International Energy Agency (IEA) (reference year: 2015). All
shares needed to meet the defined threshold of 70 % of the region-specific consumption mixes are
taken into account which led to the analysis of the crude oil supply chains of the following countries
(in alphabetical order): Angola, Canada, China, Indonesia, Iran, Iraq, Kazakhstan, Kuwait, Oman,
Malaysia, Mexico, Nigeria, Norway, Qatar, Russia, Saudi Arabia, the United Arab Emirates, the
United Kingdom, and the United States.
For the modelling of the crude oil supply chains of the regions, the crude oil consumption mixes are
scaled to 100 % (e.g. for China from 75 % to 100 %) as presented in Table C-2.
Table C-2: Crude oil consumption mixes per region as used in this study [77] [78] [23]
Region Modelled crude oil consumption mix Coverage
Europe
The countries included in the
crude oil consumption mix
modelled cover 71 % of the
actual crude oil consumption mix
of the Europe.
North
America
The countries included in the
crude oil consumption mix
modelled cover 80 % of the
actual crude oil consumption mix
of the region of North America.
Asia Pacific
The countries included in the
crude oil consumption mix
modelled cover 75 % of the
actual crude oil consumption mix
of the region of the Asia Pacific.

Life Cycle GHG Emission Study on the Use of LNG as Marine Fuel v1.0 125 of 154
Region Modelled crude oil consumption mix Coverage
China
The countries included in the
crude oil consumption mix
modelled cover 75 % of the
actual crude oil consumption mix
of China.
Middle East
The countries included in the
crude oil consumption mix
modelled cover 75 % of the
actual crude oil consumption mix
of the Middle East.
The global HFO2.5 consumption mix is calculated based on the absolute crude oil consumption data
of the five HFO consuming regions, published by the International Energy Agency (IEA) (reference
year: 2015) as shown in Figure C-2 [77] [78]. The absolute crude oil consumption data are used as a
proxy since the absolute HFO consumption data for the regions are not available.
Figure C-2: Global crude oil consumption mix as used in this study [77] [78] [23]
Information on the Well-to-Tank inventory analysis (Annex D) and GHG emissions (Annex E) are
shown in the following sections.

Life Cycle GHG Emission Study on the Use of LNG as Marine Fuel v1.0 126 of 154
Production and Processing
Data for the Natural Gas production and processing in Algeria, Nigeria, Norway and Qatar are taken
from [13]. The Natural Gas production and processing data for Australia, Indonesia, Malaysia,
Trinidad & Tobago and the USA are sourced from thinkstep’s GaBi LCI databases [14]. Data for US
unconventional gas production and processing, including data on the latest analyses of fugitive
emissions associated with hydraulic fracturing (“fracking”), are provided by Exxon Mobil [27] and
literature [28] [29], and data gaps closed by thinkstep’s GaBi LCI databases [14]. The following tables
specify the key parameters. The quantity of flared gas is included in the quantity of natural gas for
energy use. Compared with the other countries considered, Indonesia has by far the highest energy
consumption and flaring rates followed by Nigeria.
Table D-1: Energy use (LHV) and gas losses for conventional gas production &
processing [13] [14]
Parameter Unit Algeria Australia Indonesia Malaysia Nigeria
Electricity kJ/t 402,000 1,162 952 1,180 281
Diesel fuel kJ/t 0 30,211 32,808 31,292 4,782
Crude oil kJ/t 34,405 0 0 0 0
Natural Gas kJ/t 1,461,316 539,289 4,392,765 875,643 2,778,789
TOTAL kJ/t 1,897,721 570,662 4,426,526 908,115 2,783,852
Gas losses vol.% 2.00 0.10 0.46 0.75 0.11
Table D-2: Energy use (LHV) and gas losses for conventional gas production &
processing [13] [14] (continued)
Parameter Unit Norway Qatar Trinidad & Tobago USA
Electricity kJ/t 136,094 0 1,991 20,668
Diesel fuel kJ/t 92,552 0 25,541 40,320
Crude oil kJ/t 0 0 0 0
Natural Gas kJ/t 1,063,493 1,479,673 784,829 1,616,026
TOTAL kJ/t 1,292,140 1,479,673 812,361 1,677,014
Gas losses vol.% 0.01 0.06 0.08 0.10
Annex D: Well-to-Tank - Inventory Analysis

Life Cycle GHG Emission Study on the Use of LNG as Marine Fuel v1.0 127 of 154
Table D-3: Energy use (LHV) and gas losses for unconventional gas production and
processing [14] [27] [28] [29]
Parameter Unit Australia USA
Electricity kJ/t 10,228 6,090
Diesel fuel kJ/t 865,401 367,068
Crude oil kJ/t 0 0
Natural Gas kJ/t 399,626 1,040,308
TOTAL kJ/t 1,275,254 1,413,465
Gas losses vol.% 0.22 0.62
Natural Gas Pipeline Transport
Data for the Natural gas pipeline transport from the gas production and processing fields to
liquefaction plants are sourced from thinkstep’s GaBi LCI databases [14]. The following tables specify
the key parameters. For offshore pipeline transport, the gas losses are set to zero, since the pipeline
is a closed system and there is no re-compression taking place. Potential methane emissions of the
initial compression unit are included in the processing data.
Table D-4: Distance, kind of pipeline, energy use (LHV) and gas losses for gas transport
from the gas production and processing fields to liquefaction plants [14]
Parameter Unit Algeria Australia Indonesia Malaysia Nigeria
Distance km 542 475 60 500 200
Onshore/offshore - onshore offshore offshore onshore offshore
Electricity J/(J*km) 0 0 0 0 0
Diesel fuel J/(J*km) 0 0 0 0 0
Natural Gas J/(J*km) 3.00E-05 3.00E-05 3.00E-05 3.00E-05 3.00E-05
TOTAL J/(J*km) 3.00E-05 3.00E-05 3.00E-05 3.00E-05 3.00E-05
Gas losses Vol.% 8.67E-03 - - 5.62E-02 -
Table D-5: Distance, kind of pipeline, energy use (LHV) and gas losses for gas transport
from the gas production and processing fields to liquefaction plants [14]
(continued)
Parameter Unit Norway Qatar Trinidad &
Tobago
USA
Distance Km 160 80 80 500
Onshore/offshore - offshore offshore onshore onshore
Electricity J/(J*km) 3.26E-06 0 0 0
Diesel fuel J/(J*km) 1.17E-09 0 0 0
Natural Gas J/(J*km) 4.42E-06 3.00E-05 3.00E-05 3.00E-05
TOTAL J/(J*km) 7.68E-06 3.00E-05 3.00E-05 3.00E-05
Gas losses Vol.% - - 9.00E-03 2.37E-01

Life Cycle GHG Emission Study on the Use of LNG as Marine Fuel v1.0 128 of 154
Natural Gas Liquefaction (including Purification)
For Natural gas purification and liquefaction, thinkstep’s proprietary “GaBi LNG model” was used to
calculate the GHG intensity [14]. The different liquefaction technologies (as listed in the following
table) mainly differ by the refrigerant used and the technology to cool (liquify) the natural gas.
Table D-6: Technology mix of liquefaction (weighted by installed capacity) based on [32]
Technology Unit Algeria Australia Indonesia Malaysia Nigeria
AP-X (Air Product and Chemicals, Inc.) % 0 0 0 0 0
AP-C3MR (Air Product and Chemicals, Inc.) % 81 22 71 88 100
AP-C3MR/SplitMR (Air Product, Inc.), % 19 24 29 12 -
Optimised Cascade (COPOC)
(ConocoPhillips)
% 0 54 0 0 0
MCR Linde MFC % 0 0 0 0 0
Table D-7: Technology mix of liquefaction (weighted by installed capacity) based on [32]
(continued)
Technology Unit Norway Qatar Trinidad & Tobago USA
AP-X (Air Product and Chemicals, Inc.) % - 61 - -
AP-C3MR (Air Product and Chemicals, Inc.) % - 21 - -
AP-C3MR/SplitMR (Air Product, Inc.), % - 18 - -
Optimised Cascade (COPOC) (ConocoPhillips) % - - 100 100
MCR Linde MFC % 100 - - -
Table D-8: Average annual ambient temperature, and CCS [14]
Technology Unit Algeria Australia Indonesia Malaysia Nigeria
Average ambient temperature °C 20 22 26 25 27
Share of separated CO2 for CCS wt.% 0 0 0 0 0
Table D-9: Average annual ambient temperature, and CCS [14] (continued)
Technology Unit Norway Qatar Trinidad & Tobago USA
Average ambient temperature °C 1 27 26 15
Share of separated CO2 for CCS wt.% 100 0 0 0

Life Cycle GHG Emission Study on the Use of LNG as Marine Fuel v1.0 129 of 154
Table D-10: Energy use (LHV), boil-off gas rate and recovery for gas purification and
liquefaction [14]
Parameter Unit Algeria OLD47 Algeria Australia Indonesia Malaysia
Electricity kJ/t 89,700 182,421 143,981 186,754 187,724
Natural Gas kJ/t 11,217,917 4,365,318 5,113,905 4,996,224 4,997,131
TOTAL kJ/t 11,307,617 4,547,738 5,257,886 5,182,977 5,184,855
Boil-off gas rate wt.% 3 3 3 3 3
of which: BOG recovery wt.% 99 99 99 99 99
of which: CH4 emissions wt.% 1 1 1 1 1
Table D-11: Energy use (LHV), boil-off gas rate and recovery for gas purification and
liquefaction [14] (continued)
Parameter Unit Nigeria Norway Qatar Trinidad &
Tobago
USA
Electricity kJ/t 188,422 66,304 290,520 109,218 109,070
Natural Gas kJ/t 4,847,127 3,485,146 5,220,150 5,802,591 5,012,708
TOTAL kJ/t 5,035,549 3,551,450 5,510,670 5,911,809 5,121,777
Boil-off gas rate wt.% 3 1.8 3 3 3
of which: BOG recovery wt.% 99 99 99 99 99
of which: CH4 emissions wt.% 1 1 1 1 1
LNG Carrier Transport
Based on the distance and the vessel capacities, the GHG model distinguishes between the following
three LNG transport types:
• Short distance transport (<125,000 m³): The LNG carrier fleet with vessel capacities
<125,000 m³ is applied for LNG transport within a region and between regions with a short
distance (e.g. LNG transport from Algeria to Europe). The LNG carrier fleet is illustrated in
Table D-12.
• Long distance transport (125,000 m³ to 180,000 m³): The LNG carrier fleet for long distance
transport (capacities from 125,000 m³ to 180,000 m³) as shown in Table D-13 is used for the
transport of LNG between regions.
• Long distance transport (>180,000 m³): The LNG carrier fleet with capacities >180,000 m³ is
used for long distance transport, in particular from Qatar (please see Table D-14).
47 Based on the NGVA study [9], it is assumed that 56 % of the Algerian LNG is produced from modern new LNG plants. The
GHG intensity of old plants is estimated using literature [43].

Life Cycle GHG Emission Study on the Use of LNG as Marine Fuel v1.0 130 of 154
Table D-12: Global market share of propulsion types of <125,000 m³ LNG carriers (related
to vessel capacities) in 2017, own calculations based on IGU [32]
Propulsion type Value/Unit
Steam turbine 100 %
Tri-fuel diesel electric (TFDE)
0 %
Dual-fuel diesel electric (DFDE)
0 %
Slow speed diesel (SSD)
0 %
ME-GI 0 %
X-DF 0 %
Others 0 %
Table D-13: Global market share of propulsion types of 125,000 to 180,000 m³ LNG carriers
(related to vessel capacities) in 2017, own calculations based on IGU [32]
Propulsion type Value/Unit
Steam turbine 53 %
Tri-fuel diesel electric (TFDE)
32%
Dual-fuel diesel electric (DFDE)
6 %
Slow speed diesel (SSD)
1 %
ME-GI 5 %
X-DF 0 %
Others 3 %
Table D-14: Global market share of propulsion types of >180,000 m³ LNG carriers (related
to vessel capacities) in 2017, own calculations based on IGU [32]
Propulsion type Value/Unit
Steam turbine 0 %
Tri-fuel diesel electric (TFDE)
0 %
Dual-fuel diesel electric (DFDE)
0 %
Slow speed diesel (SSD)
96 %
ME-GI 2 %
X-DF 2 %
Others 0 %
Table D-15 and Table D-16 summarise the fuel consumption and methane emissions of the LNG
carrier transport applied to all LNG imports independent of country of origin.

Life Cycle GHG Emission Study on the Use of LNG as Marine Fuel v1.0 131 of 154
Table D-15: LNG carrier fuel consumption (LHV) and methane emissions of <125,000 m³
LNG carriers, taken from NGVA study [13] and thinkstep’s GaBi LCI databases
[14] and crosschecked with primary data provided by Shell and Total [30] [31]
Unit / Capacity
[m³]
Small DFDE Small Steam
81,000 65,000
fuelled by HFO [MJ/MJ*km] - 4.10E-07
fuelled by MGO [MJ/MJ*km] 1.57E-07 -
fuelled by BOG [MJ/MJ*km] 3.29E-06 3.69E-06
TOTAL FUEL48 [MJ/MJ*km] 3.45E-06 4.10E-06
Methane emissions related to
BOG from cargo tank to engine
[% of BOG] 0.1 0.1
Methane slip during fuel
combustion
[%] 3 0
Table D-16: LNG carrier fuel consumption (LHV) and methane emissions of >125,000 m³
LNG carriers, taken from NGVA study [13] and thinkstep’s GaBi LCI databases
[14] and crosschecked with primary data provided by Shell and Total [30] [31]
Unit /
Capacity [m³]
Steam TFDE DFDE SSD ME-GI X-DF
140,000 160,000 174,000 216,00049 174,00050 174,00051
fuelled by HFO [MJ/MJ*km] 2.99E-07 4.97E-08 - 1.71E-06 - -
fuelled by MGO [MJ/MJ*km] - 6.64E-08 9.24E-08 - 2.00E-09 3.46E-11
fuelled by BOG [MJ/MJ*km] 2.71E-06 2.44E-06 2.02E-06 - 1.30E-06 1.45E-06
TOTAL FUEL52 [MJ/MJ*km] 3.01E-06 2.56E-06 2.11E-06 1.71E-06 1.30E-06 1.45E-06
Methane emissions
related to BOG from
cargo tank to
engine
[% of BOG] 0.1 0.1 0.1 0.1 0.1 0.1
Methane slip during
fuel combustion
[%] 0 3 3 0 0.1 1.7
All fuel consumption values are based on round-trip considerations per km, i.e., 0.5 km laden and
0.5 km ballast shipping. The data consider that 98 % of the LNG is unloaded. The remaining 2 % stay
in the vessel. The data are taken from the NGVA study [13] and thinkstep’s GaBi LCI databases [14],
crosschecked with [33], [34] and were considered good proxies for LNG carrier transport by
representatives of Shell [30] and Total [31]. The fuel consumption values were crosschecked with
[32].
The distances for LNG imports are calculated based on [35] and provided in the following tables.
The DSI, data source indicator, describes whether the data are primary, calculated, taken from
literature or estimated.
48 All fuel consumption values refer to regular sailing and do not include port operations. 49 Corresponds with QFlex vessel size 50 Data derived using publicly available data for the MAN ME-GI engine 5G70ME-C9.2-GI assuming the 75 % load point with
36,400 kW installed power. 51 Data derived using publicly available data for the WinGD X-72 DF engine assuming the 75 % load point with 36,400 kW
installed power. 52 All fuel consumption values refer to regular sailing and do not include port operations.

Life Cycle GHG Emission Study on the Use of LNG as Marine Fuel v1.0 132 of 154
Table D-17: Sea distances for LNG imports from Algeria [35] and kind of transport
Country of origin Destination Distance [km] Kind of transport DSI
Algeria
(Arzew/Skikda)
Europe
(average)
1,466 Short distance transport
(<125,000 m³)
literature
Algeria
(Arzew/Skikda)
Middle East
(Ain Sokhna Höegh)
3,630 Long distance transport
(125,000 – 180,000 m³)
literature
Table D-18: Sea distances for LNG imports from Australia [35] and kind of transport
Country of origin Destination Distance [km] Kind of transport DSI
Australia
(Karratha/Curtis)
Asia Pacific
(Yokkaichi)
6,560 Long distance transport
(125,000 – 180,000 m³)
literature
Australia
(Karratha/Curtis)
China
(Shanghai)
5,290 Long distance transport
(125,000 – 180,000 m³)
literature
Table D-19: Sea distances for LNG imports from Indonesia [35] and kind of transport
Country of origin Destination Distance [km] Kind of transport DSI
Indonesia
(Bontang-Badak)
North America
(Cove Point)
20,935 Long distance transport
(125,000 – 180,000 m³)
literature
Indonesia
(Bontang-Badak)
Asia Pacific
(Singapore)
1,950 Long distance transport
(125,000 – 180,000 m³)
literature
Indonesia
(Bontang-Badak)
China
(Guangzhou)
3,210 Long distance transport
(125,000 – 180,000 m³)
literature
Table D-20: Sea distances for LNG imports from Malaysia [35] and kind of transport
Country of origin Destination Distance [km] Kind of transport DSI
Malaysia
(Bintulu)
Asia Pacific
(Singapore)
240 Short distance transport
(<125,000 m³)
literature
Malaysia
(Bintulu)
China
(Guangzhou)
3,100 Long distance transport
(125,000 – 180,000 m³)
literature
Table D-21: Sea distances for LNG imports from Nigeria [35] and kind of transport
Country of origin Destination Distance [km] Kind of transport DSI
Nigeria
(Bonny)
Europe
(Rotterdam)
6,950 Long distance transport
(125,000 – 180,000 m³)
literature
Nigeria
(Bonny)
North America
(Cove Point)
9,520 Long distance transport
(125,000 – 180,000 m³)
literature
Nigeria
(Bonny)
Asia Pacific
(Yokkaichi)
19,700 Long distance transport
(125,000 – 180,000 m³)
literature
Nigeria
(Bonny)
China
(Shanghai)
17,390 Long distance transport
(125,000 – 180,000 m³)
literature
Nigeria
(Bonny)
Middle East
(Jordan)
10,390 Long distance transport
(125,000 – 180,000 m³)
literature

Life Cycle GHG Emission Study on the Use of LNG as Marine Fuel v1.0 133 of 154
Table D-22: Sea distances for LNG imports from Norway [35] and kind of transport
Country of origin Destination Distance [km] Kind of transport DSI
Norway
(Hammerfest)
Europe
(Rotterdam)
4,260 Long distance transport
(125,000 – 180,000 m³)
literature
Table D-23: Sea distances for LNG imports from Qatar [35] and kind of transport
Country of origin Destination Distance [km] Kind of transport DSI
Qatar
(Ras Laffan)
Europe
(average)
10,290 Long distance transport
(>180,000 m³)
literature
Qatar
(Ras Laffan)
Asia Pacific
(Yokkaichi)
11,840 Long distance transport
(>180,000 m³)
literature
Qatar
(Ras Laffan)
China
(Shanghai)
10,830 Long distance transport
(>180,000 m³)
literature
Qatar
(Ras Laffan)
Middle East
(Ain Sokhna Höegh)
5,200 Long distance transport
(>180,000 m³)
literature
Table D-24: Sea distances for LNG imports from Trinidad and Tobago [35] and kind of
transport
Country of origin Destination Distance [km] Kind of transport DSI
Trinidad & Tobago
(Atlantic)
Europe
(Rotterdam)
7,505 Long distance transport
(125,000 – 180,000 m³)
literature
Trinidad & Tobago
(Atlantic)
North America
(Cove Point)
3,330 Long distance transport
(125,000 – 180,000 m³)
literature
Trinidad & Tobago
(Atlantic)
Middle East
(Ain Sokhna Höegh)
10,375 Long distance transport
(125,000 – 180,000 m³)
literature
Table D-25: Sea distances for LNG imports from the USA [35] and kind of transport
Country of origin Destination Distance [km] Kind of transport DSI
USA
(Sabine Pass)
Europe
(Rotterdam)
9,260 Long distance transport
(125,000 – 180,000 m³)
literature
USA
(Sabine Pass)
North America
(Cove Point)
2,960 Short distance transport
(<125,000 m³)
literature
USA
(Sabine Pass)
Asia Pacific
(Yokkaichi)
8,030 Long distance transport
(125,000 – 180,000 m³)
literature
USA
(Sabine Pass)
China
(Shanghai)
18,670 Long distance transport
(125,000 – 180,000 m³)
literature
USA
(Sabine Pass)
Middle East
(Jordan)
12,950 Long distance transport
(125,000 – 180,000 m³)
literature

Life Cycle GHG Emission Study on the Use of LNG as Marine Fuel v1.0 134 of 154
LNG Terminal Operations and Maritime Bunkering
Data for LNG terminal operations are taken from thinkstep’s GaBi LCI databases [14]. Shell [30]
provided data for maritime LNG bunkering (ship-to-ship). The following tables specify the key
parameters for LNG terminal operations and maritime bunkering. The DSI, data source indicator,
describes whether the data are primary, calculated, taken from literature or estimated.
Table D-26: Energy use (LHV) and methane losses for LNG terminal operations and
maritime bunkering (ship-to-ship) [14], [30]
Parameter Unit Value Data provider DSI
Electricity kJ/t 4,456 [14] literature
Methane losses during terminal operations wt.% 1.5E-03 [14] literature
Methane losses during bunkering wt.% 0.0361 [30] primary
Table D-27: Electricity grid mix datasets used for the modelling of LNG terminal operations
and maritime bunkering [14]
Region Dataset
Europe EU-28: Electricity grid mix
North America US: Electricity grid mix (proxy)53
Asia Pacific JP: Electricity grid mix (proxy)53
China CN: Electricity grid mix
Middle East EG: Electricity grid mix (proxy)53
Table D-28: Distance covered, fuel consumption (LHV) and methane emissions of LNG
bunker barge, taken from NGVA study [13] and thinkstep’s GaBi LCI databases
[14] and crosschecked with primary data provided by Shell and Total [30] [31]
LNG bunker DFDE
Unit / Capacity [m³] 10,000
Distance [km] 10 (roundtrip: 20)
fuelled by HFO [MJ/MJ*km] -
fuelled by MGO [MJ/MJ*km] 3.10E-08
fuelled by BOG [MJ/MJ*km] 1.70E-06
TOTAL FUEL54 [MJ/MJ*km] 1.74E-06
Methane emissions related to BOG from cargo tank to engine [% of BOG] 0.1
Methane slip during fuel combustion [%] 3
53 Since a region-specific electricity grid mix is not available 54 All fuel consumption values refer to regular sailing and do not include port operations.

Life Cycle GHG Emission Study on the Use of LNG as Marine Fuel v1.0 135 of 154
Data Sources and Data Quality of the Foreground System
Table E-1: Overview on data sources and data quality of the foreground system of the
LNG WtW analyses
55 Data from thinkstep’s GaBi LCI databases are considered as literature data [14].
Annex E: Data Sources and Data Quality
Analysis Process Geography Reference
year DSI55
Contribution
to GHG results
WtT Natural gas
production and
processing
Algeria 2012 NGVA study [13] 21-25 %
Australia 2015-2017 literature
Indonesia 2015-2017 literature
Malaysia 2015-2017 literature
Nigeria 2015 NGVA study [13]
Norway 2015 NGVA study [13]
Qatar 2014 NGVA study [13]
Trinidad and
Tobago
2015-2017 literature
USA 2015-2017 primary, literature
Natural gas
pipeline transport
Algeria 2015 NGVA study [13],
literature
Australia 2015 literature
Indonesia 2015 literature
Malaysia 2015 literature
Nigeria 2015 NGVA study [13],
literature
Norway 2015 NGVA study [13],
literature
Qatar 2015 NGVA study [13],
literature
Trinidad and
Tobago
2015 literature
USA 2016 literature
Natural gas
liquefaction
(including
purification)
Algeria 2012-2017 NGVA study [13],
literature
Australia 2015-2017 literature
Indonesia 2015-2017 literature
Malaysia 2015-2017 literature
Nigeria 2015-2017 NGVA study [13],
literature

Life Cycle GHG Emission Study on the Use of LNG as Marine Fuel v1.0 136 of 154
Table E-2: Overview on data sources and data quality of the foreground system of the oil-
based marine fuels WtW analyses
Analysis Process Geography Reference
year
DSI56 Contribution to
GHG results
WtT Crude oil production
and processing
countries 2015 literature 16-18 %
Crude oil pipeline global 2015-2017 literature
Crude oil tanker global 2015-2017 literature
Crude oil refinery regions 2004-2017 literature
Consumption mixes regions/global 2015 literature
TtW Oil-based marine fuel
engines
global 2018 primary 82-84 %
56 Data from thinkstep’s GaBi LCI databases are considered as literature data [14].
Norway 2015-2017 NGVA study [13],
literature
Qatar 2015-2017 NGVA study [13],
literature
Trinidad and
Tobago
2015-2017 literature
USA 2015-2017 literature
LNG carrier
transport
global 2017 NGVA study [13],
literature
LNG terminal
operations and
maritime bunkering
regions 2018 primary
LNG consumption
mixes
regions/global 2017 literature
TtW LNG engines global 2018 primary 75-79 %

Life Cycle GHG Emission Study on the Use of LNG as Marine Fuel v1.0 137 of 154
Background Datasets Used
The key electricity datasets used for the background system are listed in Table E-3, all other key
background datasets in Table E-4. All background datasets are sourced from thinkstep’s GaBi LCI
databases 2018 [14]. A detailed description of the datasets can be found in [24].
Table E-3: Key electricity datasets used for background system, obtained from thinkstep’s
GaBi LCI databases 2018 [14]
Process Geography Dataset Data
provider
Type57 GHG Intensity
[gCO2-eq/kWh]
Electricity Algeria Electricity grid mix thinkstep agg 848.1
Australia Electricity grid mix thinkstep agg 885.5
China Electricity grid mix thinkstep agg 871.5
Egypt Electricity grid mix thinkstep agg 547.0
EU-28 Electricity grid mix thinkstep agg 418.3
Indonesia Electricity grid mix thinkstep agg 1,074.5
Japan Electricity grid mix thinkstep agg 662.9
Malaysia Electricity grid mix thinkstep agg 843.4
Nigeria Electricity grid mix thinkstep agg 667.2
Norway Electricity grid mix thinkstep agg 30.5
Qatar Electricity grid mix thinkstep agg 619.6
Trinidad & Tobago Electricity grid mix thinkstep agg 702.8
USA Electricity grid mix thinkstep agg 616.4
57 Type of dataset: agg – LCI result; p-agg – partly terminated system; u-so – unit process, single operation

Life Cycle GHG Emission Study on the Use of LNG as Marine Fuel v1.0 138 of 154
Table E-4: Other key datasets used for background system, obtained from thinkstep’s GaBi
LCI databases 2018 [14]
Process Geography Dataset Data provider Type
Fuel Australia Diesel mix at
filling station
thinkstep u-so
EU-28 Diesel mix at
filling station
thinkstep u-so
India Diesel mix at
filling station
thinkstep u-so
Malaysia Diesel mix at
filling station
thinkstep u-so
USA Diesel mix at
filling station
thinkstep u-so
EU-28 Liquefied
Petroleum Gas
(LPG) (from
natural gas)
thinkstep u-so
EU-28 Liquefied
Petroleum Gas
(LPG) (70%
propane, 30%
butane)
thinkstep u-so
EU-28 Methanol mix thinkstep u-so
Fuel
combustion
global Diesel CHP thinkstep agg
global Gas CHP thinkstep agg
global Gas engine thinkstep agg
global Gas turbine
mechanical
thinkstep agg
Other
materials
US Urea thinkstep agg
EU-28 Water (deionised) thinkstep agg

Life Cycle GHG Emission Study on the Use of LNG as Marine Fuel v1.0 139 of 154
Proxy data used
Table E-5: Overview on proxy data used
Analysis Process Proxy data
WtT of LNG Natural gas pipeline
transport
The LCIs of diesel mixes for some countries are not
available in thinkstep’s GaBi LCI databases, thus
• diesel mix of India is used for Algeria, Nigeria, Qatar
and Trinidad and Tobago,
• diesel mix of Malaysia is used for Indonesia,
• diesel mix of EU-28 is used for Norway.
LNG terminal
operations and
maritime bunkering
The LCIs of electricity mixes for regions are not available in
thinkstep’s GaBi LCI databases, thus
• electricity mix of the USA is used for North America,
• electricity mix of Japan is used for Asia-Pacific,
• electricity mix of Egypt is used for Middle East.
WtT of oil -
based marine
fuels
Region-specific and
global consumption
mix
Absolute oil-based marine fuel consumption data for
regions are not available. Absolute crude oil consumption
data are used as proxy.
Refinery The LCIs of the refinery for some countries and regions are
not available in thinkstep’s GaBi LCI databases, thus
• refinery of Japan is used for China and South East
Asia,
• refinery of India is used for Middle East,
• refinery of the USA is used for North America.
Distribution In general: crude oil transport pipelines are used as proxy
for the transport of the oil-based marine fuels. The LCIs of
crude oil transport pipelines for regions are not available in
thinkstep’s GaBi LCI databases, thus
• crude oil transport pipeline of Saudi Arabia is used for
Middle East,
• crude oil transport pipeline of Japan is used for South
East Asia,
• crude oil transport pipeline of the USA is used for North
America.
WtT of LPG
and methanol
Distribution Crude oil transport pipelines are used for the transport of
LPG and methanol

Life Cycle GHG Emission Study on the Use of LNG as Marine Fuel v1.0 140 of 154
Well-to-Tank - GHG Emissions of LNG
An overview of the GHG results in g CO2-eq/MJ (LHV) fuel delivered to the tank for the global LNG
supply and the five defined LNG consumption regions (Europe, North America, Asia Pacific, China
and Middle East) is provided in Figure F-1 and Table F-1. The results are broken down by the main
process steps of the LNG supply chain. The GHG emissions for the LNG supply chain differ from
region to region.
Figure F-1: Well-to-Tank – GHG Emissions: LNG supply (global and regions) – breakdown
by main process steps [23]
Table F-1: Well-to-Tank – GHG Emissions: LNG supply (global and regions) – breakdown
by main process steps [23]
GHG IPCC - AR5 [g CO2-eq/MJ
(LHV)], in tank
Global Europe North
America
Asia
Pacific
China Middle
East
Gas production, processing and
pipeline transport
6.1 7.4 8.1 5.9 5.1 5.3
Gas liquefaction (incl. purification) 9.2 10.2 8.2 9.0 8.9 9.5
LNG carrier transport 2.5 2.5 1.9 2.4 2.6 2.6
LNG terminal operations and
maritime bunkering
0.7 0.7 0.7 0.7 0.7 0.7
TOTAL LNG 18.5 20.9 18.9 18.0 17.3 18.2
Figure F-2 and Table F-2 display the same overall results as Figure F-1 and Table F-1, but are broken
down into the individual emissions CO2, CH4, and N2O. N2O contributes to a very small extent, and
Annex F: Well-to-Tank - GHG Emissions

Life Cycle GHG Emission Study on the Use of LNG as Marine Fuel v1.0 141 of 154
the contributions of other greenhouse gases also included in the life cycle inventory data are orders
of magnitude smaller and therefore excluded from the figure.
Figure F-2: Well-to-Tank – GHG Emissions: LNG supply (global and regions) – breakdown
by main individual emissions [23]
Table F-2: Well-to-Tank – GHG Emissions: LNG supply (global and regions) – breakdown
by main individual emissions [23]
GHG IPCC - AR5 [g CO2-eq/MJ
(LHV)], in tank
Global Europe North
America
Asia
Pacific
China Middle
East
CO2 13.7 14.7 12.8 13.6 13.3 13.9
CH4 4.7 6.1 6.0 4.4 3.9 4.2
N2O 0.1 0.1 0.1 0.1 0.1 0.1
TOTAL LNG 18.5 20.9 18.9 18.0 17.3 18.2

Life Cycle GHG Emission Study on the Use of LNG as Marine Fuel v1.0 142 of 154
Well-to-Tank - GHG Emissions of Oil-based Fuels
The GHG results in g CO2-eq/MJ (LHV) fuel delivered to the tank of the conventional global oil-based
marine fuel supply and the five consumption regions are illustrated in Figure F-3. As the LNG supply,
the results differ significantly from region to region. The region-specific refinery structures determine
if the GHG emissions of the HFO2.5 supply chains are higher or lower than the GHG emissions of the
MGO0.1 supply chain. Compared with the other regions, the North American refinery shows the
highest GHG emissions due to a more energy intensive refinery configuration.
Figure F-3: Well-to-Tank – GHG Emissions: Current oil-based marine fuel supply (global
and regions) – breakdown by main process steps [23]
Figure F-4 shows the GHG results in g CO2-eq/MJ (LHV) fuel for the post-2020 scenarios on the
global oil-based marine fuel supply and the five consumption regions.

Life Cycle GHG Emission Study on the Use of LNG as Marine Fuel v1.0 143 of 154
Figure F-4: Well-to-Tank – GHG Emissions: Oil-based marine fuel supply “post-2020”
(global and regions) – breakdown by main process steps [23]

Life Cycle GHG Emission Study on the Use of LNG as Marine Fuel v1.0 144 of 154
The following section is supplementary to section 6. It includes the results of the Well-to-Wake GHG
emissions for the different engines technologies that are not described in the main body of the study.
The first part shows the evaluation of different impact categories on 2-stroke SS and 4-stroke HS
engines in Tier III operation. The second part describes the operation of all engines in Tier II areas
(outside of ECA) and its presents the WtW GHG emissions. Additionally, the influence of different
NOx-after-treatment system on GHG emissions is discussed briefly.
In the last section of Annex F, the WtW GHG emissions of Methanol and LPG powered engines are
briefly discussed.
Well-to-Wake – Impact on GHG Emissions of different Impact Categories
The relative GHG emissions of the different impact categories for the 2-stroke engine are shown in
Figure G-1. The calculations are based on the aggregated Tier III inventory data (see Table 5-8). As
described in the main body of the study, the direct methane emissions have an influence on the
absolute GHG emissions as its characterisation factor is the main differentiator between the impact
categories investigated. Depending on the impact category evaluated, GHG emissions vary between
94 and 112 % (2-stroke slow speed Diesel-DF engine) of the base scenario (AR5, GWP100) and
between 87 and 130 % (2-stroke slow speed Otto-DF engine)58.
Figure G-1: Impact of different characterisation factors (relative) on the WtW GHG
emissions of 2-stroke slow speed engines when using LNG compared with
58 Using a characterisation factor of 36 g CO2-eq/g CH4 (which is currently under discussion), the WtW GHG emissions would
reach 101 % for the 2-stroke SS-Diesel-DF engine (AR 5, GWP100=100 %), 103 % for the 2-stroke SS-Otto-DF engine.
Annex G: Well-to-Wake GHG Emissions

Life Cycle GHG Emission Study on the Use of LNG as Marine Fuel v1.0 145 of 154
IPCC, AR5, GWP100 (= 100 %) and oil-based fuel operation (HFO2.5) shown as
vertical marks [23]
For the 4-stroke high speed engines, results vary between 86 and 132 % of the base scenario59.
Figure G-2: Impact of different characterisation factors (relative) on the WtW GHG
emissions of 4-stroke high speed engines when using LNG compared with
IPCC, AR5, GWP100 (= 100 %) and oil-based fuel operation (MGO0.1) shown as
vertical marks [23]
Gas turbine applications are not investigated as the methane slip is negligible.
Well-to-Wake – GHG Emissions in Tier II Operation
Tier III limits are only applicable in ECA zones. The resulting GHG emissions are described in detail
in section 6. Outside ECA zones, Tier II limits apply enabling e.g. an operation with oil-based marine
fuels without NOX after-treatment system. WtW GHG emissions of Tier II operation are shown for the
2- and 4-stroke engines based on the Tier II inventory data for the IMO E2/E3 cycle. Gas turbine
applications are not described as they comply to the IMO Tier III limit also when running with oil-
59 Using a characterisation factor of 36 g CO2-eq/g CH4 (which is currently under discussion), the WtW GHG emissions would
reach 104 % for the 4-stroke HS-Otto-SI engine.

Life Cycle GHG Emission Study on the Use of LNG as Marine Fuel v1.0 146 of 154
based MGO. Apart from the 2-stroke slow speed Diesel-DF engine, all engines using LNG comply to
the Tier III limit hence WtW GHG emissions are the same as described in section 6.3.
Figure G-3: Well-to-Wake - GHG emissions of 2-stroke slow speed engines (Tier II) [23]
Figure G-3 shows that the GHG emissions of oil-based fuels decrease compared with Tier III
operation. This is due to the lower fuel consumption and the absence of urea in Tier II operation. This
results in lower WtW GHG emissions of the oil-based marine fuels. The WtW emissions of the 2-
stroke slow speed Diesel-DF engine running on LNG decline also to 531 g CO2-eq/kWh as the switch
from Tier III to Tier II operation decreases fuel consumption. The benefit of LNG compared with HFO
Tier II operation is 22 %. The GHG benefit of the 2-stroke Otto-DF engine running on LNG compared
with HFO Tier II is 12 %.
The same characteristics, i.e. GHG emissions from oil-based operation decreases from Tier III to
Tier II, apply to the 4-stroke medium speed engines as less fuel and no urea is needed (see Table
5-6 for reference). Figure G-4 shows the calculated WtW GHG emissions. The benefit of LNG for the
4-stroke MS-Otto DF engine is 4 %. For the 4-stroke MS-Otto-SI engine, the benefit is 13 %.
Figure G-4 Well-to-Wake - GHG emissions of 4-stroke medium speed engines (Tier II) [23]

Life Cycle GHG Emission Study on the Use of LNG as Marine Fuel v1.0 147 of 154
The GHG reduction of LNG used in 4-stroke high speed Otto-SI engines, compared with Tier III
operation with MGO0.1 of 6 % (Figure 6-7), decreases to 4 % when comparing it to Tier II data as the
GHG emissions of MGO0.1 operation decline from 859 to 844 g CO2-eq/kWh.
Figure G-5: Well-to-Wake - GHG emissions of 4-stroke high speed engines (Tier II) [23]
Influence of different NOX after-treatment systems on WtW GHG emissions
As described in the main body of the study, different technologies are available to decrease NOX
emissions. In this paragraph, the influence of SCR and EGR on WtW GHG emissions are described
briefly. Typically, the reduction of NOX comes at the expense of increased consumption of either urea
solution (only applicable for SCR system) and/or engine fuel.
Taking into account the assumptions in Table 5-6 and assuming a HFO consumption without SCR of
160 g/kWh, the additional WtW GHG emissions due to the operation of a SCR system are 16.1 g CO2-
eq/kWh for the 4-stroke engines and 14.0 g CO2-eq/kWh for the 2-stroke engines.
Some engine manufacturers develop exhaust gas recirculation system (EGR) that enable higher
engine efficiency and hence lower fuel consumption, even in Tier II operation. Evaluating the Tier II
data of the MAN 6G70ME-C10.5 engine [71], the overall fuel consumption is decreased by 3 % (IMO
E2/E3 cycle) when the engine runs on the MAN EcoEGR setting compared with a standard Tier II
setting. In Tier III operation, the fuel consumption is 1 % higher than when operating the SCR system,
however no urea is needed. Assuming a fuel consumption of 160 g/kWh (see above), the 1 %
increase leads to additional 5.8 g CO2-eq/kWh compared with the 14.0 g CO2-eq/kWh calculated
above, showing the benefit of the EcoEGR system.

Life Cycle GHG Emission Study on the Use of LNG as Marine Fuel v1.0 148 of 154
Well-to-Wake – GHG Emissions of Methanol and LPG
In addition to the oil-based marine fuels, methanol and LPG can be considered as reference marine
fuels. The fuels are briefly described in Table G-1.
Table G-1: Overview on other marine fuels considered in this study
Marine Fuel Description
LPG In this study, the liquefied petroleum gas (LPG) mix is a blend of 40 wt.% LPG from
refinery and 60 wt. % LPG from Natural gas processing:
• LPG from refinery consists of 70 wt. % propane and 30 wt. % butane. Propane
and butane are both refinery products and data include the supply chain from
crude oil production and processing, transport and refinery to distribution (same
distribution as for oil-based fuels assumed).
• Data on LPG from natural gas processing cover the whole supply chain,
including conventional natural gas production and processing and distribution
(same distribution as for oil-based fuels assumed).
Data on LPG are taken from thinkstep’s GaBi LCI databases [14].
Methanol In this study, the methanol is produced considering a mix of large-scale
technologies and integrated technologies. Methanol is produced from natural gas
via synthesis gas. Synthesis gas is a mixture of hydrogen and carbon monoxide.
The two industrially important processes for its production are steam reforming and
partial combustion. Methanol is formed from synthesis gas and purified by
distillation. Data on methanol are taken from thinkstep’s GaBi LCI databases [14].
Figure G-6 shows the GHG results in g CO2-eq/MJ (LHV) fuel for the LPG and methanol supply. LPG
is calculated with 8.3 g CO2-eq/MJ (LHV), which can be divided into 79 % CO2 and 21 % CH4
emissions. The methanol supply has an impact of 31.3 g CO2-eq/MJ (LHV). CO2 is the main
contributor (90 %). The other 10 % are caused by CH4. N2O emissions are negligible for both fuel
supply chains. The results are compared with the results of the JEC-WtW study [3] and show similar
results (LPG supply in JEC-WtW study: 8.0 g CO2-eq/MJ (LHV) LPG; methanol supply in JEC-WtW
study: 24.9-32.2 g CO2-eq/MJ (LHV) methanol).
Figure G-6: Well-to-Tank – GHG Emissions: Other marine fuel supply [23]
Data of the combustion of LPG and methanol was provided by MAN and Wärtsilä for 2-stroke slow
speed and 4-stroke medium speed engines [54] [71] and weigthened accoridng to the IMO E2/E3
cycle. Due to data availability, this is limited to Tier II consumption data with MGO0.1 as a pilot fuel.
Local pollutant emissions are not investigated.
Table G-2 shows the Tier II inventory.

Life Cycle GHG Emission Study on the Use of LNG as Marine Fuel v1.0 149 of 154
Table G-2: Tier II fuel consumption data (primary) for 2- and 4-stroke engines running on
LPG and Methanol based on the IMO E2/E3 cycle [71], [54]
g/kWh LPG Methanol DSI
2-stroke slow speed
Main fuel consumption 147.9 345.7 primary
Pilot fuel consumption 8.3 10.5 primary
4-stroke medium speed
Main fuel consumption - 373.2 primary
Pilot fuel consumption - 9.8 primary
Figure G-7 and Figure G-8 show the WtW GHG emissions for 2-stroke slow speed engines and 4-
stroke medium speed engines for LNG, methanol and LPG operation respectively broken down by
fuel supply and combustion.
The WtW GHG emissions of 2-stroke slow speed engines running on LPG are calculated to 535
g CO2-eq/kWh and 748 g CO2-eq/kWh when running on methanol. The emissions resulting from the
combustion (TtW) are in the same order of magnitude (473 respectively 524 g CO2-eq/kWh) with the
supply of methanol having significantly higher GHG emissions. Compared with LPG – depending on
the engine – LNG show a marginal reduction or up to a 12 % increase in GHG emissions. Compared
with methanol both LNG engines offer a GHG benefit with the Diesel-DF engine reaching a 29 %
reduction and the Otto-DF engine reaching 20 %.
Figure G-7: WtW GHG emissions of 2-stroke slow speed engines using Methanol and LPG
[23]
For 4-stroke medium speed engines, only methanol is investigated as an alternative fuel. The WtW
GHG emissions result in 802 g CO2-eq/kWh with both the GHG emissions of the supply and the

Life Cycle GHG Emission Study on the Use of LNG as Marine Fuel v1.0 150 of 154
combustion being higher for the respective LNG engine as shown in Figure G-8. The GHG benefit of
LNG compared with methanol is 14 % for the Otto-DF engine and 22 %for the Otto-SI engine.
Figure G-8: WtW GHG emissions of 4-stroke medium speed engines using Methanol [23]

Life Cycle GHG Emission Study on the Use of LNG as Marine Fuel v1.0 151 of 154
Annex H: Sensitivity Analysis on Technical Parameters
Well-to-Wake – Sensitivity Analysis on Technical Parameters for LNG
Figure H-1 to Figure H-4 illustrate the results of the sensitivity analysis on technical parameters for
LNG. A detailed description of the sensitivity analysis and the results can be found in section 6.8.2.
Figure H-1: Sensitivity analysis on selected parameters from the WtW GHG model of LNG
2-stroke slow speed Diesel-DF [23]
Figure H-2: Sensitivity analysis on selected parameters from the WtW GHG model of LNG
2-stroke slow speed Otto-DF [23]

Life Cycle GHG Emission Study on the Use of LNG as Marine Fuel v1.0 152 of 154
Figure H-3: Sensitivity analysis on selected parameters from the WtW GHG model of LNG
4-stroke medium speed Otto-DF [23]
Figure H-4: Sensitivity analysis on selected parameters from the WtW GHG model of LNG
4-stroke high speed Otto-SI [23]

Life Cycle GHG Emission Study on the Use of LNG as Marine Fuel v1.0 153 of 154
Well-to-Wake – Sensitivity Analysis on Technical Parameters for HFO2.5
Figure H-5 illustrate the results of the sensitivity analysis on technical parameters for HFO2.5 2-stroke
Diesel slow speed. Please see section 6.8.3 for a description of the results.
Figure H-5: Sensitivity analysis on selected parameters from the WtW GHG model of HFO2.5
2-stroke slow speed Diesel [23]
Life Cycle GHG Emission Study on the Use of LNG as Marine Fuel v1.0 154 of 154
Annex I: Critical Review Statement
All reviewer comments have been taken into account in the report, but for one reviewer the final check
of the CR report is pending due to urgent family and business reasons. The final version of the CR
report might (slightly) differ and will be available after the press conference.

Critical Review Statement of the report
“Life Cycle GHG Emission Study on the Use of LNG as Marine Fuel”
dated 10 of April 2019
ISO 14 040 & ISO 14 044 ISO/TS 14071
SOL 18-060.1
10 of April 2019
Draft for
SEA\LNG and SGMF

Critical Review Panel for SEA\LNG and SGMF
Critical Review of the report “Life Cycle GHG Emission Study on the Use of LNG as Marine Fuel” SOL 18-060.1 Drafft of the 10 of April 2019 page 2 of 4
1 Introduction thinkstep has prepared a third-party report “Life Cycle GHG Emission Study on the Use of LNG as Marine Fuel” dated 10 of April 2019. The goal of the third-party report was to “to provide an accurate report of the life cycle GHG emissions on the use of LNG as a marine fuel compared with conventional marine fuels”.
This study states that ISO 14040:2006 and ISO 14044:2006 requirements have been applied in order to get reliable transparent GHG results for LNG as marine fuel. To fulfill the ISO requirements, SEA\LNG and SGMF have requested a critical review (CR) panel to conduct a critical review of the third-party report (this “third-party report” is called “the LCA report” in the following of the text). The present report is the “Final CR report”, including the detailed tables prepared by the CR panel under the direction of Philippe Osset (Solinnen). This CR report is dedicated to being integrated, as a whole, within the final LCA report of SEA\LNG, SGMF and thinkstep.
2 Composition of the panel The CR panel consisted of the following members, independent from the overall study content, and external to SEA\LNG and SGMF, thinkstep and the related business interests:
− Dipl. Eng. Philippe Osset, Solinnen, LCA expert (France). Philippe has acted as the chair of the Critical Review panel,
− Prof. Dr. Atsushi Inaba, Department of Environmental and Energy Chemistry at Kogakuin University (Japan),
− Prof. Dr. Friedrich Wirz, Head of Working Group Marine Engineering at Technical University of Hamburg (Germany),
− Dr. Michael Wang, Director of the Systems Assessment Department, Energy System Division at Argonne National Laboratory (USA).
The intention of the panel set up was to make available competencies which cover the studied topic. The reviewers were not engaged or contracted to represent officially their organization but acted as independent expert reviewer.
3 Nature of the CR work, CR process and limitations The CR panel has worked according to the requirements of ISO 14040:2006 and 14044:2006 concerning CR. They have taken into account ISO/TS 14071 requirements too.
According to ISO 14044, the critical review process has been undertaken in order to check if:
− the methods used to carry out the LCA in the LCA report are consistent with ISO 14044 requirements,
− the methods used to carry out the LCA are scientifically and technically valid,
− the data used are appropriate and reasonable in relation to the goal of the study,
− the interpretations reflect the limitations identified in the study and the goal of the study, and
− the study report is transparent and consistent.
The first task of the CR was to provide thinkstep with detailed comments in order to allow thinkstep to improve its work. These comments have covered methodology choice, results and reporting. The panel has checked the plausibility of the data used, including sample tests in the database regarding data implementation, system modeling, and LCI and LCIA results. Additionally, this final CR report provides the future reader of the LCA report and user of the LCI with information that will help understand the LCA report, its results, and the LCI data used in this study.
The CR was performed after completion of the draft study. The analysis and the verification of individual datasets are outside the scope of the CR. Nonetheless, a plausibility check of the software model was performed on the 29 of March 2019.
The CR work started in March 2019 and ended in April 2019. During this period, various oral and written exchanges have been held between the CR panel, SEA\LNG, SGMF and thinkstep, including clarification exchanges regarding

Critical Review Panel for SEA\LNG and SGMF
Critical Review of the report “Life Cycle GHG Emission Study on the Use of LNG as Marine Fuel” SOL 18-060.1 Drafft of the 10 of April 2019 page 3 of 4
the CR initial comments, and the production of one set of detailed comments by the CR panel, and a new version of the LCA report by thinkstep. Nevertheless, no new LCA calculations have been done after the comments of the panel, according to the answer brought to the panel by thinkstep regarding upstream LCI data used and the model itself, apart from specific corrections of identified issues and clarifications on certain questions brought by the CR panel.
The panel prepared 264 comments on the draft LCA report. They covered the following areas:
− General (21 key comments),
− Methodology (20 key comments),
− Technical (61 key comments),
− Data (49 key comments),
− Other miscellaneous comment (113 comments).
thinkstep has taken into account most of the comments and modified and improved their LCA report. In fact, a significant work has been done by SEA\LNG, SGMF and thinkstep to provide a final LCA report integrating answers to the CR comments, and the final result and the report have improved as compared to the draft version, towards the requirement of the reference standards.
This final CR report is the synthesis of the final comments by the reviewers. The remaining detailed comments are provided within this final CR report, together with the full detailed exchanges as appendices.
This final CR report is delivered to SEA\LNG and SGMF by the panel. The CR panel cannot be held responsible of the use of its work by any third party. The conclusions of the CR panel cover the full LCA report from SEA\LNG and SGMF. They do not cover any other report, extract, extrapolation or publication which may eventually been done. The CR panel conclusions have been made given the current state of the art and the information which has been received for the covered topics in the LCA report. These CR panel conclusions could have been different in a different context.
4 Conclusions of the Review – Critical Review Statement
As a whole, the CR panel considers that the requirements of the reference standards have been met.
The final LCA report answers the goal which has been set up, within the scope of the limitations that are mentioned in the LCA report and the detailed panel comments which are provided in the next chapter.
It must be clearly understood that the study does not allow to assess the advantages and disadvantages of the natural gas ships vis-à-vis non fossil fuels resources ships.
Additionally, it must be clearly understood that only GhG emissions have been assessed in the LCA report over the whole life cycle, and some local emissions were assessed for the ship operation only, and therefore that no conclusion should be taken regarding the overall environmental impacts (or benefits) associated to the studied life cycles – reductions of GHGs do not imply reduction of other environmental impacts, sometimes a reduction of GHGs is accompanied by an increase of other impacts – this is called “pollution transfer” in LCA.
5 Detailed comments The following lines bring some highlights that a reader of the final LCA report may use to assist his reading and understanding of the LCA report. It includes also some critical comments which were not addressed, or which were addressed in a way which is different from what the CR panel expected. The comments which have been fully addressed no longer appear here. The reading of the detailed comments and answers (see the table in appendices at Chapter 6) is recommended.
5.1 Consistency of methods used with ISO 14044 requirements The final structure of the LCA report presents the content of the ISO standard requirements. The methods that have been selected for reference calculations are clearly presented. The choice of functional unit for the well to wake comparison should be understood with care when communicating the conclusions of the LCA study.
Critical Review Panel for SEA\LNG and SGMF
Critical Review of the report “Life Cycle GHG Emission Study on the Use of LNG as Marine Fuel” SOL 18-060.1 Drafft of the 10 of April 2019 page 4 of 4
5.2 Scientific and technical validity As stated in the LCA report, “methane slips have been included. They play an important role in addition to the emission from supply chain”. Their value is highly variable depending on the engines, and the LCA has assessed methane slips values which are globally appropriate. The panel recommends, on a case by case basis, to consider specific methane slips to ensure that the conclusions of the report applies to a given model of engine, as stated in the conclusions of the LCA report. Additionally, a combination of variability of methane slips and CH4 characterization factor could show higher variability which were not assessed in the sensitivity analyses at the same time.
5.3 Appropriateness of data used in relation to the goal of the study The data used in the report are appropriate as far as the selected functional unit is concerned. In fact, the LCA study has benefited from data provided by major ship makers related to ship operation, and a 2017 study for data related to natural gas supply chain. The modeling in the GaBi software and its databases reflects what is described in the LCA report. A lot of data have been implemented manually from the Excel file in the GaBi software by copy and paste, with a risk of error. Nevertheless, the overall results look plausible to the panel.
Annex B presents the table of Characterization Factors that have been used, which covers the broad expectations of ISO 14067.
As mentioned in the LCA report, the European DG JRC recommends the use of 36,75 as characterization factor for methane for GWP 100 years direct in the PEF Guide, as currently published in Europe – this PEF guide presents requirements which are used by thinkstep as described in the presentation chapter of thinkstep (together with the link where to download the PEF guide). This characterization factor has not been used in the present report, which limits the application of the comparison results in the scope of the scheduled PEF applications. Indeed, answering PEF requirements was not part of the goal of the commissioners.
5.4 Validity of interpretations in the scope of the limitations of the study The results of GHG emission changes on the life cycle basis are complete by including all key stages of the natural gas supply chain and ship operations. In particular, the LCA study identifies key methane leakages and test their importance for LCA results o LNG as a marine fuel. As mentioned in the LCA report, “Black Carbon emissions are not considered, though potentially contributing to the global warming potential. Due to the uncertainty of the evaluation of its effect (between 0,3 and 15%), the GHG effect of black carbon emissions have not been taken into account. This choice can be seen as a likely conservative”. The panel recommends including black carbon effect in further LCA concerning marine transportation to improve the comparisons, as stated in chapter 9.2. of the LCA report. It would take into account improvements in the assessment of the effect of black carbon on global warming
5.5 Transparency and consistency The overall level of transparency and consistency of the report is high, and in line with the ISO 14044:2006 expectations. Some duplications exist in the report which may confuse the reader. After checking, these duplications do not introduce inconsistencies in the LCA report and might help to get the appropriate information when readers do not read the entire report.
6 Appendices The detailed critical review tables exchanged during the CR are the appendices of the present CR report. They recap the detailed exchanges between the CR panel and SEA\LNG, SGMF and thinkstep.