Life Cycle Energy Assessment of Alternative Water Supply Systems (9 pp)
9
LCA Methodology and Case Study Alternative Water Supply Systems 335 © 2006 ecomed publishers (Verlagsgruppe Hüthig Jehle Rehm GmbH), D-86899 Landsberg and Tokyo • Mumbai • Seoul • Melbourne • Paris Int J LCA 11 11 11 11 11 (5) 335 – 343 (2006) LCA Methodology and Case Study Life Cycle Energy Assessment of Alternative Water Supply Systems Jennifer Stokes and Arpad Horvath* Department of Civil and Environmental Engineering, 215 McLaughlin Hall, University of California, Berkeley, California 94720-1712, USA * Corresponding author ( hor [email protected] .edu) Conclusion. Recycling water was found to be more energy in- tensive in Northern than in Southern California, but the results for imported water were similar. While the energy demand of water recycling was found to be larger than importation in Northern California, the two alternatives were competitive in Southern California. For all alternatives in both case studies, the energy consumed by system operation dominated the re- sults, but maintenance was also found to be significant. Energy production was found to be the largest contributor in all water provision systems, followed by materials production. The as- sessment of external costs revealed that the environmental ef- fects of energy and air emissions caused by infrastructure is measurable, and in some cases, significant relative to the eco- nomic cost of water. Recommendation and Perspective. This paper advocates the ne- cessity of LCA in water planning, and discusses the applicabil- ity of the described model to water utilities. Keywords: Decision support; desalination; hybrid approaches; life cycle energy assessment; recycled water; water reuse; wa- ter supply DOI: http://dx.doi.org/10.1065/lca2005.06.214 Abstract Goal, Scope and Background. This paper discusses the merging of methodological aspects of two known methods into a hybrid form applied to water supply systems. Water shortages are im- minent due to scarce supply and increasing demand in many parts of the world. In California, this is caused primarily by population growth. As readily available water is depleted, al- ternatives that may have larger energy and resource require- ments and, therefore, environmental impacts must be consid- ered. In order to develop a more environmentally responsible and sustainable water supply system, these environmental im- plications should be incorporated into planning decisions. Methods. Comprehensive accounting for environmental effects requires Life Cycle Assessment (LCA), a systematic account of resource use and environmental emissions caused by extracting raw materials, manufacturing, constructing, operating, main- taining, and decommissioning the water infrastructure. In this study, a hybrid LCA approach, combining elements of process- based and economic input-output-based LCA was used to com- pare three supply alternatives: importing, recycling, and desalin- ating water. For all three options, energy use and air emissions associated with energy generation, vehicle and equipment op- eration, and material production were quantified for life-cy- cle phases and water supply functions (supply, treatment, and distribution). The Water-Energy Sustainability Tool was de- veloped to inform water planning decisions. It was used to evaluate the systems of a Northern and a Southern California water utility. Results and Discussion. The results showed that for the two case study utilities desalination had 2–5 times larger energy de- mand and caused 2–18 times more emissions than importation or recycling, due primarily to the energy-intensity of the treat- ment process. The operation life-cycle phase created the most energy consumption with 56% to 90% for all sources and case studies. For each water source, a different life-cycle phase domi- nated energy consumption. For imported water, supply contrib- uted 56% and 86% of the results for each case study; for desalination, treatment accounted for approximately 85%; for recycled water, distribution dominated with 61% and 74% of energy use. The study calculated external costs of air pollution from all three water supply systems. These costs are borne by society, but not paid by producers. The external costs were found to be 6% of desalinated water production costs for both case studies, 8% of imported water production costs in Southern California, and 1–2% for the recycled water systems and for the Northern California utility's imported water system. Introduction This paper discusses the merging of methodological aspects of two known methods into a hybrid form applied to water supply systems. Growing water demand and shrinking water supply are driv- ing the need for new water sources in many parts of the world. Rapid population growth, especially where little rain falls, will dramatically increase water demand. For exam- ple, California is expected to experience a significant short- age by 2010 without changes to the existing water provi- sion system. Over six trillion liters of water are provided for urban use each year in the state. A report from the U.S. Department of Interior indicates that a water supply crisis is somewhat or highly likely for many urban coastal areas of California [1]. To prevent such a crisis, the California Ur- ban Water Management Plan (UWMP) Act requires water utilities to plan their water supply sources for 20 years in the future [2]. The water utilities are required to submit their next 20-year plans in 2005. Three different water supply sources are frequently considered for future water supply by California utilities as well as in many coastal areas of the world: importing, desalinating, and recycling water. The U.S. government is encouraging development of desalinated wa- ter supply to meet demand despite the energy-intensity of this alternative [1]. The decisions made for each utility's
-
Upload
jennifer-stokes -
Category
Documents
-
view
213 -
download
1
Transcript of Life Cycle Energy Assessment of Alternative Water Supply Systems (9 pp)
LCA Methodology and Case Study Alternative Water Supply Systems
335© 2006 ecomed publishers (Verlagsgruppe Hüthig Jehle Rehm GmbH), D-86899 Landsberg and Tokyo • Mumbai • Seoul • Melbourne • ParisInt J LCA 1111111111 (5) 335 – 343 (2006)
LCA Methodology and Case Study
Life Cycle Energy Assessment of Alternative Water Supply SystemsJennifer Stokes and Arpad Horvath*
Department of Civil and Environmental Engineering, 215 McLaughlin Hall, University of California, Berkeley, California 94720-1712, USA
* Corresponding author ([email protected])
Conclusion. Recycling water was found to be more energy in-tensive in Northern than in Southern California, but the resultsfor imported water were similar. While the energy demand ofwater recycling was found to be larger than importation inNorthern California, the two alternatives were competitive inSouthern California. For all alternatives in both case studies,the energy consumed by system operation dominated the re-sults, but maintenance was also found to be significant. Energyproduction was found to be the largest contributor in all waterprovision systems, followed by materials production. The as-sessment of external costs revealed that the environmental ef-fects of energy and air emissions caused by infrastructure ismeasurable, and in some cases, significant relative to the eco-nomic cost of water.
Recommendation and Perspective. This paper advocates the ne-cessity of LCA in water planning, and discusses the applicabil-ity of the described model to water utilities.
Keywords: Decision support; desalination; hybrid approaches;life cycle energy assessment; recycled water; water reuse; wa-ter supply
DOI: http://dx.doi.org/10.1065/lca2005.06.214
Abstract
Goal, Scope and Background. This paper discusses the mergingof methodological aspects of two known methods into a hybridform applied to water supply systems. Water shortages are im-minent due to scarce supply and increasing demand in manyparts of the world. In California, this is caused primarily bypopulation growth. As readily available water is depleted, al-ternatives that may have larger energy and resource require-ments and, therefore, environmental impacts must be consid-ered. In order to develop a more environmentally responsibleand sustainable water supply system, these environmental im-plications should be incorporated into planning decisions.
Methods. Comprehensive accounting for environmental effectsrequires Life Cycle Assessment (LCA), a systematic account ofresource use and environmental emissions caused by extractingraw materials, manufacturing, constructing, operating, main-taining, and decommissioning the water infrastructure. In thisstudy, a hybrid LCA approach, combining elements of process-based and economic input-output-based LCA was used to com-pare three supply alternatives: importing, recycling, and desalin-ating water. For all three options, energy use and air emissionsassociated with energy generation, vehicle and equipment op-eration, and material production were quantified for life-cy-cle phases and water supply functions (supply, treatment, anddistribution). The Water-Energy Sustainability Tool was de-veloped to inform water planning decisions. It was used toevaluate the systems of a Northern and a Southern Californiawater utility.
Results and Discussion. The results showed that for the twocase study utilities desalination had 2–5 times larger energy de-mand and caused 2–18 times more emissions than importationor recycling, due primarily to the energy-intensity of the treat-ment process. The operation life-cycle phase created the mostenergy consumption with 56% to 90% for all sources and casestudies. For each water source, a different life-cycle phase domi-nated energy consumption. For imported water, supply contrib-uted 56% and 86% of the results for each case study; fordesalination, treatment accounted for approximately 85%; forrecycled water, distribution dominated with 61% and 74% ofenergy use. The study calculated external costs of air pollutionfrom all three water supply systems. These costs are borne bysociety, but not paid by producers. The external costs were foundto be 6% of desalinated water production costs for both casestudies, 8% of imported water production costs in SouthernCalifornia, and 1–2% for the recycled water systems and forthe Northern California utility's imported water system.
Introduction
This paper discusses the merging of methodological aspectsof two known methods into a hybrid form applied to watersupply systems.
Growing water demand and shrinking water supply are driv-ing the need for new water sources in many parts of theworld. Rapid population growth, especially where little rainfalls, will dramatically increase water demand. For exam-ple, California is expected to experience a significant short-age by 2010 without changes to the existing water provi-sion system. Over six trillion liters of water are provided forurban use each year in the state. A report from the U.S.Department of Interior indicates that a water supply crisis issomewhat or highly likely for many urban coastal areas ofCalifornia [1]. To prevent such a crisis, the California Ur-ban Water Management Plan (UWMP) Act requires waterutilities to plan their water supply sources for 20 years inthe future [2]. The water utilities are required to submit theirnext 20-year plans in 2005. Three different water supplysources are frequently considered for future water supplyby California utilities as well as in many coastal areas of theworld: importing, desalinating, and recycling water. The U.S.government is encouraging development of desalinated wa-ter supply to meet demand despite the energy-intensity ofthis alternative [1]. The decisions made for each utility's
Alternative Water Supply Systems LCA Methodology and Case Study
336 Int J LCA 1111111111 (5) 2006
UWMP planning process will create systems which will havea service life of decades. Unfortunately, the comprehensiveenvironmental effects of these systems are typically notknown, rendering fully informed decision-making impossible.
To promote more sustainable water supply planning deci-sions, the authors created a model which quantifies mate-rial and energy inputs into water systems as well as environ-mental outputs. The model has been implemented in acomputer-based decision-support tool, the Water-EnergySustainabilty Tool (WEST), which assesses environmentaleffects of water utilities considering or currently using thesewater alternatives. The tool can be used by individual utili-ties, state-wide planners, and policy-makers to evaluate theenvironmental effects of their water supply decisions andincorporate those into the planning process [3].
Some environmental effects are not currently quantified byWEST. For instance, emissions to land and water are notconsidered. In addition, ecological effects are not included.These include the effects of brine disposal from desalinationand the effects of withdrawing water from the source ondownstream habitat and water quality as well as other envi-ronmental effects. These effects may be quantified in futureversions of WEST.
A strong connection exists between water provision andenergy consumption. Worldwide, 2–3% of energy consump-tion is used to pump and treat urban water [4]. In the U.S.,approximately 75 billion megawatt-hours, 3% of nationalelectricity consumption, was consumed for water and waste-water services. In the next 20 years, energy requirements forthese services are expected to grow by 33%. As readily-avail-able water sources are depleted, future supply options willlikely have higher energy requirements.
In addition, resource consumption and construction proc-esses will increase the negative environmental burden. OneGerman study estimated that urban infrastructure, includ-ing roads and water, sewer, and district heating pipelinesaccount for 10–20% of the total urban building mass; thevalue varies inversely with building density [5]. Because theinfrastructure in this country is aging, the U.S. Environmen-tal Protection Agency (EPA) has estimated that nationwidecapital spending to provide drinking water would have tobe $154–446 billion between 2000 and 2019 [6]. The mate-rials used and the construction processes needed to installthis infrastructure will increase the life-cycle environmentaleffects of these systems.
Increasingly, society is concerned about sustainability, in-cluding the effects of water systems. Recent publicationsdescribed the sustainability of recycled water systems [7]and the environmental effects of water and wastewater sys-tems in Sydney, Australia [8]. In addition, a pair of articlespresented an assessment of water supply choices in Spain[9,10]. The first article assesses desalination technologies anddetermines that without energy recovery, reverse osmosis(RO) is the preferable technology. When energy recovery isincluded, the alternatives are similar. The second article com-pares desalination using RO to importing water from theEbro River. The study concluded that, given the current stateof desalination technology, water transfers are preferable.
However, RO membrane efficiency improvements and elec-tricity generation emission reductions in the future couldalter the outcome. Furthermore, California's Santa ClaraValley Water District, along with other Silicon Valley indus-tries, announced plans to reduce greenhouse gas emissionsby 20% below the 1990 level by 2010 [11]. The informa-tion provided by WEST will inform the selection of moresustainable choices.
Several prior studies have been conducted which inform thecurrent research, including analyses of European and Aus-tralian water systems [8,12,13], as well as more focusedanalyses of water filtration alternatives [14], distributioninfrastructure [5,15], recycling plant energy use [16], anddisinfection practices [17].
1 Approach and Method
WEST uses Life Cycle Assessment (LCA), a systematic, quan-titative approach to evaluating the impacts of a product orprocess from 'cradle' to 'grave.' It considers all energy andenvironmental implications of processes through the entirelife-cycle, including design, planning, material extraction andproduction, manufacturing or construction, use, mainte-nance, and end-of-life fate of products (reuse, recycling, in-cineration, or landfilling) [18]. LCA targets resource use andenvironmental impact reduction efforts and allows wateragencies to properly plan their water supply choices.
LCA currently relies on two major approaches: process-basedLCA and economic input-output analysis-based LCA (EIO-LCA) [19]. The process-based LCA methodology has beendefined by the Society of Environmental Toxicology andChemistry (SETAC) [20,21], the EPA [22], and the Interna-tional Organization for Standardization (ISO) 14040 seriesstandards [23–25], and involves four main steps: goal andscope definition, inventory analysis, impact analysis, andimprovement analysis [26]. The basis for inventory modelingand data collection is a series of (typically man-made) proc-esses for all the life-cycle stages of involved products andservices. LCA is an iterative process, so an interpretation ofthe results occurs after each step. Impact analysis attemptsto determine the impacts of emissions and wastes on hu-mans and our environment (e.g., global warming potentialand human toxicity potential).
EIO-LCA is a matrix-based LCA approach [27] that utilizesthe U.S. economy's input-output tables as a general interde-pendency model that maps comprehensively the interactionsbetween all sectors of the economy, and identifies productand service supply chains. Economic data are combined withresource consumption and environmental emission and wastedata (e.g., energy use, toxic air emissions, hazardous waste).For a producer's expenditure in a given economic sector, themodel estimates how much is spent directly in that sector, aswell as in the supply chain, and calculates correspondingenvironmental emissions and wastes associated with thespecified expenditures. EIO-LCA has been applied to anumber of products and services (e.g., [28,29]).
To allow for most detailed and comprehensive analyses,WEST utilizes a hybrid LCA approach, incorporating ele-

LCA Methodology and Case Study Alternative Water Supply Systems
Int J LCA 1111111111 (5) 2006 337
ments from both process-based LCA and EIO-LCA. Gener-ally, WEST relies on EIO-LCA to determine the effects ofmaterial acquisition, transformation and production. EIO-LCA provides results for the entire material production sup-ply chain while minimizing time and data requirements nec-essary for the analysis. Process-based LCA is used to assessthe environmental effects of system construction and opera-tion to obtain process-specific results. This hybrid approachcombines the best of process-based LCA and EIO-LCA whileminimizing or eliminating the disadvantages of each.
2 Description of the WEST Decision-Support Tool
WEST is an MS-Excel-based decision-support tool that con-siders the materials provision, construction, operation, andmaintenance phases of the life-cycle of water supply sys-tems. Currently, the end-of-life phase is not included becauseprior studies have found it not to be a significant contribu-tor to the overall environmental burden (one study quanti-fied it as less than 1% [14]), but corresponding effects willbe added in the future.
Models have been developed to compare imported,desalinated, and recycled water. Importation and desalinationprovide potable water, while recycled water is a non-pota-ble source generally used for irrigation and commercial orindustrial applications. However, all three water sources arecompared on an equal basis by water planners because eachunit volume of recycled water offsets water needed for po-table use, and two-thirds of urban water consumption is innon-potable applications [30].
Emissions from four major activities are included in the tool:production of all material inputs into the system, material
delivery by truck, ship, train or urgent overnight delivery byairplane, equipment use for construction or maintenance ac-tivities, and production of electricity and fuels used in the sys-tem. The structure of WEST, including the data which mustbe entered into the tool by the user, is illustrated in Fig. 1.
A functional unit of 123 million liters of water delivered tothe customer was selected as the basis of comparison for thealternatives as it represents the approximate size of the small-est water supply component of typical systems (includingone of the case studies presented herein). The functionalunit is equivalent to 100 acre-feet; an acre-foot is a unit ofvolume used in water supply planning in the U.S. A timehorizon of 100 years was selected because of the expectedlife of major water supply components, such as dams andtreatment plants. Materials with shorter service lives (e.g.,pumps, filters, and valves) are assumed to be replaced eachtime their service life expires until the 100-year time hori-zon is achieved.
The construction phase includes emissions due to materialproduction for the initial construction and installation, op-eration of construction equipment and delivery vehicles, andproduction of electricity and fuel. Emissions from the con-struction phase were allocated proportionally to the unitvolume of water delivered to the customer given the timeframe of the analysis. The operation phase includes produc-tion and delivery of routinely used non-capital materials (e.g.,water treatment chemicals and bag filters), sludge disposal,and electricity and fuel production. The maintenance phaseincludes production and delivery of capital materials usedto maintain the system (e.g., replacement pumps, valves, andreverse osmosis membranes), emissions from maintenancevehicles, and electricity and fuel production.
Imported Recycled
Material Production Energy ProductionEquipment OperationMaterial Delivery
InputData
• Material type• Material value (1997$)• Service life (years)• Purchase frequency
(one time, annually, once per service life)
• Fuel use by delivery vehicles and equipment (gallons)
• Electricity use (kWh)
•Equipment type (e.g., excavator, dump truck, pick-up truck)
• Use amount (hours or miles)• Use frequency (annually or one time)
• Cargo weight (kg)• Deliveries per yearFor primary and
secondary transport-• Mode • Distance (mile)
Activity
ResultsandEmissionFactorSources
Desalinated
Construction Operation Maintenance
Supply DistributionTreatment
Energy Use, GWP, SOx, NOx, PM, VOC, CO
Energy Use, GWP, SOx, NOx, PM, VOC, CO
Electric, diesel or gasoline equipment- Energy Use, GWP, SOx, NOx, PM, VOC, COGasoline vehicle- Energy Use, GWP, NOx, PM, VOC, CODiesel vehicle- Energy Use, GWP, NOx, VOC, CO
Fuel production-Energy Use, GWP, SOx, NOx, PM, VOC, COElectricity production-Energy Use, GWP, SOx, NOx, CO
Water SupplyPhase
Life-cyclePhase
Water Source
Fig. 1: The Structure of WEST

Alternative Water Supply Systems LCA Methodology and Case Study
338 Int J LCA 1111111111 (5) 2006
Emissions were assigned to three water supply phases: sup-ply, treatment, and distribution. In most cases, the watersupply phase begins at the water source and includes theinfrastructure necessary to provide raw water to the treat-ment plant. The treatment phase includes all activities whichoccur at the treatment plant. Distribution consists of all in-frastructure needed to deliver treated water to customers(e.g., pipelines and pump stations).
Currently, WEST can assess energy consumption as well asthe emissions of greenhouse gases and the resulting globalwarming potential (GWP), nitrogen oxides (NOx), sulfuroxides (SOx), particulate matter (PM), volatile organic com-pounds (VOC), and carbon monoxide (CO). Energy use andemission factors for each pollutant and phase were calcu-lated. An example calculation for emissions of NOx fromthe tailpipe of a dump truck (model year: 2002) used totransport sludge routinely from a treatment plant to a landfilllocated 50 km away (100 km roundtrip) is given in Eq. 1.The values are normalized to the functional unit of 123 mil-lion liters using the annual water production of 10 billionliters for the treatment plant.
(1)
The results were translated into monetary terms using esti-mates of external costs of air emissions [31]. By monetizingthe results, different emissions can be compared on anequivalent basis. In the original study, external costs arereported in 1992 dollars. The values were converted to 1997dollars using a 2% discount rate. An example conversionto external costs for the NOx emissions calculated above isshown in Eq. 2.
unitfunctional
89.2$
gNO
00117.0$*
unitfunctional
gNOx2575
x= (2)
3 Case Studies
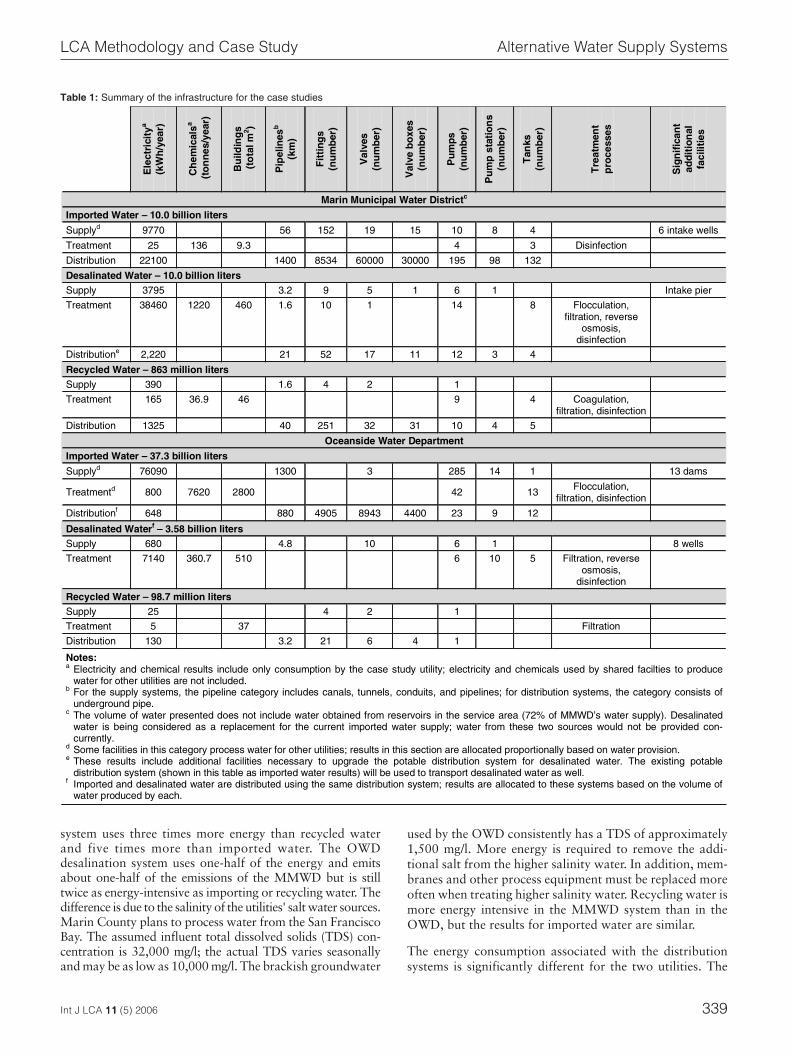
Two California water systems have been analyzed usingWEST. One utility, the Marin Municipal Water District(MMWD) is located in Marin County in Northern Califor-nia. The other, the Oceanside Water Department (OWD) isin San Diego County in Southern California. Both utilitiesserve a population of approximately 200,000 people andprovide a total of approximately 40 billion liters of watereach year. However, the climate in the two areas differs.Marin County receives 762 mm of rainfall annually whileOceanside receives only 254 mm. Table 1 provides addi-tional detail on the case study systems.
The information used in the analyses was obtained from acombination of published information from each utility (e.g.,[32–38]), site visits, and industry information (e.g., [39–43]).In both systems, some imported water infrastructure is used
to supply water to other utilities. In these cases, construc-tion and maintenance emissions are allocated to the casestudy utilities based on their average annual water provi-sion through the shared infrastructure. Some system com-ponents not specified in Table 1 were also analyzed (e.g.,instrumentation, controls, electrical equipment, and pipingin treatment plants).
The MMWD currently obtains most of its water from rain-fall (72%); this water is not included in the analysis. Theremaining water is supplied by importation (26%) and re-cycling (2%). The imported water is obtained from a pris-tine source approximately 32 km away, and is pumped overhilly terrain to the MMWD service area. The water is disin-fected and then pumped through a distribution system tothe customer. Due to the quality of the water source, noother treatment is needed. The recycled water is taken fromthe effluent of a wastewater treatment plant located in theservice area, filtered, disinfected, and provided to custom-ers. The water is not potable and is used for irrigation, com-mercial car washes, and similar purposes.
Due to reliability and environmental concerns, the MMWDis considering replacing imported water with desalinatedwater. The desalination system, as planned, would drawwater from the San Francisco Bay and treat it through areverse osmosis process. The treated water would then bedistributed using the existing potable water distribution sys-tem; however, additional pipelines, storage tanks, and pumpstations would be constructed to connect the desalinationplant to the existing system.
The OWD imports 92% of its water from the ColoradoRiver and the Sacramento-San Joaquin River Delta, sourceslocated hundreds of miles from the service area. Before be-ing delivered to the consumer, water is treated by a conven-tional treatment process which typically includes coagula-tion, flocculation, filtration, and disinfection. The utilityprovides almost 8% of its water supply by using an ROprocess to desalinate brackish groundwater. The remainingwater (less than 1% of total water production) comes froma recycled water plant which filters effluent from a waste-water treatment plant. Recycled water is sold to providewater for irrigation.
4 Results
Table 2 shows emission and energy use factors for all life-cycle and water supply phases for both case studies. Theemission factors for the desalination system are the largestfor all analyzed substances. In both cases, VOC emissionsfrom desalination systems are over 14 times larger than fromthe imported water systems and 16 to 18 times larger thanfrom the recycled water systems. The increased VOC emis-sions are due mainly to the production of RO membranes.For the other substances, desalination produces 2 to 7 timesmore emissions than the other alternatives.
Energy use is the largest for the desalination systems, par-ticularly in the operation life-cycle phase and the treatmentwater supply phase, primarily on the account of the ROsystems in place. Producing desalinated water in the MMWD
LCA Methodology and Case Study Alternative Water Supply Systems
Int J LCA 1111111111 (5) 2006 339
system uses three times more energy than recycled waterand five times more than imported water. The OWDdesalination system uses one-half of the energy and emitsabout one-half of the emissions of the MMWD but is stilltwice as energy-intensive as importing or recycling water. Thedifference is due to the salinity of the utilities' salt water sources.Marin County plans to process water from the San FranciscoBay. The assumed influent total dissolved solids (TDS) con-centration is 32,000 mg/l; the actual TDS varies seasonallyand may be as low as 10,000 mg/l. The brackish groundwater
used by the OWD consistently has a TDS of approximately1,500 mg/l. More energy is required to remove the addi-tional salt from the higher salinity water. In addition, mem-branes and other process equipment must be replaced moreoften when treating higher salinity water. Recycling water ismore energy intensive in the MMWD system than in theOWD, but the results for imported water are similar.
The energy consumption associated with the distributionsystems is significantly different for the two utilities. The
E
lect
rici
tya
(kW
h/y
ear)
Ch
emic
alsa
(to
nn
es/y
ear)
Bu
ildin
gs
(
tota
l m2 )
Pip
elin
esb
(km
)
Fit
ting
s (n
um
ber
)
Val
ves
(nu
mb
er)
Val
ve b
oxe
s (n
um
ber
)
Pu
mps
(n
um
ber
)
Pu
mp
sta
tio
ns
(nu
mb
er)
Tan
ks
(nu
mb
er)
Tre
atm
ent
pro
cess
es
Sig
nif
ican
t ad
dit
ion
al
faci
litie
s
Marin Municipal Water Districtc
Imported Water – 10.0 billion liters
Supplyd 9770 56 152 19 15 10 8 4 6 intake wells
Treatment 25 136 9.3 4 3 Disinfection
Distribution 22100 1400 8534 60000 30000 195 98 132
Desalinated Water – 10.0 billion liters Supply 3795 3.2 9 5 1 6 1 Intake pier
Treatment 38460 1220 460 1.6 10 1 14 8 Flocculation, filtration, reverse
osmosis, disinfection
Distributione 2,220 21 52 17 11 12 3 4
Recycled Water – 863 million liters Supply 390 1.6 4 2 1
Treatment 165 36.9 46 9 4 Coagulation, filtration, disinfection
Distribution 1325 40 251 32 31 10 4 5
Oceanside Water Department
Imported Water – 37.3 billion liters
Supplyd 76090 1300 3 285 14 1 13 dams
Treatmentd 800 7620 2800 42 13 Flocculation, filtration, disinfection
Distributionf 648 880 4905 8943 4400 23 9 12
Desalinated Waterf – 3.58 billion liters Supply 680 4.8 10 6 1 8 wells
Treatment 7140 360.7 510 6 10 5 Filtration, reverse osmosis,
disinfection
Recycled Water – 98.7 million liters Supply 25 4 2 1
Treatment 5 37 Filtration
Distribution 130 3.2 21 6 4 1
Notes: a Electricity and chemical results include only consumption by the case study utility; electricity and chemicals used by shared facilties to produce
water for other utilities are not included. b For the supply systems, the pipeline category includes canals, tunnels, conduits, and pipelines; for distribution systems, the category consists of
underground pipe. c The volume of water presented does not include water obtained from reservoirs in the service area (72% of MMWD’s water supply). Desalinated
water is being considered as a replacement for the current imported water supply; water from these two sources would not be provided con-currently.
d Some facilities in this category process water for other utilities; results in this section are allocated proportionally based on water provision. e These results include additional facilities necessary to upgrade the potable distribution system for desalinated water. The existing potable
distribution system (shown in this table as imported water results) will be used to transport desalinated water as well. f Imported and desalinated water are distributed using the same distribution system; results are allocated to these systems based on the volume of
water produced by each.
Table 1: Summary of the infrastructure for the case studies

Alternative Water Supply Systems LCA Methodology and Case Study
340 Int J LCA 1111111111 (5) 2006
OWD distribution system is designed so most water is dis-tributed by gravity, whereas the MMWD must rely on sig-nificant pumping. Furthermore, the MMWD system requiresadditional construction to connect the desalination plant tothe existing distribution system while the OWD system usesonly the existing infrastructure. Both factors contribute tothe MMWD's higher energy use in the distribution phase.
In addition, Table 2 shows GWP normalized by length ofsupply aqueducts and distribution pipelines for comparison.Though operation phase results vary directly with the vol-ume of water processed, the emission factors for the con-struction and maintenance phases should reveal how thesystems are affected by economies of scale. For instance,construction and maintenance for the imported water sup-ply systems of both utilities have lower emission factors thanthe corresponding factors for the smaller desalinated andrecycled water supply systems. The emission factors for con-struction and operation of the distribution portion of therecycled water systems are larger than for imported anddesalinated water: the separate distribution system for recy-cled water is used only for non-potable water and thereforeis much smaller. The imported and desalinated water distri-bution systems have similar emissions because they use thesame potable water distribution system.
Fig. 2 shows the graphical comparison of the GWP of thetwo utilities in units of carbon dioxide equivalents (CO2 eq.)per functional unit. The comparison of GWP emissions by
case study and water source mirrors the results for energyconsumption. For the MMWD, desalination produces al-most three times more GWP than recycled water and fivetimes more than imported water. In the OWD system,desalination creates twice the GWP of recycling or import-ing water. Desalination in the MMWD has twice the GWPcompared to the OWD because the salinity of the influentwater is different as previously discussed. Recycling wateris also twice as GWP intensive in the MMWD. For the twosystems, the results for imported water are similar.
Fig. 2a highlights the contribution of each life-cycle phaseto the final GWP results. Operation is consistently the domi-nant phase, followed by the maintenance phase. Operationcomprises 60% to 91% of the total GWP result for all phases.The maintenance phase accounts for 5% to 36% of the to-tal GWP. Construction causes 4% to 9% of the total results.Desalination system maintenance is higher than for the othersources (36% and 28% in the MMWD and the OWD sys-tems, respectively) because the treatment process includesmore components which must be replaced regularly (e.g.,RO membranes, cartridge filters). The MMWD GWP con-tribution is larger because components from a seawaterdesalination system will be replaced more frequently thatfor a brackish water system due to additional wear causedby higher salinity. Maintenance of the MMWD importedwater system is also relatively high (24%) because of thecomplex distribution system.
Table 2: Emission factors for water supply systems
Emission Factors (Mg/functional unit)
Import Desalinate Recycle MMWD OWD MMWD OWD MMWD OWD
GWP 60 75 290 145 112 67
SOx 0.10 0.05 0.58 0.25 0.08 0.04
NOx 0.11 0.10 0.61 0.28 0.14 0.08
PM 0.02 0.01 0.09 0.04 0.02 0.01
VOC 0.02 0.01 0.28 0.12 0.02 0.01
CO 0.16 0.10 0.53 0.23 0.13 0.08
Energy Use Factors by Life-cycle Phase (GJ/functional unit) Construction 73 40 163 82 65 38
Operation 508 840 2192 1249 1022 765
Maintenance 207 62 1528 640 130 48
Energy Use Factors by Water Supply Phase (GJ/functional unit) Supply 442 811 186 127 205 122
Treatment 12 29 3247 1742 259 100
Distribution 334 102 450 102 753 629
GWP Factors by Life-cycle Phase for Supply System (Mg CO2 eq./functional unit/pipe mile) Construction 0.02 0.01 0.33 0.13 0.21 1.6
Operation 2.4 5.1 6.8 3.0 34 95
Maintenance 0.01 0.003 0.32 0.17 0.41 5.5
GWP Factors by Life-cycle Phase for Distribution System (Mg CO2 eq./functional unit/pipe mile) Construction 0.02 0.005 0.02 0.005 0.13 0.75
Operation 0.02 0.001 0.05 0.001 2.17 23
Maintenance 0.07 0.01 0.06 0.01 0.07 0.84
Note: The functional unit is equivalent to 123 million liters.

LCA Methodology and Case Study Alternative Water Supply Systems
Int J LCA 1111111111 (5) 2006 341
For imported water, the effects of construction and mainte-nance are smaller for the OWD due to economies of scale:the supply system provides water to the entire SouthernCalifornia region so the effects are widely distributed. Recy-cled water results are also smaller for the construction andmaintenance phases in the OWD case study but for a differ-ent reason. In this case, the OWD recycling system is sim-pler and requires fewer routine inputs such as chemicals.The OWD process only filters water; the MMWD systemfilters and disinfects.
Fig. 2b shows that treatment is not a significant contributor tothe imported water system for either case, especially for theMMWD which uses a simpler treatment process. For bothcase studies, treatment contributes less than 5% to overallGWP. However, it is the largest contributor to the desalinationemissions in both Marin County and Oceanside due to theenergy intensity of RO systems. Treatment creates 83% of theMMWD's GWP and 88% of the OWD’s GWP. The MMWDattributes 12% of its GWP to the distribution phase; the OWDonly 5%. In addition to higher energy requirements for pump-
ing, the MMWD system requires additional distribution in-frastructure to be used solely for desalinated water but theOWD requires no additional piping.
Distribution is the largest GWP contributor to both recy-cled water systems accounting for 53% for the MMWD and74% for the OWD. The recycling plants are located nearthe wastewater treatment plants which provide their water,minimizing the supply phase impacts. They have relativelysimple treatment processes (i.e., filtration and disinfectionat the MMWD [32% of emissions] and filtration only at theOWD [12% of emissions]). However, wastewater treatmentplants tend to be located at lower elevations to minimizeenergy necessary to collect sewage; therefore, distributingrecycled water tends to require significant pumping.
Fig. 2c provides the results as contributed by each of thefour considered activities: material production, material de-livery, equipment use, and energy production. In all cases,energy production is the largest contributing activity, com-prising 56% to 69% of the total GWP. Material productionis also a significant contributor and accounts for 30% to44% of the result. Material production is most significantfor desalination because the treatment process has morecomponents requiring routine replacement. In all cases,material delivery and equipment use are negligible, contribut-ing less that 0.6% to the overall emissions.
Fig. 3 shows median external cost estimates associated withthe evaluated air emissions for each case. The majority ofthe external costs in all cases are caused by GWP (61–79%of total external costs), but NOx and SOx are also importantcontributors (7–16% each). For the OWD, the external costsassociated with imported water are 8% of the productioncosts. Desalination external costs are 6% of water produc-tion costs for both case studies. External costs for the recy-cled water systems and for the MMWD imported water sys-tem are 1–2% of production costs. External costs are borneby society, but not paid by producers or reflected in typicalagency accounting systems. These cost percentages suggestthat to internalize the environmental externalities of thesewater supply options and introduce full-cost pricing, the priceof water should be higher.
a) Global Warming Potential of Water Supply Alternatives by Life-cycle Phase
b) Global Warming Potential of Water Supply Alternatives by Water Supply Phase
c) Global Warming Potential of Water Supply Alternatives by Activity
0
50
100
150
200
250
300
MMWD OWD MMWD OWD MMWD OWD
Import Desalinate RecycleMg
CO
2 eq.
per
func
tiona
l uni
t of w
ater
Maintenance
Operation
Construction
0
50
100
150
200
250
300
MMWD OWD MMWD OWD MMWD OWD
Import Desalinate RecycleMg
CO
2 eq.
per
func
tiona
l uni
t of w
ater
Distribution
Treatment
Supply
0
50
100
150
200
250
300
MM
WD
OW
D
MM
WD
OW
D
MM
WD
OW
D
Imported Desalinated Recycled
Mg
CO
2 eq
. p
er f
un
ctio
nal
un
it o
f w
ater
EnergyProduction
EquipmentUse
MaterialDelivery
MaterialProduction
Fig. 2: Global warming potential results
$0$1$2$3$4$5$6$7$8$9
$10
MMWD OWD MMWD OWD MMWD OWD
Import Desalinate Recycle
To
tal
Co
st p
er f
un
ctio
nal
un
it
NOTE: The functional unit is equivalent to 123 million liters.
Fig. 3: Median estimate of external costs of air emissions from water Pro-duction

Alternative Water Supply Systems LCA Methodology and Case Study
342 Int J LCA 1111111111 (5) 2006
5 Uncertainty and Sensitivity
Sources for uncertainty in the used parameters include theservice life of component parts, material costs, emission fac-tors, and environmental valuation estimates. In addition, theresults are affected by future events, including technologicaland efficiency improvements in the desalination process, andchanges in the energy mix.
Sensitivity analyses were conducted to determine how vari-ations in critical parameters would affect the results. In oneanalysis, the results were reevaluated after the service livesfor all capital components were multiplied by 150%, reduc-ing component replacement frequency. This sensitivity analy-sis was conducted using the MMWD system data. The in-creased service life reduced the effects of the constructionand maintenance phases by between 7% and 82%. The ef-fects in the construction phase were reduced by approxi-mately 30% for all substances, supply phases, and sources,with the exception of desalination treatment. Desalinationtreatment emissions changed only 3% to 11% because thesystem is composed of fewer materials with long service lives(greater than 75 years). The maintenance phase reductionswere more significant (62–82%) due to repeated purchasesof certain components (e.g., pumps, valves, fittings).Desalination treatment is again the exception (1–8% reduc-tions) for the previously mentioned reasons. The operationphase was unaffected because it almost exclusively includesmaterials which are consumed immediately (e.g., chemicals)and therefore are not assigned service lives.
The energy mix also affects the results. For example, usingemission factors for Florida, another state where similarwater sources are considered, will increase emissions causedby electricity production by a factor of 2 for GWP, 6 forNOx, and more than 30 for SOx. The energy mix is the solereason for the difference. California's electricity mix con-sists primarily of natural gas (48.7%), nuclear power(18.6%), hydropower (16.8%), and renewables (12.9%)[44]. Coal, a fuel that typically produces higher emissions,comprises only 1.3% of production. Florida obtains 25.7%of electricity from coal plants and 43.8% from dual-firedplants (combination of coal, natural gas, and petroleum).
6 Conclusions
The results of this analysis indicate that the needs of theend-user should be evaluated in the planning process. Recy-cled water is more environmentally benign than desalinationand should be pursued if customers can be found to use thenon-potable water. Future analyses should evaluate the ef-fects of putting separate piping systems in newly-constructedfacilities so recycled water can be used for toilet-flushing,landscaping, and similar uses. This information would helpattract and prioritize potential recycled water customers.
The results also show that the emphasis on desalination sys-tems may not be the most sustainable decision as the envi-ronmental burden associated with these systems is signifi-cant. However, it is important to note that the assessmentassumes the use of current desalination technology. Becausethe RO process is an emerging technology, the membranes
can be expected to become more efficient as the technologyimproves. If the membranes become more durable and theRO process uses less energy, the environmental effects ofdesalination may decrease.
Energy efficiency may make brackish water desalinationcompetitive with other water sources. For the OWD sys-tem, if energy consumption by the RO treatment processwere reduced by 70%, desalinated and imported water wouldbe equivalent in terms of GWP. However, for the MMWDsystem, energy consumption cannot be reduced enough inthe operations phase to make desalination competitive withimported water; energy reductions would have to be madethroughout the life-cycle, including the energy required toproduce the membranes and other system components. Life-cycle energy consumption must be reduced by 75% for theMMWD system and 45% for the OWD system to achieveimported water GWP levels.
The results suggest that externalities due to life-cycle effectsshould be considered in future water supply decisions. Thecosts associated with externalities add 1–8% to the produc-tion costs of water. If other environmental effects (e.g., habitatloss due to withdrawing water) were evaluated, the signifi-cance of external costs would increase further. Because sys-tems constructed today will be in place for decades, under-standing the sources and effects of these externalities is critical.
6.1 Application to other water utilities
Results for similar water systems will be affected by site-specific issues including topography, process design, loca-tion, distance to water sources, climate, scale, and other fac-tors. However, the OWD imported water supply results willbe fairly consistent with other Southern California utilitiesthat primarily use water from the Colorado River and theSan Joaquin Delta. In fact, the Metropolitan Water Districtof Southern California sold almost 500 billion liters to theSan Diego County Water Authority (SDCWA) in 1998, ap-proximately 7% of that volume was sold to the OWD [37].Taking the volume of water provided as typical, supplyingwater to this area without accounting for treatment and dis-tribution consumes over 900,000 MWh, or 1.8% of Cali-fornia's 2002 net electricity generation [44]. If the OWD’streatment and distribution systems are typical of other South-ern California utilities, treated water provision to the regionconsumes 2% of California's 2002 electricity generation.
Two factors contributed to the difficulties in data collectionand potentially to data quality issues: security concerns thatprevented full disclosure, and lack of data collection by utili-ties. Security concerns affected the detail of informationabout water systems. A more significant limitation was lackof data collection by utilities. In certain cases electricity con-sumption data were available only on a systemwide basis.Assumptions were necessary to allocate energy consump-tion among the components of the systems. For both casestudies, detailed information on the recycled water systemwas not available and assumptions had to be made. Morespecific information would improve the quality of the re-sults by reducing the uncertainty in the input data.
LCA Methodology and Case Study Alternative Water Supply Systems
Int J LCA 1111111111 (5) 2006 343
6.2 Future work
This assessment of the environmental effects of water sys-tems will be improved and extended in the future. WESTwill be refined to include other emissions and impact assess-ments. For example, emissions to water or land could beincorporated, and results could be evaluated to determinetheir human or ecosystem toxicity potential. The tool willbe extended to assess alternative infrastructure choices (e.g.,steel versus concrete water storage tanks, iron versus plasticpipe). Given that hundreds of billions of dollars will have tobe spent on water system infrastructure in the next decades,the environmental effects of investments could be consider-able and should be minimized.
Water supply decisions are made based on several criteria,including economic, political, social, and reliability concerns.Previously, the comprehensive and systemwide life-cycleenvironmental effects associated with the water infrastructurehave not been a factor in these decisions. The model and WESTwill allow utilities and other planners to incorporate these ef-fects into their decision-making process and, with more in-formed analyses, strive for sustainable solutions.
Acknowledgments. The authors would like to thank the National Sci-ence Foundation's Graduate Research Fellowship program, the Uni-versity of California Toxic Substances Research and Training Program,and the California Energy Commission's Public Interest Energy Re-search program for their financial support. We thank the Marin Munici-pal Water District, the Sonoma County Water Agency, the North MarinWater District, the City of Oceanside Water Department, the San Di-ego County Water Authority, and the Metropolitan Water District ofSouthern California for providing data and information.
References
[1] USBR (2003): Water 2025 – Preventing Crises and Conflict in the West.US Bureau of Reclamation, Washington, DC
[2] California Assembly (1990): Urban Water Management Plan Act, Cali-fornia Assembly Bill 2661
[3] Stokes J (2004): Life Cycle Assessment of Alternative Water SupplySystems in California. Unpublished Ph.D. Dissertation. University ofCalifornia, Berkeley
[4] ASE (2002): Watergy: Taking Advantage of Untapped Energy and Wa-ter Efficiency Opportunities in Municipal Water Systems. Alliance toSave Energy/ US Agency for International Development
[5] Herz R, Lipkow A (2002): Life Cycle Assessment of Water Mains andSewers. Water Sci Technol: Water Supply 2 (4) 51–72
[6] EPA (2002): Clean Water and Drinking Water Infrastructure Gap Analy-sis. US Environmental Protection Agency
[7] Levine A, Asano T (2004): Recovering Sustainable Water fromWastewater. Environ Sci Technol 38 (11) 201A–208A
[8] Lundie S, Peters, GM, Beavis PC (2004): Life Cycle Assessment of Sus-tainable Metropolitan Water Systems Planning. Environ Sci Technol38 (13) 3465–3473
[9] Raluy, RG, Serra L, Uche J (2004): Life Cycle Assessment of WaterProduction Technologies Part 1. Int J LCA OnlineFirst, September 29<DOI: http://dx.doi.org/10.1065/lca2004.09.179.1>
[10] Raluy RG, Serra L, Uche J, Valero A (2004): Life Cycle Assessment ofWater Production Technologies Part 2. Int J LCA OnlineFirst, Septem-ber 29 <DOI: http://dx.doi.org/10.1065/lca2004.09.179.2>
[11] Rogers P (2004): Valley Firms to Fight Global Warming. The MercuryNews, San Jose, March 29
[12] van Tilburg J, Nieuwlaar E, Geerts, J (1997): Environmental Analysis forChoosing between a Single or Double Domestic Water Supply. 5th LCACase Studies Symposium, SETAC Europe: Brussels, Belgium, pp 213–220
[13] Crettaz P, Jolliet O, Cuanillon JM, Orlando S (1999): Life Cycle As-sessment for Drinking Water and Rain Water for Toilets Flushing. Aqua48 (3) 78–83
[14] Friedrich E (2002): Life Cycle Assessment as an Environmental Man-agement Tool in the Production of Potable Water. Water Sci Technol46 (9) 29–36
[15] Filion Y (2003): New York City Primary Water Supply System: NetEnergy Expenditure Analysis of Long-term Management Strategies.University of Toronto, Department of Civil and Environmental Engi-neering, Technical Report
[16] Hermanowicz S, Diaz E, Coe J (2001): Prospects, Problems, and Pitfallsof Urban Water Reuse: A Case Study. Water Sci Technol 43 (10) 9–16
[17] Das T (2002): Evaluating the Life-cycle Environmental Performanceof Chlorine Disinfection and Ultraviolet Technologies. Clean Technolo-gies and Environmental Policies 4, 32–43
[18] Curran MA (ed) (1996): Environmental Life Cycle Assessment. Mc-Graw-Hill, New York
[19] CMU (2004): Economic Input-Output LCA. Carnegie Mellon University,Green Design Inititive. <http://www.eiolca.net> (Accessed March 2004)
[20] SETAC (1991): A Technical Framework for Life Cycle Assessment.Society of Environmental Toxicology and Chemistry Workshop Re-port: Smugglers Notch, Vermont
[21] SETAC (1993): Guidelines for Life Cycle Assessment: A Code of Prac-tice. Society of Environmental Toxicology and Chemistry, Sesimbra,Portugal
[22] Vigon BW (1993): Life Cycle Assessment: Inventory Guidelines andPrinciples. US Environmental Protection Agency, Cincinnati, Ohio
[23] ISO (1997): Environmental Management – Life Cycle Assessment –General Principles and Framework. International Organization forStandardization
[24] ISO (1998): Environmental Management – Life Cycle Assessment –Goal and Scope Definition – Inventory Analysis. International Organi-zation for Standardization
[25] ISO (2004): ISO 14000. International Organization for Standardiza-tion. <http://www.iso.ch/iso/en/iso9000-14000/iso14000/iso14000index.html> (Accessed March 2004)
[26] Graedel TE, Allenby BR (2003): Industrial Ecology; 2nd ed. PrenticeHall, Upper Saddle River, NJ
[27] Hendrickson C, Horvath A, Joshi S, Lave L (1998): Economic Input-Output Models for Environmental Life Cycle Assessment. Environ SciTechnol 32 (4) 184A
[28] Toffel MW, Horvath A (2004): Environmental Implications of Wire-less Technologies: News Delivery and Business Meetings. Environ SciTechnol 38 (11) 2961–2970
[29] Pacca S, Horvath A (2002): Greenhouse Gas Emissions from Buildingand Operating Electric Power Plants in the Upper Colorado River Ba-sin. Environ Sci Technol 36 (14) 3194–3200
[30] Okun DA (1997): Distributing Reclaimed Water through Dual Sys-tems. J AWWA 89 (11) 13
[31] Matthews HS, Hendrickson C, Horvath A (2001): Applications of En-vironmental Valuation for Determining Externality Costs. J of Infra-structure Sys 7 (1) 111–117
[32] MMWD (1990): Why Desalination May be Our Best Water SupplyOption. Marin Municipal Water District
[33] MMWD (1995): Urban Water Management Plan. Marin MunicipalWater District
[34] MMWD (2003): Draft Urban Water Management Plan 2000. MarinMunicipal Water District
[35] MWD (1996): Integrated Water Resources Plan. Metropolitan WaterDistrict of Southern California
[36] MWD (2000): Regional Urban Water Management Plan. Metropoli-tan Water District of Southern California
[37] SDCWA (2000): Urban Water Management Plan. San Diego CountyWater Authority
[38] OWD (2001): Urban Water Management Plan. City of Oceanside Wa-ter Utilities Department
[39] Means RS (1997): Heavy Construction Cost Data, 12th ed. Kingston, MA[40] Mays L (1999): American Water Works Association. Water Distribu-
tion Systems Handbook. McGraw-Hill, New York[41] American Society of Civil Engineers, American Water Works Association
(1998): Water Treatment Plant Design 3rd ed. McGraw-Hill: New York[42] Nayyar M (2002): Piping Databook. McGraw-Hill, New York[43] Peters M, Timmerhaus K, West R (2003): Plant Design and Economics
for Chemical Engineers 5th ed. McGraw-Hill, New York[44] DOE (2004): State Electricity Profiles. US Department of Energy, En-
ergy Information Administration. <http://www.eia.doe.gov/cneaf/elec-tricity/st_profiles/toc.html> (Accessed July 8, 2004)
Received: January 14th, 2005Accepted: June 9th, 2005
OnlineFirst: June 10th, 2005