
LIFE CYCLE ASSESSMENT OF RICE PROCESSING 2: Process flow diagram of rice mills The resource...
8
LIFE CYCLE ASSESSMENT OF RICE PROCESSING S. Kamalakkannan Department of Manufacturing & Industrial Engineering Faculty of Engineering University of Peradeniya [email protected] Asela K. Kulatunga Department of Manufacturing & Industrial Engineering Faculty of Engineering University of Peradeniya [email protected] Abstract Rice is the staple food in Sri Lanka. The impact of the rice mills to the environment is considerable issue currently. The rice production process consumes energy, water, bio mass and other environmental resources and adds air and solid emissions, effluent and wastages back to environment which cause environmental impacts. It is very clear to understand that the large amount of energy consumption, waste water and solid waste to the environment and the very large capacity machines and engines used by the mills are the causes behind the issue. Therefore, the total environmental effect of each and every step in the life cycle of the production process needs to be considered in order to identify the most environmental friendly rice production method. Mainly the parboiling and polishing processes are associated with harmful environment discharge such as emission to air, fossil fuel and affect the natural resources. Therefore, proper environmental management practices need to be sustained in the rice production industry. The objective of the research is to evaluate the environmental impact through the life cycle of rice production in Sri Lanka. Based on LCA approach (ISO 14040 series), the environmental impacts by the rice industry was analyzed. The impacts on environment was assessed through “SimaPro” software. The results interpreted that the most harmful processes among the rice production are the parboiling and polishing process. Keywords: Rice Processing, Life cycle assessment, Environmental impact 1. Introduction Rice has a long history in Sri Lanka and south east Asia. Its importance goes far beyond its status as a primary food source in this island nation. Synonymously, rice plays an important role in the country's cultural identity, tradition, and politics. The estimated paddy production for 2015/2016 Maha season was 2,902,693 MT. The highest production was reported from Anuradhapura District about 13% of the country. The contribution to the national paddy production from Ampara, Kurunegala and Polonnaruwa Districts were recorded as 12%, 11% and 10% respectively ( Paddy statistics 2015/2016 Maha season). For 2015 Yala season was 1942408MT. The highest production was reported from Ampara District about 16%. The contribution to the national paddy production from Pollonnaruwa, Kurunegala and Anuradhapura districts were recorded as 14%, 11% and 10% respectively (Paddy statistics 2015 Yala Season). There are two major types of rice: raw and parboiled. Approximately 70% of produced rice is going through the parboiling process in Sri Lanka (Ariyarathna et al., 2016). Parboiled rice has been soaked, steamed, and dried before the milling process. Parboiled rice does not take as long as raw rice cooking-wise, because it has been partially pre- cooked already. The parboiled rice may cook in one-third the time needed to cook raw rice (Goyal et al., 2012). The rice production process consumes energy, water, bio mass and other environmental resources and adds air and solid emissions, effluent and wastages back to environment which causes heavy environmental impacts (Nadeeshani, 2015). The environmental impact of each paddy varies depending on water management, usage of pesticide, and intensity of production. Paddy cultivation has atmospheric impacts. Paddy fields produce methane that is a powerful greenhouse gas (Gathorne-Hardy et al., 2013). Regarding atmospheric emissions, the environmental impact was lower for raw 3417
Transcript of LIFE CYCLE ASSESSMENT OF RICE PROCESSING 2: Process flow diagram of rice mills The resource...
LIFE CYCLE ASSESSMENT OF RICE PROCESSING
S. KamalakkannanDepartment of Manufacturing & Industrial Engineering
Faculty of Engineering
University of Peradeniya
Asela K. Kulatunga Department of Manufacturing & Industrial Engineering
Faculty of Engineering
University of Peradeniya
Abstract
Rice is the staple food in Sri Lanka. The impact of the rice mills to the environment is considerable issue
currently. The rice production process consumes energy, water, bio mass and other environmental resources
and adds air and solid emissions, effluent and wastages back to environment which cause environmental
impacts. It is very clear to understand that the large amount of energy consumption, waste water and solid
waste to the environment and the very large capacity machines and engines used by the mills are the causes
behind the issue. Therefore, the total environmental effect of each and every step in the life cycle of the
production process needs to be considered in order to identify the most environmental friendly rice
production method. Mainly the parboiling and polishing processes are associated with harmful environment
discharge such as emission to air, fossil fuel and affect the natural resources. Therefore, proper
environmental management practices need to be sustained in the rice production industry. The objective of
the research is to evaluate the environmental impact through the life cycle of rice production in Sri Lanka.
Based on LCA approach (ISO 14040 series), the environmental impacts by the rice industry was analyzed.
The impacts on environment was assessed through “SimaPro” software. The results interpreted that the
most harmful processes among the rice production are the parboiling and polishing process.
Keywords: Rice Processing, Life cycle assessment, Environmental impact
1. Introduction
Rice has a long history in Sri Lanka and south east Asia. Its importance goes far beyond its status as a primary food
source in this island nation. Synonymously, rice plays an important role in the country's cultural identity, tradition,
and politics. The estimated paddy production for 2015/2016 Maha season was 2,902,693 MT. The highest production
was reported from Anuradhapura District about 13% of the country. The contribution to the national paddy production
from Ampara, Kurunegala and Polonnaruwa Districts were recorded as 12%, 11% and 10% respectively ( Paddy
statistics 2015/2016 Maha season). For 2015 Yala season was 1942408MT. The highest production was reported from
Ampara District about 16%. The contribution to the national paddy production from Pollonnaruwa, Kurunegala and
Anuradhapura districts were recorded as 14%, 11% and 10% respectively (Paddy statistics 2015 Yala Season).
There are two major types of rice: raw and parboiled. Approximately 70% of produced rice is going through the
parboiling process in Sri Lanka (Ariyarathna et al., 2016). Parboiled rice has been soaked, steamed, and dried before
the milling process. Parboiled rice does not take as long as raw rice cooking-wise, because it has been partially pre-
cooked already. The parboiled rice may cook in one-third the time needed to cook raw rice (Goyal et al., 2012). The
rice production process consumes energy, water, bio mass and other environmental resources and adds air and solid
emissions, effluent and wastages back to environment which causes heavy environmental impacts (Nadeeshani, 2015).
The environmental impact of each paddy varies depending on water management, usage of pesticide, and intensity of
production. Paddy cultivation has atmospheric impacts. Paddy fields produce methane that is a powerful greenhouse
gas (Gathorne-Hardy et al., 2013). Regarding atmospheric emissions, the environmental impact was lower for raw
3417
rice than for parboiled rice because the parboiled rice is produced using the boiler process. The atmospheric emission
inventory indicates a necessity to switch the methods to reduce air emissions. Additionally, water emissions were
registered since the excess soak-water drains after the soaking treatment in the parboiling process and is the main
source of water emissions in the life cycle of parboiled rice. There is no soaking treatment in the untreated process
and hence no water emissions were reported for fresh rice. While considering the health issues, a major occupational
hazard for the workers in rice mills is the noise during the operation of various machines. The sound-pressure level
(SPL) in the workrooms of the rice mill varied from 78 to 92 dB (Prasanna Kumar et al., 2008). The paddy cleaner,
rubber roll Sheller, paddy separator, rice cleaner and an electric motor without enclosure were found to be the
predominant noise sources in the workrooms of the mill. The causes of high noise in the rice mills may be attributed
to the use of a long flat belt drive, crank-and-pitman mechanisms, absence of an electric motor enclosure, poor machine
maintenance and inadequate acoustic design of the workroom of the rice mill (Prasanna Kumar et al., 2008).
Due to all reasons stated above, it is needed to carry out assessments in the field of manufacturing, especially
related to reducing environmental impacts. Nowadays, Life Cycle Assessment (LCA) is used as a tool to analyses an
entire process of a product by providing necessary information on the resource consumptions and corresponding
impacts. ISO 14040 series of standards are used to assists the manufactures to account the environmental issues which
include environmental management systems (EMS), environmental performance, environmental auditing,
environmental identifying and life cycle assessment.
Essentially, Life Cycle Impact Assessment can be calcified into two methods. Those are problem oriented (mid-
points) and damage oriented (end-points). Ariyarathna et al., 2016 compared the environmental impact of conventional
and modern rice processing by using problem oriented (Mid-point) method (Hierarchies’ version, H/A). Nadeeshani,
2015 assessed environmental impacts of different parboiled paddy production methods adopted in Sri Lanka by using
LCA approach. However, to date, there are no studies focusing on the environmental impacts analysis of each
processes under different scenarios. Therefore, this study assesses the environmental impacts of rice production
processes in order to investigate hotspots under problem oriented (Mid-point) method (IPCC 2001 GWP and ECO
indicator 99) and damage oriented (End-point) method which consists of ECO indicator 99 and ECO scarcity 2006.
Main intension of this study is to assess the eco-friendliness of rice production. Exploration results are used to identify
the hotspots in the processes which cause most harm to the environment, to endorse the necessary creativities of the
company and to implement greener the processes and products.
2. Methodology
LCA is a methodology to assess all the environmental impacts associated with a product, process, or activity
throughout its life cycle by accounting for and evaluating resource consumption and emissions according to ISO 14040
guidelines-2006. This consist of four major steps: goal and scope definition, inventory analysis, impact assessment,
and interpretation. The impacts on the environment were assessed through “SimaPro” software (Weerasinghe, 2015).
2.1 Goal and Scope definition
The rice production was selected to conduct the study. The products selected from the rice mills for the LCA are raw
rice and parboiled rice. The major objective of the study is to undergo a product life cycle assessment for the purpose
of investigating the overall environmental impact during the rice production process. The RAYIN rice mill and the
CHOLAI rice mill were selected for this study. The functional unit was defined as 1kg of processed rice. The system
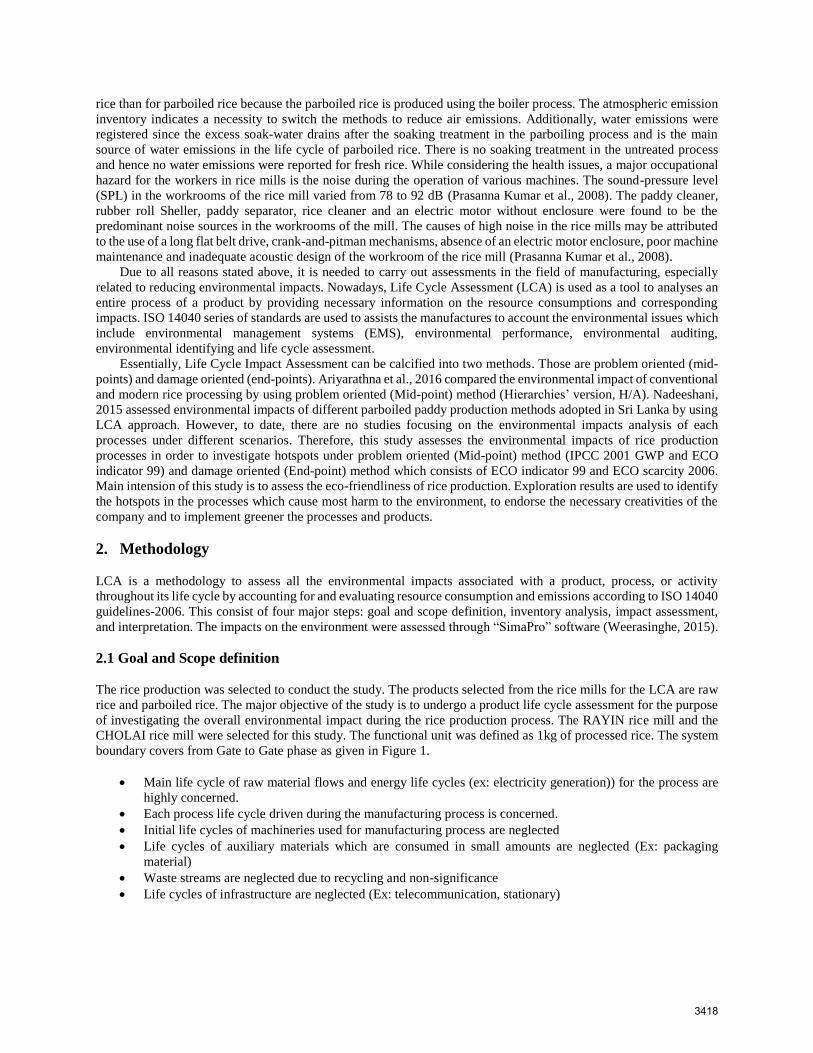
boundary covers from Gate to Gate phase as given in Figure 1.
• Main life cycle of raw material flows and energy life cycles (ex: electricity generation)) for the process are
highly concerned.
• Each process life cycle driven during the manufacturing process is concerned.
• Initial life cycles of machineries used for manufacturing process are neglected
• Life cycles of auxiliary materials which are consumed in small amounts are neglected (Ex: packaging
material)
• Waste streams are neglected due to recycling and non-significance
• Life cycles of infrastructure are neglected (Ex: telecommunication, stationary)
3418
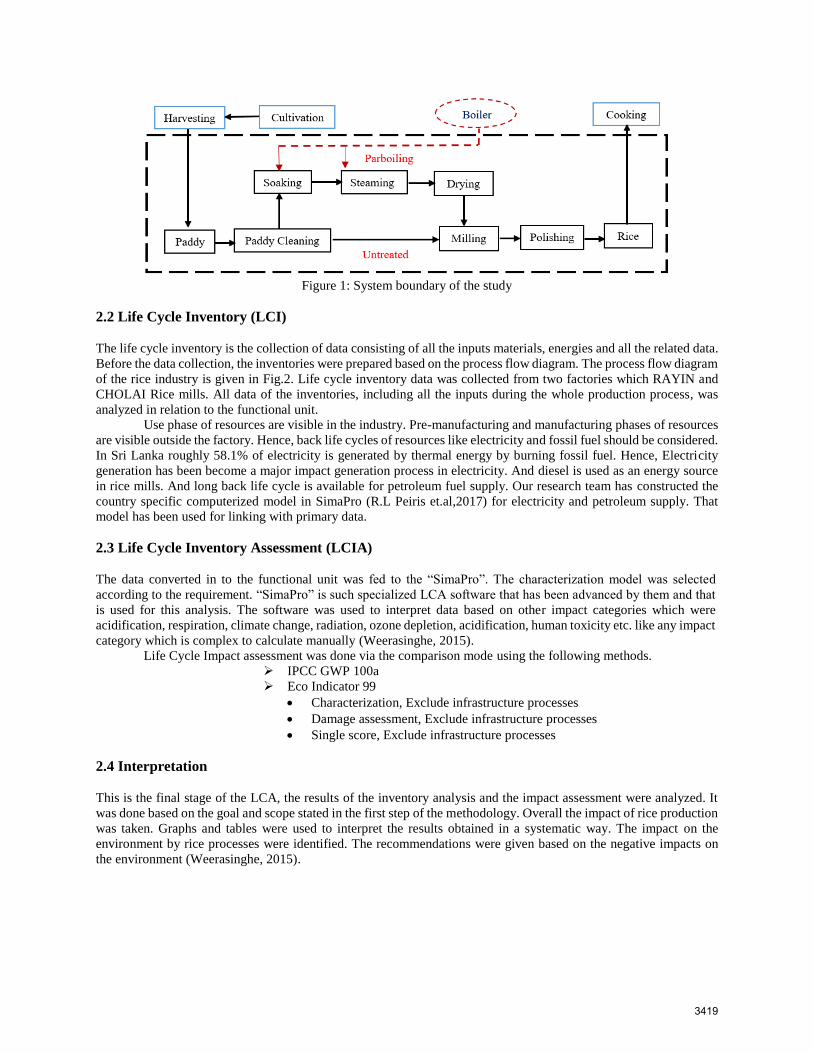
Figure 1: System boundary of the study
2.2 Life Cycle Inventory (LCI)
The life cycle inventory is the collection of data consisting of all the inputs materials, energies and all the related data.
Before the data collection, the inventories were prepared based on the process flow diagram. The process flow diagram
of the rice industry is given in Fig.2. Life cycle inventory data was collected from two factories which RAYIN and
CHOLAI Rice mills. All data of the inventories, including all the inputs during the whole production process, was
analyzed in relation to the functional unit.
Use phase of resources are visible in the industry. Pre-manufacturing and manufacturing phases of resources
are visible outside the factory. Hence, back life cycles of resources like electricity and fossil fuel should be considered.
In Sri Lanka roughly 58.1% of electricity is generated by thermal energy by burning fossil fuel. Hence, Electricity
generation has been become a major impact generation process in electricity. And diesel is used as an energy source
in rice mills. And long back life cycle is available for petroleum fuel supply. Our research team has constructed the
country specific computerized model in SimaPro (R.L Peiris et.al,2017) for electricity and petroleum supply. That
model has been used for linking with primary data.
2.3 Life Cycle Inventory Assessment (LCIA)
The data converted in to the functional unit was fed to the “SimaPro”. The characterization model was selected
according to the requirement. “SimaPro” is such specialized LCA software that has been advanced by them and that
is used for this analysis. The software was used to interpret data based on other impact categories which were
acidification, respiration, climate change, radiation, ozone depletion, acidification, human toxicity etc. like any impact
category which is complex to calculate manually (Weerasinghe, 2015).
Life Cycle Impact assessment was done via the comparison mode using the following methods.
➢ IPCC GWP 100a
➢ Eco Indicator 99
• Characterization, Exclude infrastructure processes
• Damage assessment, Exclude infrastructure processes
• Single score, Exclude infrastructure processes
2.4 Interpretation
This is the final stage of the LCA, the results of the inventory analysis and the impact assessment were analyzed. It
was done based on the goal and scope stated in the first step of the methodology. Overall the impact of rice production
was taken. Graphs and tables were used to interpret the results obtained in a systematic way. The impact on the
environment by rice processes were identified. The recommendations were given based on the negative impacts on
the environment (Weerasinghe, 2015).
3419

Figure 2: Process flow diagram of rice mills
The resource consumption for electricity, diesel and water in relation to the functional unit (1 kg of rice) of each
section-wise process, is tabulated in Table 1 and Table 2, respectively.
Table 1: LCI of the amount of electricity and diesel required for each operation per 1kg of rice for both rice mill.
Criteria
RAYIN Rice mill
Electricity (kWh)/kg CHOLAI Rice mill
Electricity (kWh)/kg CHOLAI Rice mill
Diesel (l)/kg
Pre-paddy cleaning 0.003 0.02 0.0003
Parboiling plant 0.11 0.04 -
Husk separator 0.005 0.02 0.0003
Paddy separating 0.002 0.004 0.0005
DE Stoning 0.005 0.02 0.0002
Polishing 0.112 - 0.0073
Grading 0.007 0.01 0.0002
Table 2: LCI of the amount of water and biomass required for parboiling and polishing process per 1kg of rice.
Criteria
RAYIN Rice mill
Water (l)/kg
CHOLAI Rice mill
Water (l)/kg
RAYIN Rice mill
Biomass(kg)
CHOLAI Rice mill
Biomass(kg)
Parboiling plant 1.0 3.0 0.018 0.021
Polishing 0.04 - - -
Weighing
Electricity-motor
Diesel-Engine Dust & Mud
Steam (A) Husk
Water Waste water
Electricity-motor Steam losses
Diesel-Engine
Diesel-Engine
Electricity-motor Sand & Dust
Electricity-motor
Diesel-Engine Rice dust
Electricity-motor
Diesel-Engine Stones & dust
Electricity-motor
Diesel-Engine Broken rice
Electricity-motor Broken rice
Diesel-Engine Rice dust
Water
Diesel-Engine
Electricity-motor
Water Ash
Fuel Steam losses
Electricity CO2 Emissions
Biomass
Steam (A)
Paddy seperator
Paddy cleaning
Parboiling process
Husk seperator
Destoner
Polishing
Grading
Packking
3420
3. Results and Discussions
3.1 IPCC 2007 GWP Method
The global warming potential uses characterization factors from the International Panel of Climate Change for a time
frame of 100 years. The contributions from various substances that contribute to climate change are calculated with
respect to an equivalent substance which is CO2eq. GWPs provide a common unit of measure, which allows analysts
to add up emission estimates of different gases and allows policymakers to compare emission reduction opportunities
across sectors and gases (Yusoff & Panchakaran, 2015).
(1) (2)
Figure 3: Contributors to the Global Warming Potential for (1) RAYIN and (2) CHOLAI rice mills
Figure 3 shows the overall Global Warming Potential of 1kg of rice. The maximum impact was set as 100% and all
the rest values are evaluated compared to that. According to the graph for the RAYIN rice mill, the parboiling process
(0.0713 kg CO2eq) has the most significant potential impact on global warming, followed by the polishing process
(0.0711 kg CO2eq). This is because the parboiling section has more than one process and machineries. They used
modern methods such as online cooking (soaking in hot water) and an electrical drying system. Therefore, the
electricity consumption is high, so the environmental impact is significant. If we consider the polishing process, they
have used additional machineries such as “Silk master” for the improvement of the quality.
According to the graph for the CHOLAI rice mill, the parboiling process (0.0269 CO2eq) has the most significant
potential impact on global warming, followed by the polishing process (0.0206 kg CO2eq). The parboiling section has
a larger capacity than other processes, therefore, the parboiling process has a significant impact to the environment.
When we compare the sections, the impacts do not vary a lot. This is due to the parboiling process mot using the
electrical drying system; they use a natural sun drying system. Additionally, the polishing process only consists of a
single polishing operation. However, it uses fuel as an energy source. The environmental impact of electricity
generation is larger than the impact of the fuel extraction and combustion process.
3.2 Eco Indicator 99 Method
The Eco Indicator 99 method was used to explain the production processes’ impacts to the environment. The impacts
are carcinogens, respiratory organics & inorganic, climate change, radiation, ozone depletion, eco toxicity, land use,
minerals, fossil fuels and acidification (Weerasinghe, 2015).
Based on the results obtained for RAYIN rice mill, ozone layer, land use and fossil fuel categories are most
affected by the polishing process. The main contributor to the other impact categories is the parboiling process as
shown in Figure 4 (1). According to the CHOLAI rice mill results shown in Figure 4 (2), the respiratory inorganics,
radiation, ozone layer, acidification and fossil fuel impact categories are strongly affected by the polishing process.
The main contributor for the other impact category is the parboiling process.
0.
20.
40.
60.
80.
100.
120.
IPCC GWP 100a
%
R1-paddy clean
R2-Parboil plant
R3-Husk seperator
R4-paddy seperator
R5-Destoner
R6-Polisher
R7-Grader
0.
20.
40.
60.
80.
100.
120.
IPCC GWP 100a%
C1-Paddy clean
C2-parboil plant
C3-Husk seperator
C4-Paddy seperator
C5-Destoner
C6-Polisher
C7-Grader
3421

(1)
(2) Figure 4: The Characterization impact level analysis (1) RAYIN and (2) CHOLAI rice mills; model with regard to
the eco indicator 99
(1) (2) Figure 5: The Damage Assessment of the processes of (1) RAYIN and (2) CHOLAI rice mills; model with regard to
the eco indicator 99
0.
20.
40.
60.
80.
100.
120.%
R1-paddy clean
R2-Parboil plant
R3-Husk seperator
R4-paddy seperator
R5-Destoner
R6-Polisher
R7-Grader
0.
20.
40.
60.
80.
100.
120.
%
C1-Paddy clean
C2-parboil plant
C3-Husk seperator
C4-Paddy seperator
C5-Destoner
C6-Polisher
C7-Grader
0.
20.
40.
60.
80.
100.
120.
HumanHealth
EcosystemQuality
Resources
%
R1-paddy clean
R2-Parboil plant
R3-Husk seperator
R4-paddy seperator
R5-Destoner
R6-Polisher
R7-Grader0.
20.
40.
60.
80.
100.
120.
HumanHealth
EcosystemQuality
Resources
%
C1-Paddy clean
C2-parboil plant
C3-Husk seperator
C4-Paddy seperator
C5-Destoner
C6-Polisher
C7-Grader
3422

As shown in Figure 5, damage assessment, following the characterization analysis, was performed to observe how the
impacts can cause total damage to the environment in terms of three different end points; Human health, ecosystem,
and resources. Damage to human health is straightforward and looks at how the substances released into the
environment can adversely affect human health by reducing the number of years lived (Yusoff & Panchakaran, 2015).
Based on the results obtained from the RAYIN rice mill Figure 5 (1), it is evident that the human health and
ecosystem are affected by the parboiling process and the resource category is affected by the polishing process.
CHOLAI rice mill results as seen in Figure 5 (2) are similar to those of RAYIN rice mill.
As shown in Figure 6, via the single score analysis method the hot spot process among the all process can be identified.
Based on the Figure 6 (1), the parboiling process is the most significant impact process followed by the polishing
process. According to the Figure 6 (2) the polishing process is a significant impact process followed by parboiling
process. In both cases the human health is highly affected.
(1) (2) Figure 6: The Score impact levels of the processes of (1) RAYIN and (2) CHOLAI rice mills; model with regard to
the eco indicator 99
Figure 7 depicts the overall Global Warming Potential comparison. The maximum impact was set as 100% and all the
rest values are evaluated compared to that. Figure 7(1) and Figure 7(2) show the overall comparison between two
factories. According to the graph the RAYIN rice mill (0.156 kg CO2eq) is the most significant impact factory to the
environment followed. CHOLAI rice mill (0.0987 kg CO2eq) has the lowest impact on global warming. Because the
parboiling process and polishing process of the RAYIN mill consume more electricity than CHOLAI mill because the
RAYIN mill has used the Online cooking (Hot soaking) by electricity and electrical drying system and for the good
quality they use additional polishing machineries. But without parboiling and polishing process the environment
impact of CHOLAI mill is higher than the RAYIN mill because the capability of the CHOLAI mill double than
existing working capacity. It means that the mill is over designed.
(1) (2)
Figure 7: Characterization impact level between two factories according to Global Warming Potential
0.1.2.3.4.5.6.7.8.
mPt
Resources
EcosystemQuality
HumanHealth
0.0.5
1.1.5
2.2.5
3.3.5
4.
mPt
Resources
EcosystemQuality
HumanHealth
0.
20.
40.
60.
80.
100.
120.
IPCC GWP 100a
%
R1-paddy clean
C1-Paddy clean
R2-Parboil plant
C2-parboil plant
R3-Husk seperator
C3-Husk seperator
R4-paddy seperator
C4-Paddy seperator
R5-Destoner
C5-Destoner
R6-Polisher
C6-Polisher
R7-Grader
C7-Grader
0.
20.
40.
60.
80.
100.
120.
IPCC GWP 100a
%
CHOLAI MILLoverall
RAYIN MILLOverall
3423

4. Conclusions
The efficient utilization of energy is a great challenging task to the researchers. The rice industry is one of the most
energy consuming industries. Saving of husk could also lead to co-generation of thermal energy in furnaces for boilers
and dryers in the rice industry. Thus, energy conservation in the rice industry would lead to reduction in the use of
electricity for parboiling process. According IPCC 2007 GWP method, the parboiling process plays a significant role
in rice industry. While comparing both rice mills results, RAYIN rice mill generates more global warming potential
due to the electricity usage. Electricity generation has become a major impact in generation process. ECO indicator
99 implies that the impact from parboiling and polishing processes, in which the first is deemed to be the major
contributor with significant impact, highly affect the environment. Among the impact categories, the Human health
and Eco system are which is mostly affected by parboiling process and the Resource category is mostly affected by
Polishing Process. Specifically, the parboiling process leads the impacts to environment. In total, parboiling and
polishing are the most influencing processes towards the environment respectively. Corrective action needs to be taken
to minimize the CO2 eq emissions to convert the products towards being carbon neutral.
References
Ariyarathna, S. M. W. T. P. K., Siriwardhana, H. P. D. S. N.,and Danthurebandara, M., Life cycle assessment of rice
processing in Sri Lanka: Modern and conventional processing, 2nd International Moratuwa Engineering
Research Conference, MERCon 2016, 297–302, 2016.
Gathorne-Hardy, A., Reddy, D. N., Venkatanarayana, M., and Harriss-White, B., A life cycle assessment (LCA) of
greenhouse gas emissions from SRI and flooded rice production in SE India, Taiwan Water Conservancy,
61(4), 110–125, 2013.
Goyal, S. K., Jogdand, S. V., and Agrawal, A. K., Energy use pattern in rice milling industries—a critical appraisal.
Journal of Food Science and Technology, 2012.
Nadeeshani, E., Environmental assessment of parboiled paddy production by life cycle assessment, Department of
Chemical and Process Engineering, University f Morauwa, Sri Lanka, 2015.
Paddy statistics 2015/2016 Maha season, Department of census and statistics, 2016.
Paddy statistics 2015 yala season, Department of census and statistics, 2015.
Prasanna Kumar, G.V., Dewangan, K. N., Sankar, A., Kumari, A., and Kar, B., Occupational noise in rice mills,
Noise Health, Apr - Jun: 10(39):55-67, 2008.
R.L.Peiris, A.K.Kulatunka, K.B.S.N Jindasa, Life Cycle assessment of semi-conventional roof tile manufacturing in
Sri Lanka,8th International Conference on Structural Engineering and Construction Management,
2017,ICSECM2017-162,54-63
Weerasinghe, K. G. N. H., Life cycle assessment of latex household glove manufacturing industry in Sri Lanka,
Postgraduate Institute of Science, University of Peradeniya, Sri Lanka, 111, 2015.
Yusoff, S., and Panchakaran, P., Life cycle assessment on paddy cultivation in Malaysia : A case study in Kedah.
LCA Rice, 1–10, 2015.
A. K. Kulatunga is a senior lecturer in the Department of Manufacturing & Industrial Engineering at the Faculty of
Engineering, University of Peradeniya, Sri Lanka. He earned Bachelors in Production Engineering from University
of Peradeniya, Sri Lanka and PhD in Mechanical/ Industrial Engineering from University of Technology, Sydney,
Australia and gLink Erasmus Mundus Research Fellowship at University of Bremen Germany. He has published
several books/book chapters, and more than seventy journal and conference papers. Dr. Kulatunga has served in many
local and international forums which include the ministry of Environment Sri Lanka, UNEP LCA initiative, UNIDO-
NCPC projects. His research interests include lean and sustainable manufacturing, Industrial Engineering. He is the
country representative for IEOM in Sri Lanka. He also holds memberships at IIE, IEEE, ERSCP, and IESL
Kamalakkannan.S is currently a fulltime Research Assistant at Faculty of Engineering University of Peradeniya.
Mr. Kamalakkannan holds a Bachelor of Science degree in Manufacturing and Industrial Engineering from the
University of Peradeniya. He has carried out a project regarding design and fabrication of impact resistance testing
instrument for ceramic floor tiles. Furthermore, he worked with BOEHM + LECKNER MULTI MOULDS (PVT)
LTD and SINGER(SRILANKA) PLC where he supported the engineering departments.
3424


![INDEX [hrylabour.gov.in]€¦ · Web viewS. Tanneries and Leather Manufactory. 9. Rice Mills, Flour Mills and Dal Mills. 10. Rubber Industry. 11. Operation of Tubewell Industry. 12.](https://static.fdocuments.us/doc/165x107/5ec05484689565615e44642d/index-web-view-s-tanneries-and-leather-manufactory-9-rice-mills-flour-mills.jpg)


