Life Cycle Assessment of electricity generation from ...
69
1 Life Cycle Assessment of electricity generation from hydropower Aristeidis Karananos SID: 3303170004 SCHOOL OF SCIENCE & TECHNOLOGY A thesis submitted for the degree of Master of Science (MSc) in Energy Management DECEMBER 2018 THESSALONIKI – GREECE
Transcript of Life Cycle Assessment of electricity generation from ...

1
Life Cycle Assessment of electricity generation from hydropower
Aristeidis Karananos SID: 3303170004
SCHOOL OF SCIENCE & TECHNOLOGY A thesis submitted for the degree of
Master of Science (MSc) in Energy Management
DECEMBER 2018 THESSALONIKI – GREECE

2
Life Cycle Assessment of electricity generation from hydropower
Aristeidis Karananos SID: 3303170004 Supervisor: Kaltschmitt Martin Supervising Committee Herakleous Eleni Members: Martionopoulos Georgios
SCHOOL OF SCIENCE & TECHNOLOGY
A thesis submitted for the degree of Master of Science (MSc) in Energy Management
DECEMBER 2018 THESSALONIKI – GREECE

3
Abstract This dissertation was written as a part of the MSc in Energy Management at the
International Hellenic University.
In the current dissertation a study is made, where the impact of the construction and
operation of a hydropower plant is assessed. To produce the impact assessment results in
question the software openLCA is used. The power plant used in this paper is considered
to be located in Greece and of the storage variety with a concrete dam and an installed
capacity of 100MW for electricity production. The categories selected are global warming
potential, acidification and eutrophication, all expressed in kg of their equivalent per kWh
of electricity produced. In order to interpret the results, they are compared with two other
electricity production methods, mainly a lignite power plant and a plant that operates with
natural gas. In the end, the results show that the environmental impact of a hydroelectric
power plant in Greece is considerably smaller compared to fossil fuels operated
installations. The main reason is the use of a free fuel which is water. The biggest impact
of a hydroelectric power plant is considered to be the land transformation because of the
construction of the dam.
Aristidis Karananos

4
Acknowledgements I would like to thank first my supervisor, Prof. Dr.-Ing Martin Kaltschmitt who oversaw
this thesis. I would also like to thank Dr. Anne Rödl from the TUHH as well as Prof. Eleni
Heracleous and Prof. Georgios Martinopoulos from the International Hellenic University
for their support, prompt guidance and continuous help with my study. Without their help
this effort would not have been possible.
A big thank you at both organizations in Greece and Germany, most importantly the
DAAD for funding this project and for their great collaboration and for giving me the
chance to travel to Germany in order to complete my dissertation.
Last but not least I would like to thank my family and my friends for giving me the
opportunity to complete my master’s degree as well as for their patience and support
throughout this effort. Their presence made everything possible.
Thessaloniki, December 2018

5
Contents Abstract .................................................................................................................................. 3 Acknowledgements ................................................................................................................ 4 1 Introduction ........................................................................................................................ 9 2 Energy Sources ................................................................................................................. 11
2.1 Renewable energy sources .......................................................................................... 11 2.2 Electricity from Hydropower ...................................................................................... 12 2.3 Energy situation in Greece .......................................................................................... 13 2.4 Hydropower in Greece, a look back ............................................................................ 15
2.4.1 Hydro power plants operating in Greece .............................................................. 16 2.5 Other possible roles of hydro power plants ................................................................. 17
3 Hydro power plants .......................................................................................................... 19 3.1 Defining hydro power plant terms ............................................................................... 19 3.2 Types of hydroelectric power plants ........................................................................... 20
3.2.1 Run-of-river plants ............................................................................................... 20 3.2.2 Storage hydroelectric power plants ...................................................................... 20 3.2.3 Pumped storage power plants ............................................................................... 21 3.2.4 Small hydropower stations <1MW ...................................................................... 22 3.2.5 Other forms of electricity production from hydro ................................................ 22
3.3 Turbine types and application ..................................................................................... 22 3.3.1 Reaction turbines .................................................................................................. 22 3.3.2 Impulse (action) turbines ...................................................................................... 24
3.4 Expected life and decommission ................................................................................. 26 4 Life Cycle Assessment ...................................................................................................... 29
4.1 Goal & Scope .............................................................................................................. 29 4.2 Inventory analysis ........................................................................................................ 30 4.3 Impact assessment ....................................................................................................... 30 4.4 Interpretation ............................................................................................................... 31 4.5 Input data ..................................................................................................................... 31 4.6 Functional unit ............................................................................................................. 32 4.7 System boundaries ....................................................................................................... 32 4.8 LCA data quality limitations ....................................................................................... 36 4.9 Electricity from fossil fuels ......................................................................................... 36
5 Results interpretation and comparison .......................................................................... 41 5.1 Interpretation of results from hydropower plant ......................................................... 41
5.1.1 Global warming potential ..................................................................................... 41 5.1.2 Acidification – Eutrophication potential .............................................................. 44
5.2 Cumulative Energy Demand ....................................................................................... 47 5.3 Comparing results to literature .................................................................................... 51 5.4 Advantages of electricity production from RES ......................................................... 53 5.5 Disadvantages of electricity production from RES ..................................................... 54 5.6 Alternative ways to produce electricity ....................................................................... 54
5.6.1 Solar-Wind Energy ............................................................................................... 54 6 Conclusions ........................................................................................................................ 57 Bibliography ......................................................................................................................... 59 Appendix ............................................................................................................................... 63

6
List of Tables Table 3.1: Reaction Turbines .......................................................................................... 23 Table 3.2: Impulse Turbines ........................................................................................... 24 Table 3.3: Turbine Type and Head Classification .......................................................... 24 Table 3.4: Expected life and decommission of a Power Plant ........................................ 26 Table 3.5: Average life and decommission of reference plant ....................................... 27 Table 4.1: Input data openLCA 1 HPP Unit ................................................................... 38 Table 4.2: Input data openLCA 1kWh of Electricity from 1 HPP Unit ......................... 39 Table 5.1: openLCA results from three different cases .................................................. 47 Table 5.2: Cumulative energy demand (in MJ oil-eq/kWh) ........................................... 48 Table 5.3: Cumulative energy demand (in MJ/kWh) in Greece ..................................... 50 Table 5.4: CED results comparison between three different cases. ................................ 51 1. Software representation of power plant in openLCA software .................................. 63 2. Reference hydroelectric power plant in Greece .......................................................... 64 3. Natural gas power plant .............................................................................................. 65 4. Lignite power plant ..................................................................................................... 66 5 Graphical results obtained from openLCA software about three impact categories ... 67

7
List of Figures Figure 2.1: Renewable production in Europe ................................................................. 12 Figure 2.2: Hydro power production in Europe .............................................................. 13 Figure 2.3: Total Installed Capacity (MW) .................................................................... 14 Figure 2.4: Renewable production in Greece ................................................................. 15 Figure 3.1: Hydro Power Plant ....................................................................................... 19 Figure 3.2: Run of river HPP .......................................................................................... 20 Figure 3.3: Storage HPP ................................................................................................. 21 Figure 3.4: Pumped storage HPP .................................................................................... 22 Figure 3.5: Francis Turbine ............................................................................................ 23 Figure 3.6: Kaplan Turbine ............................................................................................. 23 Figure 3.7: Pelton Turbine .............................................................................................. 24 Figure 3.8: Flow per type of Turbine .............................................................................. 25 Figure 3.9: Turbine Operation ........................................................................................ 25 Figure 4.1: Visualization of an LCA study ..................................................................... 31 Figure 4.2: System boundaries of Reference Power Plant .............................................. 33 Figure 4.3: System Boundaries of different power plants .............................................. 34 Figure 4.4: Map of Greece with HPP location ................................................................ 35 Figure 4.5: HPP Platanovrisi and Characteristics ........................................................... 35 Figure 5.1: GWP impact from electricity generation options in Greece. ....................... 43 Figure 5.2: GWP main contributors for hydro power ..................................................... 44 Figure 5.3: Acidification main contributors for hydro power ........................................ 45 Figure 5.4: Eutrophication main contributors for hydro power ...................................... 46 Figure 5.5: Environmental impacts from electricity generation options in GR. ............. 46 Figure 5.6: CED from electricity Production via Hydropower, ..................................... 49 Figure 5.7: CED results comparison between three different cases. .............................. 50 Figure 5.8: Comparing results to literature, hydropower ................................................ 52 Figure 5.9: Comparing results to literature, lignite and natural gas ............................... 53

8

9
1 Introduction
Global demand for energy is constantly increasing. According to estimates of the
International Energy Agency (IEA), the needs of the planet will increase by 35-40% over
the next 15 years, mainly due to its significant increase of the population of the earth, the
growth of economic and developmental activities across the globe and a significant
improvement in living standards level and what this entails. [1]
The reserves of the planet's fossil fuels (coal and oil) are not renewable and will
be exhausted within a foreseeable period. Furthermore, the consumption of fossil fuels
has caused and continues to cause significant damaging effects on the environment, such
as greenhouse and acidic rainfall, as well as major climatic changes, which are large
threats to the future of humanity. From measurements made, emissions of carbon dioxide
(CO2) in the atmosphere are steadily increasing year by year with the Electricity
Production sector being the largest direct participation in these emissions. [2]
It is, therefore, imperative to reduce our dependence on the conventional forms of
energy and replace them with others, renewable and friendly to the environment. Studies
show that the total potential of Renewable Energy Sources (RES) is at least 20 times
larger than what is used today. [3]
Solar energy, wind energy, geothermal energy, hydropower, biomass or even
urban waste are forms of renewable energy sources of energy, the exploitation of which
has, in addition to economic benefits, positive environmental and social impacts on
sustainable development with ecological perspective.
More specifically, as far as hydroelectric energy is concerned, environmental
benefits of a hydroelectric plant are varied. Even the downside of their environmental
impacts due to large-scale civil engineer projects, which a large hydroelectric project
requires with one well-designed study, can be turned into an advantage. Typical is the
case of the Nestos complex in Greece, where after flooding the area in order to create the
Dam, a new wetland was created, which soon turned into an important tourist attraction
while giving new irrigation possibilities to the surrounding area.
In this study we are going to compare different ways of producing electricity and
examine the results. The focus will be the assessment of the global warming potential of
each method, as well as the cumulative energy demand. Some types of electricity
generation outside of hydro power will be lignite and natural gas, since these are the main

10
uses of power production in Greece. The method used to create this analysis will be a Life
Cycle Assessment from cradle to grave of the power plant. Cradle to grave includes the
production from the beginning, taking into consideration raw materials, transport, usage
and decommission–recycling. We will also check the acidification as well as
eutrophication results of each method of electricity production and compare.
This study is based on input data collected from previous papers and research
concluded all over Europe. The main source is the paper titled “Life Cycle Inventories of
Hydroelectric Power Generation” by Karin Flury, Rolf Frischknecht, commissioned by
Öko-Institute e.V. [9] With this data a reference hydro power plant is created with an
approximate installed capacity of around 100MW with a reservoir and electricity net
annual production of around 200GWh/a. The reference plant is very similar to the HPP
of Platanovrisi, located at the Nestos Complex in Northern-Eastern Greece.

11
2 Energy Sources By 2020 almost a fifth of all energy consumption in the European Union must
come from renewable sources. This means hydro, solar, wind, biomass and wave energy.
This proposal was signed in 2007 by all EU leaders and was created in order to try and
cut down on greenhouse gas emissions by 20 percent compared to 1990 levels. [4]
For hydroelectric power, this mandate means significant growth in development
and creation of new capacity and important updates to existing facilities throughout
Europe. There have been many new plants going into operation in the last years which
has not been the case for hydro power for quite a while.
Small hydro power plants (<10MW) have seen more significant development
opportunities. This happens since the cost of creating and operating a small Unit is much
easier than creating new hydro power plants from scratch. The licensing as well finding
the appropriate place for the installation is much easier and can be done in a smaller time
frame. The European Small Hydropower Association (ESHA) estimates that installed
small hydro capacity could reach 16 GW of installed capacity by 2020.
Europe is a major player and leader in research and development of new
technologies. The commitment to R&D as well as to commercialization of new designs
continues throughout Europe.
2.1 Renewable energy sources
The increase of population as well as the improvement of living standards have
led to a rapid increase in energy consumption with the highest upward trend being
observed in the developing countries like China and India. The international research
community and the energy industry have turned their interest into modern “clean”
production technologies and the use of Renewable energy sources. (RES).
RES is the most environmentally clean energy generation technology available
and appears to have drastically reduced the constantly increasing environmental
problems. Even though many steps have been taken and new technologies have been
developed, the implementation of RES is still at an early stage. Exploitation of sun, wind,
water, geothermal and biomass, sources that are environmentally friendly can be made
economically viable to contribute to the sustainable development.

12
In Greece there is the possibility of significant utilization of renewable sources,
like solar heating and electricity production from PVs since there is significant sunshine
and right wind potential especially on the islands. Water potential is also an option in
mountain areas.
In the Figure 2.1 below a graph is created from available data from the European
Union. It shows the progress of renewable energy production by type for a time period of
10 years. All results are expressed in tons of oil equivalent (toe). In such cases toe is the
amount of energy released by burning one tone of crude oil. Using this unit helps with
the comparison between different energy types. As the figure shows, electricity from
hydropower has been steady for many years now. This is mainly because old hydro power
plants are still in use and having long expected lifetime (explained in the next chapters)
new ones are not in major need. On the other hand, renewable energy like solar electricity
production has been on the rise. Wind power also has seen a major increase.
Figure 2.1: Renewable production in Europe, source www.datamarket.com [5]
2.2 Electricity from Hydropower
The hydropower that is installed in Europe totals approximately 179.000MW.
Countries that have one of the biggest amounts of installed hydro are France, Spain, Italy
and Norway. The big goal for European countries is to maintain but also upgrade the
existing infrastructure. Retrofitting hydro power plants with more modern equipment,

13
which mainly means upgrading the capacity is of high priority. Eastern Europe is
following a slightly different path, mostly trying to rehabilitate aging plants that have
been left unused for quite some time. [6]
In the Figure 2.2 below we can see the production of energy via hydro power in
Europe. The color indicates the intensity of the production.
Figure 2.2: Hydro power production in Europe, source www.datamarket.com [5]
2.3 Energy situation in Greece
The Greek energy sector is still mainly dependent on fossil fuels. In the case of
natural gas, it is mainly imported, lignite on the other hand is produced at site. Because
of the geographical position of Greece and the many islands, about 54% of the energy
requirements are covered by petroleum products which is much higher than the average
of Europe, which stands at 33%. Islands have been known to produce their electricity
from inefficient diesel generators. There have been moves to connect the islands to the
mainland, but it is a process that demands many resources and planning.
The Figure 2.3 shows the electricity mix in Greece as it stands for the year 2016.
Installed capacity of the hydro power plants in Greece has a total of 3061,1 MW. All this
information is provided by the Public Power Corporation of Greece.

14
Figure 2.3: Total Installed Capacity (MW) [7]
The energy sources in the mainland include lignite for around 50% but also
renewables like hydro power plants, solar, wind and biomass. Greece imports most of its
energy, and primary needs are covered at about 60% from imports. The rest 40% is
covered through own production of electricity. The split between lignite and renewables
sits at a 60-40 at the moment. Imported natural gas has been slowly picking up as one of
the main ways to also produce electricity, which in turn mitigates the need and use of
lignite power plants. In the last few years there have been some decommissions of old
lignite plants. Those have been replaced either with natural gas plants or with more
renewable methods.
According to the Electricity Market Operator (ΛΑΓΗΕ) the total installed capacity
in Greece at the end of 2016 was 16,615MW. From this amount 3.912MW were available
from lignite power plants, 4.658MW from natural gas, 3.173MW from large hydro-power
plants and 4.873MW from renewable sources. The total electricity generation in Greece
for the year 2016 was measured at 41.6 TWh. For this production lignite played produced
25%, natural gas 28% and hydro power around 20%. The rest 27% was again covered via
wind, solar, biomass and small hydro.
According to the literature, the electricity consumption in the reference year of 2016
in Greece was 50.1 TWh. This amount also includes transmission and distribution losses
of around 3%. The annual peak load for mainland Greece was measured at 9.082 MW.
23%
28%
19%
16%
12,9%
0,1%
1%
30%
Greek Total Installed Capacity (MW)
Lignite Natural Gas Hydro Power Solar Wind Biomass Small Hydro

15
Cost wise, the production of RES has costed less in the year 2016 in comparison to
another reference year of 2014. The production of 1 MWh from renewables fell to
160€/MWh which is almost 40€ less from the year 2014 (200€/MWh). This has happened
because of the new more efficient technologies used for electricity production but also
because of the Feed-in-tariffs (FIT) that the Greek government implemented.
Figure 2.4 consists of data available for Greece between the years 2005 to 2016. It
shows the development and emerge of renewable production in Greece. Hydro power
plants have been steady, similar to figure 2.1 where European installation was shown.
The main increase is happening at solar photovoltaic installations in Greece in the last 4
to 5 years. This was due to government programs helping with new installations and
offering contracts like feed-in-tariffs and subsidies. This has stopped in the years of the
Greek crisis but is going to continue growing as the financial situation becomes better.
Figure 2.4: Renewable production in Greece, source www.datamarket.com [5]
2.4 Hydropower in Greece, a look back
Electricity production in Greece started at around the year 1900 in the capital,
Athens. Some years later, big corporations from around the world started emerging as
possible candidates for electricity production and distribution. The American company
Thomson-Houston with the participation of the National Bank would establish the

16
Hellenic Electricity Company that would be responsible for bringing electricity to the rest
of the Country.
The first Greek hydroelectric plant was the Glafkos factory, which is based in the
southern part of Greece. The first dams that were constructed were Louros in 1954, Ladon
in 1955 and Tayropos in 1959. All three of them were made from concrete and used
different styles. (arc dam or gravity dam etc.). Following another dam, the Kastraki Dam,
Greek efforts focused on the studies and construction of dirt and stone dams. Thus, such
dams were constructed in Polyfyto in 1974, Pournari in 1981, Sfikia and Asomaton in
1985, Stratou in 1989, Aoos Springs in 1989. At the end of 1997 the construction of the
dams was completed.
Dams created by the Public Power Corporation (PPC), although they have high
manufacturing costs justify their existence because the production of hydroelectric power
mitigates the cost of construction as evidenced by the history of the first dams in Greek
space. In addition, PPC dams help with irrigation and water supply.
2.4.1 Hydro power plants operating in Greece
The total installed capacity of PPC's Hydroelectric Stations is 3,060MW.
(16 large and 8 small stations). The total average annual energy output is approximately
5000Gwh. Hydroelectric Stations today are separated in four (4) main Complexes, two
independent HPP and other small ones.
1. Acheloos Complex: (Kremasta, Kastraki, Stratos I and II, Giona and Glafkos).
Total installed capacity 925,6MW.
2. Aliakmonas complex: (Polyfyto, Sfikia, Asomatos, Makrohori, Agras, Edessaios,
Vermie). Total installed capacity 879.3MW.
3. Arachthos Complex: (Aoos Sources, Pournari I, Pournari II, Louros). Total
installed capacity of 553.9MW.
4. Nestos Complex: (Thesaurus, Platanovrisi). Total installed capacity 500MW.
5. N. Plastiras installed capacity 129.9MW.
6. Ladonas installed capacity 70MW.
7. Other small HEIs (Agios Ioannis Serres, Agia, Almyros). Total installed power
1.3MW.
Hydroelectric power today of 3,060 MW (data 2015) covers 28% of the total of
installed capacity of the conventional stations which amount to 11.079MW. The average

17
annual hydroelectricity production, depending on the amount of water available for the
year, covers around 9-10% of PPC's production. [7]
2.5 Other possible roles of hydro power plants
Hydro power plants are mainly used for electricity production but in fact they can
play other important roles. Sometimes dams for example are built in order to help with
irrigation purposes of an area and then a HPP uses the existing construction for the benefit
of producing electricity.
Agriculture is affected mainly from seasonal weather changes. Such risk can be
reduced by using the water in a reservoir for irrigation in order to maintain stable levels
of water usage.
In other cases, dams are created in order to help with flood control. That is their
main purpose in places where the level of a river for example is not stable and can cause
problem with the population living beyond the point of the dam.

18

19
3 Hydro power plants Hydro power plants convert the energy of the waterflow into electricity.
Hydroelectric units exploit the natural process of the water cycle. More specifically
because of heating and winds on the surface of the Earth, the water evaporates and gathers
on the sky creating clouds. The water vapor is condensed, liquified and then while falling
as rain, it enriches the water repositories of the earth, where it returns to the sea, lakes or
just underground.
The capacity of electricity generation depends on many factors, such as:
• The flow of water
• The volume of water
• The level of the head created by the dam
• The efficiency of the power plant technology
3.1 Defining hydro power plant terms
Source: KPMG, Central and Eastern European Hydro Power Outlook [8]
Figure 3.1: Hydro Power Plant
• A dam is a structure made out of concrete or locally available material. It is
constructed in the water flow to block its way in order to gather water.

20
• The reservoir is the artificial lake or water buffer created by the dam.
• The head is the elevation difference between the upstream and downstream water.
• The headwater is lead through the intake to access the penstock after passing the
gate. The gate is closed if the power generation needs to be halted.
• High pressure steel penstock pipes deliver the incoming headwater to the turbine.
In case of low head power plants penstocks are substituted by open waterways.
• A turbine is a rotor in a housing that converts energy from the water flow into
useful work and delivers it to the generator through the rotation of its shaft.
• The generator utilizes the useful rotational work of the turbine to convert it into
electricity
3.2 Types of hydroelectric power plants
3.2.1 Run-of-river plants
Source: KPMG, Central and Eastern European Hydro Power Outlook [8]
Figure 3.2: Run of river HPP
Most common type between other hydroelectric powerplants. They use the natural
flow and elevation drop of a river to generate electrical power. This means there is only
minimal or no storage of water. Such power plants (PP) are constructed on rivers with a
steady and consistent flow. In case of seasonal fluctuations large reservoirs are needed in
order to operate the PP during the dry season.
3.2.2 Storage hydroelectric power plants

21
The distinction between storage PP and run-of-river PP can be made by the
purpose of the dam. Run-of-river plants need the dam to create the appropriate head and
tailwater level difference for the operation of the turbine, the storage type PP need the
dams to store the appropriate amount of water on rivers, where we cannot ensure stable,
continuous operation. The reservoir allows for a scheduled use of the stored potential
energy of water, flowing from a high to a low place.
The way the system works is that the reservoir is filled when there is rainy season
and the summoned water can last for the whole season. The water flows from the reservoir
via pressure pipes to drive the turbine of the PP.
Source: KPMG, Central and Eastern European Hydro Power Outlook [8]
Figure 3.3: Storage HPP
3.2.3 Pumped storage power plants
Pumped storage power plants (PSPP) are known as power plants but are in fact
electricity storage facilities. They are a special type of storage plant since the water is
pumped up from a lower basin to fill the reservoir. The pumping normally takes place at
night, since at that time of day there is excess electrical power (off-peak demand) which
is used to dry the pumps. The plant is a net consumer of energy overall with a pumping
efficiency of 75-80%.
The main purpose of such plants is balancing the electricity demand and also
satisfying peak demands and also utilizing electricity surplus on the side. Since energy
cannot be destroyed, it is simply put to use otherwise.

22
Source: KPMG, Central and Eastern European Hydro Power Outlook [8]
Figure 3.4: Pumped storage HPP
3.2.4 Small hydropower stations <1MW In the last years many more small hydropower stations have been evolved and
created in order to provide more electricity at a lower cost. Mainly the small HPPs have
the ability to be far cheaper and also cover a lot less space. This in conclusion means that
the effect that such stations have in their surroundings is less evasive. An average size of
small HPPs in Europe is around 1.2MW installed capacity, able to produce around 7GWh
per year. They are mostly situated in ravines and rivers but also in other infrastructures
like waste water treatment facilities or tunnels.
3.2.5 Other forms of electricity production from hydro
There are two other ways of electricity production using water, the ones that use
tidal and wave energy. They are connected to sea water movements. These plants are
currently in pilot phase and cannot be used as an example in a comparison.
3.3 Turbine types and application
3.3.1 Reaction turbines

23
The runners of the reaction turbines are placed under water and use the speed of
water (its kinetic energy) and pressure difference. They are used mainly at low (<30
meters) and medium head operations (30-300 meters)
Most common types of reaction turbines are:
Table 3.1: Reaction Turbines
Francis turbine • Most common water turbine
technology • 90% efficiency • Medium altitude • Medium water flow
Source
http://www.eternoohydro.com/turbines/francis-turbines.html
Figure 3.5: Francis Turbine
Kaplan turbine • Modification of Francis • Regulate flow/blades • High efficiency level • Smaller altitude head operations • Significant water flow
http://www.eternoohydro.com/turbines/axial-flow-
turbines.html
Figure 3.6: Kaplan Turbine

24
3.3.2 Impulse (action) turbines
Impulse turbines use the kinetic energy of free-falling water jet that is moved
through a nozzle to drive the turbine. They are not submerged into water like the reaction
turbines and do not use the difference of water pressure to work.
Table 3.2: Impulse Turbines
Pelton turbine • Water jet from high altitude • 92% efficiency • Very high altitude • Light water flow
http://www.eternoohydro.com/turbines/impulse-
turbines.html
Figure 3.7: Pelton Turbine
Table 3.3: Turbine Type and Head Classification
Head Classification
Turbine Type Impulse Reaction Gravity
High (>50) Pelton Turgo
Medium (10-50m)
Crossflow
Turgo Multi-jet Pelton
Low (<10m)
Crossflow Propeller Overshot waterwheel Undershot Kaplan
Waterwheel Francis Archimedes screw
Source: http://greenbugenergy.com/get-educated-knowledge/types-of-turbines

25
Source: http://greenbugenergy.com/get-educated-knowledge/types-of-turbines
Figure 3.8: Flow per type of Turbine
Source: http://greenbugenergy.com/wp-content/uploads/turbinetypes.jpg
Figure 3.9: Turbine Operation

26
3.4 Expected life and decommission In order to produce the results needed in this study we must also take into
consideration the useful life of such a project and also what happens after the
decommission stage and recycling of some if not all materials used in the initial
construction.
The actual lifespan of a hydro power plant is shown in the following Table 3.4. In
this table the period in which such a construction would be technically usable is shown
as a lower and upper limit in years.
Table 3.4: Expected life and decommission of a Power Plant [9]
Station/function unit Technical lifespan Aspects to be considered
Construction Dams, tubes, tunnels, caverns, reservoirs, artificial lakes, surge chambers
80-150 Duration of water rights, quality, decay, security, losses.
Buildings 50-80 General conditions, wear, quality, state of the art, security, corrosion, maintenance.
Water catchment, weir, pressure pipes, streets, bridges 40-60
Mechanical Parts Kaplan turbine 30-60
Security, losses, cavitation, erosion, corrosion, fatigue, reduction in efficiency, state of the art, quality, wear, load, construction
Pelton turbine 40-70 Pump turbine 25-40 Storage turbine 25-40 Valves 25-50 Cranes, other mechanical parts 25-50 Electrical Parts Generators 30-60
Condition of the parts, cleanness, wear, security, quality, maintenance
Transformers, high voltage facilities, other electrical facilities, monitoring system
30-40
Batteries 15-30
There are many factors that could affect mainly the technical lifespan of a big
undertaking such a hydro power plant, and that’s why there are differentiations between
storage power stations and run-of-river ones. Also, the speed a turbine turns and operates

27
plays a big factor in the lifespan of the materials. It is common that turbines with lower
RPM have a longer life than those operating faster. [10]
There isn’t that much of a long-term experience regarding hydropower stations and
what happens after they have been decommissioned, since the old ones that are already
built and are in usage have a smaller footprint and the big ones, like those in China which
are only as much as 20-30 years old. This means that there isn’t also much data available
about recycling and also disposal of a decommissioned power plant of such size.
Despite all this, it is assumed that the big constructions of such hydro power plants,
like the concrete dams and infrastructure will be abandoned at site and not deconstructed.
Also, we have to assume, that old and decommissioned power plants are supposed to be
replaced with newer ones after their life expectancy reaches the end. Old parts have to be
deconstructed in order to give place to new ones. The concrete dams although, are just
maintained throughout their lifetime.
In the specific study in this paper and according to the available data, it is to be
assumed that hydro power plants are used and then replaced. This is assumed to be
happening for all different kinds of HPP, such as reservoir, run of river and small plants.
Table 3.5 shows the resulting values that have been assumed in the current
calculation. They are produced from the values in Table 3.4 after being summarized and
averaged. The values are expressed in years.
Table 3.5: Average life and decommission of reference plant
Parameter Storage power station
Concrete 150
Reinforcing steel 150
Steel (rest) 80
Copper 150
Explosives (tovex) 250
Transport 150
Construction energy 150 Source “Life Cycle Inventories of Hydroelectric Power Generation, 2012” [9]

28

29
4 Life Cycle Assessment Life cycle assessment is the factual analysis of a product’s entire life cycle in terms
of sustainability. With LCA, we can evaluate the environmental impacts of the product
or service that we study from cradle to grave. From resource extraction and processing,
through construction, manufacturing and retail, distribution and use, repair and
maintenance, disposal and decommissioning as well as reuse and recycling. LCA uses the
idea of a standardized methodology, which helps make it reliable and transparent. The
standards are provided by the International Organization of Standardization (ISO) in ISO
14040 and ISO 14044 which also describe the following stages of an LCA.
When conducting an LCA, a product system is created on which aspects of
environmental use and resources are examined, mainly from the beginning (cradle) to the
end of the systems lifetime (grave). Three main aspects of a LCA are the following:
1. The whole system that has to be able to create, use and then dispose during the
system analysis.
2. The LCA does not study just one phase or an isolated operation, but the whole
cycle of a products supply chain.
3. The study gives out results about all environmental and health impacts and does
not focus on only one factor.
An LCA study can answer some very central questions. The impact a product
system has on the environment, which processes are the ones that evoke those
environmental impacts and also if there is an option for a product improvement towards
better efficiency and environmental goals.
4.1 Goal & Scope The goal and scope definition ensure that the LCA is performed consistently. The
LCA models a service, product or system life cycle. Using the LCA we are actually using
a simplification of a complex reality and this means that some results might be distorted
in some way. The challenge of the person doing the LCA is to develop the model in such
way that the simplifications or things that are taken into account don’t influence the
results too much. In order to achieve something like that the goal and scope of the LCA
study must be carefully defined.

30
In the goal and scope the most important (often subjective) choices are described,
such as the reason for executing the LCA, a precise definition of the product and its life
cycle, and a description of the system boundaries.
In this paper our goal and scope are to estimate the impacts of electricity
production/generation from a reference hydro power plant. In order to do that, a power
plant has to be modeled for the country of Greece and using data from literature and
primary data from the HPP site, results are obtained. A purpose of such a study is to gain
some insight of environmental impacts from such a way of power generation.
Some target audiences of such a study are parties with interest in environmental
impacts, such as government or potential clients and business associates. In cases where
renewable energy is used, as in this case, the results may also be used to compare different
methods of electricity production in order to achieve a conclusion om order to choose a
preferable method.
4.2 Inventory analysis In the inventory analysis, we look at all the environmental inputs and
outputs associated with a product or service, such as the use of raw materials and energy,
the emission of pollutants and the waste streams. This is where we get the whole picture
of what we are about to study.
For the data collection procedure, specific data is collected at the construction site
and also from other similar installations. Some data, like production and transport of
materials can be taken from a database like the Ecoinvent database used here.
4.3 Impact assessment In the life cycle impact assessment (LCIA), we are able to draw the conclusions
that allow us to make better business decisions. We can classify the environmental
impacts, evaluate them by what is most important to the company that asked for the LCA,
and translate them into environmental themes such as global warming or human health.
The most important choice to be made is the desired level of integration of the
results. This usually depends on how we would like to address the audience and the ability
of the audience to understand detailed results.

31
4.4 Interpretation During the interpretation phase, we check that the conclusions are well-
substantiated. The ISO 14040-14044 standard describe a number of checks to test whether
conclusions are adequately supported by the data and by the procedures used. This way,
we can share the obtained results and improvement decisions with the world without any
surprises.
4.5 Input data In order to run the LCA we have to create a reference hydro power plant. The one
we are going to use as a model is the HPP from the North East Complex. Platanovrisi.
This HPP has an installed capacity of 115MW which is an average size for a Country like
Greece. This also gives us the opportunity and ability to compare the results with other
electricity power plants using alternative fuels, like coal or even renewable sources.
The data used in order to conduct this LCA come from two categories. The first one
has data from the foreground, which includes efficiencies, technologies, installed
capacity, emissions etc. that have been obtained from technical reports, papers and
literature. They combine data from mainland Switzerland and also some modifications
for the non-alpine regions of Europe. The data does not show much differentiation
between Switzerland and Greece. This helps in order to keep the error as low as possible
while using data from another region. The background data have to do with raw material
extraction and acquisition, the transport of equipment and fuel needed as well as the
construction and decommission of the plant. Most of these are included in the Ecoinvent
database used with the openLCA software.
Figure 4.1: Visualization of an LCA study

32
4.6 Functional unit In order to get a correct interpretation of our data we have to create the reference
plant in such way, that we can compare our results with other studies. It is known that the
size of a reservoir and the electricity production from a specific sized turbine does not
produce linear results in the impact categories in study here. [11] This is why a functional
unit of “1 power plant” would mean nothing to the comparison between different sized
hydro power plants, as well as other electricity producing plants like lignite and natural
gas. This is why data for different hydro power plants around the European region are
gathered and then averaged in order to produce 1 reference power plant.
After that, the emissions are measured per 1kWh of electricity produced. This is
also the way to use other different studies and papers from other power plants as
mentioned before to find the main reasons for the emissions produced during the life cycle
of a power plant.
4.7 System boundaries In order to create a Life Cycle Assessment of a specific item, one must set the
system boundaries. This process shows us which processes in the products life cycle are
included in the LCA. In the Figure 4.2 the whole process shown, which consists of the
system boundaries of the study. Outside of these walls the effects are irrelevant.
Everything begins with the production of the raw materials, which then become the main
construction which is transported to the location site. After that the equipment is built
together with the power plant. In the end the output is kWh, which is then compared with
the emissions in question.
In the System Boundaries all core processes must be included. This means the
energy conversion process of the selected plant, including the need of operation and
maintenance, meaning oil, hydraulic liquids for the correct use of the machinery but also
possible emissions to the waterways. Electricity must also be taken into account during
the production but also operation phase.

33
Figure 4.2: System boundaries of Reference Power Plant
In the following Figure 4.4 the system boundaries of 3 different types of power
plants are presented and also compared. In the case of both coal and natural gas power
plants there is a significant amount of work needed in order to get the supply of the raw
materials.

34
In the case of coal power plant there is mining included in the system boundaries,
whereas in the natural gas power plant there is extraction. Both of these activities play a
major factor in the end results and affect the energy consumption and emissions. In the
case of the hydro plant, there is no fuel needed in order to run the plant, which means that
after the construction phase the operating costs, outside of maintenance, are miniscule
compared to those of traditional plants.
Figure 4.3: System Boundaries of different power plants

35
Figure 4.4: Map of Greece with HPP location
Source: The Hydroelectric production of PPC [7]
Source: The Hydroelectric production of PPC [7]
Figure 4.5: HPP Platanovrisi and Characteristics

36
The characteristics of the reference plan in Platanovrisi Greece are the following.[7]
It has a concrete dam with a height of 95 meters. It has been in operation since 1999 and
is mainly used for electricity production and irrigation. The dam can hold up to 57 million
cubic meters of water and can produce up to 240 GWh of electricity per year. The turbines
are of the Francis variety. There are two turbines operational, both of 58MW capacity
each.
4.8 LCA data quality limitations When preparing an LCA, the most important and demanding part of the study is the
collection of the input data. There are different options in data collection. Primary data
collected at the site and secondary data which are obtained from libraries and previous
studies. In the specific study of the reservoir non-alpine hydro power plant there is some
uncertainty because the data was limited and also referred to Europe and not specifically
Greece. Actions were taken in order to obtain the original data according to the site
location, as well as the specific turbines used in the power plant but was not successful.
Because of the limited primary data available, the Ecoinvent 3 database was used
which provided data as good as possible. The technologies used in Greece and in Europe
are very comparable. The production losses and the efficiency factors also were
comparable. Where data was not available at all, approximations where used from other
similar types of power plants. Generally, the data that was used was good and not too
much dated. They are good enough in order to be used for such a study obtained here.
Finally, there is also one more hurdle to cross and this has to do with the main
purpose of LCA itself and it being used as an environmental evaluation tool. An LCI
process is not expected to compare and cover all the environmental impacts of electricity
produced from hydropower. The LCA is mainly used to explain environmental burdens
in terms of energy and materials used.
4.9 Electricity from fossil fuels
In this paper the results will be compared to those from electricity produced from
two other different ways. Both those ways will be fossil fuels. The first being natural gas
and the second lignite. They are both very common types of fossil fuels still used

37
worldwide for the production of steam in order to turn turbines that in turn are connected
to a generator which produces electricity.
There are a lot of data available for each lignite and hard coal power plants around
the world. Greece has been using lignite, because it is easily accessible. In the past the
main electricity production came directly from lignite power plants. The plants that run
on lignite were also constructed next to the place where lignite was excavated in order to
keep costs low and help increase the value of it. In other cases, such as Germany where
hard coal is used, because its heating value (HV) is much higher than lignite there are
cases where transporting hard coal to the power plant is financially viable. Such an
example is in Hamburg Germany where hard coal is transported via boat from Russia
around 2-4 times per week (according to demand) to be used at the Plants. [12]
In the current study, for the comparison between electricity from hydro and fossil
fuels the data from Ecoinvent library have been used. An average efficiency of 52-55%
has been assumed for the case of natural gas plants. This is about the efficiency that a
combined cycle gas turbine is able to achieve.
Also, the data are assumed to be accurate in time and date. This means that no
technological advancements have occurred during the period of acquiring the data and
the date of the actual calculations via openLCA. This could also be such a case, since
technologies as hydropower and fossil energy are well established and also have very
long lifetimes, shown in the previous chapter.

38
Table 4.1: Input data openLCA 1 HPP Unit [9]
Inventory Data for non-alpine reservoir Hydropower Plant, Greece for the creation of one (1) Hydropower plant
Unit Process raw data product unit Comment St. Dev
1 chromium steel 18/8, at plant kg 1.82E+6 Used for the production of turbines
and generators 1.55
2 diesel, burned in building machine MJ 5.97E+7 Fuel for the construction of machinery 1.55
3 explosives, tovex, at plant kg 5.95E+5 Used to create tunnels and galleries at the beginning of construction 1.55
4 gravel, round, at mine kg 8.89E+8 Necessary for producing the concrete used for the construction of the dam and other building infrastructure
1.55
5 cement, unspecified, at plant kg 1.02E+8
Necessary for producing the concrete used for the construction of the dam and other building infrastructure
1.55
6 reinforcing steel, at plant kg 1.74E+6 Necessary for producing the concrete used for the construction of the dam and other building infrastructure
1.55
7 steel, low-alloyed, at plant kg 4.07E+6 Used for manufacturing of tubes and pipes 1.55
8 copper, at regional storage kg 2.96E+5 Used at electric cables transferring produced electricity 1.68
9 tap water, at use kg 5.65E+7 Necessary for producing the concrete used for the construction of the dam and other building infrastructure
1.55
10 electricity, medium voltage, ENTSO, at grid kWh 2.73E+7 Electricity supply for the construction
of the power plant 1.55
11 disposal, building, reinforced concrete, to recycling
kg (5.79E+7)* Recycling of reinforced infrastructure after expired lifetime 1.55
12 disposal, building, concrete, not reinforced, to final disposal
kg (9.36E+8)*
Non-enforced infrastructure left on-site at the end of the use phase of the power station. Mainly dam, tunnel, galleries
1,55
13 disposal, building, reinforcement steel, to recycling
kg (5.88E+6)* Recycling of turbines, generators, tubes and pipes. Recycling rate assumed at 100%
1,55
14 transport, lorry > 16t, fleet average tkm 4.78E+6 Transport of materials to the
construction site 2.62
15 transport, freight, rail tkm 2.61E+7 Transport of materials to the construction site 2.62
*Numbers in parentheses indicate negative amount (recycling)

39
Table 4.2: Input data openLCA 1kWh of Electricity from 1 HPP Unit [9]
Input data for the production of one (1) kWh of electricity from Hydropower plant in Greece
product unit Comment St. Dev
1 reservoir, hydropower plant, non-alpine region, GR unit 3.35E-11 Infrastructure of the storage power
station producing the electricity 4.72
2 Sulphur hexafluoride, liquid, at plant kg 3.40E-10 Used in electric insulation 2.09
3 lubricating oil, at plant kg 3.24E-8 Operation & Maintenance for the turbines 2.09
4 Transformation, from unknown m2 2.44E-4 Original area before the construction of the power station 3.02
5 Transformation, to water bodies, artificial m2 2.41E-4 Area covered by the reservoir 3.02
6 Transformation, to industrial area, built up m2 2.41E-6 Area covered by infrastructures other
than the held-back river 3.07
7 Occupation, water bodies, artificial m2a 3.62E-2 Area occupied by the reservoir 2.28 8 Occupation, industrial area, built up m2a 3.62E-4 Area occupied by the infrastructure 2.34 9 Volume occupied, reservoir m3a 1.64E+0 Volume occupied by the reservoir 1.67
10 Water, turbine use, unspecified natural origin m3a 1.40E+1 Amount of water the turbine uses for
the generation of electricity 1.67
11 Energy, potential (in hydropower reservoir), converted MJ 3.79E+0 Potential energy of the water 1.67

40

41
5 Results interpretation and comparison
5.1 Interpretation of results from hydropower plant
5.1.1 Global warming potential
In the following tables the Global warming potential (GWP) from electricity
production via hydropower is shown. The emissions are expressed in gram of CO2
equivalent per kWh of electricity produced. (g CO2-eq/kWh). This follows the method of
the functional unit that we have set at the beginning of the paper. It is one very effective
and simple way to express environmental results. This also helps with the interpretation
and also the comparison with other LCA studies.
The power plants that have been used in this paper for comparison are similar in
size (around the 100MW installed capacity size that we set) but produce electricity with
a different methodology. This is why the emissions are expressed in kWh of electricity
generated and not the installed capacity.
The greenhouse gas emissions produced from the hydroelectric reference plant in
North-Eastern Greece are 0,0176 kg CO2-eq/kWh. This amount is then split up into
categories in order to examine what part of the plant causes the most emissions. In a case
of a hydro plant it is expected that the construction phase plays the biggest role in the
emissions, since after that the use is supposed to be “fuel free”. Apart from the energy
needed to run the pumps during operation, the construction of the reservoir is the biggest
contributor to emissions.
Depending on the size of a dam and also the location of a power plant these
numbers can vary. It has also been shown in other studies that the emission results are not
linear to the size of an installed plant. Meaning doubling the size of the dam or the
installed capacity does not mean that the emissions will double as well. The kg of CO2
per kWh are produced via a very complicated algorithm and have to be calculated in each
case specifically. The problem with hydroelectric power plant installations is that most of
them, mainly in Europe, are old installations with very limited available data. This means
that there is some uncertainty when collecting results.

42
In conclusion the GWP of a power plant is influenced by many parameters, but an
LCA study can help with evaluating the carbon footprint of such a plant and help with its
comparison with other studies.
The GWP of the electricity generation from power plants running with natural gas
of an average size of 100MW installed capacity is calculated to be 0,93 kg CO2-eq/kWh
[15]. This immediately shows the difference between the emissions from natural gas and
how they are much greater than in the case of a hydro plant. This of course has to do with
the use of natural gas as fuel for combustion and then production of steam that is used to
turn the high, medium and low-pressure turbines that in turn are connected with a
generator to produce electricity. Even though a concrete dam construction is not needed
in a natural gas plant, the machinery and the creation of the whole plant, together with the
continuous need of fuel in order to produce electricity mitigates the fact.
In the case of a power plant using lignite the emissions calculated via the
openLCA software and the use of the Ecoinvent database give us the following results.
The global warming potential is measured to be 1,3 kg CO2-eq/kWh. This way of
electricity production has the biggest amount of emissions calculated, which is around 50
times more than the case of electricity produced from hydro. Lignite is one of the most
used fossil fuels and has also a very low heating value. This means that more fuel is
needed to produce the same amount of electricity, thus producing a lot more emissions.
Also burning fossil fuels produces significantly more harmful materials, like particulate
matter for example.
Some might consider natural gas to be also in the family of fossil fuels, since it
has to be extracted from the ground, but it is a very big improvement to lignite or other
types of hard coal, as the results also show. Natural Gas also doesn’t produce any Sulphur.
In the following Figure 5.1 the results of the LCA are produced. This figure shows
the environmental impacts in Greece from different electricity options.

43
Figure 5.1: GWP impact from electricity generation options in Greece.
The global warming potential of electricity production from hydro power can be
broken down into individual factors. In the next figure 5.2 the diagram shows the main
contributors of the emissions, which in turn sum up to the total amount of kg of CO2 eq.
per kWh of electricity produced from the reference plant. Mainly the operation of the
plant (electricity production) as well as the construction of the dam (concrete) play the
biggest role in the emissions of CO2.
17
920
1300
0
200
400
600
800
1000
1200
1400
GWP [g CO2-eq./kWh]
g/kWhEnvironmental Impacts for different electricity
options in Greece
Hydro Power Plant Natural Gas Power Plant Lignite Power Plant

44
Figure 5.2: GWP main contributors for hydro power
5.1.2 Acidification – Eutrophication potential
The acidification of 0,019 g SO2-eq / kWh is mainly due to SO2 of around 82%
and NOx emissions of 14%. This value is significantly smaller than this of electricity
production from lignite, 8,08g SO2-eq / kWh because using lignite brings in the equation
high Sulphur content and also some of the old power plants don’t have desulphurization
systems.
For eutrophication the results also show a big difference in emissions. A
hydroelectric power plant emits around 1,36 grams of PO4 equivalent per kWh, where a
natural gas power plant emits more than ten times this amount with 18 grams. In the case
of a lignite power plant the results are far more severe. Taking data from other LCA
studies into account, we can see that for a lignite PP the eutrophication potential rises
exponentially to around 1,46 kg of PO4 eq. per kWh. The main reason for these emissions
is the emission of phosphates during mining.
For the study the following two figures 5.3 and 5.4 show the main contributors to
the total emissions in both cases examining acidification and eutrophication. In both cases
72%
18%
5%
2%
2%
1%
GWP emissions from hydropower (kg CO2 eq./kWh)
Electricity production
Cement
Electricity voltagetransformationSteel production,chromium steelTreatment of waste
Diesel used in buildingmachine
Main contributors

45
mainly the cement for the construction of the dam as well as the electricity transformation
plays one of the biggest roles in the total amount of emissions.
Figure 5.3: Acidification main contributors for hydro power
30%
28%
10%
9%
7%
4%
3%3%
3%2%
1%
Acidification emissions from hydropower (kg SO2 eq./kWh)
Cement
Electricity voltagetransformationTreatment of waste
Steel production, chromiumsteelDiesel used in buildingmachineGravel and sand quarryoperationCopper production
Reinforcing steel production
Explosive production, tovex
Steel production, low-alloyed
Main contributors
55%
12%
11%
4%
4%
3%2%2%2%
2%2%
1%
Eutrophication emissions from hydropower (kg PO4 eq./kWh)
Electricity voltagetransformationCopper production
Cement
Treatment of waste
Steel production, chromiumsteelDiesel used in buildingmachineExplosive production, tovex
Reinforcing steel production
Electricity production fromhydro powerGravel and sand quarryoperation
Main contributors

46
Figure 5.4: Eutrophication main contributors for hydro power
In the Figure 5.5 a graphical representation of the results is created. It shows three
main categories studied in this paper. All impacts shown are expressed per 1 kWh of
electricity generated, which is the functional unit of the study. Under [GWP] is global
warming potential understood, where the emissions are calculated per kg of CO2
equivalent per kWh. With the notation AP the acidification potential is measured in
gramms of SO2 equivalent per kWh. Finally with EP we measure the eutrophication
potential in gramms per PO4 equivalent. Some rounding has been done in the final results
in order to accommodate a more cleaner look. Also some of the Y axis values have been
adjusted with multipliers in order to have all results in the same graph.
Having the results next to each other shows immediatelly the difference between
electricity production from fossil fuels and renewable hydro power.
Figure 5.5: Environmental impacts from electricity generation options in GR.
0.01
9
0.01
41.30
0.18
8.0
14.5
0
2
4
6
8
10
12
14
AP [g SO2-eq.] EP [g PO4-eq.]
g/kWhEnvironmental Impacts for different electricity options in
Greece
Hydro Power Plant Natural Gas Power Plant Lignite Power Plant
47
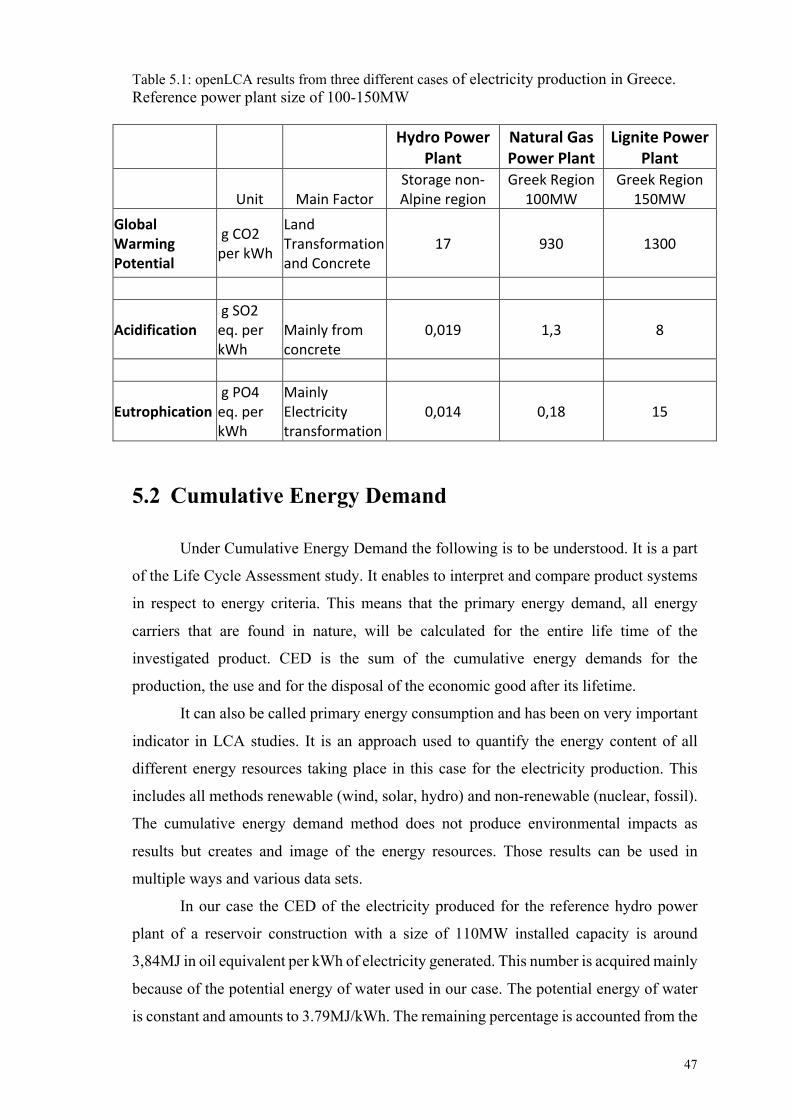
Table 5.1: openLCA results from three different cases of electricity production in Greece. Reference power plant size of 100-150MW
Hydro Power
Plant Natural Gas Power Plant
Lignite Power Plant
Unit Main Factor Storage non-Alpine region
Greek Region 100MW
Greek Region 150MW
Global Warming Potential
g CO2 per kWh
Land Transformation and Concrete
17 930 1300
Acidification g SO2 eq. per kWh
Mainly from concrete
0,019 1,3 8
Eutrophication g PO4 eq. per kWh
Mainly Electricity transformation
0,014 0,18 15
5.2 Cumulative Energy Demand Under Cumulative Energy Demand the following is to be understood. It is a part
of the Life Cycle Assessment study. It enables to interpret and compare product systems
in respect to energy criteria. This means that the primary energy demand, all energy
carriers that are found in nature, will be calculated for the entire life time of the
investigated product. CED is the sum of the cumulative energy demands for the
production, the use and for the disposal of the economic good after its lifetime.
It can also be called primary energy consumption and has been on very important
indicator in LCA studies. It is an approach used to quantify the energy content of all
different energy resources taking place in this case for the electricity production. This
includes all methods renewable (wind, solar, hydro) and non-renewable (nuclear, fossil).
The cumulative energy demand method does not produce environmental impacts as
results but creates and image of the energy resources. Those results can be used in
multiple ways and various data sets.
In our case the CED of the electricity produced for the reference hydro power
plant of a reservoir construction with a size of 110MW installed capacity is around
3,84MJ in oil equivalent per kWh of electricity generated. This number is acquired mainly
because of the potential energy of water used in our case. The potential energy of water
is constant and amounts to 3.79MJ/kWh. The remaining percentage is accounted from the

48
operation of the pumps, that their job is to fill the reservoir with excess water in cases that
such an operation is needed. Any electricity that is used for the operation of the power
plant, like the operation of the pumps has to be subtracted from the gross production of
the storage plant in order to get correct results.
Since most of the data used in the paper are secondary data, meaning they are
derived from inventories from Ecoinvent and also other studies, they are not 100%
complete. This means that for example the operation of the pumps and their electricity
consumption has not been taken into account.
In the case of a natural gas power plant, the reference Plant has the size of 100MW
and is also considered to be located in Greece. The results that we get show that the
cumulative energy demand of such a case has a bigger impact in comparison to the HPP.
The total amount accounts to 15,27MJ/kWh.
Similarly, the Lignite Power Plant has a CED of 20,21MJ/kWh. This case is the
most burdened and also follows what the literature shows for multiple cases around
Europe. The use of lignite, with its very low Heating Value (16,077 MJ/kg) means that
more fuel is needed in order to produce the same amount electricity that would be
generated by Natural gas for example, which has a heating value of between 42 and 55
MJ/kg.
Table 5.2: Cumulative energy demand (in MJ oil-eq./kWh) of the Hydro, Natural Gas and Lignite electricity generated in Greece.
Hydro Power Plant Natural Gas Power Plant Lignite Power Plant Storage non-Alpine region Greek Region 100MW Greek Region 150MW
Non Renewable
(MJ)
Fossil 0,042 15,2 19,95
Nuclear 0,0037 0,022 0,192
Renewable (MJ)
Solar 0,000019 7,30E-06 2,60E-05 Wind 0,00055 0,0019 0,013 Hydro 3,79 0,0105 0,036 Biomass 0,0006 0,0028 0,021
Total (MJ) 3,84 15,27 20,21
In the Table 5.2 above, the results of the Cumulative Energy Demand are shown.
In all three cases the results are divided into categories. The main two are renewable and
non-renewable sources. Under the renewable “umbrella” four categories are taken into
account. Solar, Wind, Hydro and Biomass. In the three cases studied here solar and

49
biomass don’t contribute much for the CED. On the other side in the case of a hydro
power plant, as mentioned before, the potential energy of water accounts for around 99%
of the energy demand. (also shown in the Figure 5.6). The remaining 1% from the non-
renewable categories of nuclear and mainly fossil is due to the electricity consumption of
the pumps. In bigger dams where the pumps have to work harder to feed more water to
the reservoir this amount is bigger and can account to around 10% of the total energy
demand. Infrastructure also plays a role but also small in comparison to the potential
energy of water.
In the case of the power plants that use fossil fuels, the results are the exact
opposite. Renewable sources like water, solar and wind play a very insignificant role of
around 1%. The remaining 99% cumulative energy demand of electricity generated via
lignite or natural gas is from the non-renewable part.
Figure 5.6: CED from electricity Production via Hydropower, Case Greece
1% 0,3%
3,79 MJ98,7%
Fossil
Nuclear
Hydro
Cumulative Energy Demand

50
Table 5.3: Cumulative energy demand (in MJ/kWh) in Greece of the Hydro, Natural Gas and Lignite electricity generated.
Non-Renewable (MJ) Fossil 0,042 Nuclear 0,0037
Renewable (MJ) Wind 0,00055 Hydro 3,79
Total (MJ) 3,84
Shown in the Figure 5.7 is a comparison between the three methods of electricity
production, where the difference between renewable and non-renewable sources of CED
is specifically shown. As explained above, both fossil fuel plants have a much bigger
cumulative energy demand in comparison to hydro power.
Figure 5.7: CED results comparison between three different cases.

51
The results in all three cases are following the literature that was studied for the
preparation of this paper. In cases of Life Cycle Assessment for various different power
plants around Europe, storage hydro power plants have a cumulative energy demand of
around 3,80MJ, which would be almost all because of the potential energy of water and
up to 15MJ of oil equivalent per kWh in cases of pumped storage hydro plants. In the
specific case of a pumped storage hydroelectric power plant, almost all of the CED is due
to the electricity consumption of the pumps needed to pump the water up to the reservoir.
Table 5.4: CED results comparison between three different cases.
Hydro Power
Plant Natural Gas Power
Plant Lignite Power
Plant
Fossil 0,042 15,24 19,95
Nuclear 0,0037 0,022 0,192
Renewable 3,794 0,0153 0,07
5.3 Comparing results to literature
The results that openLCA was able to produce, as stated before, mainly consisted
of data from the Ecoinvent database. In the case of a hydropower station study, data are
quite scarce and also outdated. In order to verify the results a comparison with literature
was conducted. The literature in question was other different European studies about
mixed electricity production options. In the following two figures, 5.9 and 5.10 the
comparison of the results is presented.
The main bars show the results acquired from a study made in Turkey where all
available energy methods were assessed. The impacts in question are global warming
potential, acidification and eutrophication. The black bars are a European upper and lower
limit. These average numbers have been produced with comparing and also averaging the
results of different studies across Europe.
In order to get the average results for the European union 12 studies were included.
For the hydropower 5 of those studies were about dam-reservoirs and 7 with run-of-river
plants. Most of the emissions were generally linked to the infrastructure of each project.
In the case of dam-reservoirs there is an important aspect in each study, mainly the

52
methane emissions because of the decomposition of flooded organic matter. This happens
because of the land transformation where a dam is created. All of these results also depend
very much on the size of the infrastructure (size of dam and water depth) as well as the
kind of flooded vegetation and soil type. Climate also is a big factor.
Finally, emissions for NOx and SO2 were caused because of the dam construction,
which means that those emissions are related to the size of the project and the generation
capacity of each plant.
With the red dots the results of this study are presented. As we can see all of the
results that the openLCA software produced are well within the European range of the
available literature. This helps with assessing correctly the environmental impact of the
reference power plant. There is always some error when doing an LCA because of the
very big input inventory, but the results in this case have been in order.
Figure 5.8: Comparing results to literature, hydropower. [13]
Results from hydropower

53
Figure 5.9: Comparing results to literature, lignite and natural gas. [13]
5.4 Advantages of electricity production from RES They are virtually inexhaustible sources of energy and can help reduce our reliance
on conventional energy sources like coal. They usually have low operating costs which
are also more importantly not affected by fluctuations in the international economy or
politics at a given time. RES investment creates a significant amount of new jobs,
especially at the local level. Finally, they are as we have mentioned many times
environmentally friendly and their use is generally accepted by the public.
Hydroelectric power stations can be switched on as soon as possible when
additional electricity is requested, which cannot happen with thermal stations (coal, oil)
which require preparation for startup. Hydropower is also a domestic source of energy
and contributes to the strengthening of energy independence and the security of energy
supply on a national level. Many have said that it can be the nucleus of revitalization
Results from fossil fuels

54
economically and socially of forgotten areas and can also contribute to local development
through investments.
5.5 Disadvantages of electricity production from RES On the other hand, renewable energy sources, and production via hydro have some
significant disadvantages. Mainly they are quite scarce in energy density, that’s why
extensive facilities are required to produce the same amount of output energy. The
investment cost per unit of installed capacity compared to current conventional fuel prices
is still significantly high.
Drawbacks of a hydro power plant installation are mainly the initial costs of
building dams and equipment for the station in order to produce the electricity. The
projects usually also have a very long duration until completion. There are cases of strong
environmental alteration of the reservoir area, possibly population shifting and land use
change. The new idea is to try and create more small dams which would accommodate
smaller hydro plants but would help avoid all these risks.
In a hydropower installation the main drawback is also the emissions produced from
the soil under water because of inundation. Because at every new construction where a
dam is created the surface changes very significantly, all those changes have their own
effect on the environment. The soil contains organic compounds that are slowly broken
down and then released into the atmosphere. These carbon compounds are then broken
down to CO2 or simply carbon dioxide. This happens with the help of the acid in the
water. The biggest impact occurs during the construction of such a big installation. After
that the effects are quite minimal, only due to the operation and the maintenance of the
site.
5.6 Alternative ways to produce electricity
5.6.1 Solar-Wind Energy There are many other ways to produce electricity. Studies show that the way of
the future will be renewable energy sources. The main idea is to try and decouple from
the need of fossil fuels for the future. Fossil fuels are easy to use, the infrastructure is
already there, and technology has somewhat improved during the years, but there is no
doubt after so many studies that industry and powerplants are the main reason of global

55
warming and the change of the Earth. The way to change is to try and rely more on
renewables but also find a way to make them more efficient.
The problem with renewable energy such as solar, wind and some cases hydro are
that they are not always available. Also, when they actually become available, sometimes
they are not all exploited to the maximum. In order to achieve more with renewables and
to integrate them more in the everyday system there is need for an efficient way to store
energy when it is available in order to use it when renewables cannot produce, like during
the night, when the weather is not good or there is not enough water.
One of the main ideas for storage has been the use of batteries. This means
converting the energy that is available and not used into chemical energy and storing it in
batteries. There are such solutions already, but most are quite expensive and not that
efficient.

56

57
6 Conclusions To assess the sustainability of an energy system, the environmental indicators must
be investigated. Global warming is the first indicator that comes to mind, but there are
other important ones as well. In this study the environmental impacts throughout the life
of a hydro power plant have been evaluated conducting a process-based life cycle
assessment.
Greece has the potential to produce electricity from many different sources, including
lignite, natural gas, solar and in our case hydro. [7] After accessing the impacts from the
categories selected, it is shown that the hydropower energy option has a lower effect as
an option in electricity production compared to other traditional non-renewable options
such as lignite and natural gas.
In this current study it is shown that lignite has the highest impacts for the three
categories selected. Gas power comes second with some categories being similar to
lignite but performs better because of the smaller amount of Sulphur in the natural gas
used as the main fuel. In cases where a non-renewable fossil power plant is used in a
combined way, producing electricity and useable heat the results may become better but
still it performs worse than a hydro power plant [14].
The results from this study have shown that electricity production from renewable
sources, in this case hydro, is better and less impactful for the environment compared to
old fossil fuel technologies. It was a result that was expected, since taking into account a
long-life use of such a construction, having the ability to use a fuel that is simply free,
immediately mitigates the impact during the construction phase. In a next paper maybe
just the renewable options (solar, wind, small hydro) could be studied in order to access
which one of these would be the new technology to follow for the future.
Taking the results of the cumulative energy demand (CED) into account as well, we
have another indicator of how a renewable source like hydro power functions. In the case
of the lignite and natural gas plants, the CED is much higher and depends almost fully to
non-renewable elements, whereas in the case of hydro electricity production the main part
of the CED is because of the potential energy of water itself.
Finally, the main problem with such studies is that the LCA tool is quite new for
Greece, which means there are not that many similar studies, examining the impact of
different pollution mechanisms. Combined with the fact that many storage hydro plants
are old, and the available data is minimal or either missing, means that while the results

58
have an impact and show a picture about how electricity is produced and its effect on the
environment, there is still much room for improvement. Together with the literature
reviewed in this paper, it is quite clear that there is a significant variation of results
depending on the location of the study. What the results show though is that they can be
actually taken into account in the decision-making process, when there is consideration
for a new development of a new electricity project.
Finally, it is worth mentioning that in the case of a hydro plant there are other
important factors to consider that were not available in this study because of lack of data,
such as water continuity, quality, supply of nutrients as well as their transport but also the
need for people to relocate because of the construction of the dam and in hindsight the
flooding of the area. Future studies should be done in order to balance these kinds of
projects in terms of sustainability.

59
Bibliography [1] European Commission, Communication “Tackling challenges in the commodity markets and on raw materials”, COM (2011)25, 02 February 2011 [2] Krewitt W. Feedback on background paper. Available at: In: International workshop on electricity data for life cycle inventories. Cincinnati: Sylvatica www.sylvatica.com; 2001. Consulted on 01/18/2002. [3] Renewable energy technologies for sustainable development of energy efficient building - Arvind Chel, Geetanjali Kaushik; 2017 [4] Marla Barnes is Chief Editor, Hydro Group, for PennWell Corporation; (1) 816-931-1311, ext. 106 [5] Eurostat, data of primary production of renewable energy by type, 2016 https://ec.europa.eu/eurostat/tgm/table.do?pcode=ten00081&language=en [6] European Commission, New Energy Externalities Development for Sustainability, NEEDS, 2008, NEEDS project [7] Technical Chamber of Greece – The hydroelectric production of the Greek PPC – Ioannis Argyrakis, Director Management of Hydroelectric Generation, 2010 [8] KPMG, Energy and Natural Resources – Central and Eastern European Hydro Power Outlook, Peter Kiss; 2010 [9] Karin Flury, Rolf Frischknecht, Öko-Institute e.V. Life Cycle Inventories of Hydroelectric Power Generation; 2012 [10] Ito M, Kato K, Komoto K, Kichimi T, Kurokawa K. A comparative study on cost and life-cycle analysis for 100 MW very large-scale PV (VLS-PV) systems in deserts using m-Si, a-Si, CdTe, and CIS modules, Progress in Photovoltaics: Research and Applications. 16 (2008) 17–30. [11] Gagnon L, Be΄langer C, Uchyama Y. Life-cycle assessment of electricity generation options: the status of research in year 2001 [12] Vattenfall, Life‐cycle assessment. Vattenfall’s electricity in Sweden, 2005 [13] Atilgan, B.; Azapagic, A. Assessing the Environmental Sustainability of Electricity Generation in Turkey on a Life Cycle Basis. Energies 2016, 9, 31. [14] Vattenfall, Vattenfall’s life‐cycle studies of electricity, 1999 [15] European Commission. Wind and hydro. In: ExternE – externalities of energy, vol. 6. Luxemburg: Office for Official Publications of the European Communities; 1995

60
[16] Parliamentary Office of Science and Technology (POST), Houses of Parliament (UK), Carbon footprint of electricity generation, Number 268, October 2006, [17] Parliamentary Office of Science and Technology (POST), Houses of Parliament (UK), Carbon footprint of electricity generation, Number 383, June 2011, http://www.parliament.uk/documents/post/postpn_383‐carbon‐footprintelectricity‐ generation.pdf [18] IPPC, Special Report on Renewable Energy Sources and Climate Change Mitigation (SRREN), 2011, Special Report on Renewable Energy Sources and Climate Change Mitigation — SRREN [19] Gagnon (L.), Greenhouse gas emissions from power generation options, January 2003, http://www.hydroquebec.com/sustainabledevelopment/ documentation/pdf/options_energetiques/pop_01_06.pdf [20] Weber (Ch.), Jaramillo (P.), Marriott (J.), Samaras (C.), Life‐cycle assessment and grid electricity: what do we know and what can we know? Environmental Science and Technology (2010), pp 1895‐1901, World Energy Council (a special report to the), Comparison of energy systems using life cycle assessment, July 2004, http://www.worldenergy.org/documents/lca2.pdf [21] International Energy Agency, Electricity Information 2010, 2010. [22] Bergerson J, Lave L. Life cycle analysis of power generation systems, Encyclopaedia of Energy. 3 (2004) 635–645. [23] Dones R, Heck R, Hirschberg S. Greenhouse Gas Emissions from Energy Systems, Comparison and Overview, Encyclopaedia of Energy. 3 (2004) 77–95. [24] Varun, Bhat IK, Ravi Prakash. LCA of renewable energy for electricity generation systems- A review, Renewable and Sustainable Energy Reviews. 13 (2009) 1067–1073. [25] Sims REH, Schock RN, Adegbululgbe A, Fenhann J, Konstantinaviciute I, Moomaw W, Nimir HB, Schlamadinger B, Torres-Martinez J, Turner C, Uchiyama Y, Vuori SVJ, Wamukonya N, Zhang X. Energy supply. In Climate Change 2007: Mitigation, Fourth Assessment Report of the Intergovernmental Panel on Climate Change. (2007). [26] Lund C, Biswas W. A Review of the Application of Lifecycle Analysis to Renewable Energy Systems, Bulletin of Science, Technology & Society. 28 (2008) 200–209. [27] Van De Vate J. Comparison of energy sources in terms of their full energy chain emission factors of greenhouse gases, Energy Policy. 25 (1997) 1–6. [28] Weisser D. A guide to life-cycle greenhouse gas (GHG) emissions from electric supply technologies, Energy. 32 (2007) 1543–1559. [29] Finnveden G, Ekvall T. Life-cycle assessment as a decision-support tool — the case of recycling versus incineration of paper, Resources, Conservation and Recycling. 24 (1998) 235–256.

61
[30] Clarke L, Edmonds J, Jacoby J, Pitcher H, Reilly J, Richels R, Parson E, Burkett V, Fisher-Vanden K, Keith D, Mearns L, Rosenzweig C, Webster M. CCSP, 2007: Scenarios of Greenhouse Gas Emissions and Atmospheric Concentrations (Part A) and Review of Integrated Scenario Development and Application (Part B). A Report by the U.S. Climate Change Science Program and the Subcommittee on Global Change Res, Washington, DC., USA, 2007. [31] Finnveden G, Hauschild MZ, Ekvall T, Guinée J, Heijungs R, Hellweg S, Koehler A, Pennington D, Suh S. Recent developments in Life Cycle Assessment., Journal of Environmental Management. 91 (2009) 1–21. [32] Weidema BP, Thrane M, Christensen P, Schmidt J, Løkke S. Carbon Footprint, Journal of Industrial Ecology. 12 (2008) 3–6. [33] Spadaro JV, Langlois L, Hamilton B. GREENHOUSE GAS EMISSIONS OF ELECTRICITY GENERATION CHAINS - Assessing the difference, IAEA BULLETIN. 42 (2000) 2. [34] Carrington G, A study of the Lake Chelan hydroelectric project based on Lifecycle stressor-effects assessment, SCS – scientific certification systems, Lake Cheelan; 2000. [35] Meier PJ. Life-Cycle Assessment of Electricity Generation Systems and Applications for Climate Change Policy Analysis, 2002. [36] Edenhofer O, Pichs-Madruga R, Sokona Y, Seyboth K, Matschoss P, Kadner S, Zwickel T, Eickemeier P, Hansen G, Schlömer S, von Stechow C. IPCC Special Report on Renewable Energy Sources and Climate Change Mitigation, 2011. [37] ISO, EN ISO 14040 Environmental management – Life cycle assessment – Principles and framework, 2006. [38] Canadian Energy Research Institute (CERI), Comparative Life Cycle Assessment (LCA) of base load electricity generation in Ontario, Prepared for the Canadian Nuclear Association, October 2008, [39] World Wind Energy Association WWEA, World Wind Energy Report 2009, Bonn, Germany, 2009. [40] ISO, EN ISO 14044 Environmental management – Life cycle assessment – Requirements and guidelines, 2006. [41] Whitaker M, Heath GA, O’Donoughue P, Vorum M. Life Cycle Greenhouse Gas Emissions of Coal-Fired Electricity Generation: Systematic Review and Harmonization, Journal of Industrial Ecology. 16 (2012). [42] Warner ES, Heath GA. Life Cycle Greenhouse Gas Emissions of Nuclear Electricity Generation: Systematic Review and Harmonization, Journal of Industrial Ecology. 16 (2012). [43] Kim HC, Fthenakis V, Choi JK, Turney DE, Life Cycle Greenhouse Gas Emissions of Thin-film Photovoltaic Electricity Generation, Journal of Industrial Ecology. 16 (2012)

62
[44] http://www.cna.ca/english/pdf/studies/ceri/CERI‐ComparativeLCA.pdf [45] World Atlas. Corporate Site. Available at: http://www.world-atlas.us/southamerica. htm. Consulted on 14/04/2008 [46] OECD – Organization for Economic Cooperation and Development. Highlights: synthesis of the issue. In: Expert workshop on life-cycle analysis of energy systems, methods and experiences. Paris: OECD; 1992 [47] European Commission - Joint Research Centre - Institute for Environment and Sustainability, EC-JRC, International Reference Life Cycle Data System (ILCD) Handbook - General guide for Life Cycle Assessment - Detailed guidance, Luxembourg, Publications Office of the European Union, 2010. [48] Denholm (P.), Kulcinski (G.P.), Holloway (T.), Emissions and energy efficiency assessment of baseload wind energy systems, Environmental Science and Technology, 2005, pp. 1903‐1911 [49] Gagnon (L.), Energy payback ratio of electricity generation options based on lifecycle assessments, July 2005, http://www.hydroquebec.com/sustainabledevelopment/ documentation/pdf/options_energetiques/rendement_investissement.pdf [50] International Organisation for Standardisation (ISO), ISO 14040 (2006): Environmental management – Life cycle assessment – Principles and framework, and ISO 14044 (2006): Environmental management – Life cycle assessment – Requirements and guidelines

63
Appendix 1. Software representation of power plant in openLCA software

64
2. Reference hydroelectric power plant in Greece

65
3. Natural gas power plant, 100MW installed capacity

66
4. Lignite power plant, 100MW installed capacity

67
5 Graphical results obtained from openLCA software about three impact categories
Global warming potential Acidification

68
Eutrophication

69