[email protected] Approximations for Min Connected Sensor Cover Ding-Zhu Du University of Texas...
36
[email protected] Approximations for Min Connected Sensor Cover Ding-Zhu Du University of Texas at Dallas
-
Upload
vanesa-jenkin -
Category
Documents
-
view
217 -
download
0
Transcript of [email protected] Approximations for Min Connected Sensor Cover Ding-Zhu Du University of Texas...

lidongwuutdallasedu
Approximations for Min Connected Sensor Cover
Ding-Zhu DuUniversity of Texas at Dallas
Outline
I Introduction
II Two Approximations
III Final Remarks
Have you watched movie Twister
sensorBucket ofsensors
tornado
Where are all the sensors
Smartphone with a dozen of sensors
Where are all the sensors
Wearable devices - Google Glass Applersquos iWatch
Buildings
Where are all the sensors
Transportation systems etc
Where are all the sensors
Sensor Web
Large of simple sensors Usually deployed randomly Multi-hop wireless link Distributed routing No infrastructure Collect data and send it to base station
Applications of Senor Web
observerAn example of sensor web
Whatrsquos Sensor
Small size Large number Tether- lessBUThellip
Whatrsquos limiting the task
Energy Sense Communication scale
CPU
Challenge
Target is Covered
Sensor system is Connected
Coverage amp Connectivity
Golden Rule then we say
System is alive
Coverage amp Connectivity
Communication Range
Sensing Range
d le Rs
sensor
target
communication radius
sensing radius
Rc
Rs
Coverage amp Connectivity
Communication Range
Sensing Range
d le Rs
d le Rc
sensor
target
communication radius
sensing radius
Rc
Rs
Min-Connected Sensor Cover Problem
Figure Min-CSC Problem
A uniform set of sensors and a target area
Find a minimum of sensors
to meet two requirements
[Coverage] cover the target area and
[Connectivity] form a connected communication network
[Resource Saving]
communicationnetwork
sensing disks
Previous Work for PTAS
Itrsquos NP-hard
Ο(r ln n) ndash approximation given by Gupta Das and Gu [MobiHocrsquo03 2003] where n is the number of sensors and r is the link radius of the sensor network
Min-Connected Sensor Cover Problem
Outline
I Introduction
II Two Approximations
III Final Remarks
Main Results
Random algorithm
Ο(log3n log log n)-approximation n is the
number of sensors
Partition algorithm
Ο(r)-approximation r is the link radius of the
network
Connected
Sensor Cover with Target
Area
Connected
Sensor Cover
with Target Points
With a random algorithm which with probability 1- ɛ produces an Ο(log3n log log n) - approximation
1
Algorithm 1
Group
Steiner Tree
2Min-CSC Min-CTC GST
1 2Min-CSC Min-CTC GST
1 2Min-CSC Min-CTC GST
How to map to GST
Min-Connected Sensor Cover Problem
A uniform set of sensors and a target area
Find a minimum of sensors
to meet two requirements
[Coverage] cover the target area and
[Connectivity] form a connected communication network
1 2Min-CSC Min-CTC GST
How to map to GST
Min-Connected Target Coverage Problem
A uniform set of sensors and a target POINTS
Find a minimum of sensors
to meet two requirements
[Coverage] cover the target POINTS and
[Connectivity] form a connected communication network
1 2Min-CSC Min-CTC GST
A graph G = (V E) with positive edge weight c for every edge e isin E
k subsets (or groups) of vertices G1Gk Gi sube V
Find a minimum total weight tree T contains at least one vertex in each Gi
Group Steiner Tree
Figure GST ProblemThis tree has minimum weight
1 2Min-CSC Min-CTC GST
Choose at least one sensor from each group
Coverage
b3
b1
b2
b6
b5
b4
S1S2
S3S4
b7
b2 b6b3 b4b1 b5 b7
S1 S2
S1 S3
S1 S2 S3
S2 S3
S2 S4
S3 S4
Gi contains all sensors covering bi
S2 S3 S4
1 2Min-CSC Min-CTC GST
b3
b1
b2
b6
b5
b4
S1S2
S3S4
b7
Consider communication network
Connectivity
b2 b6b3 b4b1 b5 b7
S1 S2
S1 S3
S1 S2 S3
S2 S3
S2 S4
S3 S4
Gi contains all sensors covering bi
S2 S3 S4
1 2Min-CSC Min-CTC GST
b3
b1
b2
b6
b5
b4
S1S2
S3S4
b7
Find a group Steiner tree in communication network
Min-Coverage amp Connectivity
b2 b6b3 b4b1 b5 b7
S1 S2
S1 S3
S1 S2 S3
S2 S3
S2 S4
S3 S4
Gi contains all sensors covering bi
S2 S3 S4
1 2Min-CSC Min-CTC GST
Garg Konjevod and Ravi [SODA 2000] showed with probability 1- ε an approximation solution of GROUP STEINER TREE on tree metric T is within a factor of Ο(log2 n log log n log k) from optimal
What Is Link Radius
3 example In this onintersecti sensing
nonempty having sensors twoof distancefor boundupper least theis radiuslink
r
r
Communication disk
Sensing disk
Connected
Sensor Cover with Target
Area
Connected
Sensor Cover
with Target Points
Connect output of Min-TC into Min-CTC It can be done in Ο(r) - approximation
1
Algorithm 2
2Min-CSC Min-CTC Min-TC
Refer to Lidong Wursquos paper [INFOCOM 2013rsquo]
There exists a polynomial-time (1 + ε)- approximation for MIN-TC
Green is an opt (CTC)
Red is an approx (TC)
lt (1+ε) opt (TC) lt (1+ε) opt (CTC)
Step 2 Target Coverage
Byrka et al [6] showed there exists a polynomial-time139-approximation of for Network Steiner Minimum Tree
Green is an opt (CTC)
Red is an approx (TC)
Step 2 Network Steiner Tree
Let Sprime sube S be a (1 + ε)-approximation for MIN-TC Assign
weight one to every edge of G Interconnect sensors in Sprime to
compute a Steiner tree T as network Steiner minimum tree
All sensors on the tree form an approxfor min CTC
nodes approx for min CTC= edges +1 approx for Network STlt 139 opt (Network ST) +1lt 139 opt (CTC) + 1
Step 2 Network Steiner Tree
Green is an opt (CTC)
Red is an approx (TC)
Each orange line has distance lt r
opt (Network ST)
lt opt (CTC) -1 + r = opt (CTC) O(r)
Note lt (1+ε) opt (CTC)
Outline
I Introduction
II Two Approximations
III Final Remarks
Future Works
Ο(log3n log log n)
n is the number of sensors
1 Unknown Relationship
2 Constant-appro for Min-CSC
Ο(r)
r is the link radius
THANK YOU
- Slide 1
- Slide 2
- Slide 3
- Slide 4
- Slide 5
- Slide 6
- Slide 7
- Slide 8
- Slide 9
- Slide 10
- Slide 11
- Slide 12
- Slide 13
- Slide 14
- Slide 15
- Slide 16
- Slide 17
- Slide 18
- Slide 19
- Slide 20
- Slide 21
- Slide 22
- Slide 23
- Slide 24
- Slide 25
- Slide 26
- Slide 27
- Slide 28
- What Is Link Radius
- Slide 30
- Slide 31
- Slide 32
- Slide 33
- Slide 34
- Slide 35
- Slide 36
-

Outline
I Introduction
II Two Approximations
III Final Remarks
Have you watched movie Twister
sensorBucket ofsensors
tornado
Where are all the sensors
Smartphone with a dozen of sensors
Where are all the sensors
Wearable devices - Google Glass Applersquos iWatch
Buildings
Where are all the sensors
Transportation systems etc
Where are all the sensors
Sensor Web
Large of simple sensors Usually deployed randomly Multi-hop wireless link Distributed routing No infrastructure Collect data and send it to base station
Applications of Senor Web
observerAn example of sensor web
Whatrsquos Sensor
Small size Large number Tether- lessBUThellip
Whatrsquos limiting the task
Energy Sense Communication scale
CPU
Challenge
Target is Covered
Sensor system is Connected
Coverage amp Connectivity
Golden Rule then we say
System is alive
Coverage amp Connectivity
Communication Range
Sensing Range
d le Rs
sensor
target
communication radius
sensing radius
Rc
Rs
Coverage amp Connectivity
Communication Range
Sensing Range
d le Rs
d le Rc
sensor
target
communication radius
sensing radius
Rc
Rs
Min-Connected Sensor Cover Problem
Figure Min-CSC Problem
A uniform set of sensors and a target area
Find a minimum of sensors
to meet two requirements
[Coverage] cover the target area and
[Connectivity] form a connected communication network
[Resource Saving]
communicationnetwork
sensing disks
Previous Work for PTAS
Itrsquos NP-hard
Ο(r ln n) ndash approximation given by Gupta Das and Gu [MobiHocrsquo03 2003] where n is the number of sensors and r is the link radius of the sensor network
Min-Connected Sensor Cover Problem
Outline
I Introduction
II Two Approximations
III Final Remarks
Main Results
Random algorithm
Ο(log3n log log n)-approximation n is the
number of sensors
Partition algorithm
Ο(r)-approximation r is the link radius of the
network
Connected
Sensor Cover with Target
Area
Connected
Sensor Cover
with Target Points
With a random algorithm which with probability 1- ɛ produces an Ο(log3n log log n) - approximation
1
Algorithm 1
Group
Steiner Tree
2Min-CSC Min-CTC GST
1 2Min-CSC Min-CTC GST
1 2Min-CSC Min-CTC GST
How to map to GST
Min-Connected Sensor Cover Problem
A uniform set of sensors and a target area
Find a minimum of sensors
to meet two requirements
[Coverage] cover the target area and
[Connectivity] form a connected communication network
1 2Min-CSC Min-CTC GST
How to map to GST
Min-Connected Target Coverage Problem
A uniform set of sensors and a target POINTS
Find a minimum of sensors
to meet two requirements
[Coverage] cover the target POINTS and
[Connectivity] form a connected communication network
1 2Min-CSC Min-CTC GST
A graph G = (V E) with positive edge weight c for every edge e isin E
k subsets (or groups) of vertices G1Gk Gi sube V
Find a minimum total weight tree T contains at least one vertex in each Gi
Group Steiner Tree
Figure GST ProblemThis tree has minimum weight
1 2Min-CSC Min-CTC GST
Choose at least one sensor from each group
Coverage
b3
b1
b2
b6
b5
b4
S1S2
S3S4
b7
b2 b6b3 b4b1 b5 b7
S1 S2
S1 S3
S1 S2 S3
S2 S3
S2 S4
S3 S4
Gi contains all sensors covering bi
S2 S3 S4
1 2Min-CSC Min-CTC GST
b3
b1
b2
b6
b5
b4
S1S2
S3S4
b7
Consider communication network
Connectivity
b2 b6b3 b4b1 b5 b7
S1 S2
S1 S3
S1 S2 S3
S2 S3
S2 S4
S3 S4
Gi contains all sensors covering bi
S2 S3 S4
1 2Min-CSC Min-CTC GST
b3
b1
b2
b6
b5
b4
S1S2
S3S4
b7
Find a group Steiner tree in communication network
Min-Coverage amp Connectivity
b2 b6b3 b4b1 b5 b7
S1 S2
S1 S3
S1 S2 S3
S2 S3
S2 S4
S3 S4
Gi contains all sensors covering bi
S2 S3 S4
1 2Min-CSC Min-CTC GST
Garg Konjevod and Ravi [SODA 2000] showed with probability 1- ε an approximation solution of GROUP STEINER TREE on tree metric T is within a factor of Ο(log2 n log log n log k) from optimal
What Is Link Radius
3 example In this onintersecti sensing
nonempty having sensors twoof distancefor boundupper least theis radiuslink
r
r
Communication disk
Sensing disk
Connected
Sensor Cover with Target
Area
Connected
Sensor Cover
with Target Points
Connect output of Min-TC into Min-CTC It can be done in Ο(r) - approximation
1
Algorithm 2
2Min-CSC Min-CTC Min-TC
Refer to Lidong Wursquos paper [INFOCOM 2013rsquo]
There exists a polynomial-time (1 + ε)- approximation for MIN-TC
Green is an opt (CTC)
Red is an approx (TC)
lt (1+ε) opt (TC) lt (1+ε) opt (CTC)
Step 2 Target Coverage
Byrka et al [6] showed there exists a polynomial-time139-approximation of for Network Steiner Minimum Tree
Green is an opt (CTC)
Red is an approx (TC)
Step 2 Network Steiner Tree
Let Sprime sube S be a (1 + ε)-approximation for MIN-TC Assign
weight one to every edge of G Interconnect sensors in Sprime to
compute a Steiner tree T as network Steiner minimum tree
All sensors on the tree form an approxfor min CTC
nodes approx for min CTC= edges +1 approx for Network STlt 139 opt (Network ST) +1lt 139 opt (CTC) + 1
Step 2 Network Steiner Tree
Green is an opt (CTC)
Red is an approx (TC)
Each orange line has distance lt r
opt (Network ST)
lt opt (CTC) -1 + r = opt (CTC) O(r)
Note lt (1+ε) opt (CTC)
Outline
I Introduction
II Two Approximations
III Final Remarks
Future Works
Ο(log3n log log n)
n is the number of sensors
1 Unknown Relationship
2 Constant-appro for Min-CSC
Ο(r)
r is the link radius
THANK YOU
- Slide 1
- Slide 2
- Slide 3
- Slide 4
- Slide 5
- Slide 6
- Slide 7
- Slide 8
- Slide 9
- Slide 10
- Slide 11
- Slide 12
- Slide 13
- Slide 14
- Slide 15
- Slide 16
- Slide 17
- Slide 18
- Slide 19
- Slide 20
- Slide 21
- Slide 22
- Slide 23
- Slide 24
- Slide 25
- Slide 26
- Slide 27
- Slide 28
- What Is Link Radius
- Slide 30
- Slide 31
- Slide 32
- Slide 33
- Slide 34
- Slide 35
- Slide 36
-

Where are all the sensors
Wearable devices - Google Glass Applersquos iWatch
Buildings
Where are all the sensors
Transportation systems etc
Where are all the sensors
Sensor Web
Large of simple sensors Usually deployed randomly Multi-hop wireless link Distributed routing No infrastructure Collect data and send it to base station
Applications of Senor Web
observerAn example of sensor web
Whatrsquos Sensor
Small size Large number Tether- lessBUThellip
Whatrsquos limiting the task
Energy Sense Communication scale
CPU
Challenge
Target is Covered
Sensor system is Connected
Coverage amp Connectivity
Golden Rule then we say
System is alive
Coverage amp Connectivity
Communication Range
Sensing Range
d le Rs
sensor
target
communication radius
sensing radius
Rc
Rs
Coverage amp Connectivity
Communication Range
Sensing Range
d le Rs
d le Rc
sensor
target
communication radius
sensing radius
Rc
Rs
Min-Connected Sensor Cover Problem
Figure Min-CSC Problem
A uniform set of sensors and a target area
Find a minimum of sensors
to meet two requirements
[Coverage] cover the target area and
[Connectivity] form a connected communication network
[Resource Saving]
communicationnetwork
sensing disks
Previous Work for PTAS
Itrsquos NP-hard
Ο(r ln n) ndash approximation given by Gupta Das and Gu [MobiHocrsquo03 2003] where n is the number of sensors and r is the link radius of the sensor network
Min-Connected Sensor Cover Problem
Outline
I Introduction
II Two Approximations
III Final Remarks
Main Results
Random algorithm
Ο(log3n log log n)-approximation n is the
number of sensors
Partition algorithm
Ο(r)-approximation r is the link radius of the
network
Connected
Sensor Cover with Target
Area
Connected
Sensor Cover
with Target Points
With a random algorithm which with probability 1- ɛ produces an Ο(log3n log log n) - approximation
1
Algorithm 1
Group
Steiner Tree
2Min-CSC Min-CTC GST
1 2Min-CSC Min-CTC GST
1 2Min-CSC Min-CTC GST
How to map to GST
Min-Connected Sensor Cover Problem
A uniform set of sensors and a target area
Find a minimum of sensors
to meet two requirements
[Coverage] cover the target area and
[Connectivity] form a connected communication network
1 2Min-CSC Min-CTC GST
How to map to GST
Min-Connected Target Coverage Problem
A uniform set of sensors and a target POINTS
Find a minimum of sensors
to meet two requirements
[Coverage] cover the target POINTS and
[Connectivity] form a connected communication network
1 2Min-CSC Min-CTC GST
A graph G = (V E) with positive edge weight c for every edge e isin E
k subsets (or groups) of vertices G1Gk Gi sube V
Find a minimum total weight tree T contains at least one vertex in each Gi
Group Steiner Tree
Figure GST ProblemThis tree has minimum weight
1 2Min-CSC Min-CTC GST
Choose at least one sensor from each group
Coverage
b3
b1
b2
b6
b5
b4
S1S2
S3S4
b7
b2 b6b3 b4b1 b5 b7
S1 S2
S1 S3
S1 S2 S3
S2 S3
S2 S4
S3 S4
Gi contains all sensors covering bi
S2 S3 S4
1 2Min-CSC Min-CTC GST
b3
b1
b2
b6
b5
b4
S1S2
S3S4
b7
Consider communication network
Connectivity
b2 b6b3 b4b1 b5 b7
S1 S2
S1 S3
S1 S2 S3
S2 S3
S2 S4
S3 S4
Gi contains all sensors covering bi
S2 S3 S4
1 2Min-CSC Min-CTC GST
b3
b1
b2
b6
b5
b4
S1S2
S3S4
b7
Find a group Steiner tree in communication network
Min-Coverage amp Connectivity
b2 b6b3 b4b1 b5 b7
S1 S2
S1 S3
S1 S2 S3
S2 S3
S2 S4
S3 S4
Gi contains all sensors covering bi
S2 S3 S4
1 2Min-CSC Min-CTC GST
Garg Konjevod and Ravi [SODA 2000] showed with probability 1- ε an approximation solution of GROUP STEINER TREE on tree metric T is within a factor of Ο(log2 n log log n log k) from optimal
What Is Link Radius
3 example In this onintersecti sensing
nonempty having sensors twoof distancefor boundupper least theis radiuslink
r
r
Communication disk
Sensing disk
Connected
Sensor Cover with Target
Area
Connected
Sensor Cover
with Target Points
Connect output of Min-TC into Min-CTC It can be done in Ο(r) - approximation
1
Algorithm 2
2Min-CSC Min-CTC Min-TC
Refer to Lidong Wursquos paper [INFOCOM 2013rsquo]
There exists a polynomial-time (1 + ε)- approximation for MIN-TC
Green is an opt (CTC)
Red is an approx (TC)
lt (1+ε) opt (TC) lt (1+ε) opt (CTC)
Step 2 Target Coverage
Byrka et al [6] showed there exists a polynomial-time139-approximation of for Network Steiner Minimum Tree
Green is an opt (CTC)
Red is an approx (TC)
Step 2 Network Steiner Tree
Let Sprime sube S be a (1 + ε)-approximation for MIN-TC Assign
weight one to every edge of G Interconnect sensors in Sprime to
compute a Steiner tree T as network Steiner minimum tree
All sensors on the tree form an approxfor min CTC
nodes approx for min CTC= edges +1 approx for Network STlt 139 opt (Network ST) +1lt 139 opt (CTC) + 1
Step 2 Network Steiner Tree
Green is an opt (CTC)
Red is an approx (TC)
Each orange line has distance lt r
opt (Network ST)
lt opt (CTC) -1 + r = opt (CTC) O(r)
Note lt (1+ε) opt (CTC)
Outline
I Introduction
II Two Approximations
III Final Remarks
Future Works
Ο(log3n log log n)
n is the number of sensors
1 Unknown Relationship
2 Constant-appro for Min-CSC
Ο(r)
r is the link radius
THANK YOU
- Slide 1
- Slide 2
- Slide 3
- Slide 4
- Slide 5
- Slide 6
- Slide 7
- Slide 8
- Slide 9
- Slide 10
- Slide 11
- Slide 12
- Slide 13
- Slide 14
- Slide 15
- Slide 16
- Slide 17
- Slide 18
- Slide 19
- Slide 20
- Slide 21
- Slide 22
- Slide 23
- Slide 24
- Slide 25
- Slide 26
- Slide 27
- Slide 28
- What Is Link Radius
- Slide 30
- Slide 31
- Slide 32
- Slide 33
- Slide 34
- Slide 35
- Slide 36
-
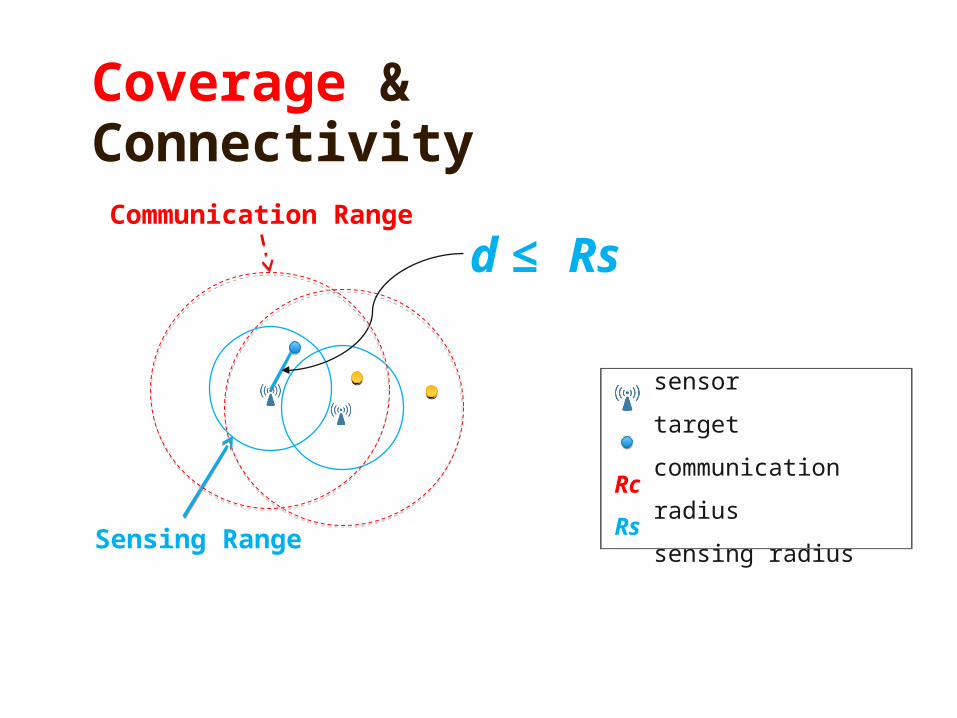
Coverage amp Connectivity
Communication Range
Sensing Range
d le Rs
sensor
target
communication radius
sensing radius
Rc
Rs
Coverage amp Connectivity
Communication Range
Sensing Range
d le Rs
d le Rc
sensor
target
communication radius
sensing radius
Rc
Rs
Min-Connected Sensor Cover Problem
Figure Min-CSC Problem
A uniform set of sensors and a target area
Find a minimum of sensors
to meet two requirements
[Coverage] cover the target area and
[Connectivity] form a connected communication network
[Resource Saving]
communicationnetwork
sensing disks
Previous Work for PTAS
Itrsquos NP-hard
Ο(r ln n) ndash approximation given by Gupta Das and Gu [MobiHocrsquo03 2003] where n is the number of sensors and r is the link radius of the sensor network
Min-Connected Sensor Cover Problem
Outline
I Introduction
II Two Approximations
III Final Remarks
Main Results
Random algorithm
Ο(log3n log log n)-approximation n is the
number of sensors
Partition algorithm
Ο(r)-approximation r is the link radius of the
network
Connected
Sensor Cover with Target
Area
Connected
Sensor Cover
with Target Points
With a random algorithm which with probability 1- ɛ produces an Ο(log3n log log n) - approximation
1
Algorithm 1
Group
Steiner Tree
2Min-CSC Min-CTC GST
1 2Min-CSC Min-CTC GST
1 2Min-CSC Min-CTC GST
How to map to GST
Min-Connected Sensor Cover Problem
A uniform set of sensors and a target area
Find a minimum of sensors
to meet two requirements
[Coverage] cover the target area and
[Connectivity] form a connected communication network
1 2Min-CSC Min-CTC GST
How to map to GST
Min-Connected Target Coverage Problem
A uniform set of sensors and a target POINTS
Find a minimum of sensors
to meet two requirements
[Coverage] cover the target POINTS and
[Connectivity] form a connected communication network
1 2Min-CSC Min-CTC GST
A graph G = (V E) with positive edge weight c for every edge e isin E
k subsets (or groups) of vertices G1Gk Gi sube V
Find a minimum total weight tree T contains at least one vertex in each Gi
Group Steiner Tree
Figure GST ProblemThis tree has minimum weight
1 2Min-CSC Min-CTC GST
Choose at least one sensor from each group
Coverage
b3
b1
b2
b6
b5
b4
S1S2
S3S4
b7
b2 b6b3 b4b1 b5 b7
S1 S2
S1 S3
S1 S2 S3
S2 S3
S2 S4
S3 S4
Gi contains all sensors covering bi
S2 S3 S4
1 2Min-CSC Min-CTC GST
b3
b1
b2
b6
b5
b4
S1S2
S3S4
b7
Consider communication network
Connectivity
b2 b6b3 b4b1 b5 b7
S1 S2
S1 S3
S1 S2 S3
S2 S3
S2 S4
S3 S4
Gi contains all sensors covering bi
S2 S3 S4
1 2Min-CSC Min-CTC GST
b3
b1
b2
b6
b5
b4
S1S2
S3S4
b7
Find a group Steiner tree in communication network
Min-Coverage amp Connectivity
b2 b6b3 b4b1 b5 b7
S1 S2
S1 S3
S1 S2 S3
S2 S3
S2 S4
S3 S4
Gi contains all sensors covering bi
S2 S3 S4
1 2Min-CSC Min-CTC GST
Garg Konjevod and Ravi [SODA 2000] showed with probability 1- ε an approximation solution of GROUP STEINER TREE on tree metric T is within a factor of Ο(log2 n log log n log k) from optimal
What Is Link Radius
3 example In this onintersecti sensing
nonempty having sensors twoof distancefor boundupper least theis radiuslink
r
r
Communication disk
Sensing disk
Connected
Sensor Cover with Target
Area
Connected
Sensor Cover
with Target Points
Connect output of Min-TC into Min-CTC It can be done in Ο(r) - approximation
1
Algorithm 2
2Min-CSC Min-CTC Min-TC
Refer to Lidong Wursquos paper [INFOCOM 2013rsquo]
There exists a polynomial-time (1 + ε)- approximation for MIN-TC
Green is an opt (CTC)
Red is an approx (TC)
lt (1+ε) opt (TC) lt (1+ε) opt (CTC)
Step 2 Target Coverage
Byrka et al [6] showed there exists a polynomial-time139-approximation of for Network Steiner Minimum Tree
Green is an opt (CTC)
Red is an approx (TC)
Step 2 Network Steiner Tree
Let Sprime sube S be a (1 + ε)-approximation for MIN-TC Assign
weight one to every edge of G Interconnect sensors in Sprime to
compute a Steiner tree T as network Steiner minimum tree
All sensors on the tree form an approxfor min CTC
nodes approx for min CTC= edges +1 approx for Network STlt 139 opt (Network ST) +1lt 139 opt (CTC) + 1
Step 2 Network Steiner Tree
Green is an opt (CTC)
Red is an approx (TC)
Each orange line has distance lt r
opt (Network ST)
lt opt (CTC) -1 + r = opt (CTC) O(r)
Note lt (1+ε) opt (CTC)
Outline
I Introduction
II Two Approximations
III Final Remarks
Future Works
Ο(log3n log log n)
n is the number of sensors
1 Unknown Relationship
2 Constant-appro for Min-CSC
Ο(r)
r is the link radius
THANK YOU
- Slide 1
- Slide 2
- Slide 3
- Slide 4
- Slide 5
- Slide 6
- Slide 7
- Slide 8
- Slide 9
- Slide 10
- Slide 11
- Slide 12
- Slide 13
- Slide 14
- Slide 15
- Slide 16
- Slide 17
- Slide 18
- Slide 19
- Slide 20
- Slide 21
- Slide 22
- Slide 23
- Slide 24
- Slide 25
- Slide 26
- Slide 27
- Slide 28
- What Is Link Radius
- Slide 30
- Slide 31
- Slide 32
- Slide 33
- Slide 34
- Slide 35
- Slide 36
-

Coverage amp Connectivity
Communication Range
Sensing Range
d le Rs
d le Rc
sensor
target
communication radius
sensing radius
Rc
Rs
Min-Connected Sensor Cover Problem
Figure Min-CSC Problem
A uniform set of sensors and a target area
Find a minimum of sensors
to meet two requirements
[Coverage] cover the target area and
[Connectivity] form a connected communication network
[Resource Saving]
communicationnetwork
sensing disks
Previous Work for PTAS
Itrsquos NP-hard
Ο(r ln n) ndash approximation given by Gupta Das and Gu [MobiHocrsquo03 2003] where n is the number of sensors and r is the link radius of the sensor network
Min-Connected Sensor Cover Problem
Outline
I Introduction
II Two Approximations
III Final Remarks
Main Results
Random algorithm
Ο(log3n log log n)-approximation n is the
number of sensors
Partition algorithm
Ο(r)-approximation r is the link radius of the
network
Connected
Sensor Cover with Target
Area
Connected
Sensor Cover
with Target Points
With a random algorithm which with probability 1- ɛ produces an Ο(log3n log log n) - approximation
1
Algorithm 1
Group
Steiner Tree
2Min-CSC Min-CTC GST
1 2Min-CSC Min-CTC GST
1 2Min-CSC Min-CTC GST
How to map to GST
Min-Connected Sensor Cover Problem
A uniform set of sensors and a target area
Find a minimum of sensors
to meet two requirements
[Coverage] cover the target area and
[Connectivity] form a connected communication network
1 2Min-CSC Min-CTC GST
How to map to GST
Min-Connected Target Coverage Problem
A uniform set of sensors and a target POINTS
Find a minimum of sensors
to meet two requirements
[Coverage] cover the target POINTS and
[Connectivity] form a connected communication network
1 2Min-CSC Min-CTC GST
A graph G = (V E) with positive edge weight c for every edge e isin E
k subsets (or groups) of vertices G1Gk Gi sube V
Find a minimum total weight tree T contains at least one vertex in each Gi
Group Steiner Tree
Figure GST ProblemThis tree has minimum weight
1 2Min-CSC Min-CTC GST
Choose at least one sensor from each group
Coverage
b3
b1
b2
b6
b5
b4
S1S2
S3S4
b7
b2 b6b3 b4b1 b5 b7
S1 S2
S1 S3
S1 S2 S3
S2 S3
S2 S4
S3 S4
Gi contains all sensors covering bi
S2 S3 S4
1 2Min-CSC Min-CTC GST
b3
b1
b2
b6
b5
b4
S1S2
S3S4
b7
Consider communication network
Connectivity
b2 b6b3 b4b1 b5 b7
S1 S2
S1 S3
S1 S2 S3
S2 S3
S2 S4
S3 S4
Gi contains all sensors covering bi
S2 S3 S4
1 2Min-CSC Min-CTC GST
b3
b1
b2
b6
b5
b4
S1S2
S3S4
b7
Find a group Steiner tree in communication network
Min-Coverage amp Connectivity
b2 b6b3 b4b1 b5 b7
S1 S2
S1 S3
S1 S2 S3
S2 S3
S2 S4
S3 S4
Gi contains all sensors covering bi
S2 S3 S4
1 2Min-CSC Min-CTC GST
Garg Konjevod and Ravi [SODA 2000] showed with probability 1- ε an approximation solution of GROUP STEINER TREE on tree metric T is within a factor of Ο(log2 n log log n log k) from optimal
What Is Link Radius
3 example In this onintersecti sensing
nonempty having sensors twoof distancefor boundupper least theis radiuslink
r
r
Communication disk
Sensing disk
Connected
Sensor Cover with Target
Area
Connected
Sensor Cover
with Target Points
Connect output of Min-TC into Min-CTC It can be done in Ο(r) - approximation
1
Algorithm 2
2Min-CSC Min-CTC Min-TC
Refer to Lidong Wursquos paper [INFOCOM 2013rsquo]
There exists a polynomial-time (1 + ε)- approximation for MIN-TC
Green is an opt (CTC)
Red is an approx (TC)
lt (1+ε) opt (TC) lt (1+ε) opt (CTC)
Step 2 Target Coverage
Byrka et al [6] showed there exists a polynomial-time139-approximation of for Network Steiner Minimum Tree
Green is an opt (CTC)
Red is an approx (TC)
Step 2 Network Steiner Tree
Let Sprime sube S be a (1 + ε)-approximation for MIN-TC Assign
weight one to every edge of G Interconnect sensors in Sprime to
compute a Steiner tree T as network Steiner minimum tree
All sensors on the tree form an approxfor min CTC
nodes approx for min CTC= edges +1 approx for Network STlt 139 opt (Network ST) +1lt 139 opt (CTC) + 1
Step 2 Network Steiner Tree
Green is an opt (CTC)
Red is an approx (TC)
Each orange line has distance lt r
opt (Network ST)
lt opt (CTC) -1 + r = opt (CTC) O(r)
Note lt (1+ε) opt (CTC)
Outline
I Introduction
II Two Approximations
III Final Remarks
Future Works
Ο(log3n log log n)
n is the number of sensors
1 Unknown Relationship
2 Constant-appro for Min-CSC
Ο(r)
r is the link radius
THANK YOU
- Slide 1
- Slide 2
- Slide 3
- Slide 4
- Slide 5
- Slide 6
- Slide 7
- Slide 8
- Slide 9
- Slide 10
- Slide 11
- Slide 12
- Slide 13
- Slide 14
- Slide 15
- Slide 16
- Slide 17
- Slide 18
- Slide 19
- Slide 20
- Slide 21
- Slide 22
- Slide 23
- Slide 24
- Slide 25
- Slide 26
- Slide 27
- Slide 28
- What Is Link Radius
- Slide 30
- Slide 31
- Slide 32
- Slide 33
- Slide 34
- Slide 35
- Slide 36
-

Min-Connected Sensor Cover Problem
Figure Min-CSC Problem
A uniform set of sensors and a target area
Find a minimum of sensors
to meet two requirements
[Coverage] cover the target area and
[Connectivity] form a connected communication network
[Resource Saving]
communicationnetwork
sensing disks
Previous Work for PTAS
Itrsquos NP-hard
Ο(r ln n) ndash approximation given by Gupta Das and Gu [MobiHocrsquo03 2003] where n is the number of sensors and r is the link radius of the sensor network
Min-Connected Sensor Cover Problem
Outline
I Introduction
II Two Approximations
III Final Remarks
Main Results
Random algorithm
Ο(log3n log log n)-approximation n is the
number of sensors
Partition algorithm
Ο(r)-approximation r is the link radius of the
network
Connected
Sensor Cover with Target
Area
Connected
Sensor Cover
with Target Points
With a random algorithm which with probability 1- ɛ produces an Ο(log3n log log n) - approximation
1
Algorithm 1
Group
Steiner Tree
2Min-CSC Min-CTC GST
1 2Min-CSC Min-CTC GST
1 2Min-CSC Min-CTC GST
How to map to GST
Min-Connected Sensor Cover Problem
A uniform set of sensors and a target area
Find a minimum of sensors
to meet two requirements
[Coverage] cover the target area and
[Connectivity] form a connected communication network
1 2Min-CSC Min-CTC GST
How to map to GST
Min-Connected Target Coverage Problem
A uniform set of sensors and a target POINTS
Find a minimum of sensors
to meet two requirements
[Coverage] cover the target POINTS and
[Connectivity] form a connected communication network
1 2Min-CSC Min-CTC GST
A graph G = (V E) with positive edge weight c for every edge e isin E
k subsets (or groups) of vertices G1Gk Gi sube V
Find a minimum total weight tree T contains at least one vertex in each Gi
Group Steiner Tree
Figure GST ProblemThis tree has minimum weight
1 2Min-CSC Min-CTC GST
Choose at least one sensor from each group
Coverage
b3
b1
b2
b6
b5
b4
S1S2
S3S4
b7
b2 b6b3 b4b1 b5 b7
S1 S2
S1 S3
S1 S2 S3
S2 S3
S2 S4
S3 S4
Gi contains all sensors covering bi
S2 S3 S4
1 2Min-CSC Min-CTC GST
b3
b1
b2
b6
b5
b4
S1S2
S3S4
b7
Consider communication network
Connectivity
b2 b6b3 b4b1 b5 b7
S1 S2
S1 S3
S1 S2 S3
S2 S3
S2 S4
S3 S4
Gi contains all sensors covering bi
S2 S3 S4
1 2Min-CSC Min-CTC GST
b3
b1
b2
b6
b5
b4
S1S2
S3S4
b7
Find a group Steiner tree in communication network
Min-Coverage amp Connectivity
b2 b6b3 b4b1 b5 b7
S1 S2
S1 S3
S1 S2 S3
S2 S3
S2 S4
S3 S4
Gi contains all sensors covering bi
S2 S3 S4
1 2Min-CSC Min-CTC GST
Garg Konjevod and Ravi [SODA 2000] showed with probability 1- ε an approximation solution of GROUP STEINER TREE on tree metric T is within a factor of Ο(log2 n log log n log k) from optimal
What Is Link Radius
3 example In this onintersecti sensing
nonempty having sensors twoof distancefor boundupper least theis radiuslink
r
r
Communication disk
Sensing disk
Connected
Sensor Cover with Target
Area
Connected
Sensor Cover
with Target Points
Connect output of Min-TC into Min-CTC It can be done in Ο(r) - approximation
1
Algorithm 2
2Min-CSC Min-CTC Min-TC
Refer to Lidong Wursquos paper [INFOCOM 2013rsquo]
There exists a polynomial-time (1 + ε)- approximation for MIN-TC
Green is an opt (CTC)
Red is an approx (TC)
lt (1+ε) opt (TC) lt (1+ε) opt (CTC)
Step 2 Target Coverage
Byrka et al [6] showed there exists a polynomial-time139-approximation of for Network Steiner Minimum Tree
Green is an opt (CTC)
Red is an approx (TC)
Step 2 Network Steiner Tree
Let Sprime sube S be a (1 + ε)-approximation for MIN-TC Assign
weight one to every edge of G Interconnect sensors in Sprime to
compute a Steiner tree T as network Steiner minimum tree
All sensors on the tree form an approxfor min CTC
nodes approx for min CTC= edges +1 approx for Network STlt 139 opt (Network ST) +1lt 139 opt (CTC) + 1
Step 2 Network Steiner Tree
Green is an opt (CTC)
Red is an approx (TC)
Each orange line has distance lt r
opt (Network ST)
lt opt (CTC) -1 + r = opt (CTC) O(r)
Note lt (1+ε) opt (CTC)
Outline
I Introduction
II Two Approximations
III Final Remarks
Future Works
Ο(log3n log log n)
n is the number of sensors
1 Unknown Relationship
2 Constant-appro for Min-CSC
Ο(r)
r is the link radius
THANK YOU
- Slide 1
- Slide 2
- Slide 3
- Slide 4
- Slide 5
- Slide 6
- Slide 7
- Slide 8
- Slide 9
- Slide 10
- Slide 11
- Slide 12
- Slide 13
- Slide 14
- Slide 15
- Slide 16
- Slide 17
- Slide 18
- Slide 19
- Slide 20
- Slide 21
- Slide 22
- Slide 23
- Slide 24
- Slide 25
- Slide 26
- Slide 27
- Slide 28
- What Is Link Radius
- Slide 30
- Slide 31
- Slide 32
- Slide 33
- Slide 34
- Slide 35
- Slide 36
-

Outline
I Introduction
II Two Approximations
III Final Remarks
Main Results
Random algorithm
Ο(log3n log log n)-approximation n is the
number of sensors
Partition algorithm
Ο(r)-approximation r is the link radius of the
network
Connected
Sensor Cover with Target
Area
Connected
Sensor Cover
with Target Points
With a random algorithm which with probability 1- ɛ produces an Ο(log3n log log n) - approximation
1
Algorithm 1
Group
Steiner Tree
2Min-CSC Min-CTC GST
1 2Min-CSC Min-CTC GST
1 2Min-CSC Min-CTC GST
How to map to GST
Min-Connected Sensor Cover Problem
A uniform set of sensors and a target area
Find a minimum of sensors
to meet two requirements
[Coverage] cover the target area and
[Connectivity] form a connected communication network
1 2Min-CSC Min-CTC GST
How to map to GST
Min-Connected Target Coverage Problem
A uniform set of sensors and a target POINTS
Find a minimum of sensors
to meet two requirements
[Coverage] cover the target POINTS and
[Connectivity] form a connected communication network
1 2Min-CSC Min-CTC GST
A graph G = (V E) with positive edge weight c for every edge e isin E
k subsets (or groups) of vertices G1Gk Gi sube V
Find a minimum total weight tree T contains at least one vertex in each Gi
Group Steiner Tree
Figure GST ProblemThis tree has minimum weight
1 2Min-CSC Min-CTC GST
Choose at least one sensor from each group
Coverage
b3
b1
b2
b6
b5
b4
S1S2
S3S4
b7
b2 b6b3 b4b1 b5 b7
S1 S2
S1 S3
S1 S2 S3
S2 S3
S2 S4
S3 S4
Gi contains all sensors covering bi
S2 S3 S4
1 2Min-CSC Min-CTC GST
b3
b1
b2
b6
b5
b4
S1S2
S3S4
b7
Consider communication network
Connectivity
b2 b6b3 b4b1 b5 b7
S1 S2
S1 S3
S1 S2 S3
S2 S3
S2 S4
S3 S4
Gi contains all sensors covering bi
S2 S3 S4
1 2Min-CSC Min-CTC GST
b3
b1
b2
b6
b5
b4
S1S2
S3S4
b7
Find a group Steiner tree in communication network
Min-Coverage amp Connectivity
b2 b6b3 b4b1 b5 b7
S1 S2
S1 S3
S1 S2 S3
S2 S3
S2 S4
S3 S4
Gi contains all sensors covering bi
S2 S3 S4
1 2Min-CSC Min-CTC GST
Garg Konjevod and Ravi [SODA 2000] showed with probability 1- ε an approximation solution of GROUP STEINER TREE on tree metric T is within a factor of Ο(log2 n log log n log k) from optimal
What Is Link Radius
3 example In this onintersecti sensing
nonempty having sensors twoof distancefor boundupper least theis radiuslink
r
r
Communication disk
Sensing disk
Connected
Sensor Cover with Target
Area
Connected
Sensor Cover
with Target Points
Connect output of Min-TC into Min-CTC It can be done in Ο(r) - approximation
1
Algorithm 2
2Min-CSC Min-CTC Min-TC
Refer to Lidong Wursquos paper [INFOCOM 2013rsquo]
There exists a polynomial-time (1 + ε)- approximation for MIN-TC
Green is an opt (CTC)
Red is an approx (TC)
lt (1+ε) opt (TC) lt (1+ε) opt (CTC)
Step 2 Target Coverage
Byrka et al [6] showed there exists a polynomial-time139-approximation of for Network Steiner Minimum Tree
Green is an opt (CTC)
Red is an approx (TC)
Step 2 Network Steiner Tree
Let Sprime sube S be a (1 + ε)-approximation for MIN-TC Assign
weight one to every edge of G Interconnect sensors in Sprime to
compute a Steiner tree T as network Steiner minimum tree
All sensors on the tree form an approxfor min CTC
nodes approx for min CTC= edges +1 approx for Network STlt 139 opt (Network ST) +1lt 139 opt (CTC) + 1
Step 2 Network Steiner Tree
Green is an opt (CTC)
Red is an approx (TC)
Each orange line has distance lt r
opt (Network ST)
lt opt (CTC) -1 + r = opt (CTC) O(r)
Note lt (1+ε) opt (CTC)
Outline
I Introduction
II Two Approximations
III Final Remarks
Future Works
Ο(log3n log log n)
n is the number of sensors
1 Unknown Relationship
2 Constant-appro for Min-CSC
Ο(r)
r is the link radius
THANK YOU
- Slide 1
- Slide 2
- Slide 3
- Slide 4
- Slide 5
- Slide 6
- Slide 7
- Slide 8
- Slide 9
- Slide 10
- Slide 11
- Slide 12
- Slide 13
- Slide 14
- Slide 15
- Slide 16
- Slide 17
- Slide 18
- Slide 19
- Slide 20
- Slide 21
- Slide 22
- Slide 23
- Slide 24
- Slide 25
- Slide 26
- Slide 27
- Slide 28
- What Is Link Radius
- Slide 30
- Slide 31
- Slide 32
- Slide 33
- Slide 34
- Slide 35
- Slide 36
-

Connected
Sensor Cover with Target
Area
Connected
Sensor Cover
with Target Points
With a random algorithm which with probability 1- ɛ produces an Ο(log3n log log n) - approximation
1
Algorithm 1
Group
Steiner Tree
2Min-CSC Min-CTC GST
1 2Min-CSC Min-CTC GST
1 2Min-CSC Min-CTC GST
How to map to GST
Min-Connected Sensor Cover Problem
A uniform set of sensors and a target area
Find a minimum of sensors
to meet two requirements
[Coverage] cover the target area and
[Connectivity] form a connected communication network
1 2Min-CSC Min-CTC GST
How to map to GST
Min-Connected Target Coverage Problem
A uniform set of sensors and a target POINTS
Find a minimum of sensors
to meet two requirements
[Coverage] cover the target POINTS and
[Connectivity] form a connected communication network
1 2Min-CSC Min-CTC GST
A graph G = (V E) with positive edge weight c for every edge e isin E
k subsets (or groups) of vertices G1Gk Gi sube V
Find a minimum total weight tree T contains at least one vertex in each Gi
Group Steiner Tree
Figure GST ProblemThis tree has minimum weight
1 2Min-CSC Min-CTC GST
Choose at least one sensor from each group
Coverage
b3
b1
b2
b6
b5
b4
S1S2
S3S4
b7
b2 b6b3 b4b1 b5 b7
S1 S2
S1 S3
S1 S2 S3
S2 S3
S2 S4
S3 S4
Gi contains all sensors covering bi
S2 S3 S4
1 2Min-CSC Min-CTC GST
b3
b1
b2
b6
b5
b4
S1S2
S3S4
b7
Consider communication network
Connectivity
b2 b6b3 b4b1 b5 b7
S1 S2
S1 S3
S1 S2 S3
S2 S3
S2 S4
S3 S4
Gi contains all sensors covering bi
S2 S3 S4
1 2Min-CSC Min-CTC GST
b3
b1
b2
b6
b5
b4
S1S2
S3S4
b7
Find a group Steiner tree in communication network
Min-Coverage amp Connectivity
b2 b6b3 b4b1 b5 b7
S1 S2
S1 S3
S1 S2 S3
S2 S3
S2 S4
S3 S4
Gi contains all sensors covering bi
S2 S3 S4
1 2Min-CSC Min-CTC GST
Garg Konjevod and Ravi [SODA 2000] showed with probability 1- ε an approximation solution of GROUP STEINER TREE on tree metric T is within a factor of Ο(log2 n log log n log k) from optimal
What Is Link Radius
3 example In this onintersecti sensing
nonempty having sensors twoof distancefor boundupper least theis radiuslink
r
r
Communication disk
Sensing disk
Connected
Sensor Cover with Target
Area
Connected
Sensor Cover
with Target Points
Connect output of Min-TC into Min-CTC It can be done in Ο(r) - approximation
1
Algorithm 2
2Min-CSC Min-CTC Min-TC
Refer to Lidong Wursquos paper [INFOCOM 2013rsquo]
There exists a polynomial-time (1 + ε)- approximation for MIN-TC
Green is an opt (CTC)
Red is an approx (TC)
lt (1+ε) opt (TC) lt (1+ε) opt (CTC)
Step 2 Target Coverage
Byrka et al [6] showed there exists a polynomial-time139-approximation of for Network Steiner Minimum Tree
Green is an opt (CTC)
Red is an approx (TC)
Step 2 Network Steiner Tree
Let Sprime sube S be a (1 + ε)-approximation for MIN-TC Assign
weight one to every edge of G Interconnect sensors in Sprime to
compute a Steiner tree T as network Steiner minimum tree
All sensors on the tree form an approxfor min CTC
nodes approx for min CTC= edges +1 approx for Network STlt 139 opt (Network ST) +1lt 139 opt (CTC) + 1
Step 2 Network Steiner Tree
Green is an opt (CTC)
Red is an approx (TC)
Each orange line has distance lt r
opt (Network ST)
lt opt (CTC) -1 + r = opt (CTC) O(r)
Note lt (1+ε) opt (CTC)
Outline
I Introduction
II Two Approximations
III Final Remarks
Future Works
Ο(log3n log log n)
n is the number of sensors
1 Unknown Relationship
2 Constant-appro for Min-CSC
Ο(r)
r is the link radius
THANK YOU
- Slide 1
- Slide 2
- Slide 3
- Slide 4
- Slide 5
- Slide 6
- Slide 7
- Slide 8
- Slide 9
- Slide 10
- Slide 11
- Slide 12
- Slide 13
- Slide 14
- Slide 15
- Slide 16
- Slide 17
- Slide 18
- Slide 19
- Slide 20
- Slide 21
- Slide 22
- Slide 23
- Slide 24
- Slide 25
- Slide 26
- Slide 27
- Slide 28
- What Is Link Radius
- Slide 30
- Slide 31
- Slide 32
- Slide 33
- Slide 34
- Slide 35
- Slide 36
-

1 2Min-CSC Min-CTC GST
1 2Min-CSC Min-CTC GST
How to map to GST
Min-Connected Sensor Cover Problem
A uniform set of sensors and a target area
Find a minimum of sensors
to meet two requirements
[Coverage] cover the target area and
[Connectivity] form a connected communication network
1 2Min-CSC Min-CTC GST
How to map to GST
Min-Connected Target Coverage Problem
A uniform set of sensors and a target POINTS
Find a minimum of sensors
to meet two requirements
[Coverage] cover the target POINTS and
[Connectivity] form a connected communication network
1 2Min-CSC Min-CTC GST
A graph G = (V E) with positive edge weight c for every edge e isin E
k subsets (or groups) of vertices G1Gk Gi sube V
Find a minimum total weight tree T contains at least one vertex in each Gi
Group Steiner Tree
Figure GST ProblemThis tree has minimum weight
1 2Min-CSC Min-CTC GST
Choose at least one sensor from each group
Coverage
b3
b1
b2
b6
b5
b4
S1S2
S3S4
b7
b2 b6b3 b4b1 b5 b7
S1 S2
S1 S3
S1 S2 S3
S2 S3
S2 S4
S3 S4
Gi contains all sensors covering bi
S2 S3 S4
1 2Min-CSC Min-CTC GST
b3
b1
b2
b6
b5
b4
S1S2
S3S4
b7
Consider communication network
Connectivity
b2 b6b3 b4b1 b5 b7
S1 S2
S1 S3
S1 S2 S3
S2 S3
S2 S4
S3 S4
Gi contains all sensors covering bi
S2 S3 S4
1 2Min-CSC Min-CTC GST
b3
b1
b2
b6
b5
b4
S1S2
S3S4
b7
Find a group Steiner tree in communication network
Min-Coverage amp Connectivity
b2 b6b3 b4b1 b5 b7
S1 S2
S1 S3
S1 S2 S3
S2 S3
S2 S4
S3 S4
Gi contains all sensors covering bi
S2 S3 S4
1 2Min-CSC Min-CTC GST
Garg Konjevod and Ravi [SODA 2000] showed with probability 1- ε an approximation solution of GROUP STEINER TREE on tree metric T is within a factor of Ο(log2 n log log n log k) from optimal
What Is Link Radius
3 example In this onintersecti sensing
nonempty having sensors twoof distancefor boundupper least theis radiuslink
r
r
Communication disk
Sensing disk
Connected
Sensor Cover with Target
Area
Connected
Sensor Cover
with Target Points
Connect output of Min-TC into Min-CTC It can be done in Ο(r) - approximation
1
Algorithm 2
2Min-CSC Min-CTC Min-TC
Refer to Lidong Wursquos paper [INFOCOM 2013rsquo]
There exists a polynomial-time (1 + ε)- approximation for MIN-TC
Green is an opt (CTC)
Red is an approx (TC)
lt (1+ε) opt (TC) lt (1+ε) opt (CTC)
Step 2 Target Coverage
Byrka et al [6] showed there exists a polynomial-time139-approximation of for Network Steiner Minimum Tree
Green is an opt (CTC)
Red is an approx (TC)
Step 2 Network Steiner Tree
Let Sprime sube S be a (1 + ε)-approximation for MIN-TC Assign
weight one to every edge of G Interconnect sensors in Sprime to
compute a Steiner tree T as network Steiner minimum tree
All sensors on the tree form an approxfor min CTC
nodes approx for min CTC= edges +1 approx for Network STlt 139 opt (Network ST) +1lt 139 opt (CTC) + 1
Step 2 Network Steiner Tree
Green is an opt (CTC)
Red is an approx (TC)
Each orange line has distance lt r
opt (Network ST)
lt opt (CTC) -1 + r = opt (CTC) O(r)
Note lt (1+ε) opt (CTC)
Outline
I Introduction
II Two Approximations
III Final Remarks
Future Works
Ο(log3n log log n)
n is the number of sensors
1 Unknown Relationship
2 Constant-appro for Min-CSC
Ο(r)
r is the link radius
THANK YOU
- Slide 1
- Slide 2
- Slide 3
- Slide 4
- Slide 5
- Slide 6
- Slide 7
- Slide 8
- Slide 9
- Slide 10
- Slide 11
- Slide 12
- Slide 13
- Slide 14
- Slide 15
- Slide 16
- Slide 17
- Slide 18
- Slide 19
- Slide 20
- Slide 21
- Slide 22
- Slide 23
- Slide 24
- Slide 25
- Slide 26
- Slide 27
- Slide 28
- What Is Link Radius
- Slide 30
- Slide 31
- Slide 32
- Slide 33
- Slide 34
- Slide 35
- Slide 36
-

1 2Min-CSC Min-CTC GST
How to map to GST
Min-Connected Target Coverage Problem
A uniform set of sensors and a target POINTS
Find a minimum of sensors
to meet two requirements
[Coverage] cover the target POINTS and
[Connectivity] form a connected communication network
1 2Min-CSC Min-CTC GST
A graph G = (V E) with positive edge weight c for every edge e isin E
k subsets (or groups) of vertices G1Gk Gi sube V
Find a minimum total weight tree T contains at least one vertex in each Gi
Group Steiner Tree
Figure GST ProblemThis tree has minimum weight
1 2Min-CSC Min-CTC GST
Choose at least one sensor from each group
Coverage
b3
b1
b2
b6
b5
b4
S1S2
S3S4
b7
b2 b6b3 b4b1 b5 b7
S1 S2
S1 S3
S1 S2 S3
S2 S3
S2 S4
S3 S4
Gi contains all sensors covering bi
S2 S3 S4
1 2Min-CSC Min-CTC GST
b3
b1
b2
b6
b5
b4
S1S2
S3S4
b7
Consider communication network
Connectivity
b2 b6b3 b4b1 b5 b7
S1 S2
S1 S3
S1 S2 S3
S2 S3
S2 S4
S3 S4
Gi contains all sensors covering bi
S2 S3 S4
1 2Min-CSC Min-CTC GST
b3
b1
b2
b6
b5
b4
S1S2
S3S4
b7
Find a group Steiner tree in communication network
Min-Coverage amp Connectivity
b2 b6b3 b4b1 b5 b7
S1 S2
S1 S3
S1 S2 S3
S2 S3
S2 S4
S3 S4
Gi contains all sensors covering bi
S2 S3 S4
1 2Min-CSC Min-CTC GST
Garg Konjevod and Ravi [SODA 2000] showed with probability 1- ε an approximation solution of GROUP STEINER TREE on tree metric T is within a factor of Ο(log2 n log log n log k) from optimal
What Is Link Radius
3 example In this onintersecti sensing
nonempty having sensors twoof distancefor boundupper least theis radiuslink
r
r
Communication disk
Sensing disk
Connected
Sensor Cover with Target
Area
Connected
Sensor Cover
with Target Points
Connect output of Min-TC into Min-CTC It can be done in Ο(r) - approximation
1
Algorithm 2
2Min-CSC Min-CTC Min-TC
Refer to Lidong Wursquos paper [INFOCOM 2013rsquo]
There exists a polynomial-time (1 + ε)- approximation for MIN-TC
Green is an opt (CTC)
Red is an approx (TC)
lt (1+ε) opt (TC) lt (1+ε) opt (CTC)
Step 2 Target Coverage
Byrka et al [6] showed there exists a polynomial-time139-approximation of for Network Steiner Minimum Tree
Green is an opt (CTC)
Red is an approx (TC)
Step 2 Network Steiner Tree
Let Sprime sube S be a (1 + ε)-approximation for MIN-TC Assign
weight one to every edge of G Interconnect sensors in Sprime to
compute a Steiner tree T as network Steiner minimum tree
All sensors on the tree form an approxfor min CTC
nodes approx for min CTC= edges +1 approx for Network STlt 139 opt (Network ST) +1lt 139 opt (CTC) + 1
Step 2 Network Steiner Tree
Green is an opt (CTC)
Red is an approx (TC)
Each orange line has distance lt r
opt (Network ST)
lt opt (CTC) -1 + r = opt (CTC) O(r)
Note lt (1+ε) opt (CTC)
Outline
I Introduction
II Two Approximations
III Final Remarks
Future Works
Ο(log3n log log n)
n is the number of sensors
1 Unknown Relationship
2 Constant-appro for Min-CSC
Ο(r)
r is the link radius
THANK YOU
- Slide 1
- Slide 2
- Slide 3
- Slide 4
- Slide 5
- Slide 6
- Slide 7
- Slide 8
- Slide 9
- Slide 10
- Slide 11
- Slide 12
- Slide 13
- Slide 14
- Slide 15
- Slide 16
- Slide 17
- Slide 18
- Slide 19
- Slide 20
- Slide 21
- Slide 22
- Slide 23
- Slide 24
- Slide 25
- Slide 26
- Slide 27
- Slide 28
- What Is Link Radius
- Slide 30
- Slide 31
- Slide 32
- Slide 33
- Slide 34
- Slide 35
- Slide 36
-

1 2Min-CSC Min-CTC GST
b3
b1
b2
b6
b5
b4
S1S2
S3S4
b7
Find a group Steiner tree in communication network
Min-Coverage amp Connectivity
b2 b6b3 b4b1 b5 b7
S1 S2
S1 S3
S1 S2 S3
S2 S3
S2 S4
S3 S4
Gi contains all sensors covering bi
S2 S3 S4
1 2Min-CSC Min-CTC GST
Garg Konjevod and Ravi [SODA 2000] showed with probability 1- ε an approximation solution of GROUP STEINER TREE on tree metric T is within a factor of Ο(log2 n log log n log k) from optimal
What Is Link Radius
3 example In this onintersecti sensing
nonempty having sensors twoof distancefor boundupper least theis radiuslink
r
r
Communication disk
Sensing disk
Connected
Sensor Cover with Target
Area
Connected
Sensor Cover
with Target Points
Connect output of Min-TC into Min-CTC It can be done in Ο(r) - approximation
1
Algorithm 2
2Min-CSC Min-CTC Min-TC
Refer to Lidong Wursquos paper [INFOCOM 2013rsquo]
There exists a polynomial-time (1 + ε)- approximation for MIN-TC
Green is an opt (CTC)
Red is an approx (TC)
lt (1+ε) opt (TC) lt (1+ε) opt (CTC)
Step 2 Target Coverage
Byrka et al [6] showed there exists a polynomial-time139-approximation of for Network Steiner Minimum Tree
Green is an opt (CTC)
Red is an approx (TC)
Step 2 Network Steiner Tree
Let Sprime sube S be a (1 + ε)-approximation for MIN-TC Assign
weight one to every edge of G Interconnect sensors in Sprime to
compute a Steiner tree T as network Steiner minimum tree
All sensors on the tree form an approxfor min CTC
nodes approx for min CTC= edges +1 approx for Network STlt 139 opt (Network ST) +1lt 139 opt (CTC) + 1
Step 2 Network Steiner Tree
Green is an opt (CTC)
Red is an approx (TC)
Each orange line has distance lt r
opt (Network ST)
lt opt (CTC) -1 + r = opt (CTC) O(r)
Note lt (1+ε) opt (CTC)
Outline
I Introduction
II Two Approximations
III Final Remarks
Future Works
Ο(log3n log log n)
n is the number of sensors
1 Unknown Relationship
2 Constant-appro for Min-CSC
Ο(r)
r is the link radius
THANK YOU
- Slide 1
- Slide 2
- Slide 3
- Slide 4
- Slide 5
- Slide 6
- Slide 7
- Slide 8
- Slide 9
- Slide 10
- Slide 11
- Slide 12
- Slide 13
- Slide 14
- Slide 15
- Slide 16
- Slide 17
- Slide 18
- Slide 19
- Slide 20
- Slide 21
- Slide 22
- Slide 23
- Slide 24
- Slide 25
- Slide 26
- Slide 27
- Slide 28
- What Is Link Radius
- Slide 30
- Slide 31
- Slide 32
- Slide 33
- Slide 34
- Slide 35
- Slide 36
-

1 2Min-CSC Min-CTC GST
Garg Konjevod and Ravi [SODA 2000] showed with probability 1- ε an approximation solution of GROUP STEINER TREE on tree metric T is within a factor of Ο(log2 n log log n log k) from optimal
What Is Link Radius
3 example In this onintersecti sensing
nonempty having sensors twoof distancefor boundupper least theis radiuslink
r
r
Communication disk
Sensing disk
Connected
Sensor Cover with Target
Area
Connected
Sensor Cover
with Target Points
Connect output of Min-TC into Min-CTC It can be done in Ο(r) - approximation
1
Algorithm 2
2Min-CSC Min-CTC Min-TC
Refer to Lidong Wursquos paper [INFOCOM 2013rsquo]
There exists a polynomial-time (1 + ε)- approximation for MIN-TC
Green is an opt (CTC)
Red is an approx (TC)
lt (1+ε) opt (TC) lt (1+ε) opt (CTC)
Step 2 Target Coverage
Byrka et al [6] showed there exists a polynomial-time139-approximation of for Network Steiner Minimum Tree
Green is an opt (CTC)
Red is an approx (TC)
Step 2 Network Steiner Tree
Let Sprime sube S be a (1 + ε)-approximation for MIN-TC Assign
weight one to every edge of G Interconnect sensors in Sprime to
compute a Steiner tree T as network Steiner minimum tree
All sensors on the tree form an approxfor min CTC
nodes approx for min CTC= edges +1 approx for Network STlt 139 opt (Network ST) +1lt 139 opt (CTC) + 1
Step 2 Network Steiner Tree
Green is an opt (CTC)
Red is an approx (TC)
Each orange line has distance lt r
opt (Network ST)
lt opt (CTC) -1 + r = opt (CTC) O(r)
Note lt (1+ε) opt (CTC)
Outline
I Introduction
II Two Approximations
III Final Remarks
Future Works
Ο(log3n log log n)
n is the number of sensors
1 Unknown Relationship
2 Constant-appro for Min-CSC
Ο(r)
r is the link radius
THANK YOU
- Slide 1
- Slide 2
- Slide 3
- Slide 4
- Slide 5
- Slide 6
- Slide 7
- Slide 8
- Slide 9
- Slide 10
- Slide 11
- Slide 12
- Slide 13
- Slide 14
- Slide 15
- Slide 16
- Slide 17
- Slide 18
- Slide 19
- Slide 20
- Slide 21
- Slide 22
- Slide 23
- Slide 24
- Slide 25
- Slide 26
- Slide 27
- Slide 28
- What Is Link Radius
- Slide 30
- Slide 31
- Slide 32
- Slide 33
- Slide 34
- Slide 35
- Slide 36
-

Connected
Sensor Cover with Target
Area
Connected
Sensor Cover
with Target Points
Connect output of Min-TC into Min-CTC It can be done in Ο(r) - approximation
1
Algorithm 2
2Min-CSC Min-CTC Min-TC
Refer to Lidong Wursquos paper [INFOCOM 2013rsquo]
There exists a polynomial-time (1 + ε)- approximation for MIN-TC
Green is an opt (CTC)
Red is an approx (TC)
lt (1+ε) opt (TC) lt (1+ε) opt (CTC)
Step 2 Target Coverage
Byrka et al [6] showed there exists a polynomial-time139-approximation of for Network Steiner Minimum Tree
Green is an opt (CTC)
Red is an approx (TC)
Step 2 Network Steiner Tree
Let Sprime sube S be a (1 + ε)-approximation for MIN-TC Assign
weight one to every edge of G Interconnect sensors in Sprime to
compute a Steiner tree T as network Steiner minimum tree
All sensors on the tree form an approxfor min CTC
nodes approx for min CTC= edges +1 approx for Network STlt 139 opt (Network ST) +1lt 139 opt (CTC) + 1
Step 2 Network Steiner Tree
Green is an opt (CTC)
Red is an approx (TC)
Each orange line has distance lt r
opt (Network ST)
lt opt (CTC) -1 + r = opt (CTC) O(r)
Note lt (1+ε) opt (CTC)
Outline
I Introduction
II Two Approximations
III Final Remarks
Future Works
Ο(log3n log log n)
n is the number of sensors
1 Unknown Relationship
2 Constant-appro for Min-CSC
Ο(r)
r is the link radius
THANK YOU
- Slide 1
- Slide 2
- Slide 3
- Slide 4
- Slide 5
- Slide 6
- Slide 7
- Slide 8
- Slide 9
- Slide 10
- Slide 11
- Slide 12
- Slide 13
- Slide 14
- Slide 15
- Slide 16
- Slide 17
- Slide 18
- Slide 19
- Slide 20
- Slide 21
- Slide 22
- Slide 23
- Slide 24
- Slide 25
- Slide 26
- Slide 27
- Slide 28
- What Is Link Radius
- Slide 30
- Slide 31
- Slide 32
- Slide 33
- Slide 34
- Slide 35
- Slide 36
-
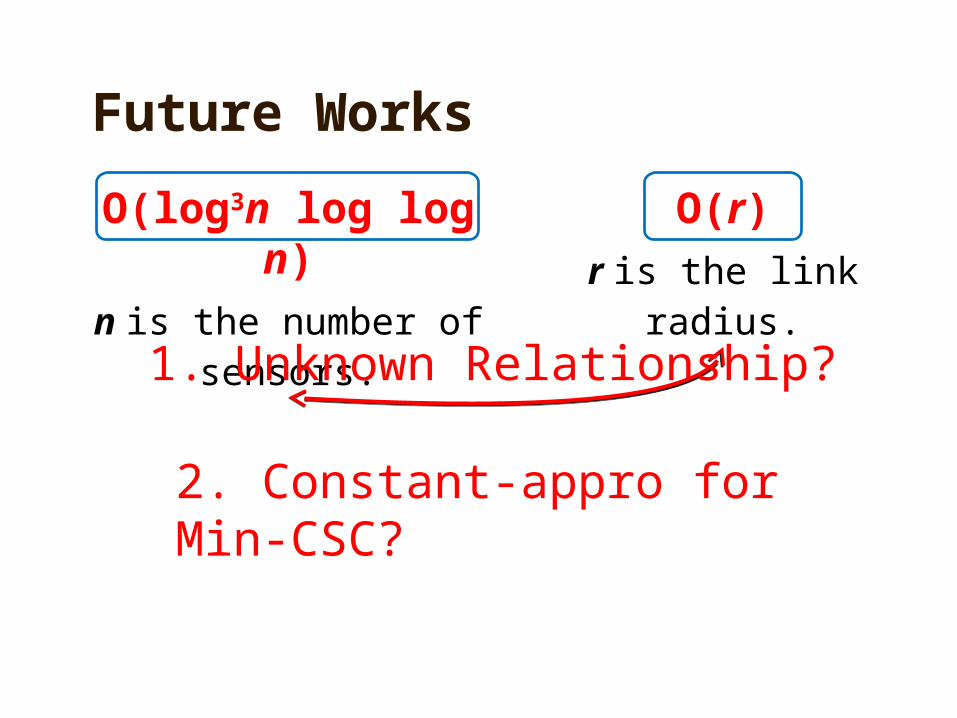