LiDAR and other Digital Tools for Soil Mapping
23
LiDAR and other Digital Tools for Soil Mapping
Transcript of LiDAR and other Digital Tools for Soil Mapping
LiDAR and other Digital Tools for Soil Mapping
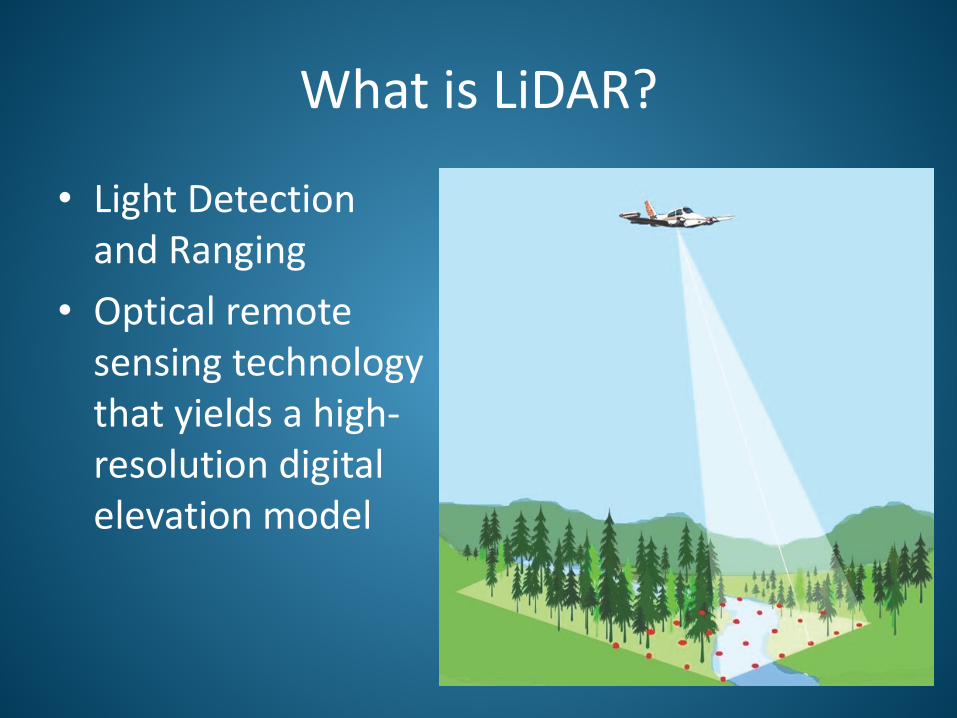
What is LiDAR?
• Light Detection and Ranging
• Optical remote sensing technology that yields a high-resolution digital elevation model

How does soil survey use elevation data?
• Landscape Visualization • Quantitative models
– Terrain Derivatives • Slope, aspect, curvature, wetness index, etc.
– Soil models • Utilizing Terrain Derivatives • Arc Soil Inference Engine
– Automated method of soil mapping; combines soil scientist knowledge about the soil environment with the terrain derivatives

What we used to see
Presenter
Presentation Notes
Note the lack of visual information about the terrain. (Flash back to previous slide.)

Hillshade from 1m LiDAR DEM - Used for Visualization and Manual Delineation of Landforms and Parent Materials
Presenter
Presentation Notes
This bare earth model is a GRID of very accurate elevations spaced at 1 meter intervals. This hillshade is created using the Spatial Analyst extension of ArcMap. Notice the folded areas that have bedrock outcrops and mostly Lyman and Tunbridge soils. The smooth areas have dense till (hard pan) and mostly Cabot, Colonel, and Dixfield soils. The image is about 3 miles across.
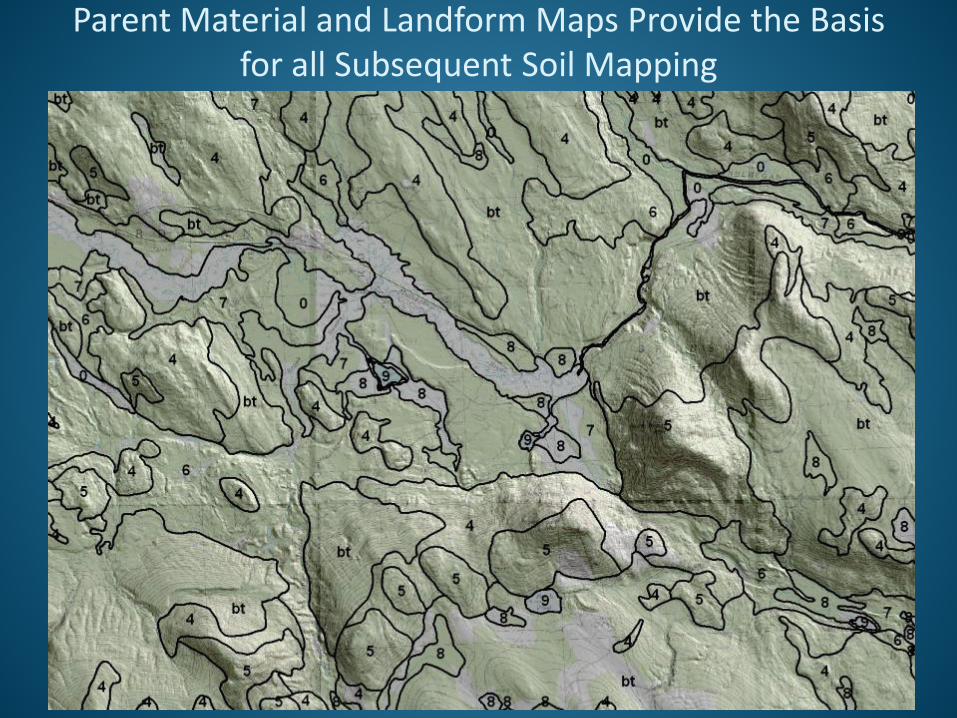
Parent Material and Landform Maps Provide the Basis for all Subsequent Soil Mapping
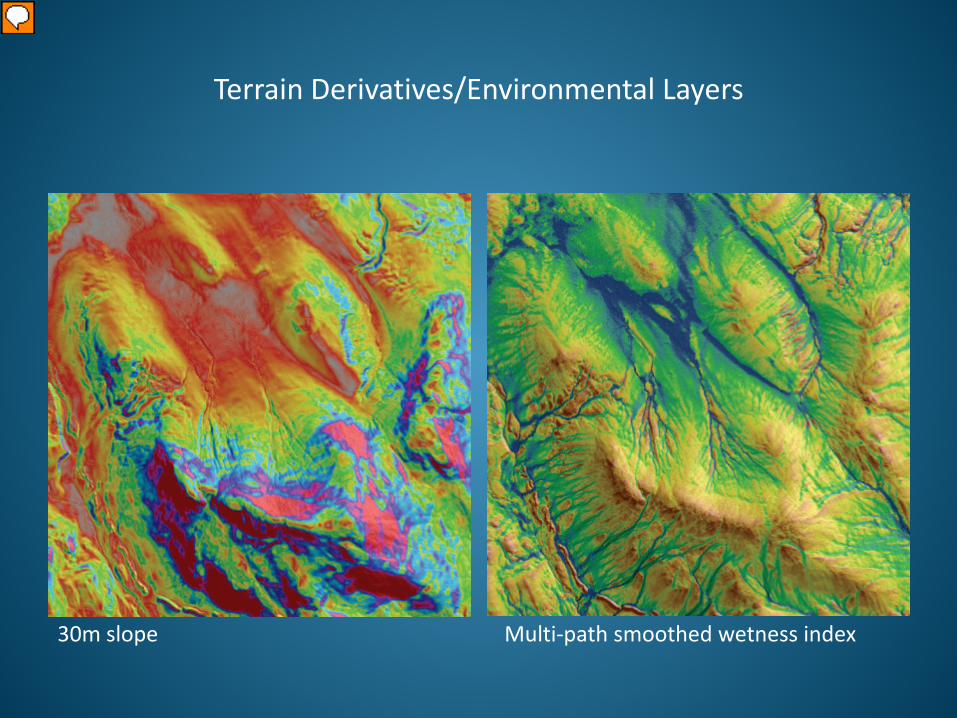
Terrain Derivatives/Environmental Layers
30m slope Multi-path smoothed wetness index
Presenter
Presentation Notes
These two layers proved the most useful to us for the Essex County model. Wetness index is a good proxy for drainage class in basal till areas, and since our model is of one catena, that is very important.
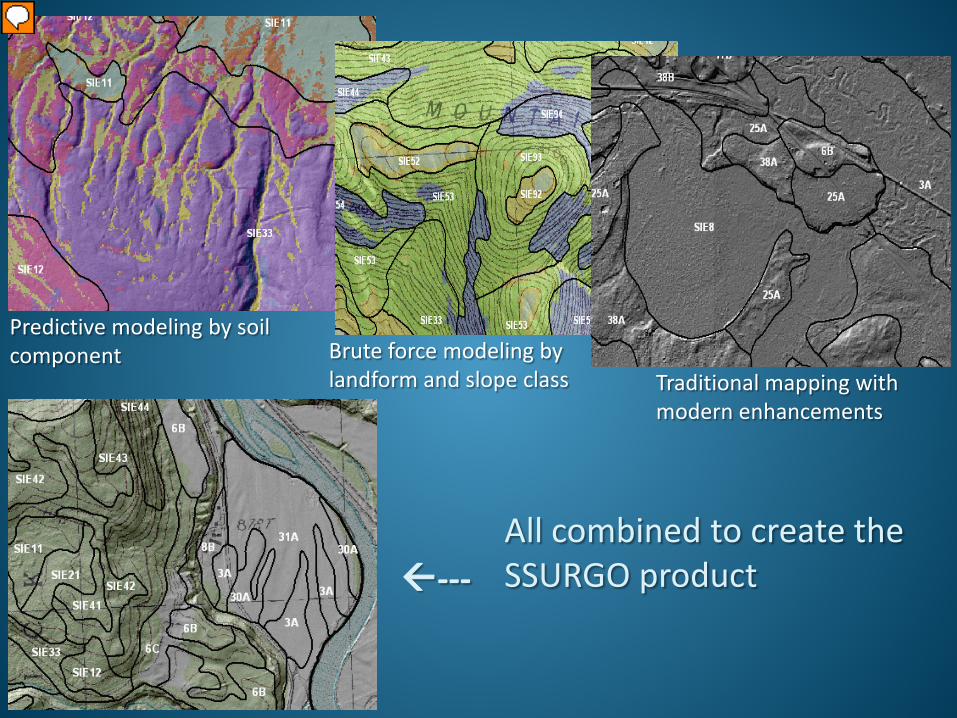
Predictive modeling by soil component Brute force modeling by
landform and slope class Traditional mapping with modern enhancements
--- All combined to create the SSURGO product
Presenter
Presentation Notes
Three quite different DSM processes were employed and integrated to achieve the certified product. Don’t need a one-size-fits-all approach.

Is High Resolution Always Better?
• High resolution elevation data is used for visualization of the landscape.
• Typically, a lower resolution is more appropriate for modeling – Multiple resolutions are used within a survey area
• For example, 1m for visualization, 5m for modeling

1m LiDAR
Presenter
Presentation Notes
Quarter-quad with 1m LiDAR hillshade

10m USGS Elevation Data
Presenter
Presentation Notes
Same quarter-quad with USGS 10m elevation data hillshade
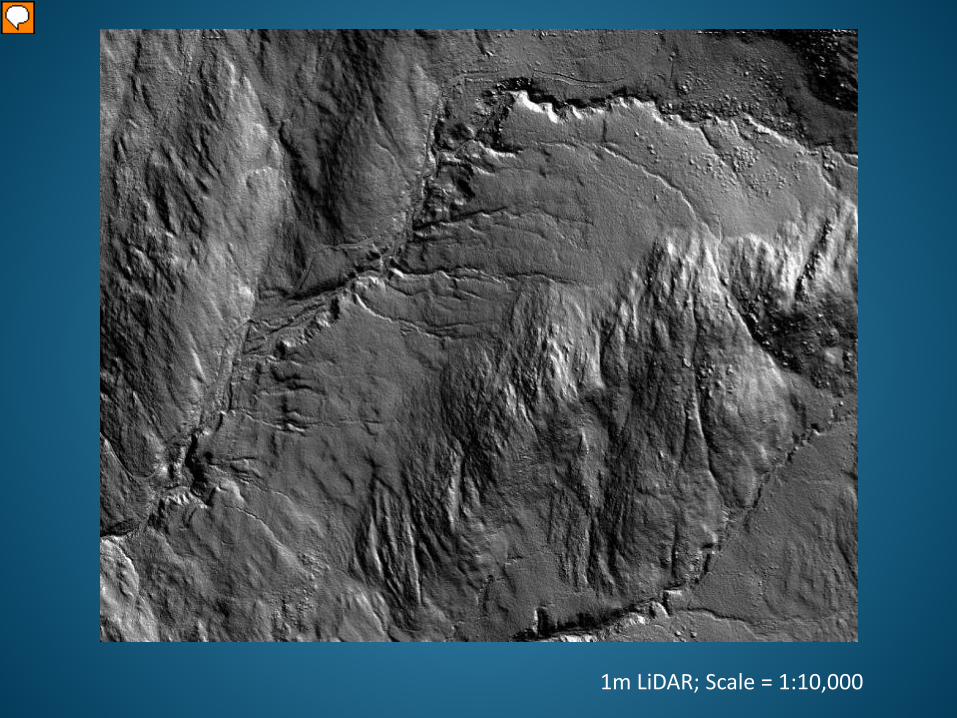
1m LiDAR; Scale = 1:10,000
Presenter
Presentation Notes
Zoomed in to 1:10,000 (closer to scale at which we do parent material and landform delineations). 1m LiDAR is used for visualization.
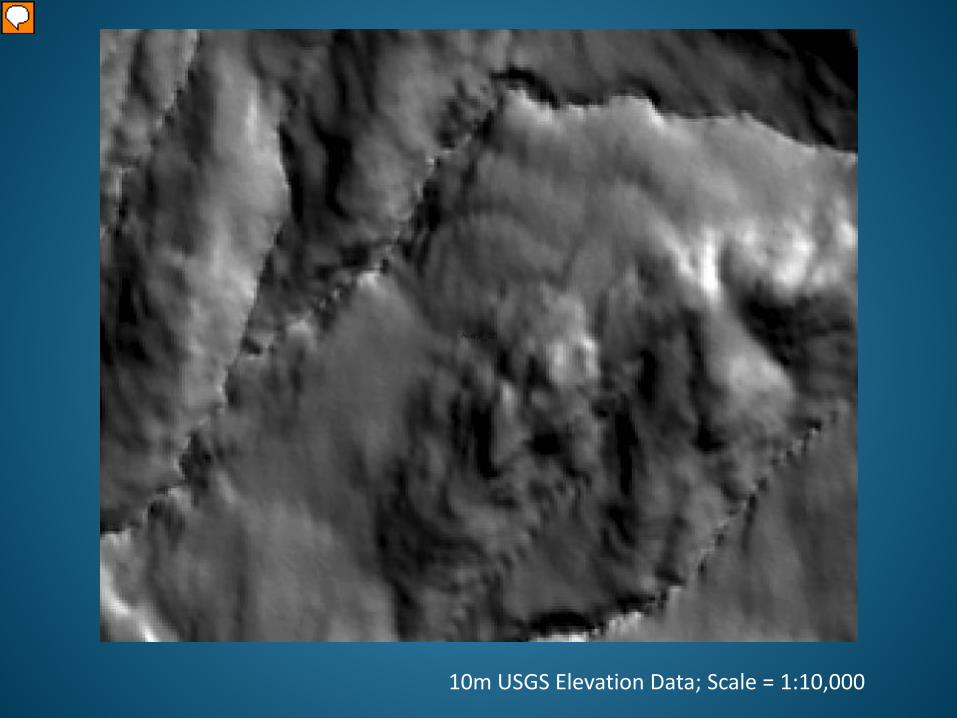
10m USGS Elevation Data; Scale = 1:10,000
Presenter
Presentation Notes
10m Data hillshade at 1:10,000. There is no way this could be used for visualization purposes for delineated parent materials and landforms in our area.

Smoothed Wetness Index 1m LiDAR; Scale = 1:10,000
Presenter
Presentation Notes
Smoothed Wetness Index shown on top of 1m LiDAR. Wetness Index was run using LiDAR data that had been filtered and resampled to 5m. Darker colors are wetter areas.

Smoothed Wetness Index Run on 10m USGS Elevation Data (resampled to 5m), Shown
over 1m LiDAR; Scale = 1:10,000
Presenter
Presentation Notes
Smoothed Wetness run on 10m elevation data, resampled to 5m. Shown over the 1m LiDAR data to show how the results are much more generalized than the results from the LiDAR on the previous slide.
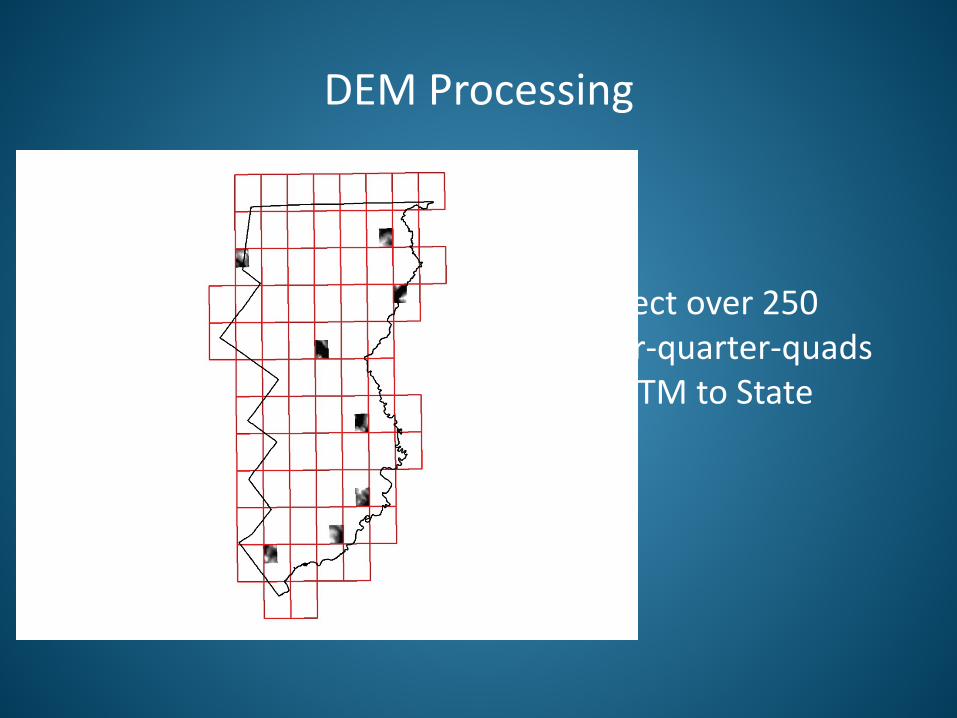
DEM Processing
• Reproject over 250 quarter-quarter-quads from UTM to State Plane

DEM Processing
• Mosaic 12 quarter-quarter quads
• Clip raster to quarter quad boundary
• Remove NoData areas if necessary

DEM Processing
• Hillshades are made of each qquad for visualization purposes – Four different azimuths

DEM Processing • Shave Spikes • SIE tool developed in response to NRCS need

DEM Processing • Mosaic 25 qquads
• Clip to 500m outside of nine qquad edge
DEM Processing
• Further Smoothing
– Filter • 9x9 rectangular neighborhood
– Resample to 5 meter cell size

Visual Effects of Processing
1m DEM Hillshade 5m DEM Hillshade
End up with….
…1m hillshades for every qquad (ready for manual work)
…DEM resampled to 5m for entire work area (ready for SIE)