LibQUAL+ Survey 2005 at The University of Western ... · LibQUAL+™ Survey 2007 The University of...
56
LibQUAL+™ Survey 2007 The University of Western Australia Library Part 1: Analysis of Library‐wide Results Prepared by the Marketing Team Liz Burke, Anne Evans, Annie Macnab, Alissa Sputore, and Anne M. Webster with assistance from Kate Croker
-
Upload
vuongtuong -
Category
Documents
-
view
216 -
download
0
Transcript of LibQUAL+ Survey 2005 at The University of Western ... · LibQUAL+™ Survey 2007 The University of...

LibQUAL+™ Survey 2007 The University of Western Australia Library
Part 1: Analysis of Library‐wide Results
Prepared by the Marketing Team
Liz Burke, Anne Evans, Annie Macnab, Alissa Sputore, and Anne M. Webster
with assistance from Kate Croker

LibQUAL+™ Survey 2007 at The University of Western Australia Analysis of Results
Page 2 of 56
Table of Contents 1. Executive Summary ................................................................................................... 3
2. Introduction .............................................................................................................. 9
3. Survey Description ................................................................................................... 10
4. Scoring .................................................................................................................... 11
5. Who Completed the UWA Library Survey? ................................................................ 13
6. Frequency of Use ..................................................................................................... 15
7. Core Questions ........................................................................................................ 19
7.1 Affect of Service ...................................................................................................... 22
7.2 Information Control ................................................................................................. 26
7.3 Library as Place ........................................................................................................ 30
8. Local Questions ....................................................................................................... 34
9. General Satisfaction Ratings ..................................................................................... 38
10. Information Literacy Outcomes ................................................................................ 41
11. Comments ............................................................................................................... 44
Appendix One ‐ Survey Questions ...................................................................................... 47
Appendix Two – Responses to Individual Questions by User Group ...................................... 49
Appendix Three ‐ Priorities by User Group .......................................................................... 56

LibQUAL+™ Survey 2007 at The University of Western Australia Analysis of Results
Page 3 of 56
1. Executive Summary
In October 2007 The University of Western Australia (UWA) Library surveyed its readers using the LibQUAL+™ Survey instrument for the second time. It had previously used the survey instrument in October 2005.
LibQUAL+™ was designed by the Association of Research Libraries (ARL) to assist libraries in assessing the quality of their services and identifying areas for improvement. UWA also selected this survey instrument in order to compare results directly with its benchmarking partner Queen’s University in Canada.
The survey was posted on the UWA Library Web site and readers invited to complete it. 2,019 completed surveys were returned from undergraduates, postgraduates, academic and general staff, and library staff. Of these 1,520 were from undergraduates and 365 from postgraduates.
The survey consisted of 22 core questions and five locally selected questions addressing a range of service quality issues. For each question, respondents were asked to indicate, on scales of 1 to 9, their minimum acceptable service level, their desired service level, and their perception of the level of service currently provided by the Library. In addition there were three general satisfaction questions, and five questions relating to information literacy outcomes. Respondents were also asked how frequently they used library buildings, the Library’s online services, and other non‐library online information gateways.
The core survey questions were organised into three dimensions:
1. Affect of Service (customer service) 2. Information Control (collections, resources, and ability to find information independently and
remotely) 3. Library as Place (buildings and amenities)
Survey respondents were also invited to add free‐text comments. The Library received comments from 927 individuals (46% of all respondents).
The survey provided the UWA Library with direct feedback from readers and a vital source of information about strengths and weaknesses – both in the context of the UWA community and in comparison with the University’s benchmarking partner Queen’s University, and over 200 ARL libraries which undertook the survey at the same time.
The survey results provided mean scores for each of the three measures of service quality for each question. Results were analysed by user group and by ‘home’ library. This report summarises the results for user groups. The “LibQUAL+™ Survey 2007 The University of Western Australia Library: Part 2 Analysis of Subject Library Results” summarises the results by home library.
General findings
Analysis of the data produced the following key findings:
Affect of Service ‐ UWA’s sound overall ratings were supported by numerous positive comments regarding customer service. With the exception of academic staff all other user groups reported that this was the dimension in which the Library performed best. For academic staff Affect of Service was rated just behind Library as Place. As in 2005 the results also indicated that undergraduates did not value personal services as highly as did academics and postgraduates. Comments highlighted some specific areas for improvement throughout the Library.

LibQUAL+™ Survey 2007 at The University of Western Australia Analysis of Results
Page 4 of 56
Information Control ‐ As in 2005 this dimension ranked highest in importance for all user groups. At the same time it was the area with the largest gap between the desired and the perceived levels of service provision.
Library as Place ‐ Undergraduates rated this as the second most important service dimension, in particular Quiet space for individual work and A haven for study, learning, or research. There were however large standard deviations for some items in undergraduate responses indicating a wide range of opinions regarding the extent to which their minimum requirements for Library as Place were being met. Postgraduate students, academic and general staff all rated Library as Place as the least important service dimension.
Frequency of use
With the exception of general staff all user groups reported a significantly higher frequency of use of library services than their counterparts at Queen’s and ARL.
The most significant findings
The survey results and comments highlight the following:
For undergraduates the most important service was Making electronic resources accessible from my home or office. This service was also equal first in importance for postgraduates and second in importance for academic staff.
Postgraduates and academic staff rated Print and/or electronic journal collections I require for my work
as the most important service provided by the Library. This service was rated third in importance by undergraduates.
For the two largest groups of respondents ‐ undergraduates and postgraduates ‐ the Library failed to
meet minimum expectations for Ready access to computers/Internet/ software. For both groups the standard deviation of the adequacy gap score was high (2.10 and 2.05) suggesting a wide variety of views.
For academic staff the Library failed to meet the minimum requirements for 6 of the 8 items in Information Control and barely met the minimum expectations on a seventh. For postgraduates the Library failed to meet minimum requirements on two of the items in the same dimension and barely met minimum requirements in two others.

LibQUAL+™ Survey 2007 at The University of Western Australia Analysis of Results
Page 5 of 56
The undergraduate and postgraduate experience of the Library
Top five priorities (in order of importance)
Undergraduates 2007 Undergraduates 2005
1. Making electronic resources accessible from my home or office
1. Making electronic resources accessible from my home or office
2. Ready access to computers/Internet/ software
2. Modern equipment that lets me easily access needed information
3. Print and/or electronic journal collections I require for my work
3. Ready access to computers/Internet/software
4. The electronic information resources I need 4. Print and/or electronic journal collections I require for my work
5. A library Web site enabling me to locate information on my own
5. A library Web site enabling me to locate information on my own
Postgraduates 2007 Postgraduates 2005
1. Print and/or electronic journal collections I require for my work
Making electronic resources accessible from my home or office (a tie)
1. Print and/or electronic journal collections I require for my work
2. The electronic information resources I need 2. Making electronic resources accessible from my home or office
3. A library Web site enabling me to locate information on my own
3. The electronic information resources I need
4. Easy‐to‐use access tools that allow me to find things on my own
Making information accessible for independent use
4. A library Web site enabling me to locate information on my own
5. Modern equipment that lets me easily access needed information
Table 1: Undergraduates and Postgraduates ‐ Top five priorities As in 2005, the 2007 responses illustrate the importance of electronic services and infrastructure to students at both undergraduate and postgraduate levels. Modern equipment that lets me easily access needed information has disappeared from the Top 5 priorities for 2007 for both undergraduates and postgraduates. New priorities identified in 2007 include The electronic information resources I need (undergraduates), Easy‐to‐use access tools that allow me to find things on my own (postgraduates), and Making information accessible for independent use (postgraduates).

LibQUAL+™ Survey 2007 at The University of Western Australia Analysis of Results
Page 6 of 56
Students believed the Library performed best in
Undergraduates 2007 Undergraduates 2005
1. Readiness to respond to users’ enquiries 1. A library Web site enabling me to locate information on my own
2. Adequate hours of service 2. Modern equipment that lets me easily access needed information
3. Library staff who have the knowledge to answer user questions
3. Readiness to respond to users’ enquiries
4. Library staff who are consistently courteous 4. Making information easily accessible for independent use
5. A library Web site enabling me to locate information on my own
5. Easy‐to‐use access tools that allow me to find things on my own
Postgraduates 2007 Postgraduates 2005
1. Readiness to respond to users’ enquiries 1. Readiness to respond to users’ enquiries
2. Library staff who are consistently courteous 2. Library staff who are consistently courteous
3. Willingness to help users 3. Modern equipment that lets me easily access needed information
4. A library Web site enabling me to locate information on my own
4. A library Web site enabling me to locate information on my own
5. Making information easily accessible for independent use
5. Willingness to help users
Table 2: Highest rated performance items
A notable difference in performance between 2005 and 2007 is the addition of Adequate hours of service in 2007 to the list above for undergraduates. After making changes to opening hours based on feedback from the 2005 LibQUAL+ Survey, the Library’s performance has improved in this dimension.
It is also interesting to note that in 2005 both undergraduates and postgraduates believed the Library performed best in Modern equipment that lets me easily access needed information but this is not ranked in the top 5 in 2007. Such a result corresponds with this service no longer being a top priority for undergraduates or postgraduates (Table 1).

LibQUAL+™ Survey 2007 at The University of Western Australia Analysis of Results
Page 7 of 56
Students believed the Library fell furthest short of the desired levels of service in
Undergraduates 2007 Undergraduates 2005
1. Ready access to computers/Internet/ software (where the Library does not meet minimum requirements)
1. Ready access to computers/Internet/software (where the Library does not meet minimum requirements)
2. Making electronic resources accessible from my home or office
2. Library space that inspires study and learning
3. Library space that inspires study and learning
3. Making electronic resources accessible from my home or office
4. Print and/or electronic journal collections I require for my work
4. Availability of subject specialist assistance
5. Online course support (readings, links, references)
5. Print and/or electronic journal collections I require for my work
Postgraduates 2007 Postgraduates 2005
1. Print and/or electronic journal collections I require for my work (where the Library does not meet minimum requirements)
1. Print and/or electronic journal collections I require for my work (where the Library does not meet minimum requirements)
2. Making electronic resources accessible from my home or office
2. Making electronic resources accessible from my home or office
3. The electronic information resources I need (where the Library does not meet minimum requirements)
3. The electronic information resources I need
4. Ready access to computers/Internet/ software
4. Ready access to computers/Internet/software
5. Easy–to‐use tools that allow me to find things on my own
5. Availability of subject specialist assistance
Table 3: Lowest rated performance items
Undergraduates still believed the Library fell furthest short of the desired levels of service in Ready access to computers/Internet/ software since 2005. Availability of subject specialist assistance has been replaced by Online course support (readings, links, references) in 2007 as another area undergraduates felt the library underperforms in. This option was not available as a local question in 2005 so no comparison on performance in this area can be made.
Postgraduates still believed the Library fell furthest short of the desired levels of service in the same 4 areas in 2007 as in 2005. Availability of subject specialist assistance has been replaced by Easy–to‐use tools that allow me to find things on my own in 2007 as another area in which postgraduates felt the library underperforms.
LibQUAL+™ Survey 2007 at The University of Western Australia Analysis of Results
Page 8 of 56
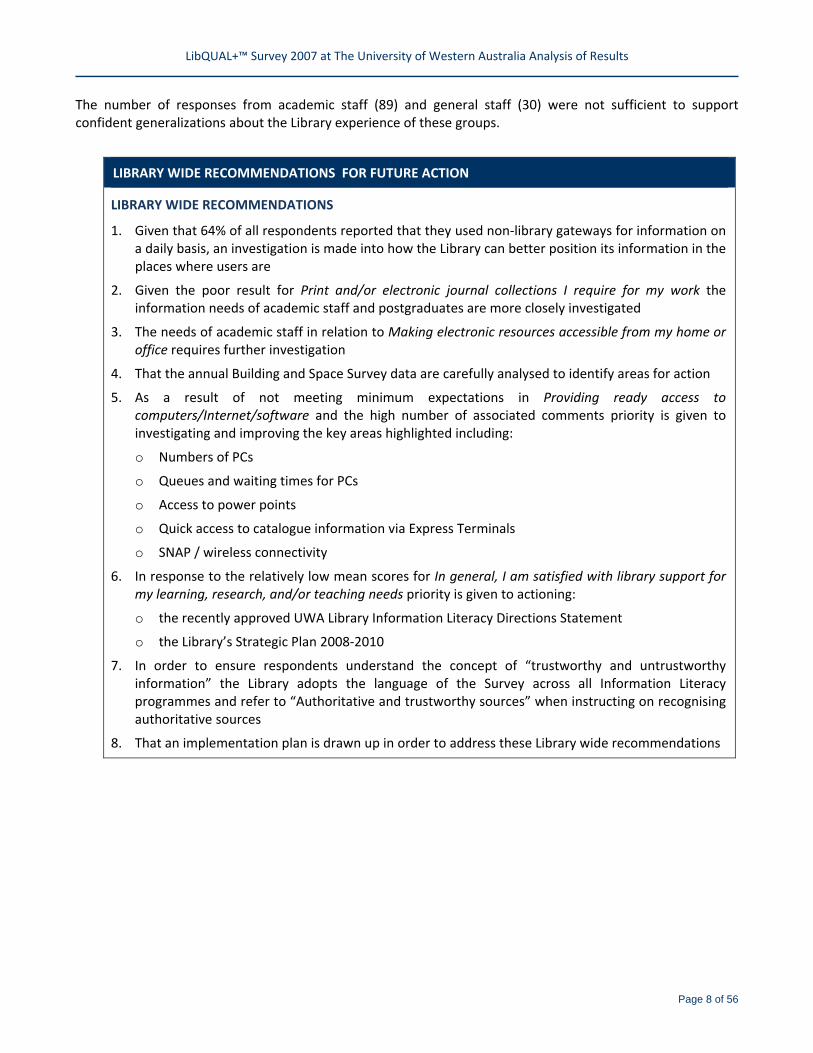
The number of responses from academic staff (89) and general staff (30) were not sufficient to support confident generalizations about the Library experience of these groups.
LIBRARY WIDE RECOMMENDATIONS FOR FUTURE ACTION
LIBRARY WIDE RECOMMENDATIONS
1. Given that 64% of all respondents reported that they used non‐library gateways for information on a daily basis, an investigation is made into how the Library can better position its information in the places where users are
2. Given the poor result for Print and/or electronic journal collections I require for my work the information needs of academic staff and postgraduates are more closely investigated
3. The needs of academic staff in relation to Making electronic resources accessible from my home or office requires further investigation
4. That the annual Building and Space Survey data are carefully analysed to identify areas for action
5. As a result of not meeting minimum expectations in Providing ready access to computers/Internet/software and the high number of associated comments priority is given to investigating and improving the key areas highlighted including:
o Numbers of PCs
o Queues and waiting times for PCs
o Access to power points
o Quick access to catalogue information via Express Terminals
o SNAP / wireless connectivity
6. In response to the relatively low mean scores for In general, I am satisfied with library support for my learning, research, and/or teaching needs priority is given to actioning:
o the recently approved UWA Library Information Literacy Directions Statement
o the Library’s Strategic Plan 2008‐2010
7. In order to ensure respondents understand the concept of “trustworthy and untrustworthy information” the Library adopts the language of the Survey across all Information Literacy programmes and refer to “Authoritative and trustworthy sources” when instructing on recognising authoritative sources
8. That an implementation plan is drawn up in order to address these Library wide recommendations

LibQUAL+™ Survey 2007 at The University of Western Australia Analysis of Results
Page 9 of 56
2. Introduction
LibQUAL+™ is a web‐based survey developed by the Association of Research Libraries (ARL). Its purpose is to provide libraries with a standardised, effective method to measure the quality of library services based on the perceptions of students, academic staff and general staff. While a popular survey tool in North America LibQUAL+™ is not used extensively in Australia, although the number of Australian universities using the survey is growing. In addition to UWA nine other Australian libraries have recently used the survey. They are:
• Curtin University of Technology
• Queensland University of Technology
• Royal Melbourne Institute of Technology
• Swinburne University of Technology
• Sydney College of Divinity
• University College, University of New South Wales
• University of Queensland
• University of South Australia
• University of Technology, Sydney
To enable us to assess the quality of our services and identify areas for improvement the UWA Library first used the LibQUAL+™ Survey in 2005. The survey allowed us to:
• understand better how the UWA community rated its library services
• benchmark UWA results against other libraries to determine best practices
• determine where we could concentrate service improvements
Following the analysis of the survey results the Library put in place a program of improvements based on the feedback. A summary of these improvements can be found at:
http://www.library.uwa.edu.au/about_the_uwa_library/feedback_and_surveys/2005_survey/our_response_to_your_feedback
A continued focus on understanding and addressing the needs of readers is a key part of the Library’s strategic direction and to this end the Library chose to repeat the LibQUAL+™ Survey in 2007.
As in 2005 it was useful to compare UWA Library to its benchmarking partner Queen’s University and also their benchmarking partner the Association of Research Libraries (ARL). The Queen’s survey was conducted in 2007 with 1,594 respondents and the ARL Survey was conducted in 2007 with 27,560 respondents from the College and University Libraries sector.
The results of the survey have again provided the Library with a rich source of information about areas of strength and areas which require some improvement. Analysis of the survey results and respondents’ comments have helped the Library to identify specific areas for improvement and/or specific areas where additional service quality information may be needed.

LibQUAL+™ Survey 2007 at The University of Western Australia Analysis of Results
Page 10 of 56
3. Survey Description
The LibQUAL+™ survey (Appendix 1) consisted of 22 core questions and 5 local questions selected by the UWA Library from a list provided by ARL, together with questions regarding information literacy outcomes and general satisfaction.
The core questions were grouped into three dimensions of service:
Affect of Service (AS) ‐ customer services provided by library staff
Information Control (IC) ‐ library resources/collections and access to resources
Library as Place (LP) ‐ library spaces and amenities (i.e. for study, meetings, etc.)
Survey participants were asked to rate each of the 22 core questions and 5 local questions on a scale of 1 to 9 to reflect their:
Minimum expected level of service
Desired level of service
Perceived actual level of service
An NA category was provided for questions that were not applicable to the respondent or those that the respondent did not wish to answer.
The survey gathered demographic data for each respondent:
User Group Undergraduate Postgraduate Academic staff
General staff Library staff
Discipline Group e.g. Engineering, Education, Agriculture, Humanities
Academic Department e.g. Economics and Commerce, Law
Status e.g. Associate professor, 2nd year undergraduate, doctoral student, research staff
Most Used Library Biological Sciences Business Education Fine Arts and Architecture Humanities and Social Sciences Law
Mathematics and Physical Sciences Medical and Dental Music Scholars’ Centre Undergraduate Mathematics and Physical Sciences
As well as answering the survey questions, respondents had the opportunity to make comments on any aspect of the Library they chose.
The analysis of results was provided by ARL in the form of a notebook. The raw data was also provided and this was used to analyse the results by subject library. It remains available for any further analysis which may be required.

LibQUAL+™ Survey 2007 at The University of Western Australia Analysis of Results
Page 11 of 56
4. Scoring
Mean Scores
The scores for each question and group of questions are mean scores from all the completed UWA surveys. Library staff responses were not counted in the aggregated mean scores since the focus was on the users of the Library.
Service Adequacy Gap = Perceived Score – Minimum Score
Service adequacy is an indicator of the extent to which the Library is meeting or exceeding the minimum expectations of its users. A negative adequacy gap indicates that the perceived level of service quality is below the minimum expected level. Higher adequacy gap scores indicate the extent to which the Library exceeds minimum expectations so an adequacy gap of +1.2 is better than an adequacy gap of +0.7.
Service Superiority Gap = Perceived Score – Desired Score
Service superiority is an indicator of the extent to which the Library is exceeding the desired expectations of its users. A positive superiority gap indicates that the perceived level of service quality is above the desired level of service quality. A superiority gap of ‐0.5 is better than a superiority gap of ‐1.0.
A Perceived score below the Minimum score indicates that the service does not meet minimum expectations ‐ a cause for concern. A Perceived score above the Desired score indicates that the service exceeds highest expectations.
Adequacy Gap vs. Superiority Gap
The Adequacy Gap is cited more frequently than the Superiority Gap by most libraries participating in the LibQUAL+™ survey. The Superiority Gap is almost always negative since it measures the difference between the Perceived and Desired or ideal level of service.
Scores + Comments
In addition to providing valuable insights and suggestions for improvements, the open‐ended user comments are an essential component in evaluating survey scores and understanding the reasons behind them. Throughout this report comments have been selected to reflect the range of opinions in a qualitative rather than quantitative way.
Home Libraries
An important LibQUAL+™ feature is the ability to break down the results by each respondent’s home library. References to individual libraries in this report always mean home library.
Benchmarking
Throughout this report perspective on the 2007 UWA results is provided by a comparison with three other sets of results. The first is the set of results from the survey undertaken in 2005 by the University of Western Australia Library. The second is the set of results from the survey undertaken in 2007 by the University’s Canadian benchmarking partner, Queen’s University. The third is the combined set of results for all the members of the Association of Research Libraries (ARL) that undertook the LibQUAL+™ survey in 2007. There were over 200 of these libraries.

LibQUAL+™ Survey 2007 at The University of Western Australia Analysis of Results
Page 12 of 56
Terminology
Within the context of this report:
• Importance has been measured by Minimum Mean
o low minimum mean = low importance
o high minimum mean = high importance
• Performance has been measured by considering the difference between Minimum Mean and Perceived Mean as indicated by the Adequacy Gap
o low positive adequacy gap = perceived mean is close to minimum mean i.e. minimum expectations just met
o high positive adequacy gap = perceived mean is materially higher than minimum expectations i.e. minimum expectations exceeded
o negative adequacy gap = perceived mean is lower than minimum mean i.e. minimum expectations not met

LibQUAL+™ Survey 2007 at The University of Western Australia Analysis of Results
Page 13 of 56
5. Who Completed the UWA Library Survey?
A total of 2,019 completed surveys were submitted by 1,520 undergraduates, 365 postgraduates, 89 academic staff, 30 general staff and 15 Library staff at The University of Western Australia. This represents 10% of all undergraduates, 9% of all postgraduates, 6% of academic staff, and 1.6% of general staff.
Compared to the 2005 survey there were 1,141 fewer responses, however it is quite common for libraries to experience a reduction in response rate the second time they conduct the LibQUAL+ Survey.
Table 4: Respondents by User Group
The respondent profiles for UWA in 2007 remained much the same as in 2005 with a slight increase in the percentage of academic and general staff responding.
LibQUAL+™ Survey 2007 at The University of Western Australia Analysis of Results
Page 14 of 56
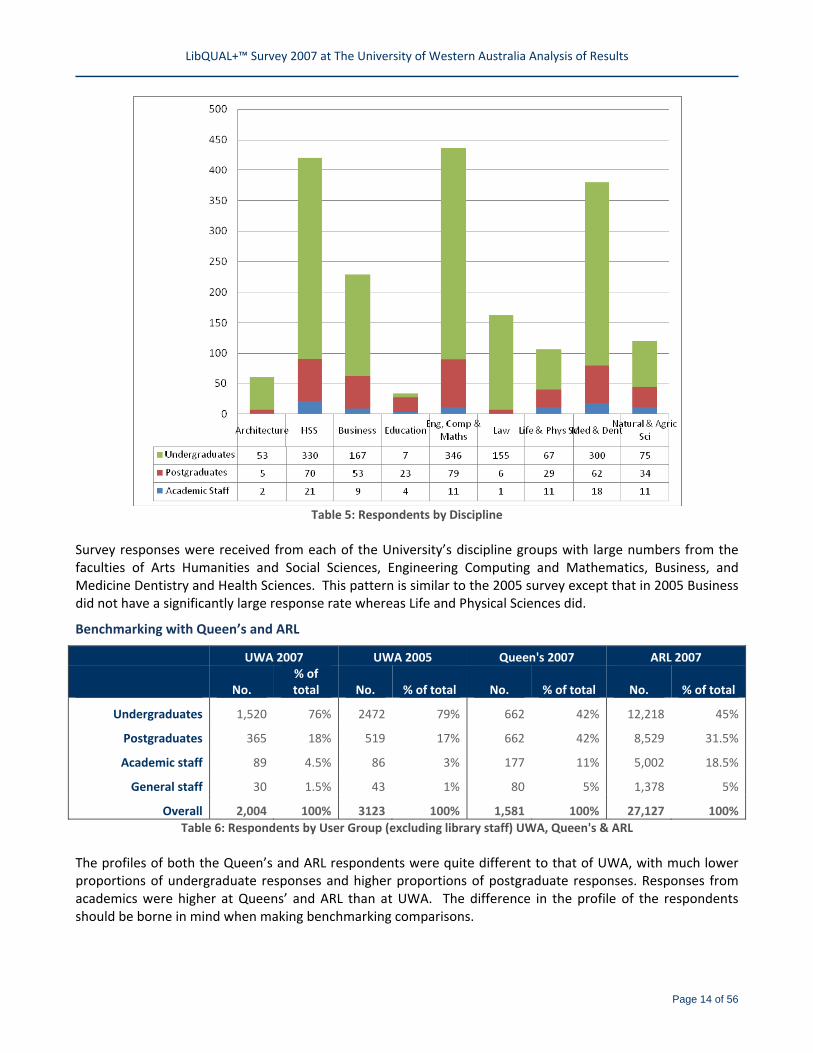
Table 5: Respondents by Discipline
Survey responses were received from each of the University’s discipline groups with large numbers from the faculties of Arts Humanities and Social Sciences, Engineering Computing and Mathematics, Business, and Medicine Dentistry and Health Sciences. This pattern is similar to the 2005 survey except that in 2005 Business did not have a significantly large response rate whereas Life and Physical Sciences did.
Benchmarking with Queen’s and ARL
UWA 2007 UWA 2005 Queen's 2007 ARL 2007
No. % of total No. % of total No. % of total No. % of total
Undergraduates 1,520 76% 2472 79% 662 42% 12,218 45%
Postgraduates 365 18% 519 17% 662 42% 8,529 31.5%
Academic staff 89 4.5% 86 3% 177 11% 5,002 18.5%
General staff 30 1.5% 43 1% 80 5% 1,378 5%
Overall 2,004 100% 3123 100% 1,581 100% 27,127 100% Table 6: Respondents by User Group (excluding library staff) UWA, Queen's & ARL
The profiles of both the Queen’s and ARL respondents were quite different to that of UWA, with much lower proportions of undergraduate responses and higher proportions of postgraduate responses. Responses from academics were higher at Queens’ and ARL than at UWA. The difference in the profile of the respondents should be borne in mind when making benchmarking comparisons.

LibQUAL+™ Survey 2007 at The University of Western Australia Analysis of Results
Page 15 of 56
6. Frequency of Use
Data on frequency of use reflected the different patterns of each user group. The survey asked three questions related to frequency of use.
Question 1 ‐ How often do you use resources within the Library?
Table 7: Frequency of use of resources within the Library by percentage
A large percentage of respondents reported a high frequency of use of resources within the Library. 85% of all undergraduates, 64% of all postgraduates, and 59% of all academic staff who responded to the survey reported that they visited a library at least once a week.
A small percentage of respondents reported that they never use resources within the Library.
Comparison with 2005 Survey Results and Benchmarking with Queen’s and ARL
Overall results for UWA are similar to those reported in 2005. Undergraduates and postgraduates both reported a slight increase in daily visits over the 2005 figures. Daily visits to the Library by academic staff decreased by 7% (26% to 19%). However they also reported an increase in weekly and monthly visits.

LibQUAL+™ Survey 2007 at The University of Western Australia Analysis of Results
Page 16 of 56
How often do you use resources within the library?
UWA 2007 UWA 2005 Queen's 2007 ARL 2007
Daily 33.28% 32.03% 17.84% 16.49%
Weekly 46.21% 46.56% 42.31% 39.39%
Monthly 14.67% 16.30% 26.12% 25.34%
Quarterly 5.04% 4.45% 11.76% 15.45%
Never 0.80% 0.67% 1.96% 3.32% Table 8: Overall frequency of use of resources in the Library by UWA, Queen's & ARL
85% of UWA undergraduate respondents reported that they visited the Library on a daily or weekly basis compared to 68% of undergraduates at Queen’s and 64% at ARL. The 7% decrease in daily visits by academic staff at UWA was also evident at Queen’s (3.95% decrease) and ARL (7.5% decrease).
Question 2 ‐ How often do you access library resources through a library Web page?
Table 9: Frequency of access of Library resources through Library Website by percentage
All respondents indicated that they frequently accessed Library resources through a library Web page. Academic staff were the most frequent users with 95.51% reporting access on a daily or weekly basis. Academic staff also reported higher daily access than any other user group with undergraduates reporting access most frequently on a weekly basis.
LibQUAL+™ Survey 2007 at The University of Western Australia Analysis of Results
Page 17 of 56
Comparison with 2005 Survey Results and Benchmarking with Queen’s and ARL
Overall results for UWA are similar to those reported in 2005. However, a larger percentage of postgraduates (49.59%) reported access on a daily basis compared with 44.89% in 2005.
How often do you access library resources through a library Web page?
UWA 2007 UWA 2005 Queen's 2007 ARL 2007
Daily 37.13% 33.30% 31.84% 28.45%
Weekly 48.50% 50.91% 49.49% 42.68%
Monthly 11.53% 12.81% 14.24% 17.89%
Quarterly 2.50% 2.31% 3.29% 8.00%
Never 0.35% 0.67% 1.14% 2.98% Table 10: Overall frequency of access of Library resources through Library Website by UWA, Queen's & ARL
With the exception of general staff, daily access figures for all UWA user groups ‐ particularly for undergraduates ‐ were higher than for the equivalent groups at ARL and at Queen’s. 33.75% of UWA undergraduate respondents reported daily access in comparison with 13.30% at ARL and 15.41% at Queen’s.
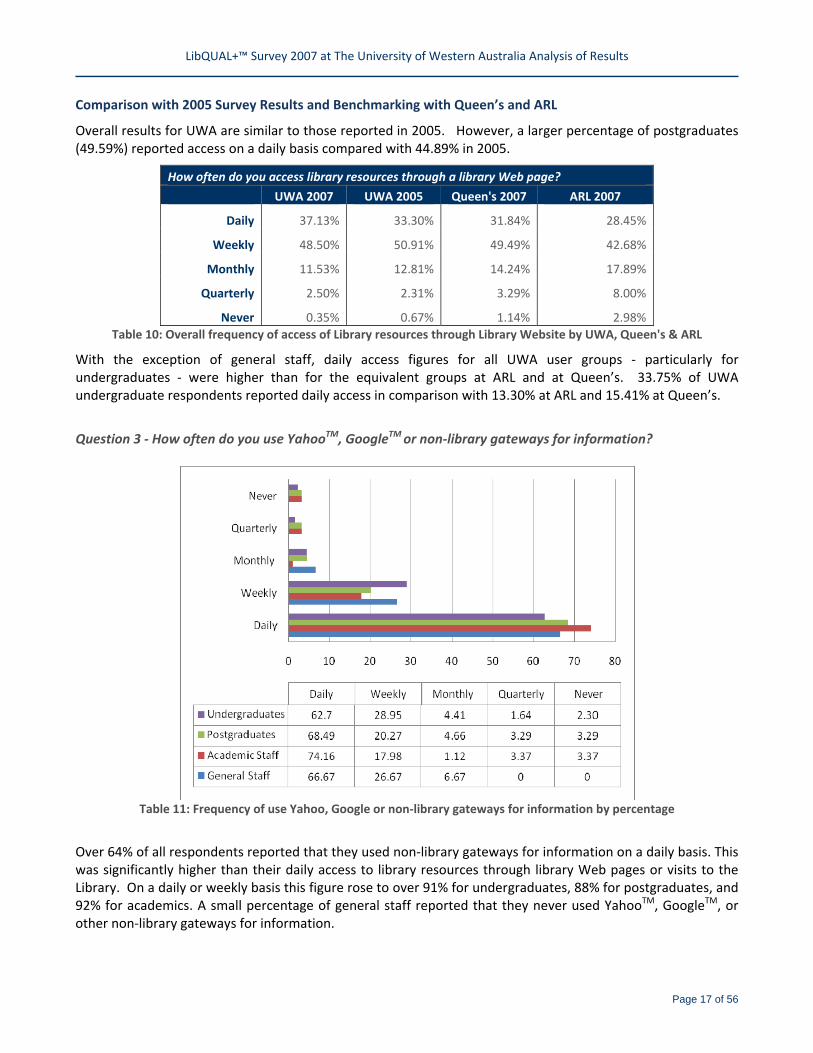
Question 3 ‐ How often do you use YahooTM, GoogleTM or non‐library gateways for information?
Table 11: Frequency of use Yahoo, Google or non‐library gateways for information by percentage
Over 64% of all respondents reported that they used non‐library gateways for information on a daily basis. This was significantly higher than their daily access to library resources through library Web pages or visits to the Library. On a daily or weekly basis this figure rose to over 91% for undergraduates, 88% for postgraduates, and 92% for academics. A small percentage of general staff reported that they never used YahooTM, GoogleTM, or other non‐library gateways for information.

LibQUAL+™ Survey 2007 at The University of Western Australia Analysis of Results
Page 18 of 56
Comparison with 2005 Survey Results and Benchmarking with Queen’s and ARL
Overall results for UWA are similar to those reported in 2005. There was however an increase in daily use of non‐library gateways by academic staff (68.54%, 2005).
How often do you use YahooTM, GoogleTM or non‐library gateways for information?
UWA 2007 UWA 2005 Queen's 2007 ARL 2007
Daily 64.32% 62.47% 74.57% 73.60%
Weekly 26.85% 26.87% 18.34% 18.80%
Monthly 4.34% 6.08% 3.73% 3.99%
Quarterly 2.00% 2.08% 1.71% 1.83%
Never 2.50% 2.50% 1.64% 1.79% Table 12: Overall frequency of use of Yahoo, Google or non‐library gateways for information by UWA, Queen's & ARL
Queen’s and ARL undergraduates and postgraduates were more likely to use YahooTM, GoogleTM or other non‐library gateways on daily basis than their UWA counterparts. The usage patterns for academics and general staff at Queen’s and ARL were similar to those at UWA.
Recommendations
Given that 64% of all respondents reported that they used non‐library gateways for information on a daily basis, an investigation should be made into how the Library can better position its information in the places where our users are

LibQUAL+™ Survey 2007 at The University of Western Australia Analysis of Results
Page 19 of 56
7. Core Questions
The core questions are listed in Appendix 1. The results of the survey indicated that the service dimensions of Affect of Service, Information Control and Library as Place varied in importance for the Library’s different user groups.
Dimension Minimum Mean
(m)
Desired Mean
(d)
Perceived Mean
(p)
Adequacy Gap
(p‐m)
Superiority Gap
(p‐d)
Affect of Service 2007 6.06 7.48 6.87 0.81 ‐0.61
2005 5.89 7.39 6.66 0.78 ‐0.72
Information Control 2007 6.67 8.12 6.96 0.29 ‐1.16
2005 6.56 8.08 7.00 0.44 ‐1.07
Library as Place 2007 6.22 7.77 6.65 0.42 ‐1.12
2005 6.02 7.62 6.66 0.63 ‐0.97 Table 13: Service dimensions overall
The importance placed on all three service dimensions increased overall compared to 2005, as demonstrated by the higher minimum expectations and desired service levels. At the same time performance in Affect of Service improved as indicated by higher adequacy and superiority gaps. While the Library met minimum expectations in all three service dimensions overall, there was no area where desired levels of service were exceeded.
Information Control consistently rated as the most important dimension for all user groups. While Affect of Service was the least important for undergraduates, Library as Place was least important for postgraduates, academics, and general staff.
Comparison with 2005 Survey Results and Benchmarking with Queen’s and ARL
The minimum level of service and desired level of service across all service dimensions have risen since 2005. Only for Affect of Service did respondents report that the Library’s performance had improved.
As in 2005 the smallest adequacy gap was reported for the Information Control dimension. This reflects a continuing perception by respondents that the Library’s performance in this dimension is not as strong as in Affect of Service or Library as Place.

LibQUAL+™ Survey 2007 at The University of Western Australia Analysis of Results
Page 20 of 56
CORE QUESTIONS SUMMARY – comparison with UWA 2005, Queen’s and ARL
User Group
Minimum Mean
(m)
Desired Mean
(d)
Perceived Mean
(p)
Adequacy Gap
(p‐m)
Superiority Gap
(p‐d)
Undergraduates
UWA 2007 6.22 7.76 6.79 0.58 ‐0.96
UWA 2005 6.07 7.67 6.73 0.66 ‐0.94
Queen’s 2007 6.40 7.96 7.05 0.65 ‐0.91
ARL 2007 6.39 7.88 6.96 0.57 ‐0.92
Postgraduates
UWA 2007 6.65 7.88 6.99 0.35 ‐0.89
UWA 2005 6.50 7.83 6.94 0.44 ‐0.88
Queen’s 2007 6.52 7.98 7.13 0.61 ‐0.84
ARL 2007 6.58 7.99 7.01 0.43 ‐0.99
Academic Staff
UWA 2007 6.90 7.98 7.26 0.36 ‐0.72
UWA 2005 6.70 7.82 7.26 0.56 ‐0.56
Queen’s 2007 6.75 7.88 7.31 0.56 ‐0.57
ARL 2007 6.73 7.95 7.05 0.32 ‐0.91
General Staff
UWA 2007 6.69 7.87 7.18 0.49 ‐0.69
UWA 2005 6.81 7.88 7.30 0.49 ‐0.58
Queen’s 2007 6.95 7.97 7.45 0.50 ‐.052
ARL 2007 6.82 7.94 7.15 0.33 ‐0.79
Overall
UWA 2007 6.33 7.79 6.86 0.52 ‐0.94
UWA 2005 6.17 7.70 6.79 0.62 ‐0.91
Queen’s 2007 6.52 7.96 7.13 0.62 ‐0.82
ARL 2007 6.53 7.93 7.00 0.47 ‐0.93 Table 14: Comparison with UWA 2005, Queen’s and ARL
UWA undergraduates reported lower minimum expectations than did their counterparts at Queen’s and ARL. However, a lower perceived mean in comparison with respondents at Queen’s resulted in UWA undergraduates rating their library’s performance as less satisfactory than Queen’s. UWA postgraduates also rated their library as performing less favourably than their Queen’s counterparts – a result equally attributable to higher minimum expectations and lower perceived performance.

LibQUAL+™ Survey 2007 at The University of Western Australia Analysis of Results
Page 21 of 56
Notable points
For all user groups the most important service dimension was Information Control
For all user groups the gap between the desired and perceived levels of service was greater for Information Control than for Affect of Service and Library as Place
The Library’s performance on Information Control has declined.

LibQUAL+™ Survey 2007 at The University of Western Australia Analysis of Results
Page 22 of 56
7.1 Affect of Service
Dimension Minimum Mean
(m)
Desired Mean
(d)
Perceived Mean
(p)
Adequacy Gap
(p‐m)
Superiority Gap
(p‐d)
Affect of Service 2007 6.06 7.48 6.87 0.81 ‐0.61
2005 5.89 7.39 6.66 0.78 ‐0.72
Information Control 2007 6.67 8.12 6.96 0.29 ‐1.16
2005 6.56 8.08 7.00 0.44 ‐1.07
Library as Place 2007 6.22 7.77 6.65 0.42 ‐1.12
2005 6.02 7.62 6.66 0.63 ‐0.97 Table 15: Service dimensions overall highlighting Affect of Service
A full breakdown of Affect of Service core questions by User Group is available in Appendix 2.
Overall the importance of this dimension, as measured by higher reported minimum expectations and higher desired levels of service, has increased since the 2005 survey. This was accompanied by slightly higher adequacy and superiority gaps indicating that the Library is doing better in this dimension than in 2005. Notably Library staff who are consistently courteous was judged by general staff to exceed desired performance providing the only positive superiority gap of the entire survey.
Comparison with 2005 Survey Results
As in 2005:
• All user groups reported that the Library exceeded their minimum expectations for each of the nine Affect of Service items
• Undergraduates reported Readiness to respond to users’ enquiries as the most important item in Affect of Service
• Giving users individual attention was the least important item for undergraduates
• For academic staff Library staff who instill confidence in users was the least important item, followed by Giving users individual attention
• The expectations of both undergraduates and postgraduates were exceeded to the greatest extent for Library staff who instill confidence in users
• The expectations of postgraduates were exceeded to the smallest extent for Library staff who have the knowledge to answer user questions

LibQUAL+™ Survey 2007 at The University of Western Australia Analysis of Results
Page 23 of 56
Unlike in 2005:
• Academic staff reported that their desired performance was no longer exceeded for Library staff who deal with users in a caring fashion
• Academic staff and postgraduates reported Library staff who have the knowledge to answer user questions as the most important item in Affect of Service compared to Readiness to respond to users’ enquiries in 2005
• For both postgraduates and general staff the least important item was Giving users individual attention, compared to Library staff who instill confidence in users in 2005
• The expectations of academic staff were exceeded to the greatest extent for Library staff who instill confidence in users, compared to Library staff who deal with users in a caring fashion in 2005
• The expectations of academic staff were exceeded to the smallest extent for Library staff who understand the needs of their users, compared to Dependability in handling users’ service problems in 2005
• Undergraduates reported the smallest adequacy gaps for Library staff who understand the needs of their users and Dependability in handling users’ service problems (equally), compared to Library staff who have the knowledge to answer user questions in 2005
Respondent satisfaction with Affect of Service was reflected in the 388 comments on service. Of these 322 were positive and 66 negative. A number of comments (14) referred to the unfriendly or begrudging service provided by some staff.
Some comments …
staff are always friendly, and helpful even helping or giving advice sometimes when you didn't know you needed it, but no overly so (Undergraduate, Humanities and Social Sciences Library)
Library staff that I deal with are very supportive and helpful (Staff, Business Library)
You mostly have great helpfully staff. But you do have couple of EXTREMELY unpleasant people working there, which can counteract all the good (Undergraduate, Humanities and Social Sciences Library)
The after hours library have a good helpful attitude but often do not possess the skill level of the regular 9 to 5 staff and this is a little frustrating for students who can only access the library after hours (Postgraduate, Humanities and Social Sciences Library)
LibQUAL+™ Survey 2007 at The University of Western Australia Analysis of Results
Page 24 of 56
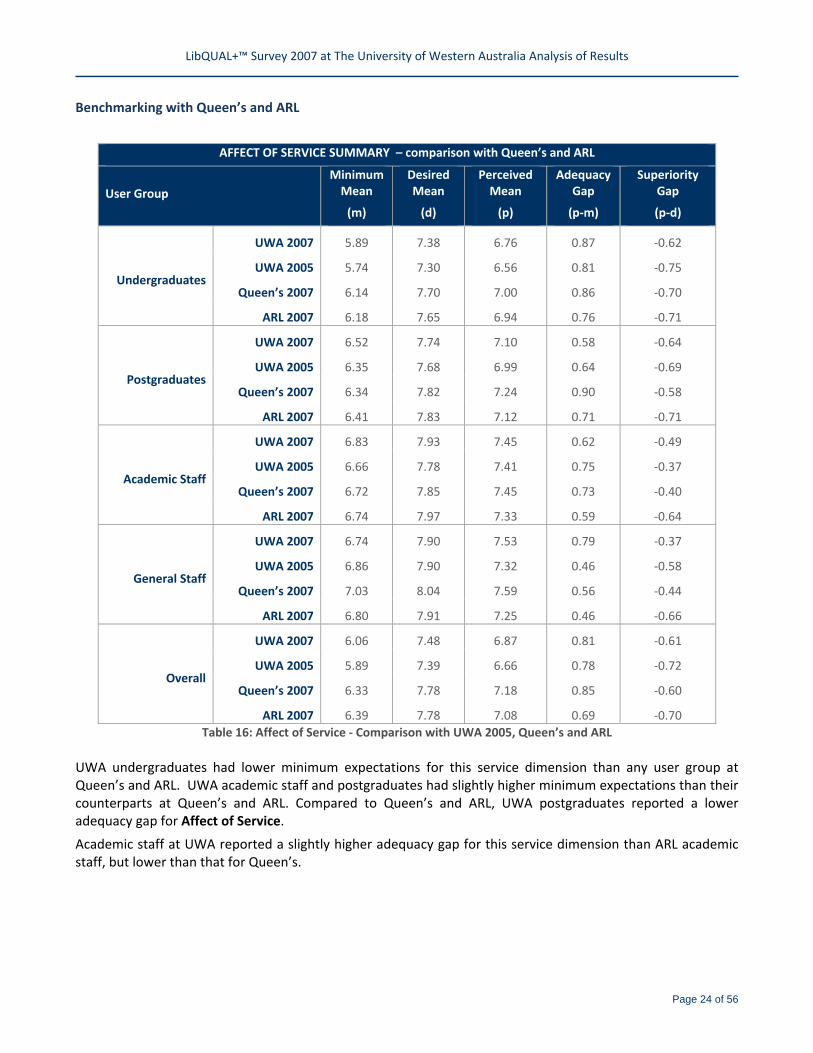
Benchmarking with Queen’s and ARL
AFFECT OF SERVICE SUMMARY – comparison with Queen’s and ARL
User Group Minimum Mean
(m)
Desired Mean
(d)
Perceived Mean
(p)
Adequacy Gap
(p‐m)
Superiority Gap
(p‐d)
Undergraduates
UWA 2007 5.89 7.38 6.76 0.87 ‐0.62
UWA 2005 5.74 7.30 6.56 0.81 ‐0.75
Queen’s 2007 6.14 7.70 7.00 0.86 ‐0.70
ARL 2007 6.18 7.65 6.94 0.76 ‐0.71
Postgraduates
UWA 2007 6.52 7.74 7.10 0.58 ‐0.64
UWA 2005 6.35 7.68 6.99 0.64 ‐0.69
Queen’s 2007 6.34 7.82 7.24 0.90 ‐0.58
ARL 2007 6.41 7.83 7.12 0.71 ‐0.71
Academic Staff
UWA 2007 6.83 7.93 7.45 0.62 ‐0.49
UWA 2005 6.66 7.78 7.41 0.75 ‐0.37
Queen’s 2007 6.72 7.85 7.45 0.73 ‐0.40
ARL 2007 6.74 7.97 7.33 0.59 ‐0.64
General Staff
UWA 2007 6.74 7.90 7.53 0.79 ‐0.37
UWA 2005 6.86 7.90 7.32 0.46 ‐0.58
Queen’s 2007 7.03 8.04 7.59 0.56 ‐0.44
ARL 2007 6.80 7.91 7.25 0.46 ‐0.66
Overall
UWA 2007 6.06 7.48 6.87 0.81 ‐0.61
UWA 2005 5.89 7.39 6.66 0.78 ‐0.72
Queen’s 2007 6.33 7.78 7.18 0.85 ‐0.60
ARL 2007 6.39 7.78 7.08 0.69 ‐0.70 Table 16: Affect of Service ‐ Comparison with UWA 2005, Queen’s and ARL
UWA undergraduates had lower minimum expectations for this service dimension than any user group at Queen’s and ARL. UWA academic staff and postgraduates had slightly higher minimum expectations than their counterparts at Queen’s and ARL. Compared to Queen’s and ARL, UWA postgraduates reported a lower adequacy gap for Affect of Service.
Academic staff at UWA reported a slightly higher adequacy gap for this service dimension than ARL academic staff, but lower than that for Queen’s.
LibQUAL+™ Survey 2007 at The University of Western Australia Analysis of Results
Page 25 of 56
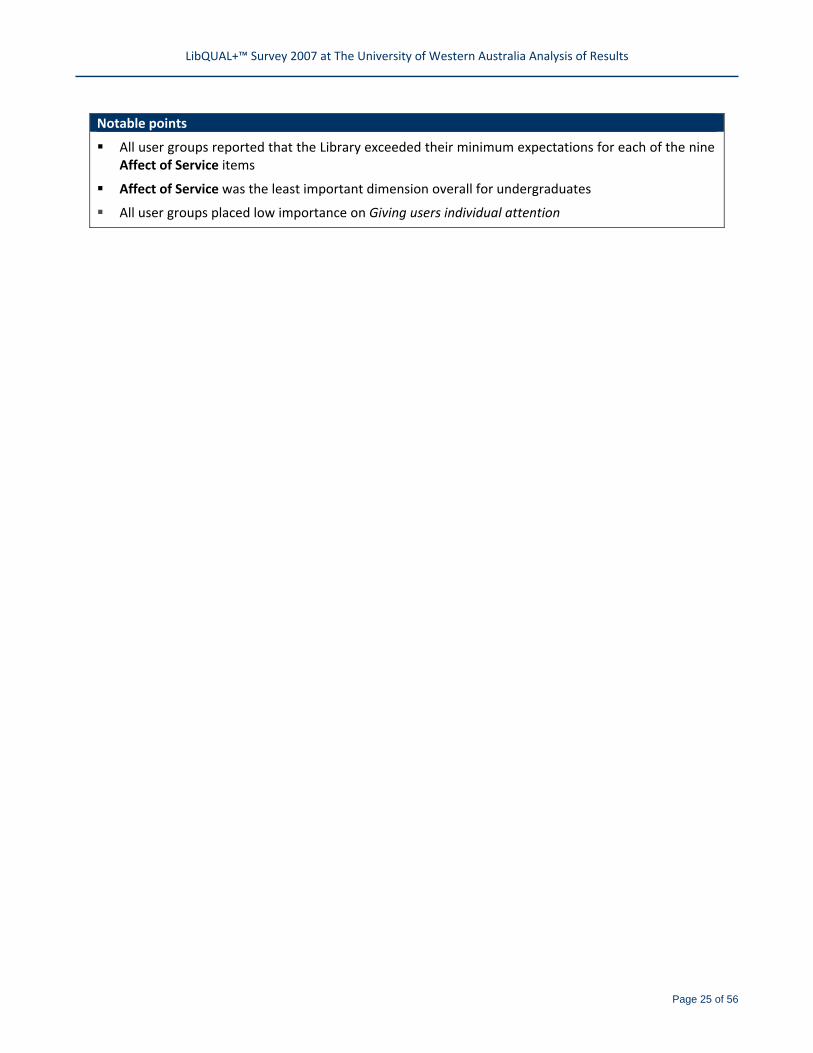
Notable points
All user groups reported that the Library exceeded their minimum expectations for each of the nine Affect of Service items
Affect of Service was the least important dimension overall for undergraduates
All user groups placed low importance on Giving users individual attention

LibQUAL+™ Survey 2007 at The University of Western Australia Analysis of Results
Page 26 of 56
7.2 Information Control
Dimension Minimum Mean
(m)
Desired Mean
(d)
Perceived Mean
(p)
Adequacy Gap
(p‐m)
Superiority Gap
(p‐d)
Affect of Service 2007 6.06 7.48 6.87 0.81 ‐0.61
2005 5.89 7.39 6.66 0.78 ‐0.72
Information Control 2007 6.67 8.12 6.96 0.29 ‐1.16
2005 6.56 8.08 7.00 0.44 ‐1.07
Library as Place 2007 6.22 7.77 6.65 0.42 ‐1.12
2005 6.02 7.62 6.66 0.63 ‐0.97 Table 17: Service dimensions overall highlighting Information Control
A full breakdown of Information Control core questions by User Group is available in Appendix 2.
Information Control was once again the most important service dimension for all user groups. While the importance placed on this dimension increased overall, as demonstrated by the higher minimum expectations and desired service levels, the lower adequacy gap indicates that the Library is doing less well in this dimension compared to 2005. This trend applied to all user groups. The only item for which ratings from all user groups improved compared to 2005 was The printed library materials I need for my work.
Comparison with 2005 Survey Results
As in 2005:
• All groups rated Information Control as the most important service dimension
• Overall the Library exceeded minimum expectations for this service dimension
• The most important item of the 22 core questions for postgraduates was Print and/or electronic journal collections I require for my work, with this group again reporting that the Library failed to meet their minimum expectations
• The minimum expectations of undergraduates for A library Web site enabling me to locate information on my own and Making information easily accessible for independent use were exceeded to the greatest extent
• The printed library materials I need for my work was the least important item in this service dimension for undergraduates, postgraduates and academic staff
LibQUAL+™ Survey 2007 at The University of Western Australia Analysis of Results
Page 27 of 56
Unlike in 2005:
• Academic staff indicated that the Library failed to meet their minimum requirements in 6 of the 8 items in Information Control. Minimum expectations were met only for The printed library materials I need for my work and Modern equipment that lets me easily access needed information. In 2005 only Print and/or electronic journal collections I require for my work failed to meet the minimum expectations of this group
• Making electronic resources accessible from my home or office was the most important item for academic staff, followed closely by Print and/or electronic journal collections I require for my work. In 2005 Print and/or electronic journal collections I require for my work was the most important item for this user group by quite a substantial margin
• Postgraduates indicated that the Library failed to meet minimum expectations for 2 of the 8 items in this service dimension, compared to one in 2005. However ratings improved slightly for Making electronic resources accessible from my home or office, The printed library materials I need for my work, and Making information easily accessible for independent use
• For undergraduates Print and/or electronic journal collections I require for my work was the most important item in this service dimension. In 2005 this group reported that Modern equipment that lets me easily access needed information was the most important item
• General staff reported that their minimum expectations were not met for A library Web site enabling me to locate information on my own. In 2005 minimum expectations of this user group were met for for all items in this service dimension
Respondent interest in the area of Information Control was reflected in the large number of comments received: 90 comments on collections generally, 182 on electronic collections and 48 on print collections. Computer facilities in the Library also prompted feedback, with 148 respondents indicating that more computers are required.
Some comments …
I'd like to see more subscriptions to journals, and to back issues of journals. Especially in the Humanities, often articles pre‐1997 are essential readings too! (Postgraduate, Humanities and Social Sciences Library)
Overall good service but need more electronic resources (Undergraduate, Education, Fine Arts and Architecture Library)
The services provided are in general excellent. However many journal articles I need are not available through the library which is a bit of a disappointment. (Undergraduate, Medical and Dental Library)
Am very happy with library service, the only criticism I have is that scientific journal articles I want are often not available on line (Undergraduate, Biological Sciences Library)
A few more new books would be good to take home ‐ these are usually only found in closed reserve (Undergraduate, Law Library)

LibQUAL+™ Survey 2007 at The University of Western Australia Analysis of Results
Page 28 of 56
Benchmarking with Queen’s and ARL
INFORMATION CONTROL SUMMARY – comparison with Queen’s and ARL
User Group Minimum Mean
(m)
Desired Mean
(d)
Perceived Mean
(p)
Adequacy Gap
(p‐m)
Superiority Gap
(p‐d)
Undergraduates
UWA 2007 6.54 7.38 6.76 0.87 ‐0.62
UWA 2005 6.45 8.02 6.97 0.52 ‐1.06
Queen’s 2007 6.68 8.20 7.08 0.40 ‐1.12
ARL 2007 6.61 8.06 7.08 0.47 ‐0.98
Postgraduates
UWA 2007 7.06 8.28 7.10 0.05 ‐1.18
UWA 2005 6.99 8.30 7.09 0.10 ‐1.21
Queen’s 2007 6.99 8.39 7.14 0.15 ‐1.25
ARL 2007 6.99 8.35 7.15 0.15 ‐1.20
Academic Staff
UWA 2007 7.35 8.42 7.28 ‐0.07 ‐1.15
UWA 2005 7.14 8.28 7.34 0.20 ‐0.94
Queen’s 2007 7.34 8.44 7.22 ‐0.12 ‐1.22
ARL 2007 7.19 8.37 7.06 ‐0.13 ‐1.31
General Staff
UWA 2007 6.80 7.94 7.05 0.24 ‐0.89
UWA 2005 7.10 8.16 7.41 0.30 ‐0.75
Queen’s 2007 7.12 8.15 7.38 0.26 ‐0.77
ARL 2007 7.07 8.19 7.18 0.11 ‐1.01
Overall
UWA 2007 6.67 8.12 6.96 0.29 ‐1.16
UWA 2005 6.56 8.08 7.00 0.44 ‐1.07
Queen’s 2007 6.91 8.31 7.14 0.23 ‐1.17
ARL 2007 6.86 8.22 7.10 0.24 ‐1.11 Table 18: Information Control ‐ Comparison with UWA 2005, Queen’s and ARL
Once again the general pattern of high minimum expectations and large gaps between perceived and desired levels of performance is not unique to UWA and can be seen across the two benchmarked groups.
Compared to Queen’s and ARL, UWA undergraduates and postgraduates reported lower adequacy gaps for Information Control.
In 2007 academic staff at UWA and both benchmarking groups reported that their libraries failed to meet their minimum expectations for this service dimension.

LibQUAL+™ Survey 2007 at The University of Western Australia Analysis of Results
Page 29 of 56
Notable points
Information Control was the most important service dimension for all user groups, and at the same time the one that left most to be desired
The expectations of all user groups have increased since 2005
Academic staff regarded this dimension as more important than did the other user groups, and at the same time reported that the Library failed to meet their minimum requirements for all but two items
While Making electronic resources accessible from my home or office was the most important item for academic staff, the Library failed to meet their minimum expectations
Print and/or electronic journal collections I require for my work was the most important item for postgraduates and the second most important for academic staff, with both groups indicating that the Library failed to meet their minimum expectations
Recommendations
Given the poor result for Print and/or electronic journal collections I require for my work the information needs of academic staff and postgraduates should be more closely investigated
The needs of academic staff in relation to Making electronic resources accessible from my home or office requires further investigation

LibQUAL+™ Survey 2007 at The University of Western Australia Analysis of Results
Page 30 of 56
7.3 Library as Place
Dimension Minimum Mean
(m)
Desired Mean
(d)
Perceived Mean
(p)
Adequacy Gap
(p‐m)
Superiority Gap
(p‐d)
Affect of Service 2007 6.06 7.48 6.87 0.81 ‐0.61
2005 5.89 7.39 6.66 0.78 ‐0.72
Information Control 2007 6.67 8.12 6.96 0.29 ‐1.16
2005 6.56 8.08 7.00 0.44 ‐1.07
Library as Place 2007 6.22 7.77 6.65 0.42 ‐1.12
2005 6.02 7.62 6.66 0.63 ‐0.97 Table 19: Service dimensions overall highlighting Library as Place
A full breakdown of Library as Place core questions by User Group is available in Appendix 2.
While the importance placed on this dimension increased overall, as demonstrated by the higher minimum expectations and desired service levels, the lower adequacy gap indicates that the Library is doing less well in this dimension compared to 2005. The significant gap between perceived performance and desired performance for Library space that inspires study and learning indicates that there is still work to be done in this area.
Comparison with 2005 Survey Results
As in 2005:
• Academics, postgraduates and general staff rated Library as Place as the least important service dimension
• Of the 22 core questions undergraduates, postgraduates and academic staff rated Space for group learning and group study as the least important
• Undergraduates placed a higher value on Library as Place generally than did postgraduates and academic staff
• Undergraduates, postgraduates and academic staff reported that the Library exceeded their minimum expectations on each of the five Library as Place questions
• Undergraduates rated Quiet space for individual work as the most important of the Library as Place items
• Standard deviations tended to be higher for Library as Place than for the other two service dimensions, indicating a wider range of opinions. This may be explained in part by differences in the respondents’ home libraries and further analysis of this is required
Unlike in 2005:
• There were higher minimum expectations for each item in Library as Place for undergraduates, postgraduates and academic staff

LibQUAL+™ Survey 2007 at The University of Western Australia Analysis of Results
Page 31 of 56
Comments
Respondents made 236 comments on space and facilities in the Library. Of these 69 were concerned about group study facilities and 64 about noise in the Library.
Some comments …
I consider the facilities very good.... (Postgraduate, Humanities and Social Sciences Library)
More desks on the second/third floors of the Reid Library would be good, also more power points for laptops are needed (Undergraduate, Humanities and Social Sciences Library)
Overall, a few more couches and comfy reading areas would be great! Some more water fountains as well (Undergraduate, Humanities and Social Sciences Library)
One or two more study group rooms in each library.... would be useful (Undergraduate, Biological Sciences Library)
The desks are great, but if it were possible to include more couches or plush chairs in quiet, secluded locations for individuals that would greatly enhance the pleasantness of long study stints. Otherwise the library is excellent (Undergraduate, Education, Fine Arts and Architecture Library)
The major problem with the library is that there is no quiet working space. Even in the "quiet areas" of the library! When I go there to study I am consistently interrupted by people talking to each other, mobile phone conversations or incredibly loud I‐pods. I'm not really sure how to deal with this problem given that there are always obvious signs etc in the places I'm studying. It drives me crazy! (Postgraduate, Humanities and Social Sciences Library)

LibQUAL+™ Survey 2007 at The University of Western Australia Analysis of Results
Page 32 of 56
Benchmarking with Queen’s and ARL
LIBRARY AS PLACE SUMMARY – comparison with Queen’s and ARL
User Group Minimum Mean
(m)
Desired Mean
(d)
Perceived Mean
(p)
Adequacy Gap
(p‐m)
Superiority Gap
(p‐d)
Undergraduates
UWA 2007 6.25 7.88 6.65 0.40 ‐1.23
UWA 2005 6.05 7.73 6.66 0.61 ‐1.07
Queen’s 2007 6.36 7.99 7.06 0.71 ‐0.92
ARL 2007 6.40 7.96 6.83 0.43 ‐1.14
Postgraduates
UWA 2007 6.13 7.43 6.59 0.46 ‐0.83
UWA 2005 5.93 7.25 6.58 0.66 ‐0.67
Queen’s 2007 5.97 7.51 6.90 0.93 ‐0.61
ARL 2007 6.16 7.67 6.58 0.41 ‐1.10
Academic Staff
UWA 2007 6.20 7.28 6.83 0.63 ‐0.45
UWA 2005 5.75 6.86 6.73 0.98 ‐0.13
Queen’s 2007 5.64 6.85 7.19 1.55 0.34
ARL 2007 5.75 7.05 6.38 0.63 ‐0.67
General Staff
UWA 2007 6.23 7.54 6.57 0.34 ‐0.96
UWA 2005 6.24 7.37 7.06 0.82 ‐0.31
Queen’s 2007 6.48 7.50 7.26 0.78 ‐0.24
ARL 2007 6.34 7.51 6.85 0.51 ‐0.66
Overall
UWA 2007 6.22 7.77 6.65 0.42 ‐1.12
UWA 2005 6.02 7.62 6.66 0.63 ‐0.97
Queen’s 2007 6.12 7.64 7.02 0.89 ‐0.62
ARL 2007 6.22 7.71 6.68 0.46 ‐1.03 Table 20: Library as Place ‐ Comparison with UWA 2005, Queen’s and ARL
In comparison with Queen’s, all user groups at UWA reported lower adequacy gaps for Library as Place. Results overall were similar to those reported by ARL respondents.
Compared to respondents at Queen’s and ARL undergraduates at UWA reported that Library as Place was of less importance to them. However, they also rated the Library’s performance on this dimension as lower than did respondents at Queen’s and ARL.

LibQUAL+™ Survey 2007 at The University of Western Australia Analysis of Results
Page 33 of 56
Notable points
While academics, postgraduates and general staff rated Library as Place as the least important service dimension, expectations of all user groups have increased since 2005
While undergraduates considered Quiet space for individual study as the most important item in this dimension their minimum expectations were barely met
Space for group learning and group study was identified as the least important Library as Place item by undergraduates
Recommendations
The annual Building and Space Survey data should be carefully analysed to identify areas for action

LibQUAL+™ Survey 2007 at The University of Western Australia Analysis of Results
Page 34 of 56
8. Local Questions
The Library selected five optional questions for the 2007 LibQUAL+™ survey from a list provided by ARL. The questions were selected to gauge user perceptions about particular services:
1. Online course support (readings, links, references)*
2. Ready access to computers/Internet software
3. Availability of subject specialist assistance
4. Making me aware of library resources and services
5. Adequate hours of service
*This question was not asked in the 2005 survey as it replaced “Providing me with the information skills I need for my work or study”
LOCAL QUESTIONS SUMMARY
Question
Minimum Mean
(m)
Desired Mean
(d)
Perceived Mean
(p)
Adequacy Gap
(p‐m)
Superiority Gap
(p‐d)
Online course support (readings, links, references)
Undergraduates 2007 6.24 7.97 6.62 0.38 ‐1.36
Postgraduates 2007 6.39 7.72 6.61 0.22 ‐1.11
Academic Staff 2007 6.69 7.80 6.97 0.28 ‐0.84
General Staff 2007 6.58 7.58 6.89 0.32 ‐0.68
Overall 2007 6.28 7.92 6.63 0.35 ‐1.29
Ready access to computers/Internet/software
Undergraduates 2007 6.64 8.25 6.35 ‐0.29 ‐1.90
2005 6.32 8.13 6.19 ‐0.13 ‐1.94
Postgraduates 2007 6.75 7.93 6.68 ‐0.07 ‐1.25
2005 6.39 7.77 6.49 0.10 ‐1.28
Academic Staff 2007 6.36 7.21 6.89 0.53 ‐0.33
2005 6.57 7.80 6.87 0.30 ‐0.92
General Staff 2007 6.83 7.83 6.54 ‐0.29 ‐1.29
2005 6.62 7.59 6.95 0.33 ‐0.64
Overall 2007 6.65 8.15 6.43 ‐0.22 ‐1.72
2005 6.34 8.06 6.27 ‐0.08 ‐1.79

LibQUAL+™ Survey 2007 at The University of Western Australia Analysis of Results
Page 35 of 56
Availability of subject specialist assistance
Undergraduates 2007 5.48 7.04 5.84 0.35 ‐1.20
2005 5.41 7.04 5.78 0.37 ‐1.26
Postgraduates 2007 6.19 7.49 6.40 0.21 ‐1.09
2005 5.91 7.36 6.12 0.22 ‐1.23
Academic Staff 2007 6.43 7.44 6.63 0.20 ‐0.81
2005 6.08 7.27 6.44 0.36 ‐0.83
General Staff 2007 6.77 7.77 6.91 0.14 ‐0.86
2005 6.41 7.38 6.95 0.54 ‐0.43
Overall 2007 5.68 7.15 6.00 0.32 ‐1.16
2005 5.52 7.10 5.87 0.35 ‐1.23
Making me aware of Library resources and services
Undergraduates 2007 5.63 7.15 6.39 0.77 ‐0.75
2005 5.39 6.94 6.26 0.87 ‐0.68
Postgraduates 2007 6.23 7.48 6.54 0.31 ‐0.94
2005 6.03 7.39 6.57 0.54 ‐0.83
Academic Staff 2007 6.59 7.66 6.91 0.32 ‐0.75
2005 6.41 7.52 6.99 0.57 ‐0.53
General Staff 2007 6.26 7.44 6.56 0.30 ‐0.89
2005 6.56 7.49 7.41 0.85 ‐0.07
Overall 2007 5.79 7.23 6.45 0.66 ‐0.79
2005 5.54 7.04 6.35 0.81 ‐0.69
Adequate hours of service
Undergraduates 2007 6.44 8.01 7.14 0.70 ‐0.87
2005 6.51 8.04 6.95 0.44 ‐1.09
Postgraduates 2007 6.81 8.04 7.08 0.26 ‐0.97
2005 6.82 8.09 7.05 0.23 ‐1.04
Academic Staff 2007 6.77 7.84 7.33 0.55 ‐0.52
2005 6.71 7.62 7.26 0.55 ‐0.36
General Staff 2007 6.62 7.66 7.21 0.59 ‐0.45
2005 6.76 7.95 7.73 0.98 ‐0.22
Overall 2007 6.53 8.00 7.14 0.61 ‐0.86
2005 6.57 8.04 6.99 0.41 ‐1.05 Table 21: Local Questions Summary across User Groups

LibQUAL+™ Survey 2007 at The University of Western Australia Analysis of Results
Page 36 of 56
Undergraduates rated Ready access to computers/Internet/software as the most important item in Local Questions and the second most important item in the survey overall. For all user groups, with the exception of academics, respondents reported that the Library did not meet their minimum requirements for this service dimension.
As in 2005, this concern was reflected in the large number of negative comments made about access to computers. They suggested that the key issues are numbers of computers, access to power points, and wireless connection. Some comments noted the improvements the Library has made in this area since 2005.
Adequate hours of service declined in importance for undergraduates compared to 2005, falling from the 4th most important survey item to the 11th most important. Improved performance on this service dimension is explained by the review and extension of opening hours following the 2005 Survey. It remained relatively unimportant to other user groups. However, the number of negative comments about opening hours (95) suggests that for those respondents opening hours continued to be a source of irritation.
Availability of subject specialist assistance and Making me aware of library resources and services were the second and fourth least important service dimensions in the survey overall – a similar result to 2005.
The new item Online course support (readings, links, references) was the tenth most important in the survey overall.
Some comments …
There is always a lack of computers, with long waits (Undergraduate, Business Library)
I find the librarian very helpful if I ever have any problems but find it difficult to find a computer anywhere! Thus I often have to go to Murdoch Uni (where I previously studied) because I know I will get a computer there! (Undergraduate, Medical and Dental Library)
Computer terminals for five minute access ‐ whilst convenient there is a tendency for several individuals lingering whilst one works making me feel as though I should rush and often leave without having found the necessary information. A solution: more terminals. Similarly on the second floor there are only two computers for general use and it becomes frustrating when one has to walk up and down flights of stairs to find a computer simply to check a books call number. (Undergraduate, Humanities and Social Sciences Library)
Also more desks with power points for laptop use, such as on the bottom floor of the law library would be good both in the law library, and in other libraries. They are always the first to be taken, as a large proportion of students use laptops.(Undergraduate, Law Library)
...everything is great, including the numerous powerpoints, SNAP and wired locations provided for laptop usage. (Undergraduate, Medical and Dental Library)
Thank you for installing more plugs in the Reid library so we can plug in our lap‐tops! (Undergraduate, Humanities and Social Sciences Library)
In general I am happy with the libraries at UWA. Any problems that I have with space or lack of computer availability are being dealt with in the construction of a new library. (Undergraduate, Biological Sciences Library)

LibQUAL+™ Survey 2007 at The University of Western Australia Analysis of Results
Page 37 of 56
Notable points
The Library failed to meet the minimum expectations of undergraduates, postgraduates and general staff in relation to Ready access to computers/Internet/software
Respondents have noticed the improvements made in relation to access to computers
While the Library met minimum expectations for Online course support (readings, links, references) there is considerable scope for improvement
Recommendations
That as a result of not meeting minimum expectations in Providing ready access to computers/Internet/software and the high number of associated comments priority is given to investigating and improving the key areas highlighted including:
o Numbers of PCs
o Queues and waiting times for PCs
o Access to power points
o Quick access to catalogue information via Express Terminals
o SNAP / wireless connectivity

LibQUAL+™ Survey 2007 at The University of Western Australia Analysis of Results
Page 38 of 56
9. General Satisfaction Ratings
As a validity check and to gather expressions of more general satisfaction with the Library, respondents were asked to respond to three items:
1. In general, I am satisfied with the way in which I am treated at the library
2. In general, I am satisfied with library support for my learning, research, and/or teaching needs
3. How would you rate the overall quality of the service provided by the library?
General Satisfaction Mean % Satisfied*
Q1 In general I am satisfied with the way in which I am treated in the library
Undergraduates 7.27 96.84%
Postgraduates 7.31 95.89%
Academic Staff 7.55 93.26%
General Staff 7.57 96.55%
Overall 7.29 96.53%
Q2 In general, I am satisfied with library support for my learning, teaching, and/or research
Undergraduates 6.88 95.26%
Postgraduates 6.92 93.42%
Academic Staff 7.17 93.26%
General Staff 7.07 100%
Overall 6.90 94.94%
Q3 How would you rate the overall quality of the service provided by the library
Undergraduates 7.10 97.76%
Postgraduates 7.14 97.81%
Academic Staff 7.36 95.51%
General Staff 7.47 100%
Overall 7.12 97.72% Table 22: General satisfaction across user groups
* % satisfied is percentage of respondents who answered with a 5 or more to the question
As in 2005 satisfaction was measured by the percentage of respondents who answered with a five or more to each of the three general satisfaction questions. Using this measure overall satisfaction with Library services has increased since 2005. It should be noted however that the responses to the more finely grained core questions provide better data on which to base improvement strategies in the Library.

LibQUAL+™ Survey 2007 at The University of Western Australia Analysis of Results
Page 39 of 56
For each item, the ratings of undergraduates and postgraduates were higher than in 2005. While reporting the lowest mean scores for each item, undergraduates were the most satisfied primary user group for the item In general I am satisfied with the way in which I am treated in the library, as measured by the percentage of respondents giving scores of five or more.
Academic staff reported lower mean scores for each item compared with 2005. As measured by the percentage of respondents giving scores of five or more, academic staff were least satisfied with I am satisfied with library support for my learning, research, and/or teaching needs and In general I am satisfied with the way in which I am treated in the library (equally). Postgraduates were also least satisfied with In general, I am satisfied with library support for my learning, research, and/or teaching needs, while undergraduates expressed least satisfaction with How would you rate the overall quality of the service provided by the library?
The Library’s Service Charter target is that “95% of students and staff surveyed are satisfied with Library services”. An analysis of respondents’ individual ratings shows that this was achieved with 97.72% of respondents providing a rating of 5 or more for the item How would you rate the overall quality of the service provided by the library?
Benchmarking with Queen’s and ARL
GENERAL SATISFACTION QUESTIONS SUMMARY – comparison with Queen’s and ARL
QUESTION Mean SD n
UWA
2007
UWA
2005
Queen’s
2007
ARL
2007
UWA
2007
UWA
2005
Queen’s
2007
ARL
2007
UWA
2007
UWA
2005
Queen’s
2007
ARL
2007
In general, I am satisfied with the way in which I am treated at the library
Undergraduates 7.27 7.07 7.51 7.33 1.35 1.45 1.34 1.51 1,520 2,470 662 12,218
Postgraduates 7.31 7.24 7.52 7.45 1.43 1.45 1.34 1.50 365 519 662 8,528
Academic Staff 7.55 7.81 7.74 7.57 1.55 1.19 1.25 1.51 89 89 177 5,006
General Staff 7.57 7.53 7.78 7.44 1.04 1.10 1.12 1.51 30 43 80 1,374
Overall 7.29 7.12 7.56 7.42 1.37 1.44 1.32 1.51 2,004 3,121 1,581 27,126
In general, I am satisfied with library support for my learning, research, and/or teaching needs
Undergraduates 6.88 6.79 7.18 7.03 1.34 1.38 1.41 1.52 1,520 2,472 662 12,218
Postgraduates 6.92 6.87 7.09 7.10 1.44 1.55 1.53 1.59 365 519 662 8,528
Academic Staff 7.17 7.27 7.19 7.04 1.46 1.41 1.73 1.76 89 89 177 5,005
General Staff 7.07 7.35 7.41 7.15 1.01 1.21 1.24 1.56 30 43 80 1,373
Overall 6.90 6.82 7.15 7.06 1.36 1.41 1.49 1.59 2,004 3,123 1,581 27,124
How would you rate the overall quality of the service provided by the library?
Undergraduates 7.10 7.01 7.35 7.17 1.10 1.13 1.14 1.26 1,519 2,472 662 12,216
Postgraduates 7.14 7.13 7.23 7.21 1.14 1.21 1.20 1.33 365 519 662 8,529
Academic Staff 7.36 7.53 7.41 7.29 1.36 1.07 1.24 1.42 89 89 177 5,005
General Staff 7.47 7.53 7.58 7.35 0.82 0.93 1.00 1.29 30 43 80 1,374
Overall 7.12 7.05 7.32 7.21 1.12 1.15 1.17 1.32 2,003 3,123 1,581 27,124 Table 23: General satisfaction questions ‐ Comparison with UWA 2005, Queen’s and ARL

LibQUAL+™ Survey 2007 at The University of Western Australia Analysis of Results
Page 40 of 56
Based on mean scores, UWA respondents were less satisfied overall in 2007 than ARL and Queen’s respondents. However UWA respondents were more satisfied than they were in 2005.
UWA undergraduates, postgraduates and academic staff were less satisfied with the way they were treated in the Library than ARL or Queen’s respondents. However general staff were more satisfied than their ARL equivalents.
UWA undergraduates, postgraduates and general staff were less satisfied with the Library’s performance in In general, I am satisfied with library support for my learning, research, and/or teaching needs than their ARL or Queen’s counterparts. Academic staff were slightly less satisfied than respondents at Queen’s but more satisfied than those at ARL.
All user groups at UWA were less satisfied with the overall quality of service provided by the Library than were Queen’s respondents. Academic staff and general staff were more satisfied than their ARL equivalents.
Overall respondents at UWA, ARL and Queen’s are most satisfied with how they are treated in the library, and least satisfied with library support for learning, research and teaching needs.
Notable points
Overall satisfaction with Library services has increased since 2005
The Library Service Charter target of “95% of students and staff surveyed are satisfied with Library services” was achieved with 97.72% of respondents reporting satisfaction with the overall quality of the service provided by the Library
Academic staff reported lower mean scores in 2007 than in 2005
All user groups reported their lowest mean scores for In general, I am satisfied with library support for my learning, research, and/or teaching needs
Recommendations
Responses from the questions associated with General Satisfaction Ratings are so non‐specific that the Library needs to rely on more specific data, for example other sections of this survey report, the data sourced by the Marketing Research Team, and the annual Building and Space Survey.
LibQUAL+™ Survey 2007 at The University of Western Australia Analysis of Results
Page 41 of 56
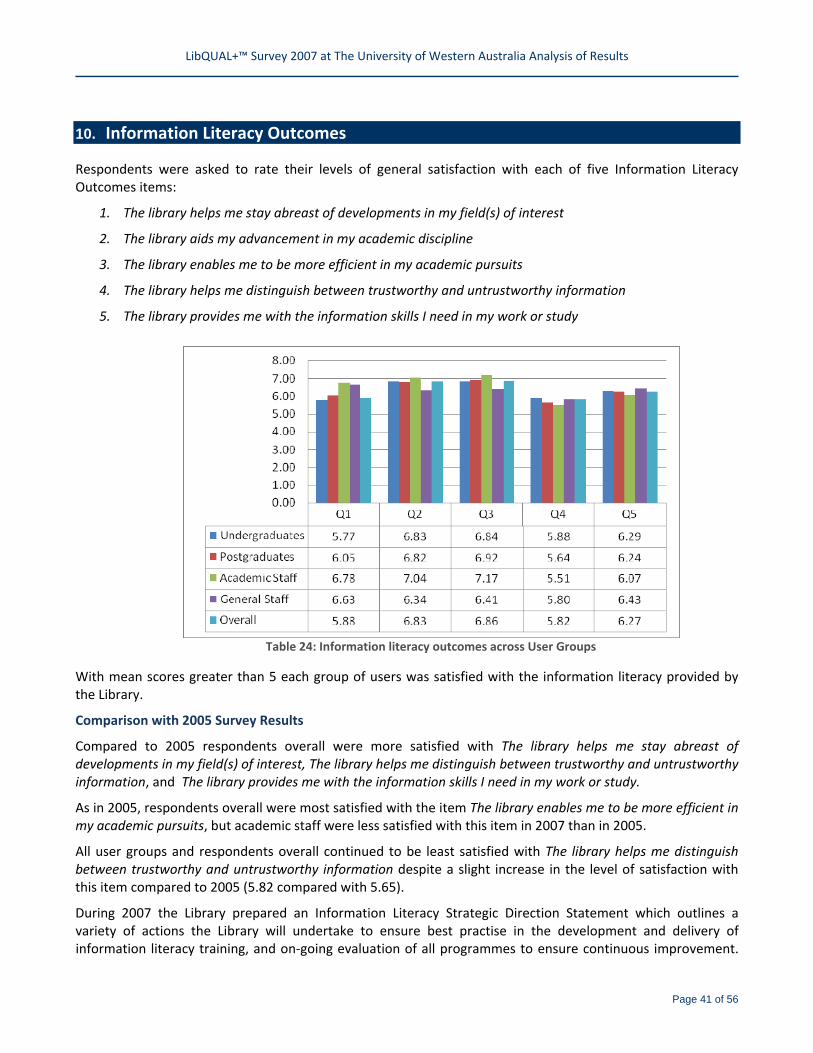
10. Information Literacy Outcomes
Respondents were asked to rate their levels of general satisfaction with each of five Information Literacy Outcomes items:
1. The library helps me stay abreast of developments in my field(s) of interest
2. The library aids my advancement in my academic discipline
3. The library enables me to be more efficient in my academic pursuits
4. The library helps me distinguish between trustworthy and untrustworthy information
5. The library provides me with the information skills I need in my work or study
Table 24: Information literacy outcomes across User Groups
With mean scores greater than 5 each group of users was satisfied with the information literacy provided by the Library.
Comparison with 2005 Survey Results
Compared to 2005 respondents overall were more satisfied with The library helps me stay abreast of developments in my field(s) of interest, The library helps me distinguish between trustworthy and untrustworthy information, and The library provides me with the information skills I need in my work or study.
As in 2005, respondents overall were most satisfied with the item The library enables me to be more efficient in my academic pursuits, but academic staff were less satisfied with this item in 2007 than in 2005.
All user groups and respondents overall continued to be least satisfied with The library helps me distinguish between trustworthy and untrustworthy information despite a slight increase in the level of satisfaction with this item compared to 2005 (5.82 compared with 5.65).
During 2007 the Library prepared an Information Literacy Strategic Direction Statement which outlines a variety of actions the Library will undertake to ensure best practise in the development and delivery of information literacy training, and on‐going evaluation of all programmes to ensure continuous improvement.

LibQUAL+™ Survey 2007 at The University of Western Australia Analysis of Results
Page 42 of 56
The survey result may also be influenced by the terminology of the question and it may be worthwhile for the Library to adopt the language of the survey in referring to “authoritative and trustworthy sources” when instructing on how to recognise authoritative sources.
Benchmarking with Queen’s and ARL
INFORMATION LITERACY OUTCOMES SUMMARY – comparison with Queen’s and ARL QUESTION Mean SD n
UWA 2007
UWA 2005
Queen’s 2007
ARL2007
UWA2007
UWA 2005
Queen’s2007
ARL2007
UWA 2007
UWA 2005
Queen’s2007
ARL2007
The library helps me stay abreast of developments in my field(s) of interest
Undergraduates 5.77 5.72 6.05 6.01 1.49 1.56 1.69 1.76 1,520 2,472 662 12,218
Postgraduates 6.05 6.01 6.02 6.30 1.78 1.84 1.91 1.88 365 519 662 8,529
Academic Staff 6.78 6.16 6.81 6.57 1.88 1.85 1.89 1.99 89 89 177 5,005
General Staff 6.63 6.23 6.83 6.50 1.40 1.52 1.61 1.76 30 43 80 1,372
Overall 5.88 5.78 6.16 6.23 1.58 1.62 1.83 1.85 2,004 3,123 1,581 27,124
The library aids my advancement in my academic discipline
Undergraduates 6.83 6.83 6.87 6.81 1.39 1.39 1.55 1.61 1,520 2,471 662 12,218
Postgraduates 6.82 6.90 7.03 7.12 1.57 1.54 1.56 1.59 365 519 662 8,528
Academic Staff 7.04 6.75 6.99 6.99 1.71 1.61 1.75 1.81 89 89 177 5,003
General Staff 6.34 6.56 6.96 6.78 1.37 1.58 1.50 1.64 29 43 80 1,372
Overall 6.83 6.83 6.96 6.94 1.44 1.43 1.58 1.65 2,003 3,122 1,581 27,121
The library enables me to be more efficient in my academic pursuits
Undergraduates 6.84 6.84 7.07 6.96 1.43 1.40 1.52 1.63 1,520 2,472 662 12,128
Postgraduates 6.92 6.92 6.99 7.13 1.46 1.51 1.57 1.62 365 519 662 8,528
Academic Staff 7.17 7.24 7.14 7.14 1.71 1.34 1.73 1.76 89 89 177 5,003
General Staff 6.41 6.81 7.18 6.96 1.40 1.40 1.50 1.60 29 43 80 1,372
Overall 6.86 6.87 7.05 7.05 1.45 1.42 1.56 1.65 2,003 3,123 1,581 27,121
The library helps me distinguish between trustworthy and untrustworthy information
Undergraduates 5.88 5.69 6.20 6.19 1.75 1.81 1.90 1.88 1,520 2,472 662 12,218
Postgraduates 5.64 5.46 5.71 5.79 1.94 1.93 1.89 1.96 365 519 662 8,529
Academic Staff 5.51 5.49 5.13 5.56 2.27 1.70 1.96 2.13 89 89 177 5,004
General Staff 5.80 5.72 5.70 5.94 1.65 1.59 1.78 1.90 30 43 80 1,372
Overall 5.82 5.65 5.85 5.94 1.81 1.82 1.93 1.97 2,004 3,123 1,581 27,123

LibQUAL+™ Survey 2007 at The University of Western Australia Analysis of Results
Page 43 of 56
The library provides me with the information skills I need in my work or study
Undergraduates 6.29 6.24 6.48 6.43 1.55 1.54 1.63 1.73 1,520 2,472 662 12,218
Postgraduates 6.24 6.14 6.31 6.37 1.74 1.71 1.74 1.82 365 519 662 8,528
Academic Staff 6.07 6.22 6.06 6.10 1.91 1.68 2.01 1.99 89 89 177 5,002
General Staff 6.43 6.56 6.49 6.47 1.61 1.61 1.57 1.79 30 43 80 1,372
Overall 6.27 6.23 6.36 6.35 1.60 1.57 1.72 1.82 2,004 3,123 1,581 27,120 Table 25: Information Literacy Outcomes ‐ Comparison with UWA 2005, Queen’s and ARL
The UWA results for each item were, in general, similar but lower than the results from Queen’s and ARL.
Notable points
Respondents continued to be least satisfied with the extent to which The library helps me distinguish between trustworthy and untrustworthy information
Recommendations
The Library should adopt the language of the Survey in all of its Information Literacy programmes ie “Authoritative and trustworthy sources”
Priority is given to actioning the UWA Library Information Literacy Strategic Direction Statement

LibQUAL+™ Survey 2007 at The University of Western Australia Analysis of Results
Page 44 of 56
11. Comments
In addition to the survey questions respondents were given the opportunity to add free‐text comments. The Library received comments from 927 individuals (46% of all respondents). For ease of analysis the comments were assigned to one of 29 categories. In addition to the 26 categories used in 2005 an additional 3 were added:
• Computers (Performance)
• SuperSearch / FindIt
• Promotion / Marketing
The table below is based on comments by User Group. For comments by Subject Library see the separate report “LibQUAL+™ Survey 2007 The University of Western Australia Library: Analysis of Subject Library Results”.
The top five areas attracting comments overall were:
1. Service (Positive) ‐ 322
2. Collections (Electronic) ‐ 182
3. Computers (More) – 148
4. Space/Buildings (General) – 102
5. Environment (Noise) – 101
Comments
CIRCULATION General Reserve Penalties
Undergraduates 33 68 11
Postgraduates 10 7 5
Academic staff 2 2 0
General staff 2 1 0
TOTAL 47 78 16
COLLECTIONS General Electronic Print
Undergraduates 58 111 31
Postgraduates 25 49 12
Academic staff 4 21 5
General staff 3 1 0
TOTAL 90 182 48

LibQUAL+™ Survey 2007 at The University of Western Australia Analysis of Results
Page 45 of 56
COMPUTERS More Laptops Wireless
Undergraduates 134 20 25
Postgraduates 12 1 4
Academic staff 2 1 1
General staff 0 0 0
TOTAL 148 22 30
COMPUTERS Power Points Performance Internet access
Undergraduates 26 21 35
Postgraduates 1 7 5
Academic staff 0 1 7
General staff 0 0 1
TOTAL 27 29 42
ENVIRONMENT Food/Drink Mobile Phone Noise
Undergraduates 7 10 90
Postgraduates 1 2 8
Academic staff 0 0 2
General staff 0 1 1
TOTAL 8 13 101
SPACE/BUILDINGS General Group Study Quiet Study
Undergraduates 85 73 50
Postgraduates 13 4 4
Academic staff 2 2 0
General staff 2 1 1
TOTAL 102 80 55
OTHER Equipment Photocopying /
Printing/Scanners Web site
Undergraduates 49 46 25
Postgraduates 7 7 14
Academic staff 1 0 2
General staff 1 1 1
TOTAL 58 54 42

LibQUAL+™ Survey 2007 at The University of Western Australia Analysis of Results
Page 46 of 56
OTHER Service (negative) Service (positive) Reference /
Information literacy
Undergraduates 40 216 32
Postgraduates 18 74 20
Academic staff 7 24 2
General staff 1 8 1
TOTAL 66 322 55
OTHER Opening hours ILL / Document delivery SuperSearch / Findit
Undergraduates 77 6 22
Postgraduates 16 16 7
Academic staff 1 7 3
General staff 1 0 1
TOTAL 95 29 33
OTHER LibQUAL survey Promotion / marketing
Undergraduates 13 6
Postgraduates 10 5
Academic staff 1 1
General staff 1 0
TOTAL 25 12
Table 26: Comments by User Group
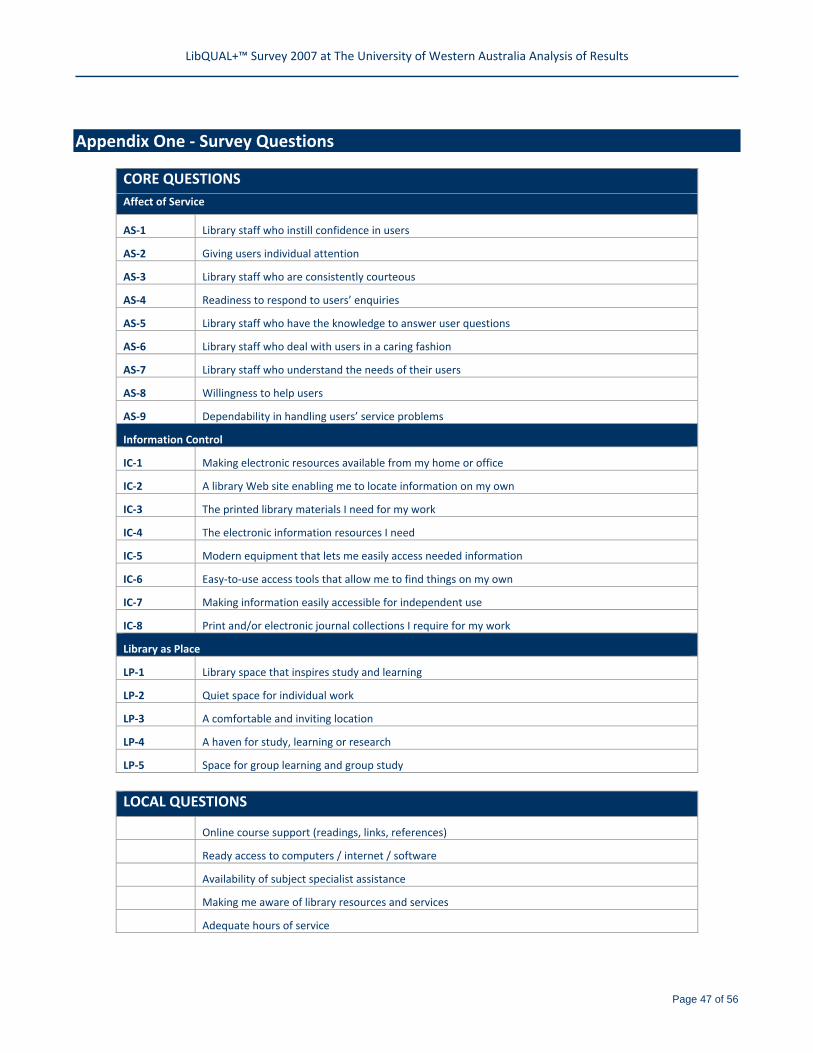
LibQUAL+™ Survey 2007 at The University of Western Australia Analysis of Results
Page 47 of 56
Appendix One ‐ Survey Questions
CORE QUESTIONS Affect of Service
AS‐1 Library staff who instill confidence in users
AS‐2 Giving users individual attention
AS‐3 Library staff who are consistently courteous
AS‐4 Readiness to respond to users’ enquiries
AS‐5 Library staff who have the knowledge to answer user questions
AS‐6 Library staff who deal with users in a caring fashion
AS‐7 Library staff who understand the needs of their users
AS‐8 Willingness to help users
AS‐9 Dependability in handling users’ service problems
Information Control
IC‐1 Making electronic resources available from my home or office
IC‐2 A library Web site enabling me to locate information on my own
IC‐3 The printed library materials I need for my work
IC‐4 The electronic information resources I need
IC‐5 Modern equipment that lets me easily access needed information
IC‐6 Easy‐to‐use access tools that allow me to find things on my own
IC‐7 Making information easily accessible for independent use
IC‐8 Print and/or electronic journal collections I require for my work
Library as Place
LP‐1 Library space that inspires study and learning
LP‐2 Quiet space for individual work
LP‐3 A comfortable and inviting location
LP‐4 A haven for study, learning or research
LP‐5 Space for group learning and group study
LOCAL QUESTIONS
Online course support (readings, links, references)
Ready access to computers / internet / software
Availability of subject specialist assistance
Making me aware of library resources and services
Adequate hours of service

LibQUAL+™ Survey 2007 at The University of Western Australia Analysis of Results
Page 48 of 56
GENERAL SATISFACTION QUESTIONS
In general, I am satisfied with the way in which I am treated at the library
In general, I am satisfied with library support for my learning, research, and/or teaching needs
How would you rate the overall quality of the service provided by the library?
INFORMATION LITERACY OUTCOMES QUESTIONS
IL‐1 The library helps me stay abreast of developments in my field(s) of interest
IL‐2 The library aids my advancement in my academic discipline
IL‐3 The library enables me to be more efficient in my academic pursuits
IL‐4 The library helps me distinguish between trustworthy and untrustworthy information
IL‐5 The library provides me with the information skills I need in my work or study

LibQUAL+™ Survey 2007 at The University of Western Australia Analysis of Results
Page 49 of 56
Appendix Two – Responses to Individual Questions by User Group
Minimum Mean (m)
Desired Mean (d)
Perceived Mean (p)
Adequacy Gap (p‐m)
Superiority Gap (p‐d)
Affect of Service
AS1 Library staff who instill confidence in users
Undergraduates 5.16 7.09 6.24 1.07 ‐0.86
Postgraduates 5.81 7.43 6.61 0.79 ‐0.82
Academic Staff 6.29 7.79 7.14 0.85 ‐0.66
General Staff 6.10 7.72 7.38 1.28 ‐0.34
Overall 5.35 7.20 6.36 1.01 ‐0.83
AS2 Giving users individual attention
Undergraduates 4.87 6.42 5.87 1.00 ‐0.55
Postgraduates 5.75 6.99 6.53 0.78 ‐0.45
Academic Staff 6.38 7.34 6.97 0.58 ‐0.37
General Staff 6.03 7.27 6.97 0.93 ‐0.30
Overall 5.12 6.58 6.06 0.94 ‐0.52
AS3 Library staff who are consistently courteous
Undergraduates 6.17 7.66 7.09 0.91 ‐0.57
Postgraduates 6.88 8.04 7.41 0.53 ‐0.63
Academic Staff 7.10 8.09 7.83 0.73 ‐0.26
General Staff 7.07 8.03 8.07 1.00 0.03
Overall 6.36 7.75 7.19 0.84 ‐0.56
AS4 Readiness to respond to users’ enquiries
Undergraduates 6.42 7.69 7.20 0.78 ‐0.50
Postgraduates 6.93 8.06 7.49 0.56 ‐0.57
Academic Staff 7.14 8.19 7.83 0.69 ‐0.36
General Staff 7.23 8.17 7.87 0.63 ‐0.30
Overall 6.56 7.79 7.29 0.73 ‐0.50
AS5 Library staff who have the knowledge to answer user questions
Undergraduates 6.39 7.73 7.11 0.73 ‐0.61
Postgraduates 6.97 8.02 7.30 0.33 ‐0.72
Academic Staff 7.16 8.18 7.65 0.49 ‐0.53
General Staff 7.07 8.11 7.57 0.50 ‐0.54

LibQUAL+™ Survey 2007 at The University of Western Australia Analysis of Results
Page 50 of 56
Minimum Mean (m)
Desired Mean (d)
Perceived Mean (p)
Adequacy Gap (p‐m)
Superiority Gap (p‐d)
Overall 6.54 7.81 7.18 0.64 ‐0.63
AS6 Library staff who deal with users in a caring fashion
Undergraduates 5.86 7.38 6.86 1.00 ‐0.52
Postgraduates 6.35 7.60 7.09 0.74 ‐0.51
Academic Staff 6.52 7.65 7.32 0.80 ‐0.33
General Staff 6.87 8.13 7.67 0.80 ‐0.47
Overall 6.00 7.45 6.94 0.94 ‐0.51
AS7 Library staff who understand the needs of their users
Undergraduates 5.99 7.36 6.72 0.72 ‐0.64
Postgraduates 6.58 7.81 6.97 0.39 ‐0.83
Academic Staff 6.89 7.97 7.13 0.24 ‐0.84
General Staff 6.93 8.19 7.41 0.48 ‐0.78
Overall 6.16 7.48 6.79 0.64 ‐0.69
AS8 Willingness to help users
Undergraduates 6.08 7.57 6.96 0.88 ‐0.61
Postgraduates 6.73 7.86 7.36 0.63 ‐0.50
Academic Staff 7.04 8.12 7.75 0.71 ‐0.37
General Staff 6.80 8.03 7.73 0.93 ‐0.30
Overall 6.25 7.66 7.08 0.83 ‐0.58
AS9 Dependability in handling users’ service problems
Undergraduates 6.19 7.62 6.92 0.72 ‐0.71
Postgraduates 6.76 7.87 7.14 0.38 ‐0.73
Academic Staff 7.06 8.08 7.52 0.46 ‐0.57
General Staff 6.50 7.67 7.04 0.54 ‐0.63
Overall 6.34 7.69 6.99 0.65 ‐0.70
Information Control
IC1 Making electronic resources available from my home or office
Undergraduates 6.57 8.34 6.88 0.31 ‐1.46
Postgraduates 7.01 8.51 7.20 0.20 ‐1.30
Academic Staff 7.67 8.71 7.56 ‐0.10 ‐1.15
General Staff 6.75 8.07 7.14 0.39 ‐0.93
Overall 6.70 8.38 6.97 0.27 ‐1.41

LibQUAL+™ Survey 2007 at The University of Western Australia Analysis of Results
Page 51 of 56
Minimum Mean (m)
Desired Mean (d)
Perceived Mean (p)
Adequacy Gap (p‐m)
Superiority Gap (p‐d)
IC2 A library Web site enabling me to locate information on my own
Undergraduates 6.59 8.10 7.06 0.47 ‐1.04
Postgraduates 7.19 8.33 7.22 0.03 ‐1.11
Academic Staff 7.47 8.54 7.20 ‐0.27 ‐1.34
General Staff 7.00 8.03 6.76 ‐0.24 ‐1.28
Overall 6.74 8.16 7.09 0.35 ‐1.07
IC3 The printed library materials I need for my work
Undergraduates 6.21 7.67 6.66 0.45 ‐1.00
Postgraduates 6.80 7.92 6.83 0.03 ‐1.09
Academic Staff 6.83 7.86 6.91 0.08 ‐0.95
General Staff 6.88 7.75 7.38 0.50 ‐0.38
Overall 6.35 7.72 6.71 0.36 ‐1.01
IC4 The electronic information resources I need
Undergraduates 6.56 8.13 6.88 0.31 ‐1.25
Postgraduates 7.24 8.40 7.14 ‐0.10 ‐1.26
Academic Staff 7.43 8.57 7.39 ‐0.03 ‐1.18
General Staff 6.92 8.00 7.27 0.35 ‐0.73
Overall 6.73 8.20 6.95 0.22 ‐1.24
IC5 Modern equipment that lets me easily access needed information
Undergraduates 6.61 8.06 7.04 0.42 ‐1.03
Postgraduates 6.91 8.11 7.01 0.10 ‐1.10
Academic Staff 7.05 8.05 7.36 0.31 ‐0.69
General Staff 6.79 7.96 7.11 0.32 ‐0.86
Overall 6.69 8.07 7.05 0.36 ‐1.02
IC6 Easy‐to‐use access tools that allow me to find things on my own
Undergraduates 6.49 8.00 6.89 0.39 ‐1.11
Postgraduates 6.91 8.23 7.03 0.13 ‐1.20
Academic Staff 7.29 8.48 7.22 ‐0.07 ‐1.26
General Staff 6.79 8.14 7.00 0.21 ‐1.14
Overall 6.61 8.07 6.93 0.32 ‐1.13
IC7 Making information easily accessible for independent use
Undergraduates 6.53 8.03 7.01 0.48 ‐1.01
Postgraduates 7.01 8.23 7.21 0.21 ‐1.02

LibQUAL+™ Survey 2007 at The University of Western Australia Analysis of Results
Page 52 of 56
Minimum Mean (m)
Desired Mean (d)
Perceived Mean (p)
Adequacy Gap (p‐m)
Superiority Gap (p‐d)
Academic Staff 7.29 8.37 7.24 ‐0.05 ‐1.12
General Staff 6.93 8.14 7.14 0.21 ‐1.00
Overall 6.66 8.08 7.06 0.40 ‐1.02
IC8 Print and/or electronic journal collections I require for my work
Undergraduates 6.72 8.22 6.84 0.12 ‐1.38
Postgraduates 7.41 8.51 7.10 ‐0.31 ‐1.42
Academic Staff 7.64 8.72 7.22 ‐0.42 ‐1.50
General Staff 6.75 7.88 7.00 0.25 ‐0.88
Overall 6.89 8.29 6.91 0.02 ‐1.39
Library as Place
LP1 Library space that inspires study and learning
Undergraduates 6.07 7.86 6.41 0.34 ‐1.45
Postgraduates 6.00 7.52 6.32 0.32 ‐1.19
Academic Staff 6.16 7.24 6.59 0.43 ‐0.65
General Staff 5.93 7.59 6.41 0.48 ‐1.19
Overall 6.06 7.78 6.40 0.34 ‐1.37
LP2 Quiet space for individual work
Undergraduates 6.75 8.12 6.87 0.12 ‐1.25
Postgraduates 6.61 7.71 6.69 0.07 ‐1.02
Academic Staff 6.17 6.92 6.63 0.45 ‐0.30
General Staff 6.64 7.72 6.64 0.00 ‐1.08
Overall 6.71 8.01 6.83 0.12 ‐1.18
LP3 A comfortable and inviting location
Undergraduates 6.06 7.77 6.84 0.78 ‐0.93
Postgraduates 6.12 7.46 6.72 0.60 ‐0.74
Academic Staff 6.31 7.54 7.12 0.81 ‐0.42
General Staff 6.48 7.69 6.90 0.41 ‐0.79
Overall 6.09 7.70 6.83 0.75 ‐0.87
LP4 A haven for study, learning or research
Undergraduates 6.39 8.06 6.78 0.38 ‐1.28
Postgraduates 6.39 7.74 6.66 0.27 ‐1.08
Academic Staff 6.39 7.42 6.80 0.41 ‐0.62
General Staff 6.67 7.81 6.44 ‐0.22 ‐1.37

LibQUAL+™ Survey 2007 at The University of Western Australia Analysis of Results
Page 53 of 56
Minimum Mean (m)
Desired Mean (d)
Perceived Mean (p)
Adequacy Gap (p‐m)
Superiority Gap (p‐d)
Overall 6.40 7.98 6.75 0.35 ‐1.22
LP5 Space for group learning and group study
Undergraduates 5.96 7.60 6.34 0.38 ‐1.26
Postgraduates 5.49 6.56 6.43 0.94 ‐0.13
Academic Staff 5.32 6.21 6.38 1.06 0.17
General Staff 6.06 6.94 6.00 ‐0.06 ‐0.94
Overall 5.88 7.41 6.35 0.47 ‐1.05
Local Questions
LQ1 Online Course Support (readings, links, references)
Undergraduates 6.24 7.97 6.62 0.38 ‐1.36
Postgraduates 6.39 7.72 6.61 0.22 ‐1.11
Academic Staff 6.69 7.80 6.97 0.28 ‐0.84
General Staff 6.58 7.58 6.89 0.32 ‐0.68
Overall 6.28 7.92 6.63 0.35 ‐1.29 Q2 Ready access to computers / Internet / software
Undergraduates 6.64 8.25 6.35 ‐0.29 ‐1.90
Postgraduates 6.75 7.93 6.68 ‐0.07 ‐1.25
Academic Staff 6.36 7.21 6.89 0.53 ‐0.33
General Staff 6.83 7.83 6.54 ‐0.29 ‐1.29
Overall 6.65 8.15 6.43 ‐0.22 ‐1.72 Q3 Availability of subject specialist assistance
Undergraduates 5.48 7.04 5.84 0.35 ‐1.20
Postgraduates 6.19 7.49 6.40 0.21 ‐1.09
Academic Staff 6.43 7.44 6.63 0.20 ‐0.81
General Staff 6.77 7.77 6.91 0.14 ‐0.86
Overall 5.68 7.15 6.00 0.32 ‐1.16 Q4 Making me aware of library resources and services
Undergraduates 5.63 7.15 6.39 0.77 ‐0.75
Postgraduates 6.23 7.48 6.54 0.31 ‐0.94
Academic Staff 6.59 7.66 6.91 0.32 ‐0.75
General Staff 6.26 7.44 6.56 0.30 ‐0.89
Overall 5.79 7.23 6.45 0.66 ‐0.79 LQ5 Adequate hours of service
Undergraduates 6.44 8.01 7.14 0.70 ‐0.87

LibQUAL+™ Survey 2007 at The University of Western Australia Analysis of Results
Page 54 of 56
Minimum Mean (m)
Desired Mean (d)
Perceived Mean (p)
Adequacy Gap (p‐m)
Superiority Gap (p‐d)
Postgraduates 6.81 8.04 7.08 0.26 ‐0.97
Academic Staff 6.77 7.84 7.33 0.55 ‐0.52
General Staff 6.62 7.66 7.21 0.59 ‐0.45
Overall 6.53 8.00 7.14 0.61 ‐0.86
Information Literacy Outcomes Mean % Satisfied*
Q1 The library helps me stay abreast of developments in my field/s of interest
Undergraduates 5.77 84.47%
Postgraduates 6.05 83.29%
Academic Staff 6.78 89.89%
General Staff 6.63 96.55%
Overall 5.88 84.78%
Q2 The library aids my advancement in my academic discipline or work
Undergraduates 6.83 94.47%
Postgraduates 6.82 91.51%
Academic Staff 7.04 92.13%
General Staff 6.34 96.55%
Overall 6.83 93.90%
Q3 The library enables me to be more efficient in my academic pursuits
Undergraduates 6.84 93.62%
Postgraduates 6.92 94.25%
Academic Staff 7.17 93.26%
General Staff 6.41 96.55%
Overall 6.86 93.80%
Q4 The library helps me distinguish between trustworthy and untrustworthy information
Undergraduates 5.88 79.54%
Postgraduates 5.64 75.62%
Academic Staff 5.51 75.28%
General Staff 5.80 82.76%
Overall 5.82 78.78%
Q5 The library provides me with the information skills I need in my work or study
Undergraduates 6.29 88.29%

LibQUAL+™ Survey 2007 at The University of Western Australia Analysis of Results
Page 55 of 56
Information Literacy Outcomes Mean % Satisfied*
Postgraduates 6.24 85.21%
Academic Staff 6.07 84.27%
General Staff 6.43 89.66%
Overall 6.27 87.65%
* % satisfied is percentage of respondents who answered 5 or more to the question
General Satisfaction Mean % Satisfied*
Q1 In general I am satisfied with the way in which I am treated in the library
Undergraduates 7.27 96.84%
Postgraduates 7.31 95.89%
Academic Staff 7.55 93.26%
General Staff 7.57 96.55%
Overall 7.29 96.53%
Q2 In general, I am satisfied with library support for my learning, teaching, and/or research
Undergraduates 6.88 95.26%
Postgraduates 6.92 93.42%
Academic Staff 7.17 93.26%
General Staff 7.07 100%
Overall 6.90 94.94%
Q3 How would you rate the overall quality of the service provided by the library
Undergraduates 7.10 93.29%
Postgraduates 7.14 97.81%
Academic Staff 7.36 95.51%
General Staff 7.47 100%
Overall 7.12 97.72% * % satisfied is percentage of respondents who answered 5 or more to the question

LibQUAL+™ Survey 2007 at The University of Western Australia Analysis of Results
Page 56 of 56
Appendix Three ‐ Priorities by User Group
Highest Importance (Desired Scores)
[AS = Affect of Service] [LP = Library as Place] [IC = Information Control] [LQ = Local Question]
Dimension Question Score Dimension Question Score
UWA Overall 2007 UWA Overall 2005 IC1 Making electronic resources accessible from my
home or office 8.38 IC1 Making electronic resources accessible from my
home or office 8.30
IC8 Print and/or electronic journal collections I require for my work
8.29 IC8 Print and/or electronic journal collections I require for my work
8.19
IC4 The electronic information resources I need 8.20 IC2 A library Web site enabling me to locate information on my own
8.15
IC2 A library Web site enabling me to locate information on my own
8.16 IC5 Modern equipment that lets me easily access needed information
8.14
LQ2 Ready access to computers/Internet/ software 8.15 IC4 The electronic information resources I need 8.12
UWA Academic Staff 2007 UWA Academic Staff 2005 IC8 Print and/or electronic journal collections I
require for my work 8.72 IC1 Making electronic resources accessible from my
home or office 8.57
IC1 Making electronic resources accessible from my home or office
8.71 IC8 Print and/or electronic journal collections I require for my work
8.50
IC4 The electronic information resources I need 8.57 IC2 A library Web site enabling me to locate information on my own
8.45
IC2 A library Web site enabling me to locate information on my own
8.54 IC4 The electronic information resources I need 8.32
IC6 Easy‐to‐use access tools that allow me to find things on my own
8.48 IC6 Making information easily accessible for independent use
8.27
UWA Postgraduates 2007 UWA Postgraduates 2005 IC8 Print and/or electronic journal collections I
require for my work 8.51 IC8 Print and/or electronic journal collections I
require for my work 8.55
IC1 Making electronic resources accessible from my home or office
8.51 IC1 Making electronic resources accessible from my home or office
8.45
IC4 The electronic information resources I need 8.40 IC4 The electronic information resources I need 8.42 IC2 A library Web site enabling me to locate
information on my own 8.33 IC2 A library Web site enabling me to locate
information on my own 8.39
IC6/7 Easy‐to‐use access tools that allow me to find things on my own / Making information accessible for independent use
8.23 IC5 Modern equipment that lets me easily access needed information
8.24
UWA Undergraduates 2007 UWA Undergraduates 2005 IC1 Making electronic resources accessible from my
home or office 8.34 IC1 Making electronic resources accessible from my
home or office 8.26
LQ2 Ready access to computers/Internet/ software 8.25 LQ1 Modern equipment that lets me easily access needed information
8.13
IC8 Print and/or electronic journal collections I require for my work
8.22 LP3 Ready access to computers/Internet/ software 8.13
IC4 The electronic information resources I need 8.13 IC5 Print and/or electronic journal collections I require for my work
8.20
IC2 Quiet space for individual work 8.12 IC6 A library Web site enabling me to locate information on my own
8.08