
Liberty Township Park Stormwater Demonstration Project
37
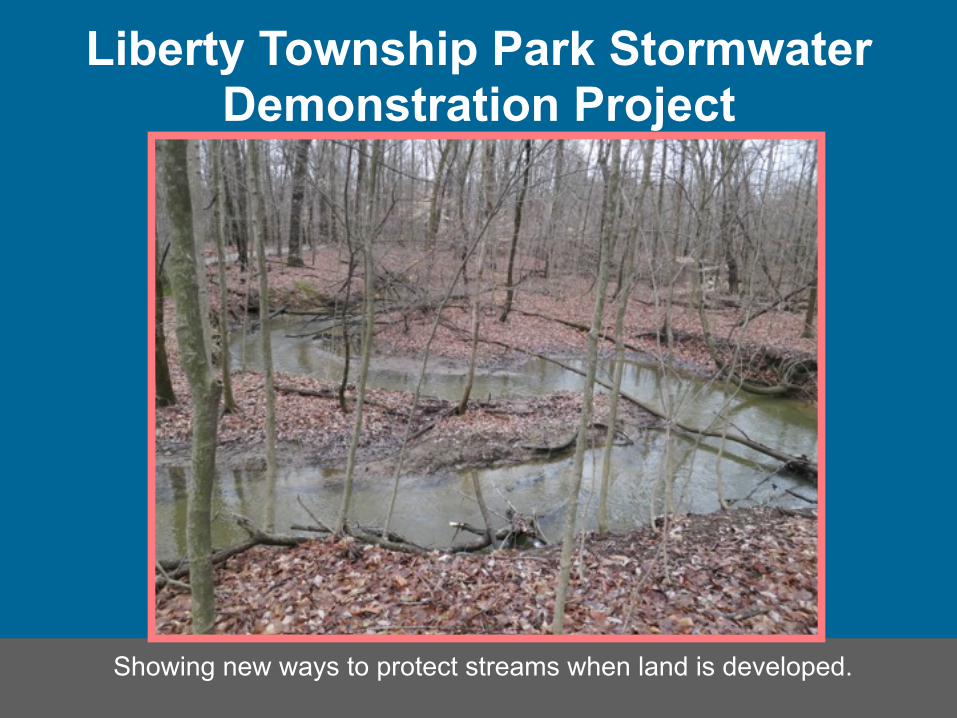
Liberty Township Park Stormwater Demonstration Project Showing new ways to protect streams when land is developed.
Transcript of Liberty Township Park Stormwater Demonstration Project
Liberty Township Park Stormwater Demonstration Project
Showing new ways to protect streams when land is developed.
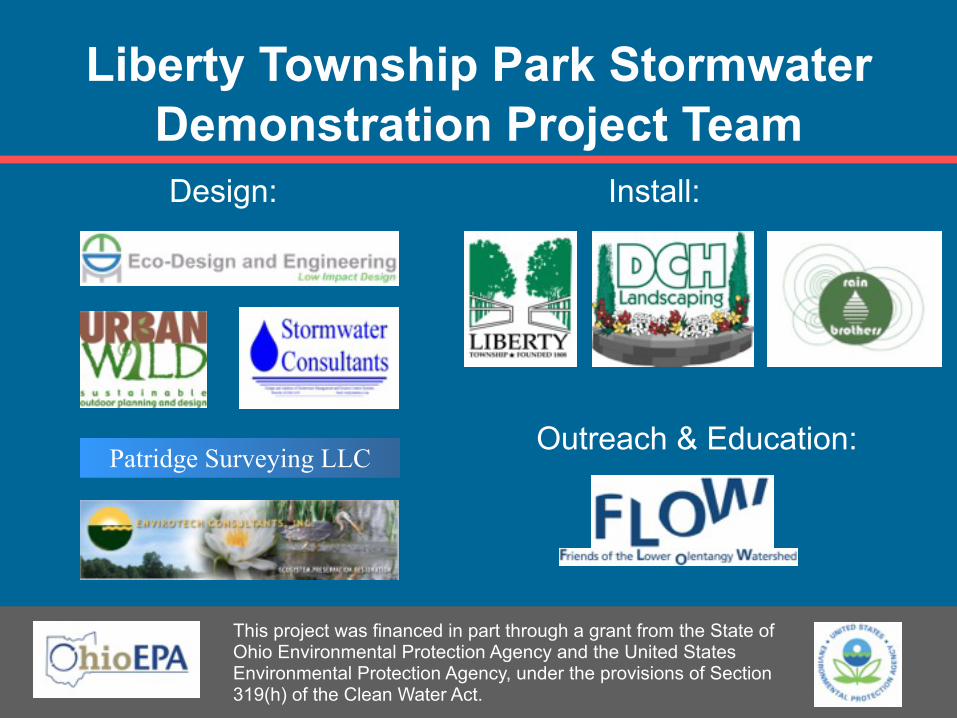
Liberty Township Park Stormwater Demonstration Project Team Design:
This project was financed in part through a grant from the State of Ohio Environmental Protection Agency and the United States Environmental Protection Agency, under the provisions of Section 319(h) of the Clean Water Act.
Patridge Surveying LLC
Install:
Outreach & Education:

Contents
• Background• Project Targets • Design Strategies• Runoff Reduction and Costs• Installation Lessons Learned• Performance Results

Project Site in Delaware
County
• Background Exceptional Warm-Water Habitat (EWH) in Portions of the Olentangy Watershed

Olentangy EWH Fish & BugsFish Banded Darter Black Crappie Black Redhorse Blackstripe Topminnow Bluegill Sunfish Bluntnose Minnow Brindled Madtom Brook Silverside Brown Bullhead Central Stoneroller Channel Catfish Common Carp Fantail Darter Fathead Minnow Flathead Catfish Gizzard Shad Golden- Redhorse Golden Shiner Green Sunfish Greenside Darter Johnny Darter Largemouth Bass Logperch Longear Sunfish Northern Hog Sucker Orangespotted Sunfish Pumpkinseed-Sunfish Quillback Rainbow Darter River Carpsucker River Redhorse Rock Bass Sand Shiner Saugeye Scarlet Shiner Silver Redhorse Silver Shiner Smallmouth Bass Spotfin Shiner Stonecat Madtom Striped Bass White Bass White Crappie White Sucker Yellow Bullhead
Macroinvertebrates (“Bugs”) Alderfly Aquatic worm Asian clam Blackfly Bryozoa Caddisfly Cranefly Crayfish Damselfly Divingbeetles Dobsonfly Dragonfly Fingernail clam Flatworm Gilled SnailIsopod Leech Limpet Mayfly Midge Fly Mosquito Pouch snail Riffle beetle Scud Stonefly Water penny beetle Water scavenger beetle Water scorpion Zebra mussel
Photo: ODNR Division of Wildlife

Water Quality Status Delaware County EWH Area Tributaries

This is what Urbanization looks like.
EWH Lower Olentangy 1988 EWH Lower Olentangy 2013

Rapidly Changing Land Use
• The population of Liberty Township grew 385% from 1990 to 2010
• From 1991 to 2006, over 23,400 acres of Delaware County woodlands were lost during land development …a 46% decrease in forest cover.

How Does This Alter Area Hydrology?
Model Based on ‘Hydrologic Atlas of Ohio’ and ‘Ohio’s Water Budget’ - ODNR

34% increase in Public & Industrial Groundwater
Withdrawals over 18 yearsBillions of Gallons/Year
Annual Streamflow at Worthington (cfs) 2010 trend is 34% higher than predicted
Predicted flow = % of precipitation over net area (497 sq mi at Worthington less 393 sq mi Below Dam= 104 sq mi) Actual net flow = cfs at Worthington less cfs Below Dam
Public/Industrial Withdrawals (Billion Gallons, total above
Worthington gage)
Observation Well Water Level (Feet)
Groundwater Situation

The Cummulative Impact of Land Development Significantly Altered the
Hydrology in Delaware County

Increased Flooding: After upstream development, flooding frequency increased from about 1 to about 5 times a year on Wildcat Run.
Evidence of More and Faster Stormwater Runoff in Streams near the Project Site
Less Groundwater Recharge & Base Flow: Longtime resident notices changes in river
vegetation…more shallow water plants.
Accelerated Streambank Erosion: A ‘blow-out’ in
this natural pipe impairs stream function and clogs
stream with sediment.

Is detention and draw-down the only and best treatment practice for frequently occurring small storms?
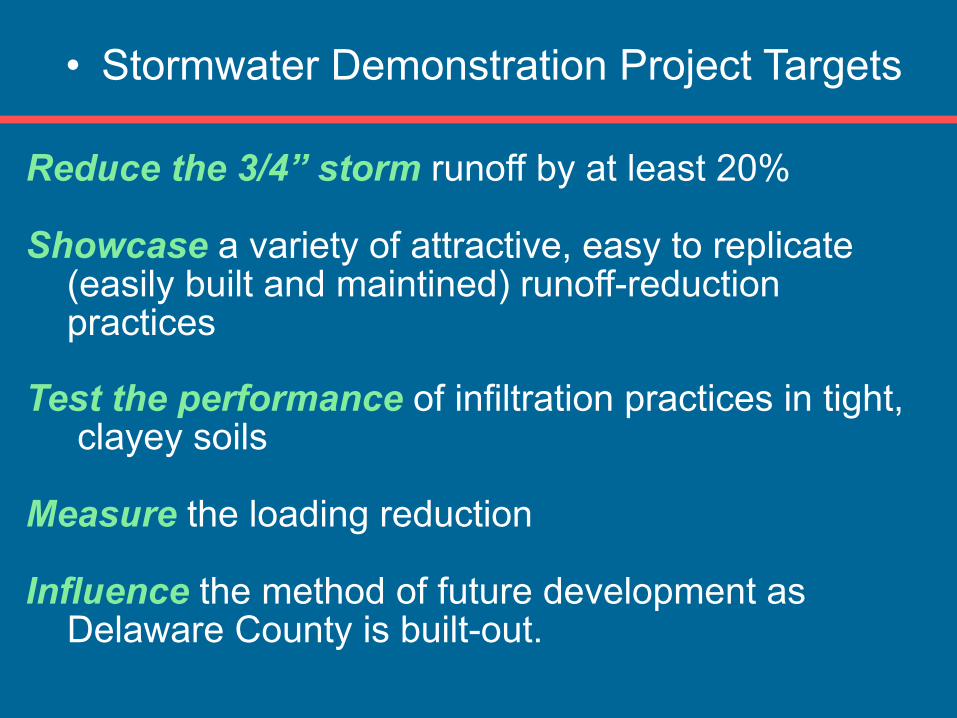
• Stormwater Demonstration Project Targets
Reduce the 3/4” storm runoff by at least 20%
Showcase a variety of attractive, easy to replicate (easily built and maintined) runoff-reduction practices
Test the performance of infiltration practices in tight, clayey soils
Measure the loading reduction
Influence the method of future development as Delaware County is built-out.
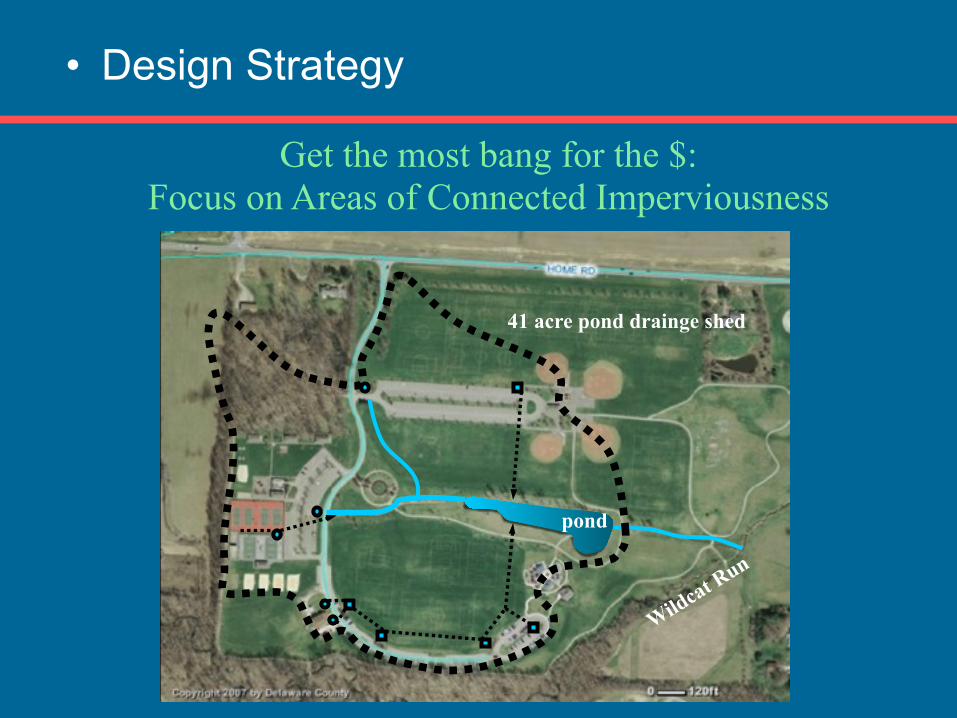
• Design Strategy
Get the most bang for the $: Focus on Areas of Connected Imperviousness
pond
Wildcat Run
41 acre pond drainge shed

14.9 selected acres (36% of 41 acre drainage area) generates 50% of the 3/4” event runoff.
Focus Area Study...

AREA 1: Runoff Reduction and Costs

AREA 1: Design Features
Treatment Trains: Trench underdrains to…. Sedge Meadow Bio-Retention …... or to No-Mow Grass Infiltration Basin
Stand-Pipe Promotes InfiltrationMowable Infiltration Trench.

AREA 1: Lessons Learned
Smeared vs Scratched. Digging method = Infiltration Rate
Planned vs Actual ExcavationCross-section = Runoff Volume
Public access needed during seed germination. Unplanned $1,300 carved into plant budget.

AREA 1: Lessons Learned
6:45pm 9:00am
Rain delays are an opportunity to check performance.
Infiltration is OK. But….
…this basin has a low spot. Level basin = Improved reliabilityand Infiltration volume.
Simple string and line level usedfor the next basin.

AREAs 2-5: Runoff Reduction and Costs

AREAs 2-5: Design Features
Ballcourt Infiltration Trench underdrains to bottom of ‘Stormwater Planter’. Limestone-like wall units
chosen for easy installation.

AREAs 2-5: Design FeaturesBefore: Drainage Pattern
After: 4’ Wide Pervious Concrete Strips Underdrain to Parking Lot Bio-Retention. Trees placed at lower grade to access stored water.

AREAs 2-5: Lessons Learned
Existing blacktop broke during sawcut at 6” gap to curb.Pervious concrete roller loaned by OCA.
Concrete truck can buckle cut asphalt edge.
December concrete pour….blankets for proper cure.

AREAs 2-5: Lessons Learned
Sediment clogs pervious concrete: bio-retention basin earthwork was sequenced after pervious concrete installation.
Purchased one of these …hope it works!

AREAs 6-10: Runoff Reduction and Costs
6
7
9810

AREAs 6: Rain Tank & Rain Garden
Residential Style Rain Garden with Native Trees and Shrubs.
Rain Tank overflows overland to Rain Garden. Feeds drip irrigation for continual use.

6:45pm 9:00am
Infiltration can work in tight, clay soil!
Scrape. Don’t smear.
AREAs 6-10: Lessons Learned
For ~6” depth: remove 12”, add 4” compost, till and till.

AREAs 7-9: Bio-Retention Basin Design
Sediment Trap built using Dimensional Rock-Steps
12” Standpipe in catch basin increases treatment volume
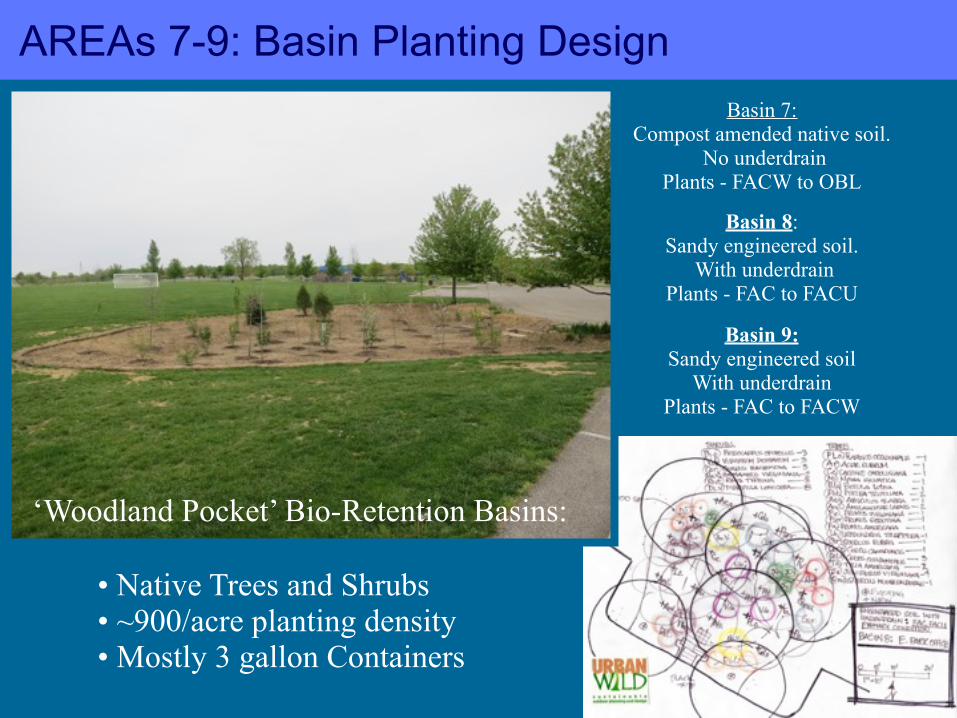
AREAs 7-9: Basin Planting Design
‘Woodland Pocket’ Bio-Retention Basins:
• Native Trees and Shrubs• ~900/acre planting density• Mostly 3 gallon Containers
Basin 7:Compost amended native soil.
No underdrainPlants - FACW to OBL
Basin 8:Sandy engineered soil.
With underdrainPlants - FAC to FACU
Basin 9:Sandy engineered soil
With underdrainPlants - FAC to FACW

AREAs 7-9: Lessons Learned
Compaction & Smoothing = Infiltration loss
Plan sediment control (winter work stop)
Include Inspection & Maintenance Budget

AREAs 10: Permeable Pavers and Basin
BeforeNearly Complete. Pending: Seed with No-Mow Fescue
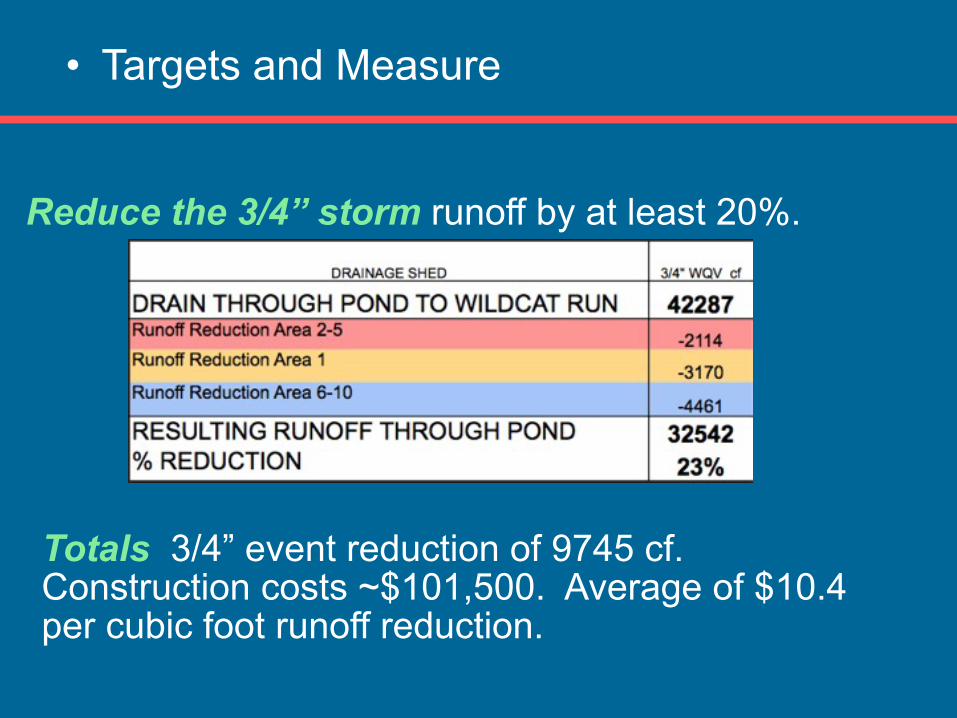
• Targets and Measure
Reduce the 3/4” storm runoff by at least 20%.
Totals 3/4” event reduction of 9745 cf. Construction costs ~$101,500. Average of $10.4 per cubic foot runoff reduction.

• Targets and Measure
Measure the loading reduction…OEPA chemical sampling at pond effluent. Install June, 2012 - April, 2013. No conclusions yet.
TSS mg/L Phosphorus mg/L Total N mg/L

Outreach and Education Potential


Reduce Stormwater Runoff = Clean Streams


